Article

Comparative Study of Wheel–Rail Contact Impact Force for Jointed Rail and Continuous Welded Rail on Light-Rail Transit

1
Department of Construction Engineering, Dongyang University, No. 145 Dongyangdae-ro, Pugggi-eup, Yeongju-si, Gyeongsangbuk-do 36040, Korea
2
Technical Director, SAM DONG LAND CO. LTD, 3rd Floor, 23, Samseong-ro 96-gil, Gangnam-gu, Seoul 06167, Korea
3
Department of Architectural Engineering, Gachon University, 1342 Seongnamdaero, Sujeong-gu, Seongnam-si, Gyeonggi-do 13120, Korea
*
Author to whom correspondence should be addressed.
Appl. Sci. 2020, 10(7), 2299; https://doi.org/10.3390/app10072299
Submission received: 5 March 2020 / Revised: 25 March 2020 / Accepted: 26 March 2020 / Published: 27 March 2020
(This article belongs to the Special Issue Advances on Structural Engineering)

Abstract

:
In this study, the measured track impact factor induced by the wheel–rail contact impact force of each test section (two continuous welded rails on slab tracks and rail joint on a ballasted track) was compared with the design track impact factor under service conditions of a curved light-rail transit system. The measured track impact factor (TIF) was estimated from the measured dynamic wheel load and vertical rail displacement at each test section. In the case of the rail joint section, the rail joint was found to directly affect the track impact factor. Moreover, the dynamic wheel load fluctuation and vertical rail displacement were found to be significantly greater than those of the continuous welded rails (CWRs) on slab tracks. In addition, vertical rail displacements were measured by field measurement and finite element analysis (FEA) was conducted to simulate dynamic wheel load on the jointed rail. Using the field measurements, the rate of dynamic wheel load fluctuation and the TIF were calculated for the CWR and rail joint sections. Subsequently, the calculated TIF values were analytically validated through a comparison with the measured vertical rail displacement, the results of FEA, and the designed TIF for rail joints and CWRs. Finally, the TIF measured by field measurement was compared with the result predicted by FEA. The difference between the results of field measurements and FEA for vertical rail displacement was within approximately 4%.

1. Introduction

The track structure of a light-rail transit system is designed to pass through a city center or connect with other transportation systems both inside and outside a city. Light-rail transit is a form of urban rail transit using rolling stock similar to a tram, but operating at a higher capacity, speed, and often on an exclusive right-of-way. Urban railway is a type of local rail system providing passenger service within and around an urban area. Light-rail systems are characterized by weaker track conditions than a typical urban railway. The Korean light-rail system is built around a city center that has already been formed, making it difficult to secure large areas of land such as for a vehicle base. The form of the vehicle base is thus constructed as a steep curve; nevertheless, as it is the main track rather than the vehicle base, it is constructed as a ballasted track rather than a slab track. Similarly, because it is a vehicle base, joint rails are applied and not CWR. In fact, Korean light-rail vehicle bases frequently undergo rail joint repairs. Moreover, the track geometries of not only the main track, but also station tracks, subsidiary main tracks, and side tracks often consist of multiple segments with sharp curves owing to a typical lack of available land in the city center. Figure 1 shows the typical damage of a rail joint connected to a joint plate without rail welding. As a typical mechanism of rail joint damage, misalignment occurs during train operation at the end of the two rails in contact with each other and manifests in the form of pressing and breakage in Figure 1. Rail joints are divided into suspended joints in which the rail joint is positioned between two sleepers and supported joints, which are positioned directly above the sleeper [1]. The upper photograph in Figure 1 shows a suspended joint and the lower photograph shows a supported joint. In the case of load in the area of the joint, the bending lines of both rails are not continuous, but form an angle [1]. The wheels have to overcome this angle and, therefore, exert an impact on the accepting rail [1]. This study measured the typical defects by rail joint type of supported joint. On the basis of this study, even for a vehicle base rather than a main track, we applied the design condition (impact factor) considering the rail joint impact in the design of rail joints for vehicle base installations, with the hope that the new research results for reinforcing rail joints can be applied in the field.
The rail joint is a necessary component in track system. As the rail joints have low rigidity and strength compared with the rail centers, local settlement occurs. Further, the impact of a vehicle is generated to reduce the ride comfort and increase the maintenance. Damage can occur in the wheels and jointed rail ends when a train passes over discontinuity gaps in the rail joints, which can impact the rail, rail fastening system, sleeper, and even the ballast (Figure 1). This phenomenon represents a disadvantage of the entire track system as it easily subjects the trains to impacts or vibrations, reduces passenger comfort, and requires considerable manpower and expenditure for track and wheel maintenance [2].
In terms of rail joint types, most recent railways use continuous welded rails (CWRs), which comprise several long or short rails welded together. In conventional CWRs, fishplates are employed around the rail joint to connect the web of the adjacent rail by bolts, thereby removing the discontinuity gap in the jointed rail and significantly reducing impact and noise during train operation.
A substantial amount of research both in Korea and abroad has focused on improving rail joints in order to mitigate rail joint impacts. Dynamic wheel–rail forces are generated when a vehicle is subjected to dynamic motions, primarily owing to track irregularities and changes in the track geometry. Geometrical track irregularities, unsprung and sprung masses of vehicle, track stiffness, damping variations in track flexibility, wheel flats, and corrugations on wheels and rails generate dynamic forces on the tracks [2,3]. For example, Lim et al. conducted an analytical study and proposed a method to limit sleeper displacement in the movable section of newly constructed joints to a set value [4]. In addition, Zong et al. proposed a dynamic wheel–rail contact impact modeling method for the determination of impact loads. Their results demonstrated that the free edge of the joint gap draws significant residual stress concentration at the top corner of the end of the railhead, resulting in early material failure at the joint [5]. Mandal and Peach presented limited measurements as analysis and simulations were carried out instead to address mechanical failure, such as failure of the joint bar, joint looseness, and height mismatch of insulated rail joints. From their results, it is known that there is a small reduction in the stress encountered by the rail when joined by bars with an increased moment of inertia [6]. Pombo and Ambrósio proposed a wheel–rail contact model with small-radius curved tracks [7], whereas Sugiyama et al. compared the steady-state lateral force of small-radius curved tracks through track tests and simulations [8]. Wen et al. [9] used finite element analysis simulations to determine the effects of the impact of wheel–rail contact at the rail joint on the axle load, the effect of train speed on dynamic vertical forces, and the distributions of railhead stress and strain. Sharma and Kumar conducted a dynamic analysis of wheel–rail contact and confirmed that the pressure distribution was affected by the rolling distance under various track curvatures [10]. In addition, the wheel–rail impact contact of the insulation rail joint has been simulated through numerical analysis [11]. Choi and Kim studied the impact on the bearings that support the track girder. They performed field measurements and numerical analysis to analyze the characteristics of the structural behavior of a track installed on the Yeongjong Grand Bridge based on the type of bearings and that of the bearings themselves [12]. Raymond found that hardened tracks have smaller differential settlements and cause a lower track impact effect than softer tracks [13]. Selig and Waters found that the subgrade is the important component of the substructure, and it affects track stiffness greatly [14]. Liang and Zhu found the higher deformation and instability of the track structure including the ballast occurring by the reduction of subgrade stiffness [15]. Thus, the majority of the previous studies have analyzed the behavior of main line tracks or the service life of CWRs, which are characterized by a relatively lower track impact during train operation. However, to enter the tracks of the main line, all trains must travel on tracks that have not been converted to CWRs and that contain many rail joints, which include the vehicle base, station tracks, side tracks, and subsidiary main tracks. Therefore, the importance of specifically analyzing the behavior of rail joints cannot be overlooked. The track impact factor (TIF) is a theoretical index used in the track design, which can vary owing to various complex factors such as the structural characteristics of the track, track support stiffness, characteristics of the vehicle, running speed, rail surface roughness, and track irregularity. In this paper, an experimental study of the TIF is discussed. In the “Field Measurement” section, the dynamic wheel–rail contact impact forces are investigated and discussed with the TIF of the rail joint and CWRs. The field measurements were performed using operational trains on different track types such as CWRs of concrete slab tracks in the main line and rail joints of ballasted tracks in the vehicle base. Using these measurements, the rate of dynamic wheel load fluctuation and the TIF were calculated for the CWR and rail joint sections. Subsequently, the calculated TIF values were analytically validated through a comparison with the measured vertical rail displacement, finite element analysis (FEA), and the designed TIF for rail joints and CWRs. Finally, the TIF measured by field measurement was compared with the result predicted by FEA.

2. Field Measurement

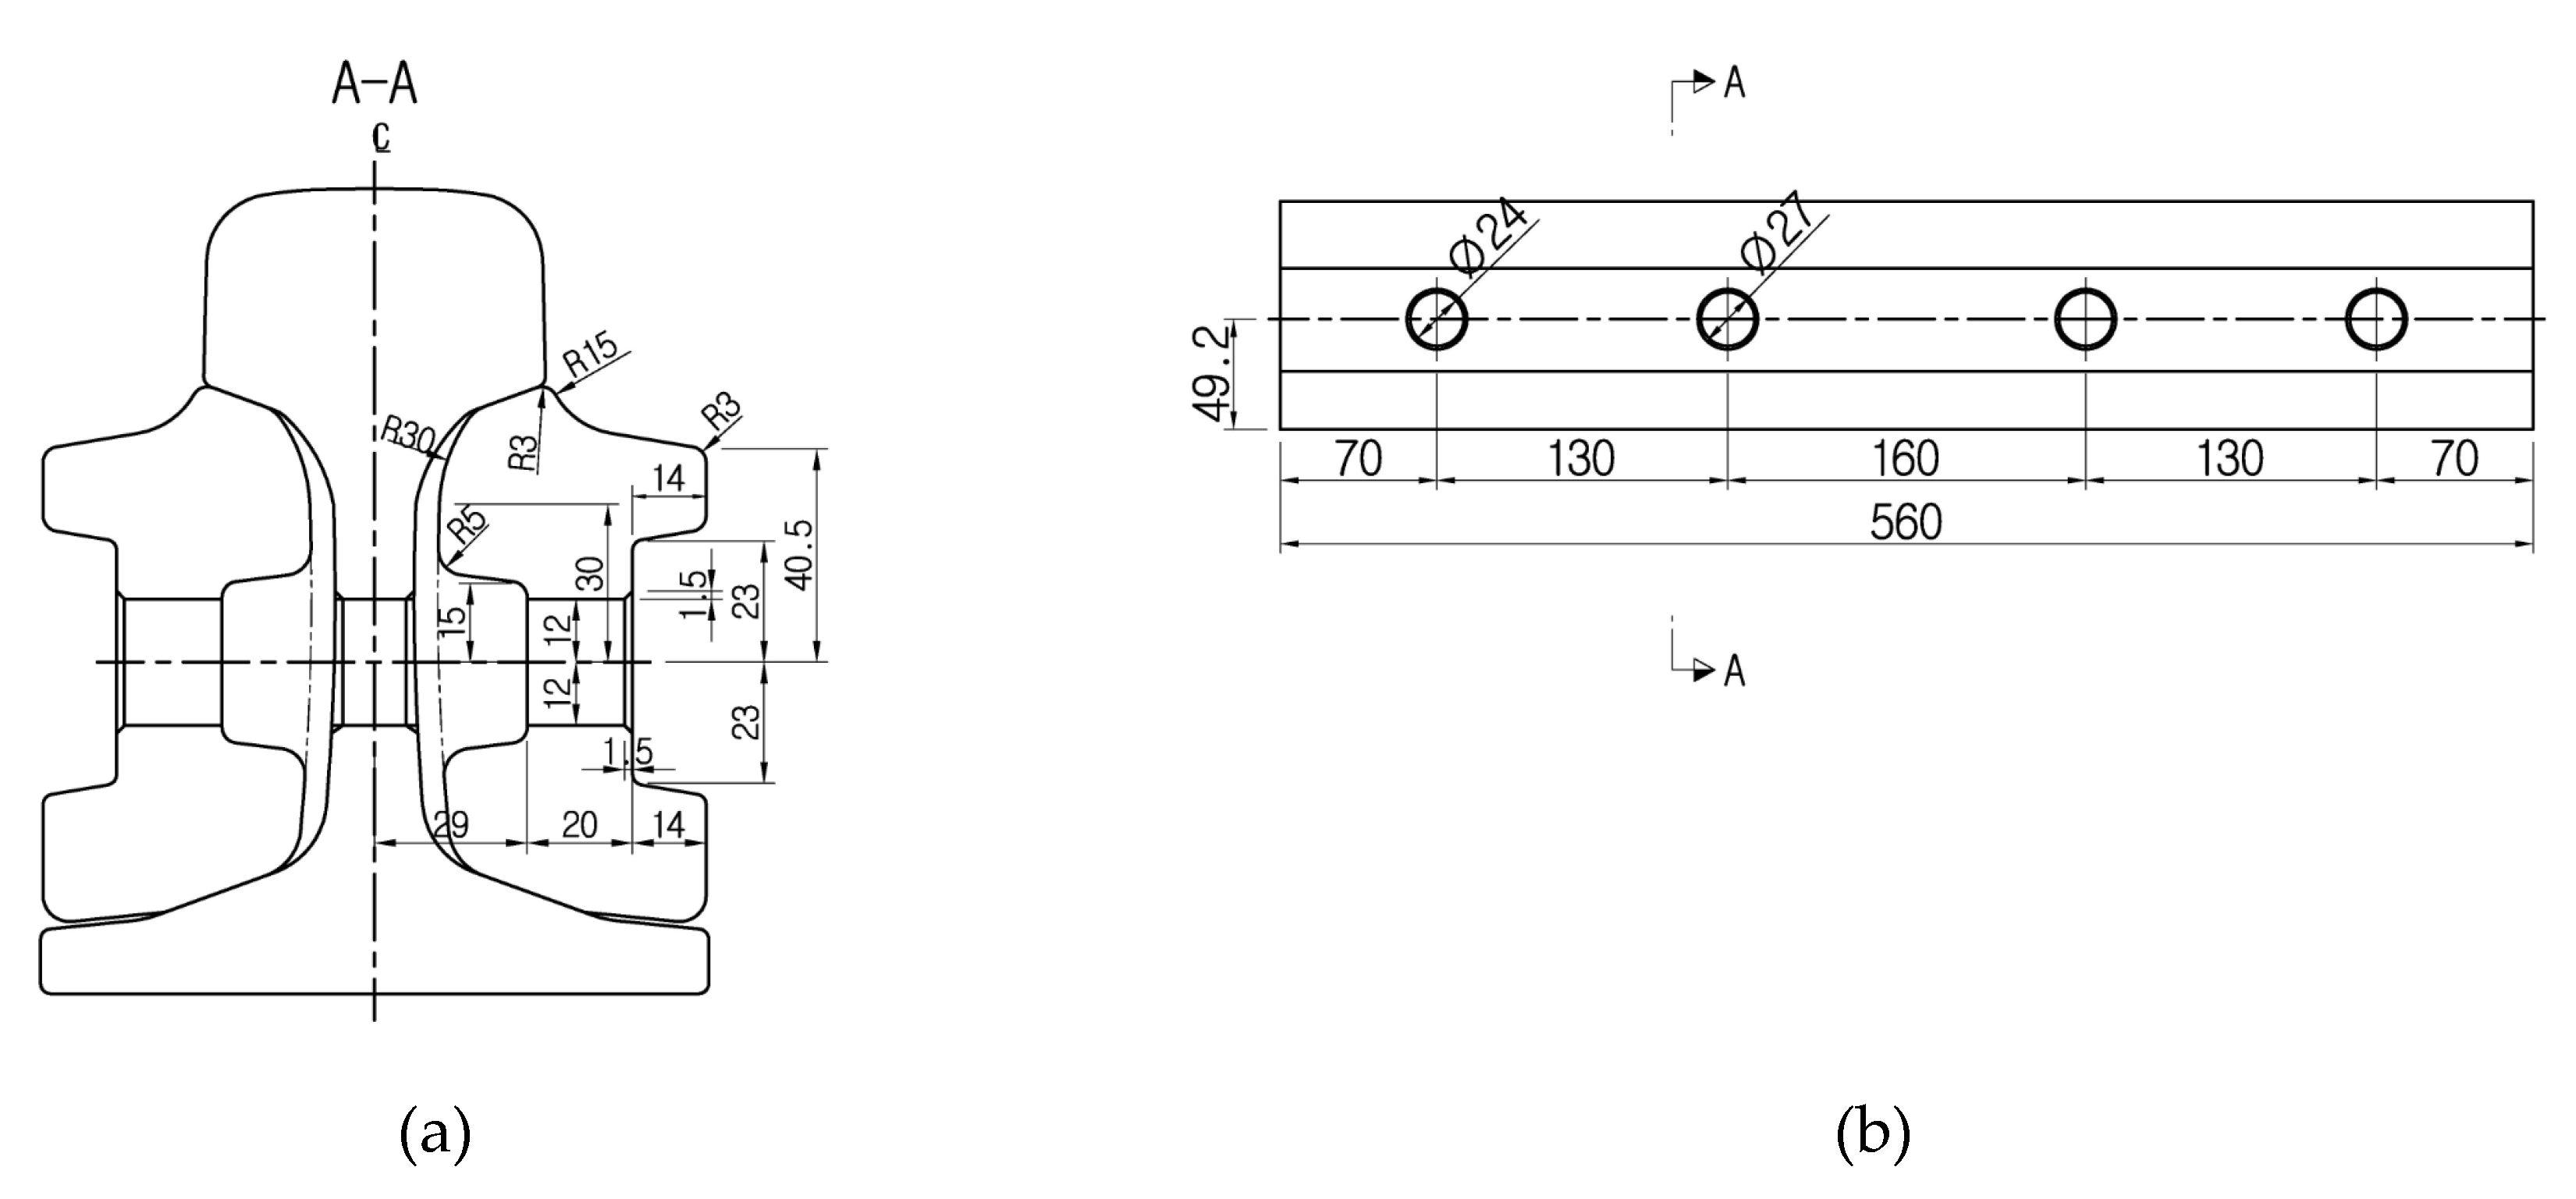
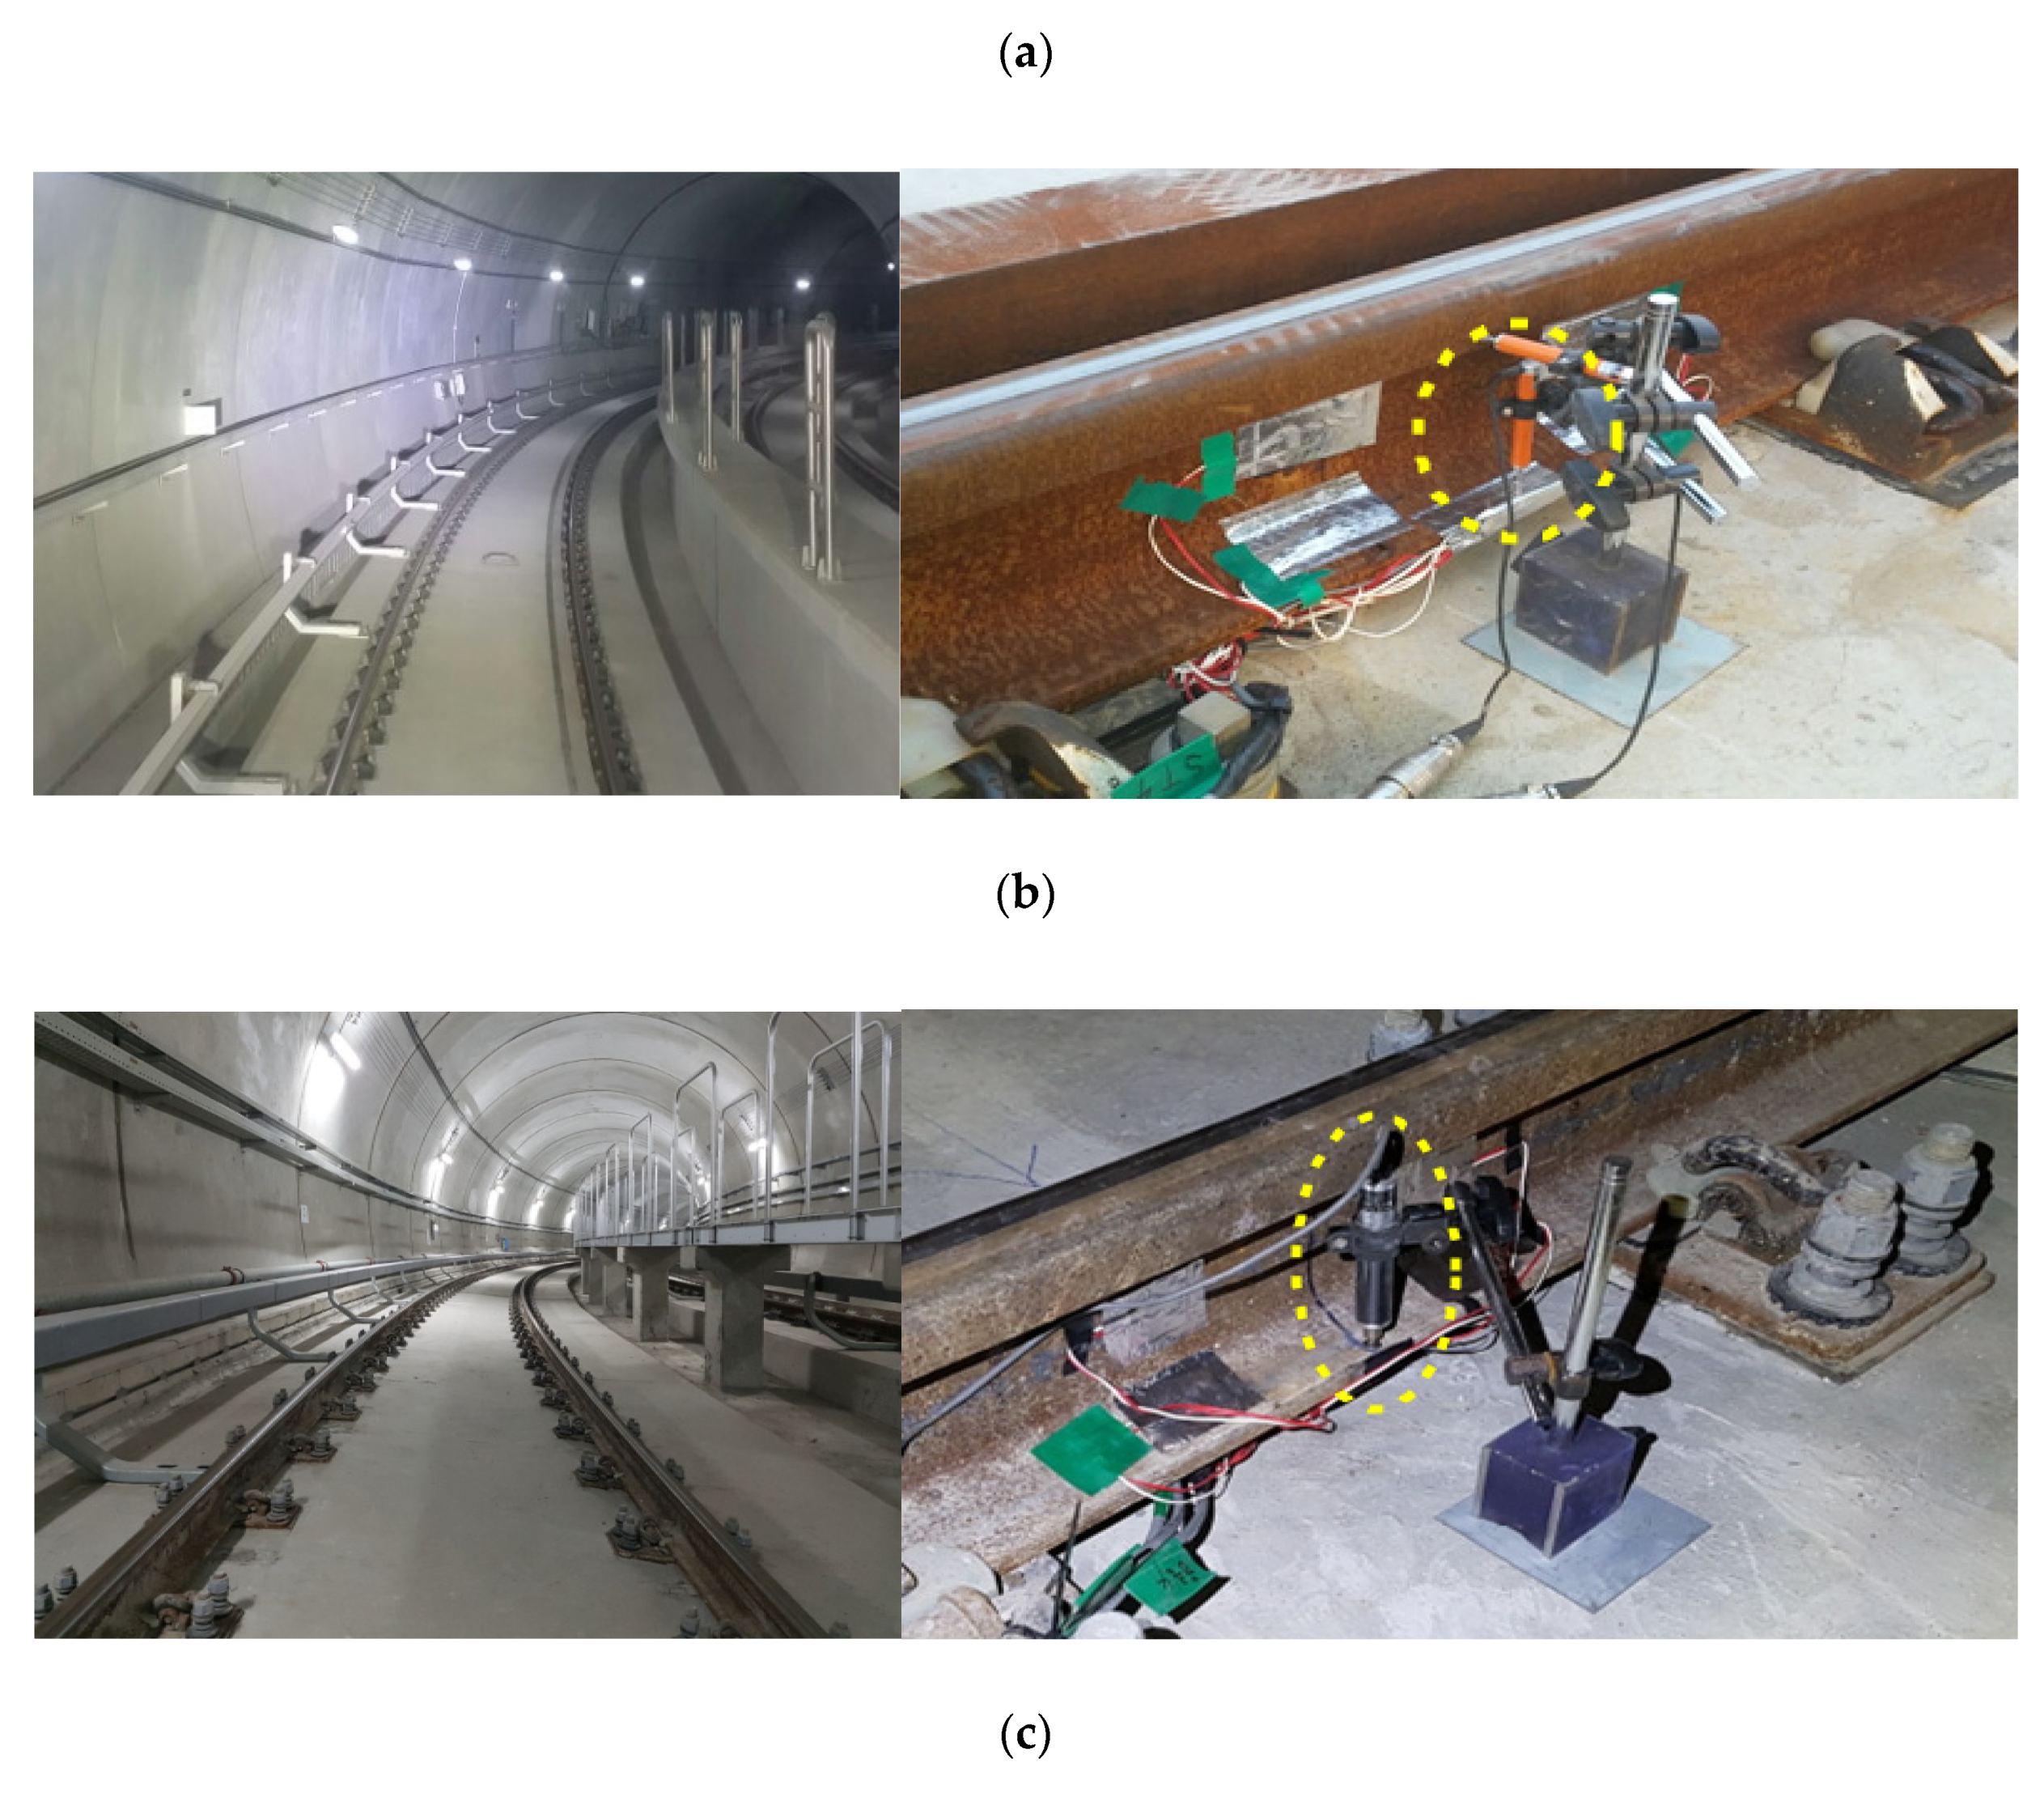
Two direct fixation concrete slab tracks with CWR on a main line of light-rail transit and one ballasted track with rail joints on a vehicle base of light-rail transit were selected as test sections for the field measurements. The dynamic wheel load and dynamic vertical rail displacement applied to the CWR and rail joints were measured during train operation. Section A is a jointed 50 kg/m rail with a ballasted track installed in the vehicle base. The track curvature R is 60 m and the vehicle speed is approximately under 15 km/h. Figure 2a,b show the cross-sectional and side view of the rail joint on Section A, respectively.
Section B is a 50 kg/m rail with direct fixation concrete tracks, with a track curvature R of 300 m and a design vehicle speed of 60 km/h. Section C is a 50 kg/m rail with direct fixation concrete tracks, with a track curvature R of 100 m and a design vehicle speed of 30 km/h. The tested trains were operated in a two-car formation. The static wheel load of each train when fully occupied is approximately 55 kN.
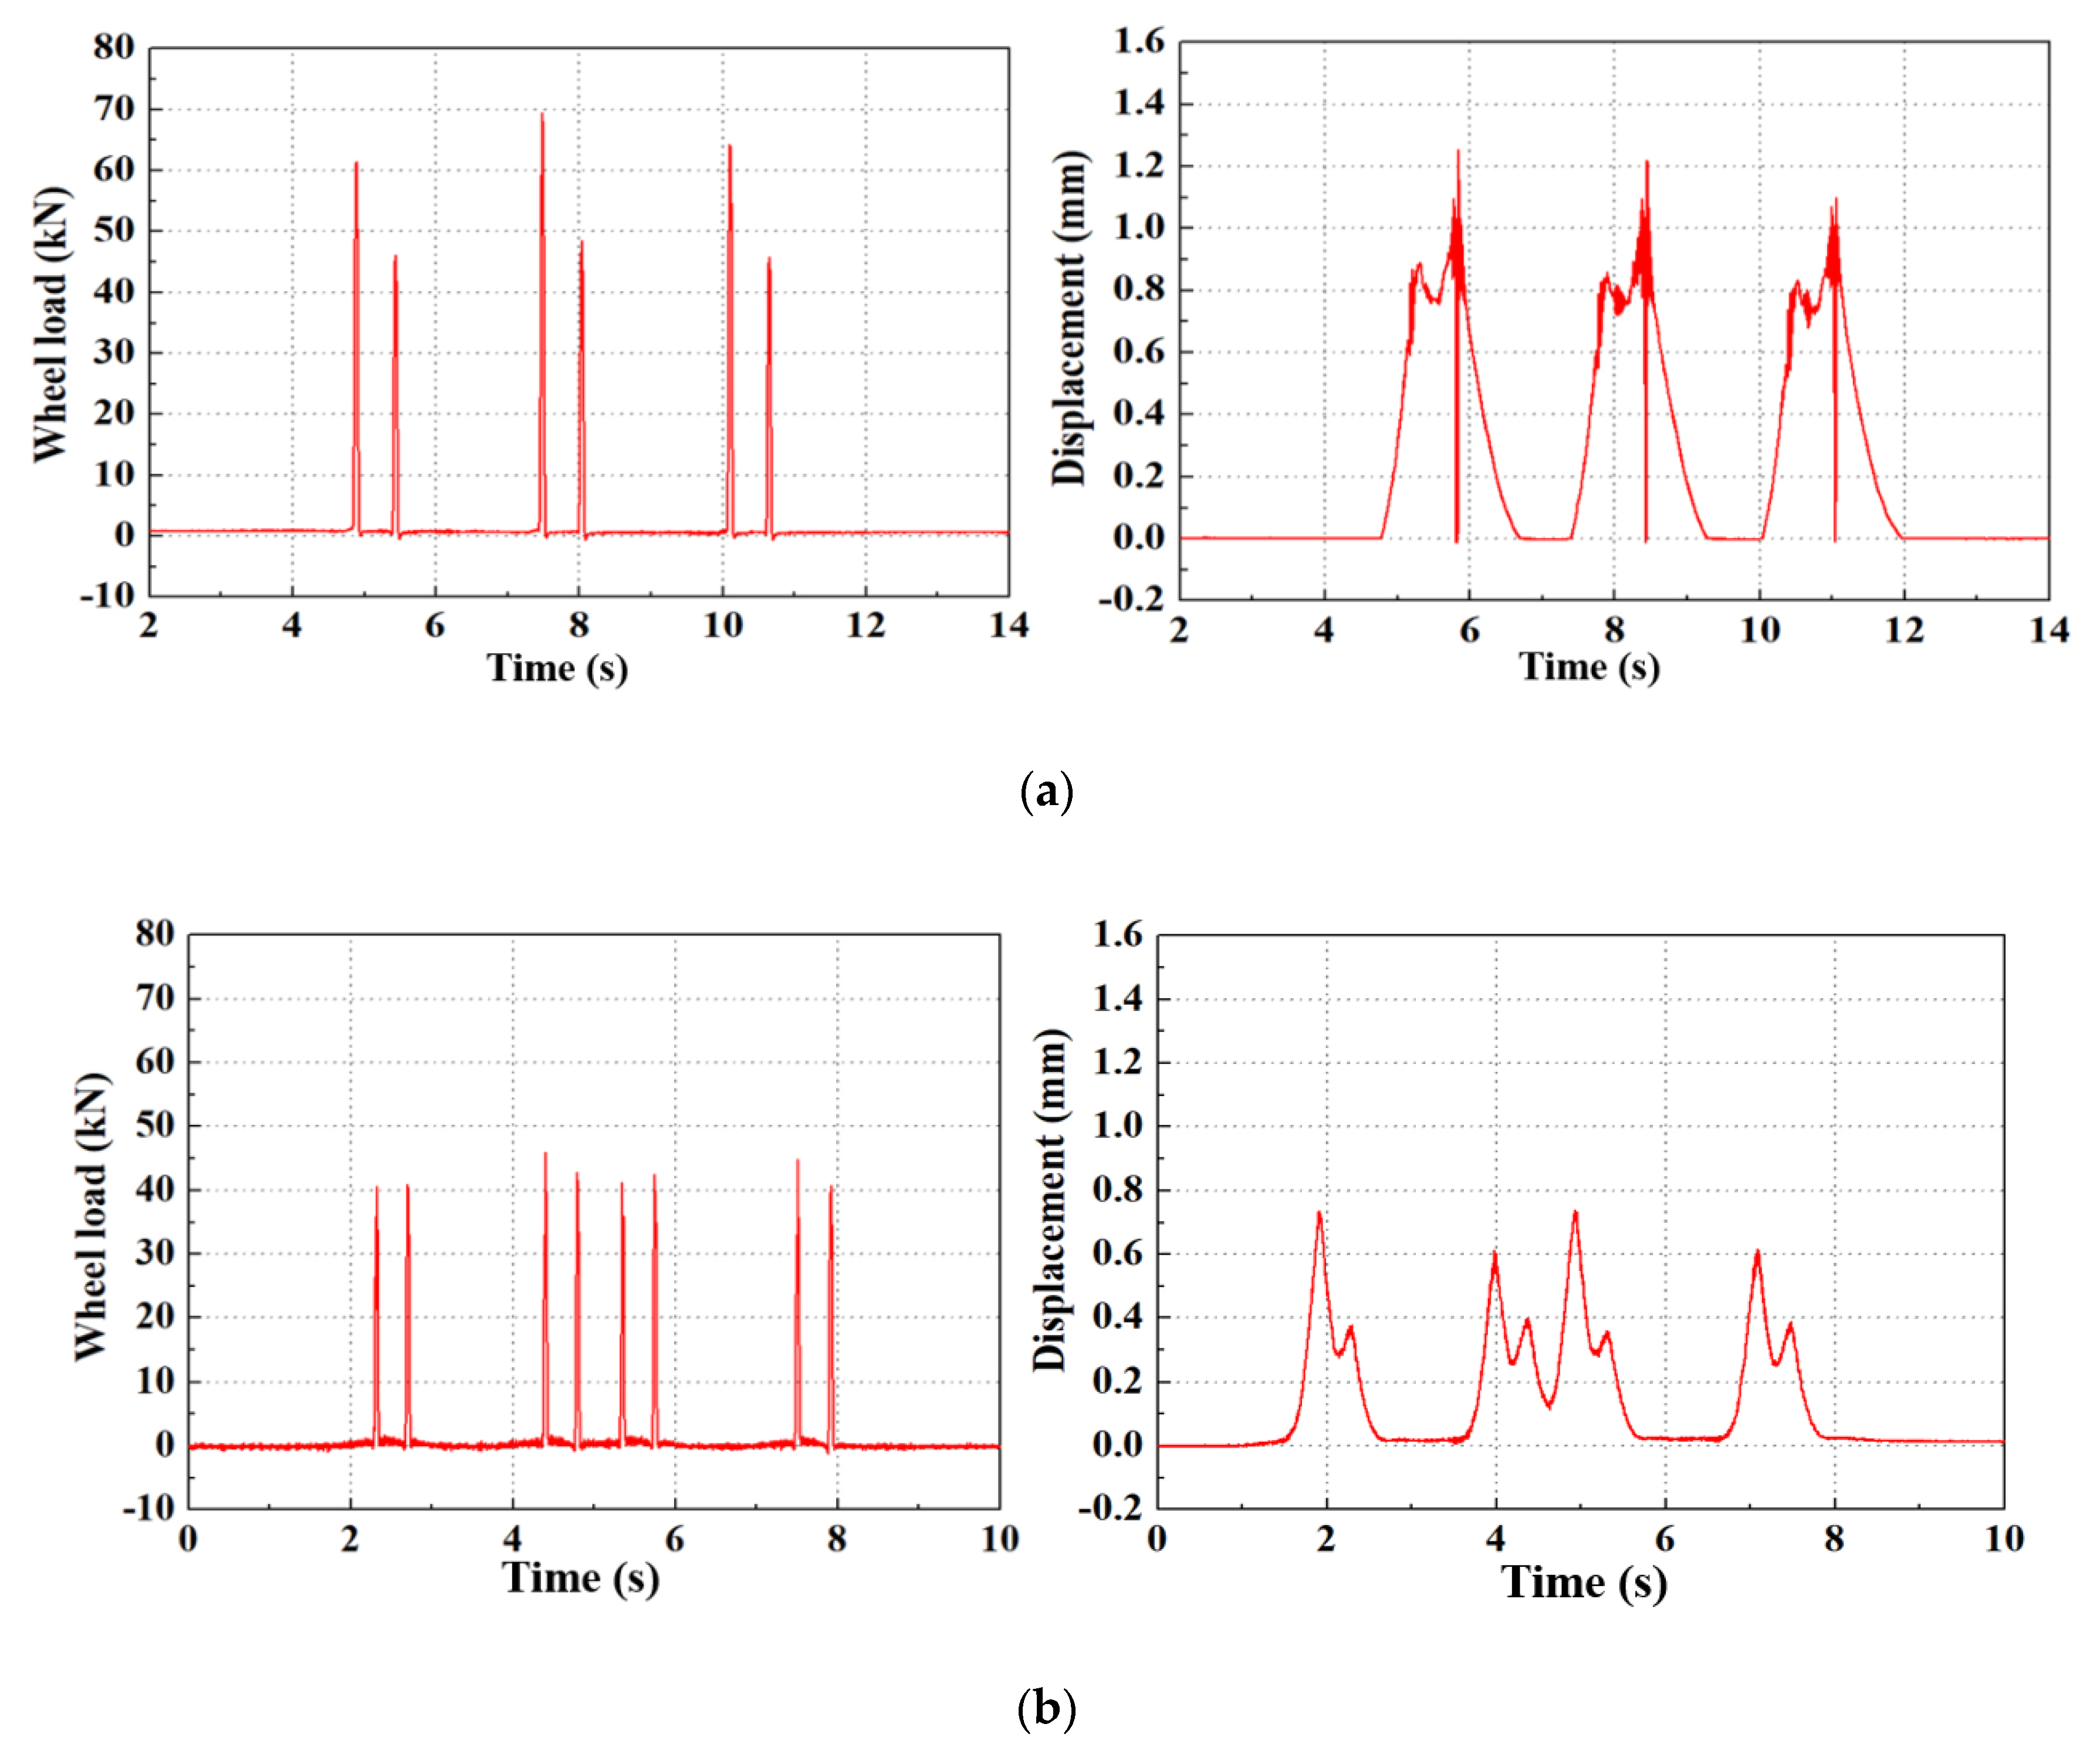
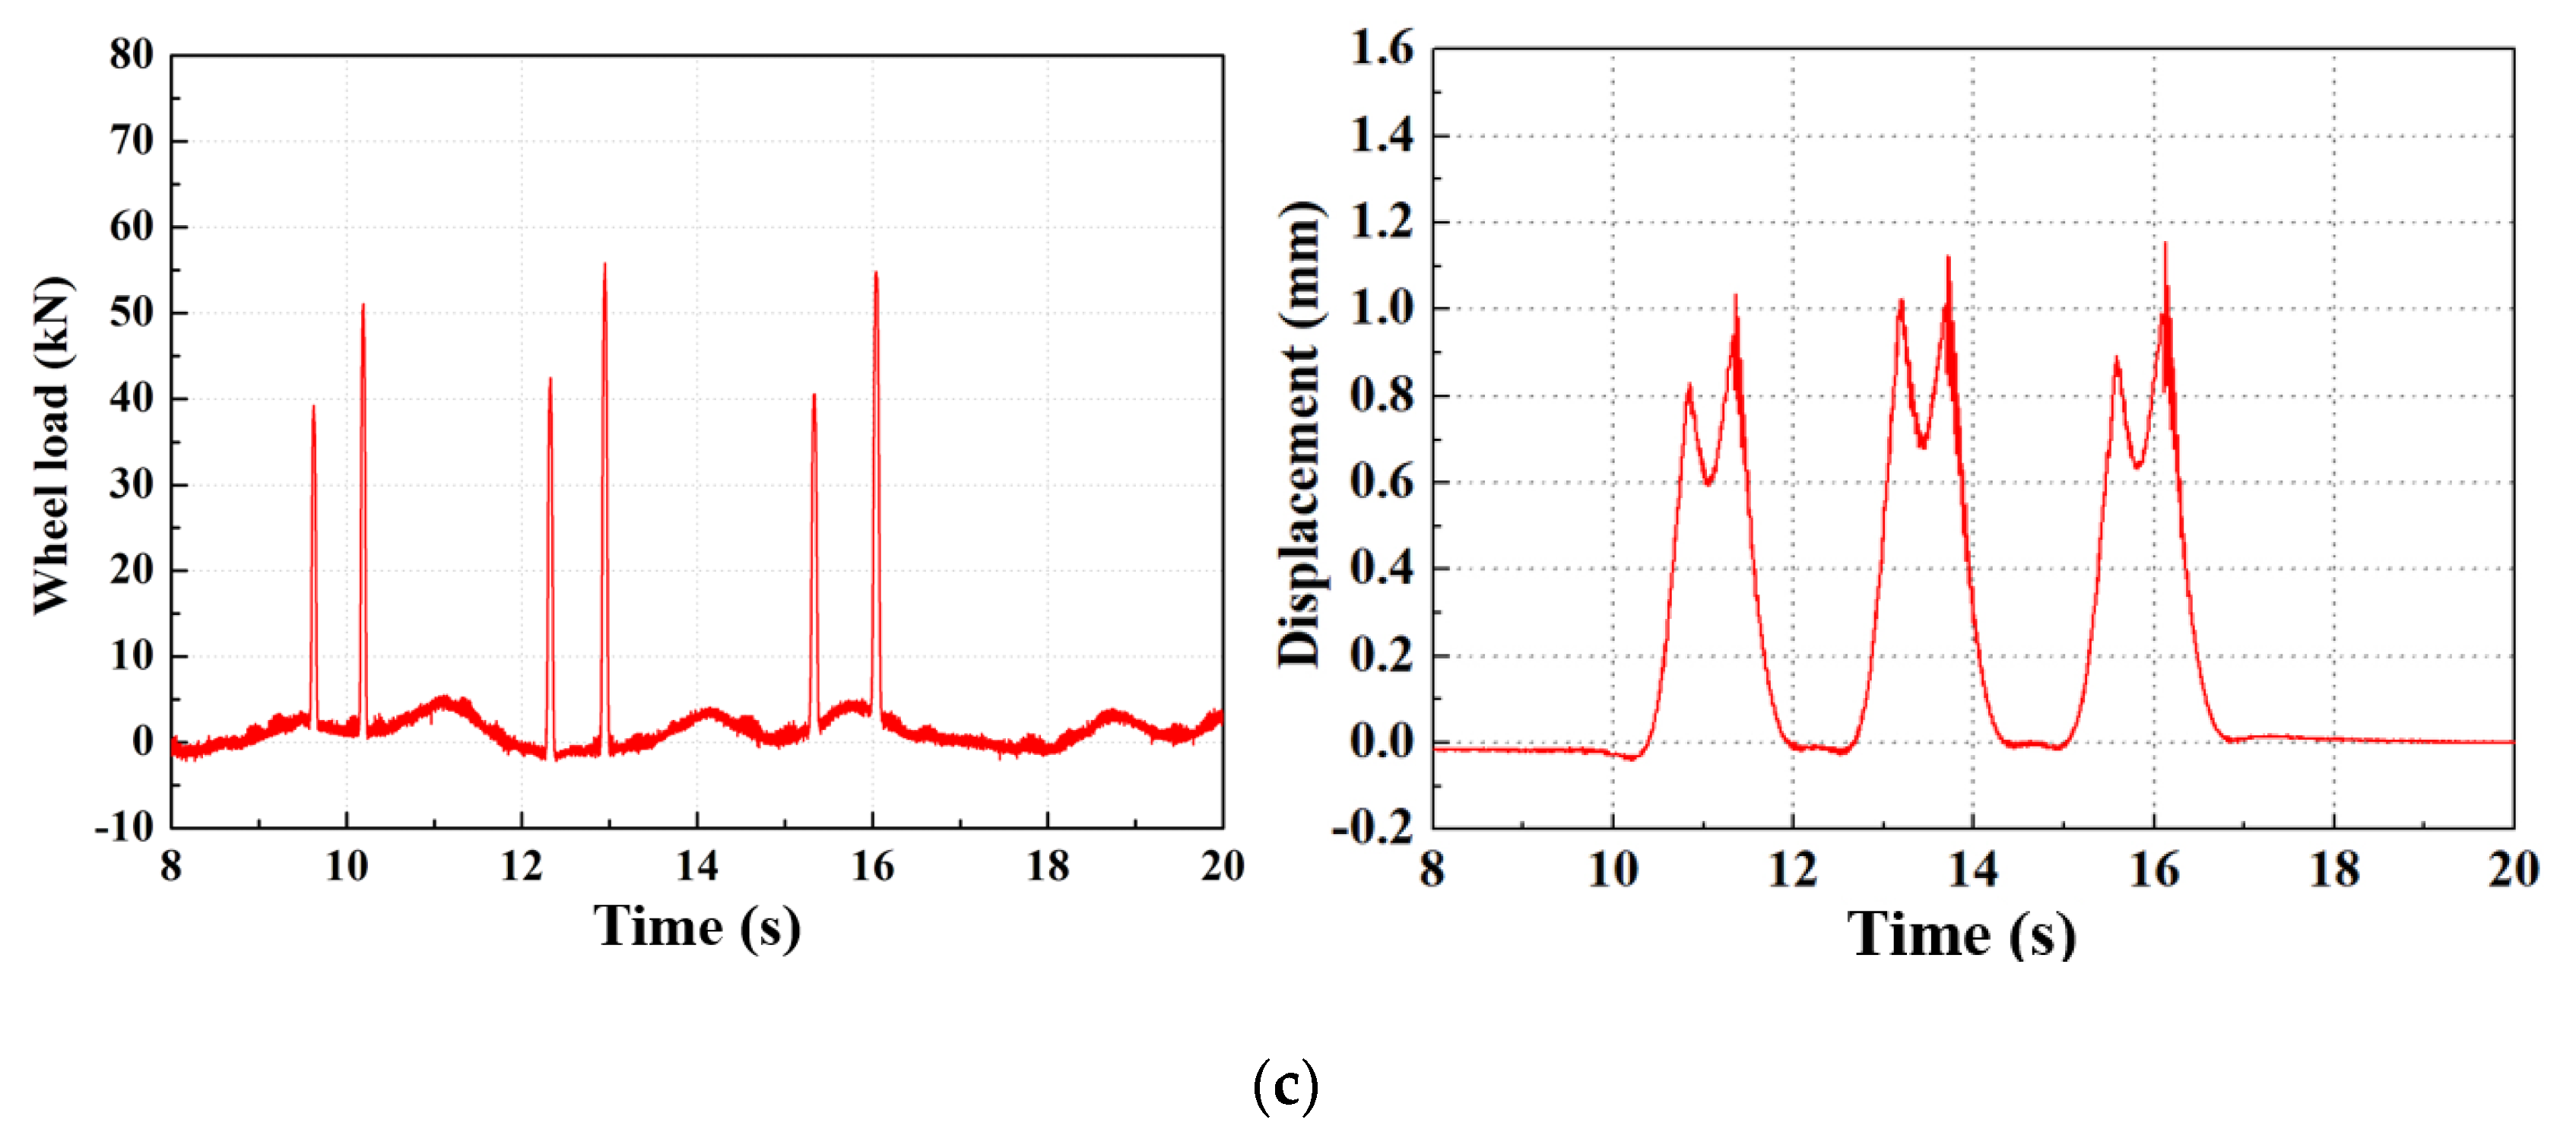
The test section and sensor installation locations are shown in Figure 3. The accelerometers were installed at the rail and sleeper, which clearly provide the dynamic responses to impact excitations [16,17]. Wheel load sensors and displacement transducers were installed on the sleepers or at the centers of the rail support points to measure the dynamic wheel load and vertical rail displacement as each section was subjected to a passing train load. The properties of the test sections are shown in Table 1. For the rail joints, the dynamic wheel load and vertical rail displacement were measured. Vertical rail displacements were measured using displacement transducers such as linear variable differential transformers (LVDTs) mounted on a jig anchored on side bridge inspection passage without influence of train load, as shown in Figure 3. LVDTs (CDP-10M) have sensitivity of 500 × 10−6/mm, a rated power of 6.25 mV/V ± 0.3%, and a frequency response of 500 Hz. Displacements are measured and recorded automatically by the computer controlled data acquisition system. The wheel loads acting on the low and high rails of the curved tracks were measured to determine the TIF by evaluating the amplitude and characteristics of the dynamic wheel load during train operation and calculating the dynamic wheel load fluctuation. An example of the measured waveform is shown in Figure 4.

3. Finite Element Analysis

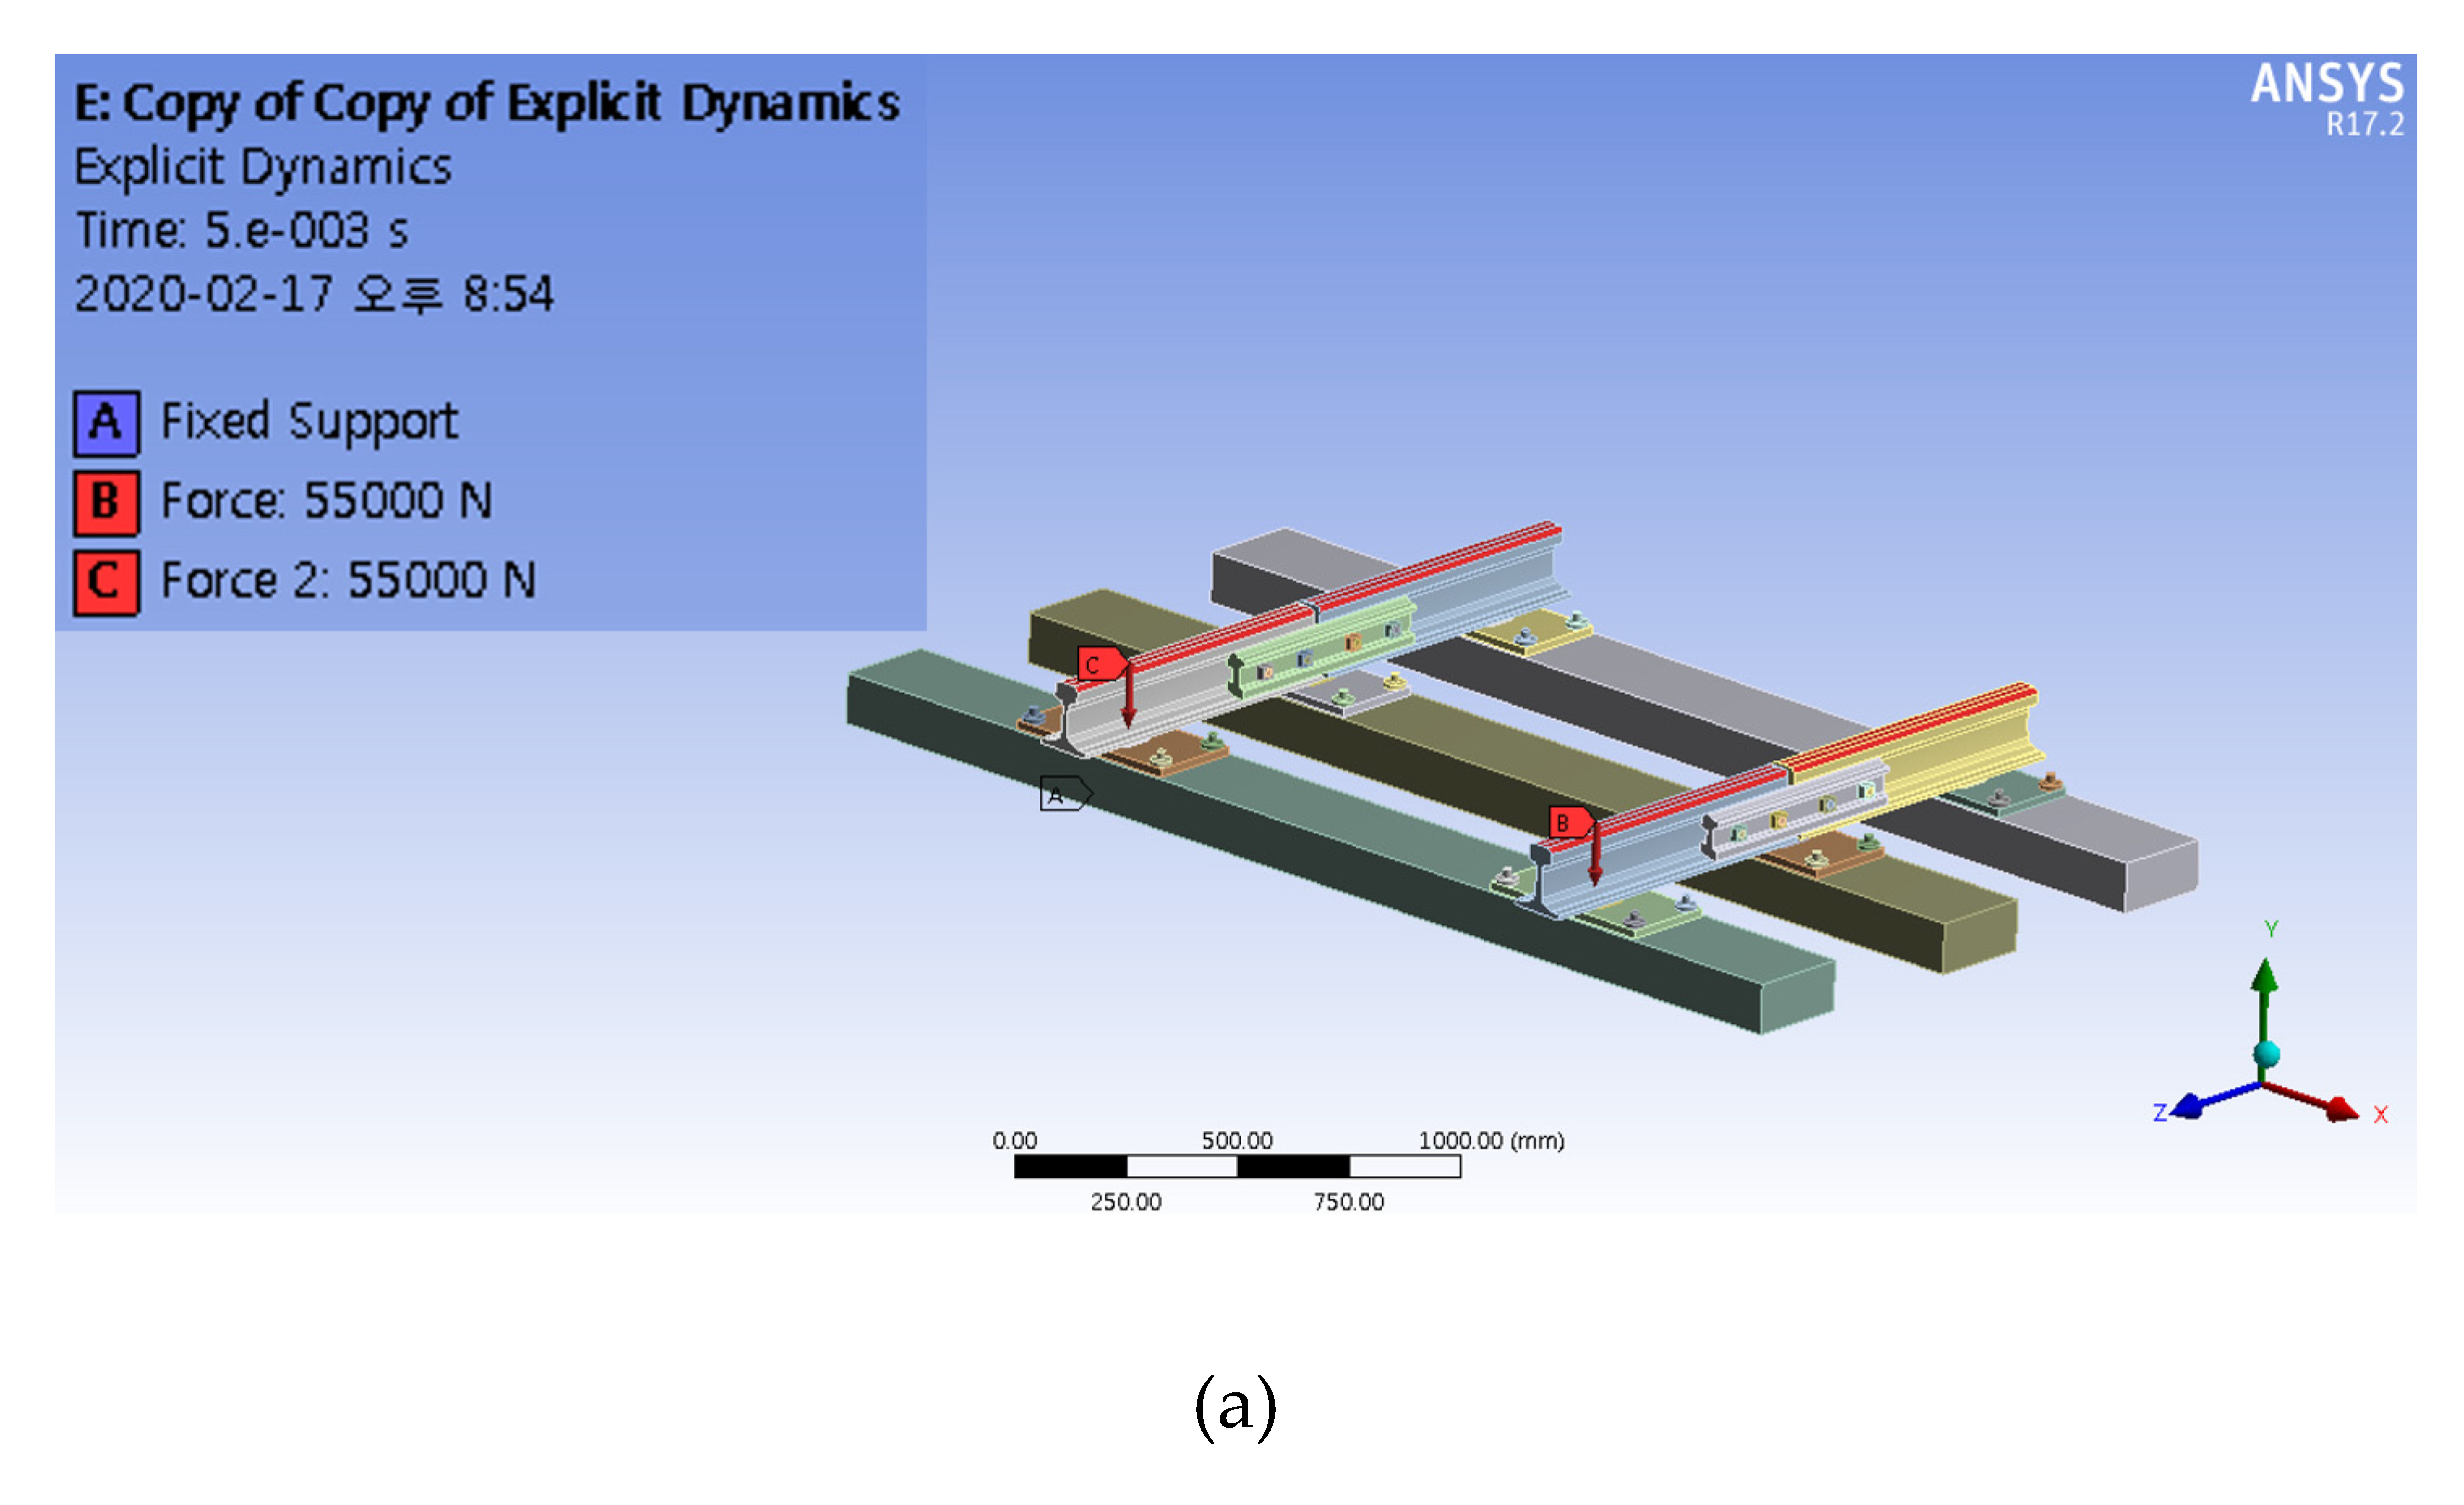
ANSYS Ver 17.2 (ANSYS, Inc., Cannonsberg, PA, USA) [18] was used as the finite element analysis program, and solid elements were used for 3D modeling. The mesh of the track model contained 20,736 nodes and 80,000 elements. The element size of the sleeper-and-rail joint was assumed to be 15 mm. The ballasted track model for the numerical simulation was configured as shown in Figure 5a. The rails, rail pad, and sleepers are composed of solid elements, and the ballast is composed of spring-damper elements. The sleeper sizes were 2500 mm in length, 150 mm in depth, and 300 mm in width. There is a clearance of 20 mm between the rails at the actual point. The ballast conditions are imposed under the sleeper base using a spring-damper element having the typical ballast properties. The spring stiffness and damping coefficient of the rail pad are 400 kN/mm and 15.683 kNs/m, respectively, and the values for the ballast are 200 kN/mm and 77.877 kNs/m, respectively [2,19,20]. A vertical wheel load of 55 kN was applied using the measured dynamic wheel load illustrated in Figure 4a. For numerical analysis, the rail joint was modeled as shown in Figure 5 by applying section A of the field measurement (Figure 3a). The mechanical properties of light-rail systems are given in Table 2.

4. Results and Discussion

4.1. Track Impact Factor According to Measured Dynamic Wheel Load

In this section, the designed TIF considering the designed speed of the test tracks is compared with the measured TIF for each test section. The wheel load subjected to a passing train includes not only the static load owing to the weight of the train, but also the effect of the dynamic impact load, which is a result of train speed. Therefore, the TIF can be calculated by comparing the dynamic wheel load measured through field measurements [2]. The TIF can be represented by the rate of dynamic wheel load fluctuation, which is obtained by dividing the rate of dynamic wheel load fluctuation subjected to a passing train by the static wheel load, as follows [1,2,3,21]:
Rate of dynamic wheel load fluctuation = (PdynPsta)/Psta,
where Pdyn is the dynamic wheel load and Psta is the static wheel load. TIF was calculated using Equation (2). The equation of the Korean standard for urban transit used for TIF for a train speed of 100 km/h is shown as Equation (2).
i = 1 + 0.513 V 100 ,
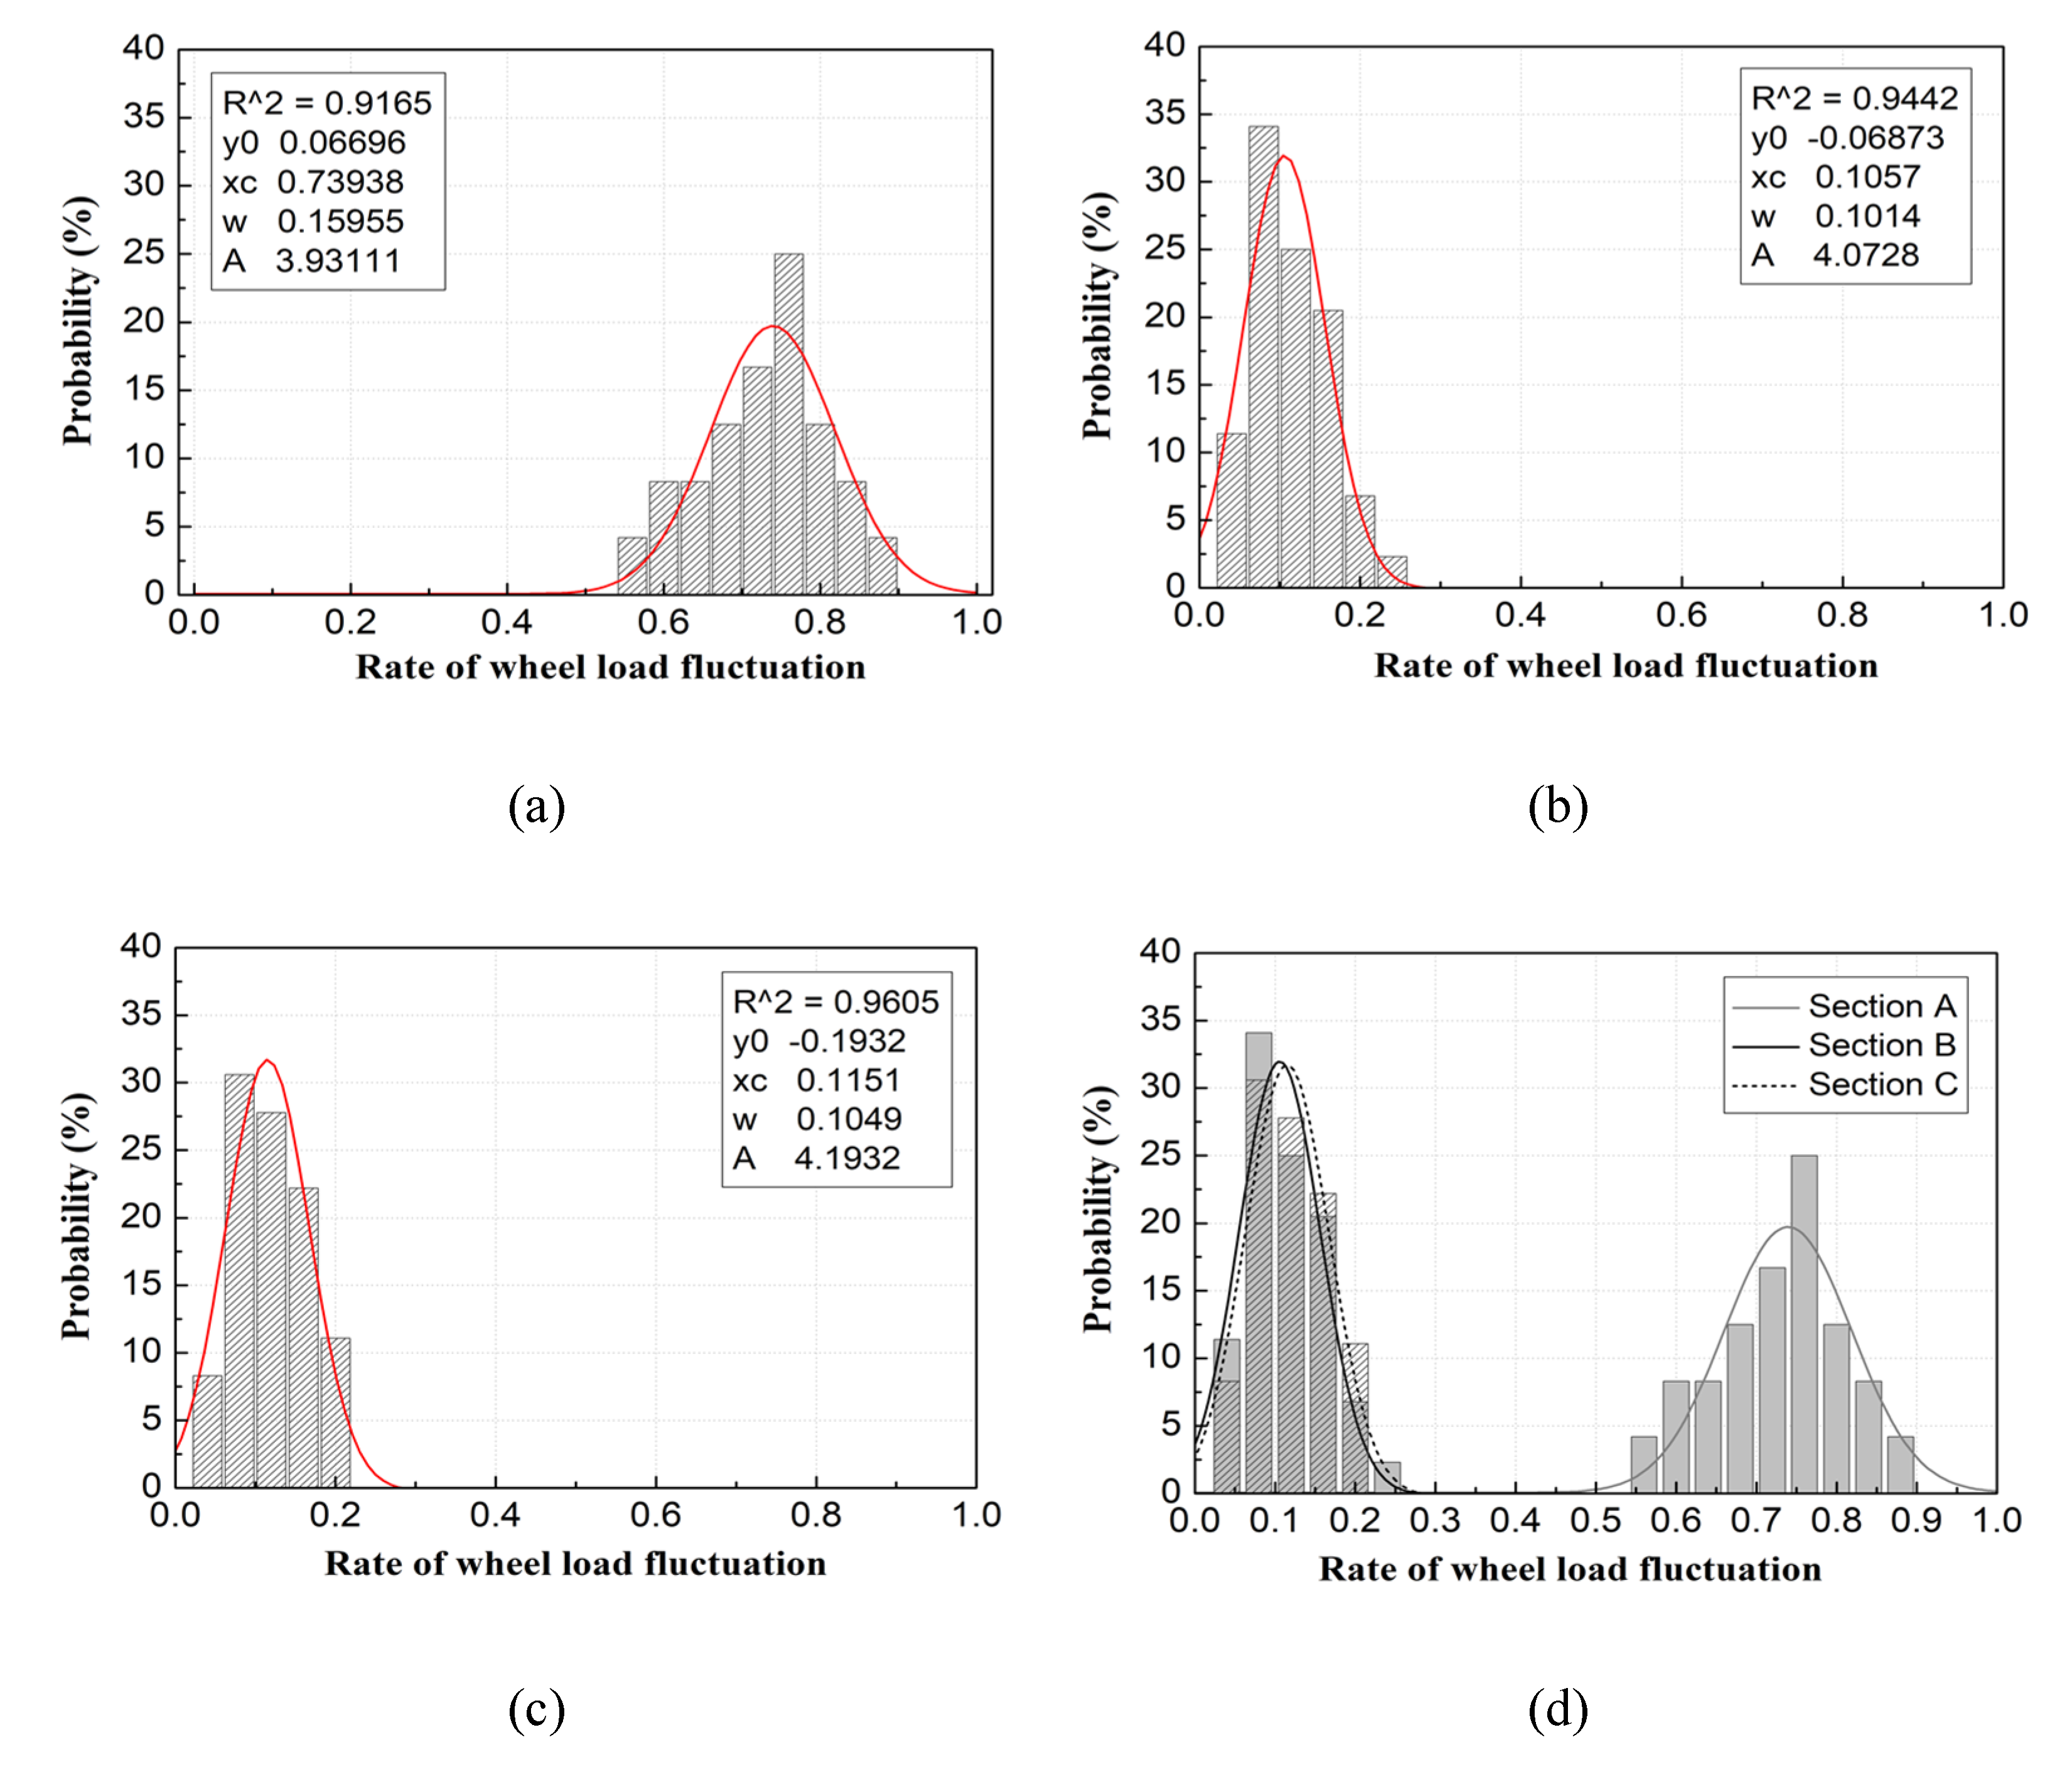
where V is maximum train speed. Typically, the TIF is calculated by considering the value 2σ, where σ is the standard deviation of wheel load fluctuation [2,19]. The TIF is evaluated based on the dynamic wheel load fluctuation and can be used to determine the dynamic wheel–rail contact force and the track impact. The TIF calculated based on the dynamic wheel load fluctuation is also affected by the track support stiffness and rail surface roughness [2]. The standard TIF used in Korean urban railway track design was applied to that of the American Railway Engineering and Maintenance-of-Way Association (AREMA) [2,3,22]. The rates of all wheel load fluctuations calculated using the dynamic wheel load measurements were greater than zero. This value was compared with the measured TIF (i = 1.410) at 80 km/h, considering the design speed of the tested section [1,2,3]. To evaluate the TIF considering the range and frequency of the dynamic wheel load fluctuation measured in each test section, a probability statistical analysis was conducted using a Gaussian probability distribution model [2]. The measured TIF converts the static wheel load to an equivalent dynamic wheel load. Moreover, to consider the increase in weight owing to passengers boarding the train, the static wheel load was measured when the trains were in motion. In reality, it is difficult to estimate the static load of a train and the exact number of passengers boarding the train. Therefore, the variations in the total wheel load were measured during peak hours. Figure 6 shows the results of the Gaussian analysis of wheel load fluctuation for each test section.
According to the TIF calculation results for each test section, the TIF of rail joints in the ballasted track (Section A) was much higher than that of the direct fixation concrete track CWRs (sections B and C). This suggests that the rail joints amplified the track impact during the train’s passage over the discontinuity gaps. The average probability density function was measured as positive, as shown in Figure 6a. The probability of a negative value owing to the normal distribution was negligible because it is close to zero, as shown in Figure 6b,c. Therefore, the track impact along section A was gradually amplified. The TIF calculated for the current track conditions for each test section was compared with the designed TIF, and the results are summarized in Table 3.
The TIFs calculated for sections A, B, and C were 1.899, 1.207, and 1.220, respectively. These values represent 86% and 87% of the current Korean standard TIF for the slab tracks with CWR (sections B and C). However, for section A, the TIF was approximately 134% higher than the Korean standard for urban railways. Therefore, the measured amplification of the impact load generated on the rail joints exceeded the track impact level considered during railway design. This could lead to accelerated damage and deterioration of track components and potentially reduce the running stability and riding comfort of the train. Furthermore, an increased dynamic wheel–rail interaction force owing to the structural characteristics of the rail joint is generated regardless of train speed. Hence, a design and maintenance plan should be established to minimize track impact and wheel damage on tracks with multiple rail joints.

4.2. Track Impact Factor Based on the Measured Vertical Rail Displacement

The vertical rail displacement measurements in the test sections were used to analyze the track impact effects for a train passing over the rail joint gaps and very sharply curved CWRs. The TIFs calculated from the displacement response and the dynamic wheel fluctuation were then compared. The track impact effect can be generated simultaneously by the load and displacement, and the typical TIF can be calculated using the dynamic wheel load fluctuation. In this study, however, the effects of wheel load on the vertical rail displacement of the rail joint (amplitude of the displacement response) and the resulting track impact were experimentally estimated. These values were then compared with the typical TIF based on the wheel–rail contact load (dynamic wheel load fluctuation). On the basis of the displacement measurement results, the TIFs were calculated and compared. In this study, the dynamic rail displacement measurement results for track subjected to a passing train were replaced with pseudo-static displacement values using lowpass filtering [2]. The TIFs based on displacement were calculated according to the ratio of dynamic vertical rail displacement (Ddyn) to pseudo-static vertical rail displacement (Dsta) using Equation (3). The results of this conversion are shown in Figure 6.
Track impact factor (TIF) i = Ddyn/Dsta
Figure 7a shows the TIF based on the vertical rail displacement measured at the rail joints after the first wheel has passed; the vertical rail displacement decreased sharply after the second wheel passes, and then increased rapidly to the maximum value. This is because of the difference in rail displacement generated when the wheel passes through the two adjacent rails of the joint, resulting in a sharp displacement difference at the ends of the rail joint and an increase in displacement amplitude. The experiments suggested that this may damage the fishplates of the rail joint and affect the end rails. However, as shown in Figure 7b,c, the displacement response characteristics of the rail joint in Figure 7a did not occur in the CWR, thereby confirming the continuity of the time–displacement response. Table 4 compares the TIFs calculated using the dynamic wheel load fluctuation derived from the corresponding measurements and those calculated using the vertical rail displacement measurements. As shown in Table 4, on the basis of section B, which showed the lowest impact factor, this study compared the rail joint (section A) with section C, which used the same CWR. According to the comparison of TIF evaluation methods in Table 4, the TIFs of the rail joints (Section A) are higher than those of the CWRs in terms of both wheel load fluctuation and displacement response by 57.33% and 24.16%, respectively. This is because the load and displacement are relatively high owing to the rail joint gap and vertical rail displacement difference.
This study experimentally determined that rail joints amplified the wheel–rail contact load (dynamic wheel load and its fluctuation) and increased the impact load to the track and wheel. The level of impact based on the displacement response according to increased dynamic vertical rail displacement caused by gaps in the rail joints was also higher than that for the CWRs, despite the higher train speed. The TIF evaluated using the dynamic wheel load fluctuation can directly affect the wheel and rail by increasing the damage and the impact load to the track components. The increased TIF owing to increased displacement is expected to cause damage to the fishplates of the rail joints and the rail seats of the rail joint sleepers. Therefore, even at low train speeds, a relatively higher track impact is generated at the rail joints, which may lead to accelerated deterioration of the track components and more serious damage. Thus, future design and maintenance of track components comprising rail joints should consider the track impact factors for rail joints.

4.3. Track Impact Factor Based on the FE Analyzed Vertical Rail Displacement

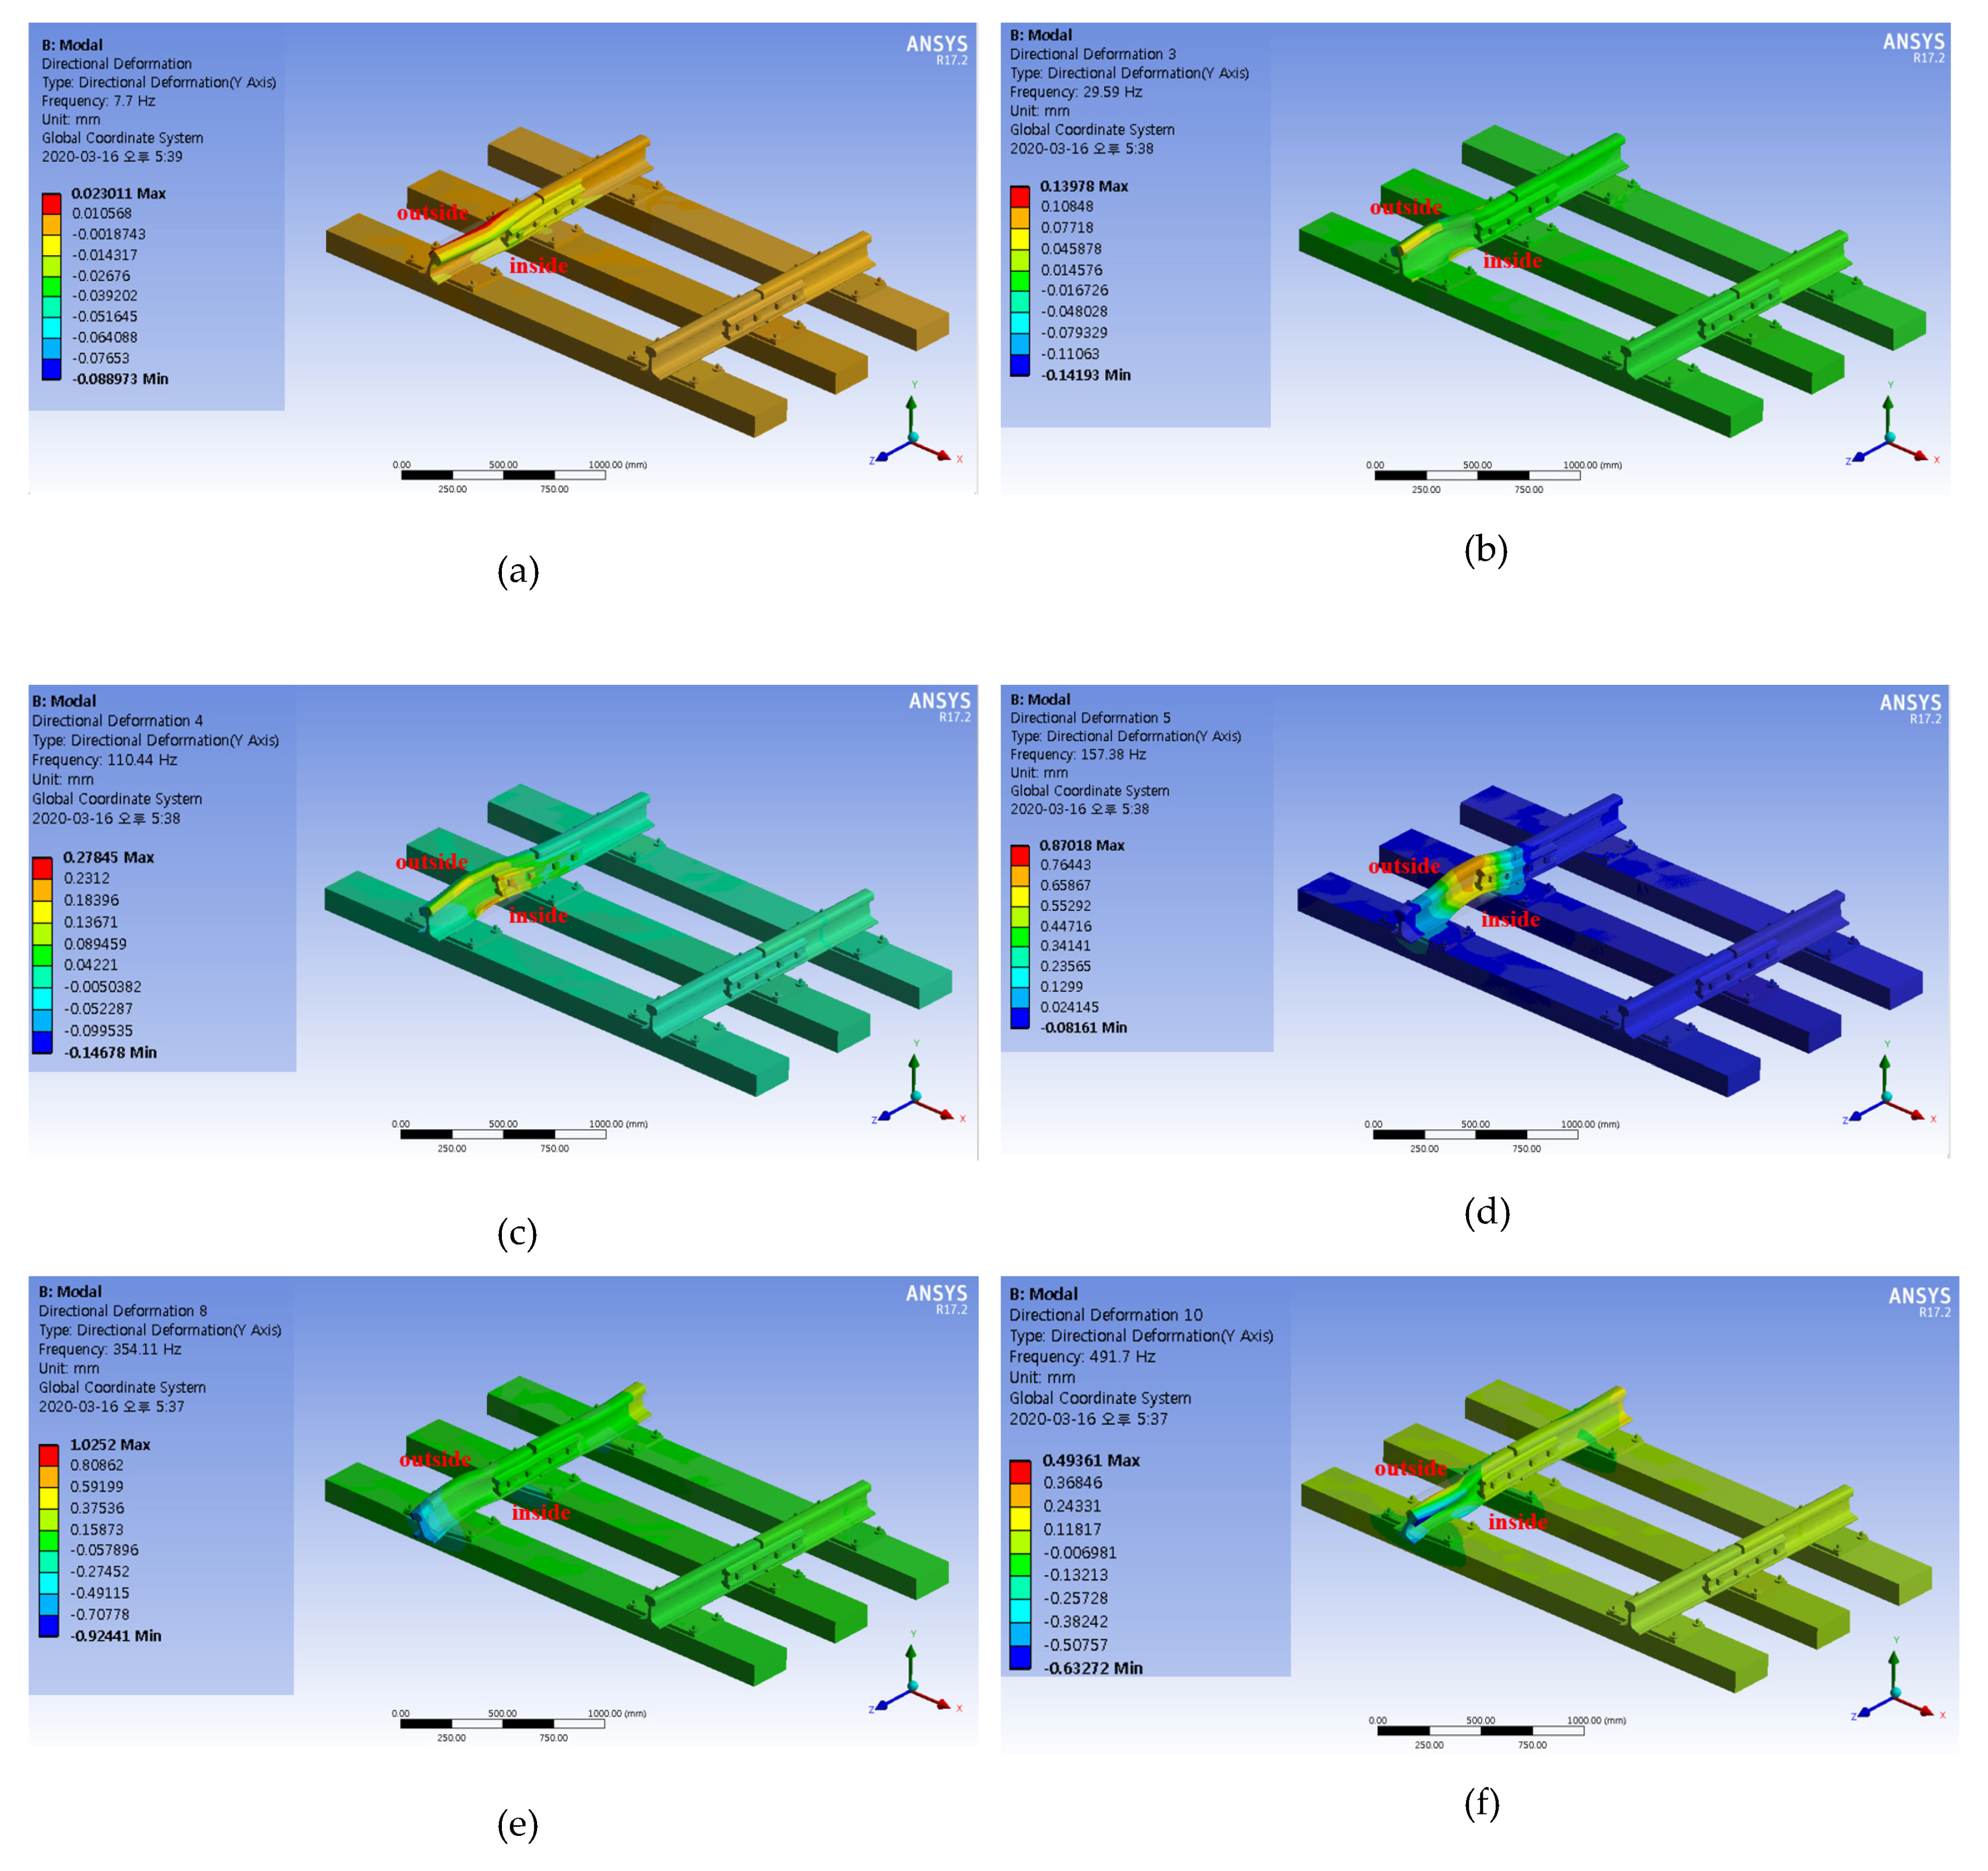
The displacement occurring at the CWR and rail joint was confirmed by FEA. Modal analysis was performed using a jointed rail to confirm the structural responses to wheel–rail contact impacts at the discontinuity of rail joints. The frequencies of the first ten modes of the jointed rail are shown in Table 5 and selected modal shapes are shown in Figure 8. These modes correspond to vertical translation, rotation, and bending vibration. The ninth mode exhibits a local vibration in the vicinity of the CWR. The ninth mode is similar to the deflection of the impacted jointed rail, and the frequency of the eighth mode (354.11cHz) is close to the frequency of the wheel–rail contact impact force obtained from field measurements. Therefore, the dynamic response of the jointed rail may be closely correlated.
The vertical rail displacement according to the wheel–rail contact was confirmed through explicit dynamics analysis. The results of the FEA indicated that the displacement occurred at the rail joint subjected to a passing train wheel using the circular wheel element with sectional properties of an actual wheel (wheel diameter of 860 mm) in order to consider the rolling contact of wheel and rail, as shown in Figure 9a,b is the detailed displacement occurring in the rail joint when the wheel and the rail contact. As shown in Table 6, the vertical rail displacements predicted by FEA were comparable to the field measurements. The difference between the measured and analytical results was approximately 4%; the analytical results that considered the measured dynamic wheel load and wheel model reflected the measured vertical rail displacement results well.

5. Conclusions

This study compared and analyzed the track impact factors (TIFs) for rail joints and CWRs in curved light-rail track systems. Field measurements were performed to calculate TIFs based on the dynamic wheel load and dynamic vertical rail displacement during actual train operation for each tested track. The measured TIFs of each tested track were then compared with the Korean standard TIFs for urban railways and the analyzed TIFs by the finite element analysis. The major conclusions of this study are as follows.
(1) The effects of track impacts based on wheel–rail contact force and rail displacement can occur simultaneously. The difference of dynamic vertical rail displacement at the rail joint generated when the train load passes over the discontinuity gap of rail joint and the resulting track impact were experimentally evaluated and compared with the force-based TIF using the measured wheel–rail contact load. Even for a vehicle base rather than a main track, we applied the design condition (impact factor) considering rail joint impact in the design of rail joints for vehicle base installations. The track impact factor for rail joints on the sharply curved ballasted track is approximately 1.34 times greater than the Korean TIF standard. Thus, the increased wheel–rail contact force from the rail joints, even with lower-speed trains, is likely to exceed the track impact factor considered in the track design.
(2) The results of the vertical rail displacements measured at the rail joints showed that, after the first wheel had passed, the dynamic displacement decreases sharply as the second wheel passes over the rail joint gap before increasing rapidly to the maximum value. Thus, it was experimentally proven that a sudden vertical rail displacement difference occurs at the ends of rail joints, which can damage the components of the rail joint owing to the dynamic wheel–rail contact force induced impact. The results of the FEA and field measurements showed that the vertical rail displacement of the rail joint was greater than that of CWR. The difference between the results of field measurements and FEA for vertical rail displacement was within approximately 4%. Accordingly, it was found that the FEA simulation technique could be used to effectively predict vertical rail displacements of the rail joint with reasonable accuracy.
(3) Therefore, the track impact induced by wheel–rail contact force can be amplified by the structural characteristics of rail joints, even if the train speed is not high. Further research is required to design and maintain track components for rail joints according to the design track impact factors of these joints, which are inevitable in light-rail or urban railway track systems.

Author Contributions

Conceptualization, J.-S.C. and J.-Y.C.; investigation, S.-W.Y.; formal analysis, J.-S.C.; field test, J.-Y.C. and S.-W.Y., writing—original draft preparation, J.-Y.C. and S.-H.K.; writing—review and editing, S.-H.K. All authors have read and agreed to the published version of the manuscript.

Conflicts of Interest

The authors declare no conflicts of interest.

References

  1. Lichtberger, B. Track Compendium; Eurail Press: Hamburg, Germany, 2010. [Google Scholar]
  2. Choi, J.Y. Qualitative Analysis for Dynamic Behavior of Railway Ballasted Track. Ph.D. Thesis, Technical University of Berlin, Berlin, Germany, 2014. [Google Scholar]
  3. Choi, J.Y. Influence of track support stiffness of ballasted track on dynamic wheel-rail forces. ASCE J. Transp. Eng. 2013, 139, 709–718. [Google Scholar] [CrossRef]
  4. Lim, N.H.; Choi, J.Y.; Lee, W.C. An analytical study about the reduction method of sleeper displacements in the end zone of rail expansion joint. Korean Soc. Civ. Eng. 2008, 2008, 982–985. [Google Scholar]
  5. Zong, N.; Wexler, D.; Dhanasekar, M. Structural and material characterization of insulated rail joints. Electron. J. Struct. Eng. 2013, 13, 75–87. [Google Scholar]
  6. Mandal, N.K.; Peach, B. An engineering analysis of insulated rail joints: A general perspective. Int. J. Eng. Sci. Technol. 2010, 2, 3964–3988. [Google Scholar]
  7. Pombo, J.C.; Ambrósio, A.C. Application of a wheel–rail contact model to railway dynamics in small radius curved tracks. Multibody Syst. Dyn. 2008, 19, 91–114. [Google Scholar] [CrossRef]
  8. Sugiyama, H.; Yamashita, S.; Suda, Y. Curving simulation of ultralow-floor light rail vehicles with independently rotating wheelsets. ASME 2010 Int. Mech. Eng. Congr. Expo. 2010, 11, 869–875. [Google Scholar]
  9. Wen, Z.; Jin, X.; Zhang, W. Contact-impact stress analysis of rail joint region using the dynamic finite element method. Wear 2005, 258, 1301–1309. [Google Scholar] [CrossRef]
  10. Sharma, S.K.; Kumar, A. Dynamics analysis of wheel rail contact using FEA. Procedia Eng. 2016, 144, 1119–1128. [Google Scholar] [CrossRef] [Green Version]
  11. Yang., Z.; Boogaard, A.; Wei, Z.; Liu, J.; Dollevoet, R.; Li, Z. Numerical study of wheel-rail impact contact solutions at an insulated rail joint. Int. J. Mech. Sci. 2018, 138–139, 310–322. [Google Scholar] [CrossRef] [Green Version]
  12. Choi, J.Y.; Kim, S.H. Impact evaluation of track girder bearing on yeongjong grand bridge. Appl. Sci. 2020, 10, 68. [Google Scholar] [CrossRef] [Green Version]
  13. Raymond, G.P. Design for railroad ballast and subgrade support. J. Geotech. Eng. Div. ASCE 1978, 104, 45–60. [Google Scholar]
  14. Selig, E.T.; Waters, J.M. Track Geotechnology and Substructure Management, 1st ed.; Technology Development and Application Committee, on behalf of the railways of Australia; Thomas Telford Services Ltd.: London, England, 1994. [Google Scholar]
  15. Liang, B.; Zhu, D. Dynamic analysis of the vehicle-subgrade model of a vertical coupled system. J. Sound Vib. 2001, 245, 79–92. [Google Scholar] [CrossRef]
  16. Kaewunruen, S.; Remennikov, A. In-Field Dynamic Testing and Measurements of Railway Tracks in Central Queensland; March-June Research Report; CRC Railway Engineering and Technologies: Queensland, Australia, 2005. [Google Scholar]
  17. Kaewunruen, S.; Remennikov, A. Field trials for dynamic characteristics of railway track and its components using impact excitation technique. NDT E Int. 2007, 40, 510–519. [Google Scholar] [CrossRef]
  18. ANSYS. Release 17.2 Documentation for ANSYS; ANSYS Inc.: Cannonsberg, PA, USA, 2008. [Google Scholar]
  19. With, C.; Bodare, A. Evaluation of track stiffness with a vibrator for prediction of train-induced displacement on railway embankments. Soil Dyn. Earthq. Eng. 2009, 29, 1187–1197. [Google Scholar] [CrossRef]
  20. Kumaran, G.; Menon, D.; Krishman Nair, K. Dynamic studies of rail track sleepers in a track structure system. J. Sound Vib. 2003, 268, 485–501. [Google Scholar] [CrossRef]
  21. Esveld, C. Modern Railway Track, 2nd ed.; Esveld: Zaltbommel, The Netherlands, 2002. [Google Scholar]
  22. KR CODE; KOREA RAIL NETWORK AUTHORITY: Daejeon, South Korea, 2012.
Figure 1. Photograph of typical defects by rail joint type. (a) Suspended joint; (b) supported joint.
Applsci 10 02299 g001
Figure 2. Schematics of the rail joint. (a) Cross section of the rail joint; (b) side view of the fishplate of the rail joint (unit: mm).
Applsci 10 02299 g002
Figure 3. Test sections and instrumented sensors. (a) Section A; (b) section B; and (c) section C.
Applsci 10 02299 g003aApplsci 10 02299 g003b
Figure 4. Examples of the measured dynamic wheel load and vertical rail displacement. (a) Section A; (b) section B; and (c) section C.
Applsci 10 02299 g004aApplsci 10 02299 g004b
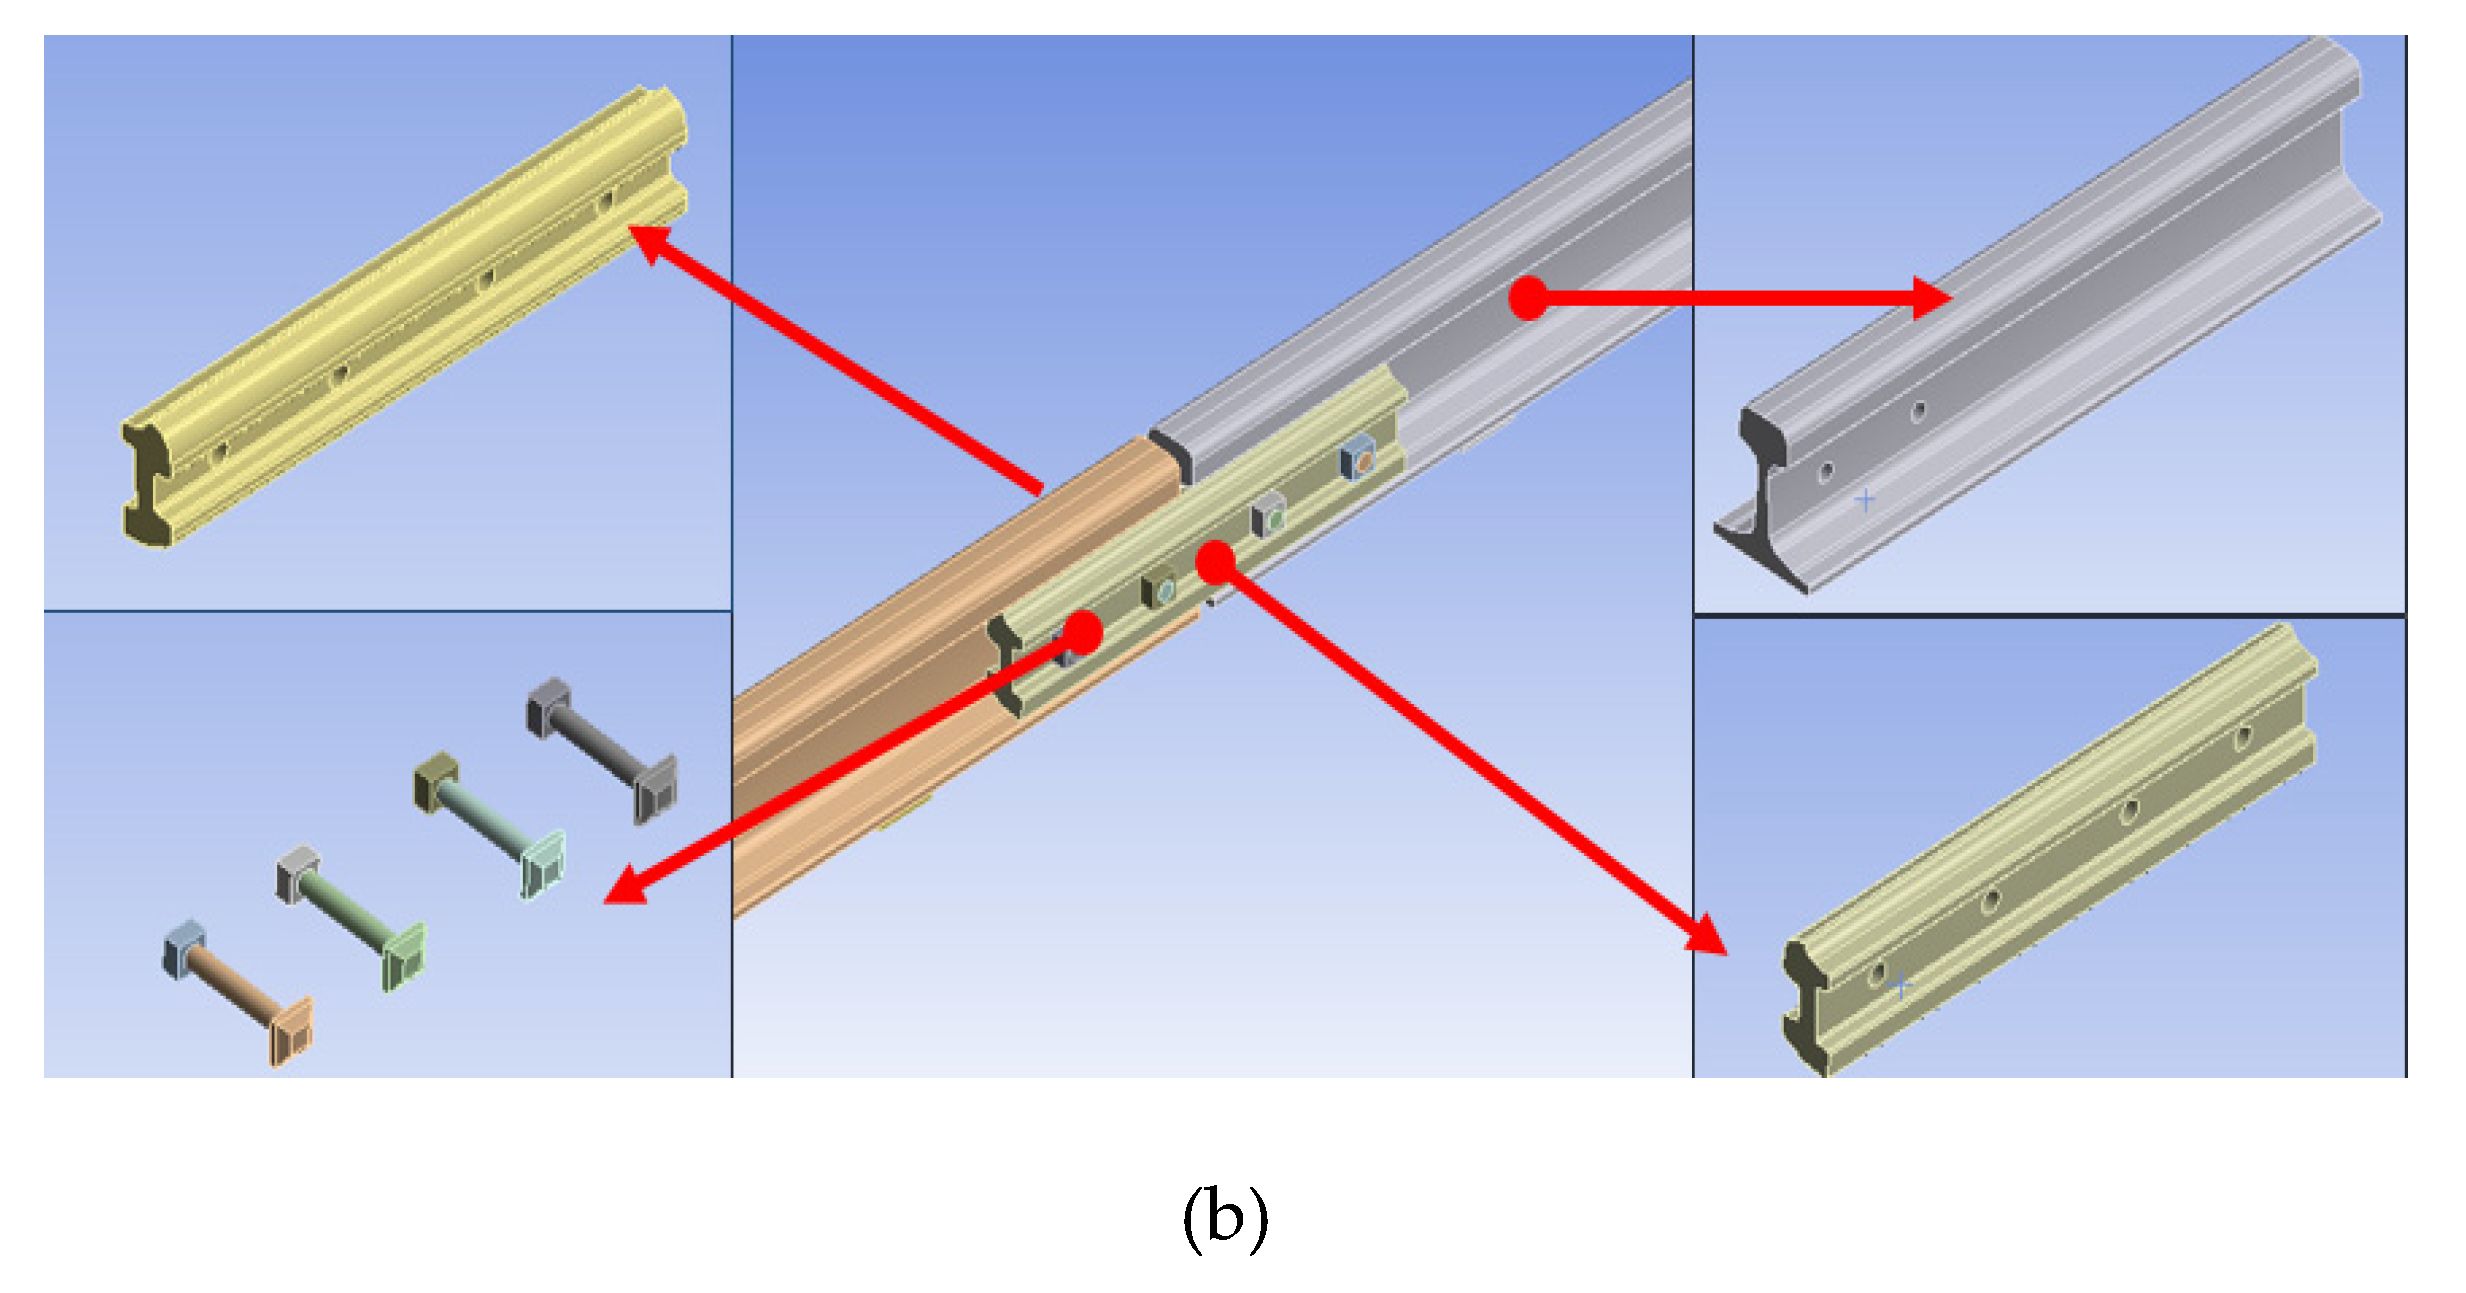
Figure 5. Finite element (FE) model of jointed rail track: (a) modeling and boundary conditions; (b) components of rail joint (fishplate, bolts and nuts, short rail with hole).
Applsci 10 02299 g005aApplsci 10 02299 g005b
Figure 6. Gaussian analysis of wheel load fluctuations: (a) section A (track impact factor (TIF) = 1.899); (b) section B (TIF = 1.207); (c) section C (TIF = 1.220); and (d) results of Gaussian analysis for each section (R2: normal distribution, y0: y intercept, xc: mean, w: standard deviation, A: probability density).
Applsci 10 02299 g006
Figure 7. Comparison of the measured vertical rail displacement between dynamic and pseudo-static for each test section: (a) section A; (b) section B; and (c) section C.
Applsci 10 02299 g007
Figure 8. Examples of mode shapes of the jointed rail. (a) Mode 1; (b) mode 3; (c) mode 4; (d) mode 5; (e) mode 8; and (f) mode 10.
Applsci 10 02299 g008
Figure 9. Results of finite element analysis (FEA). (a) Rail joint of vertical displacement; (b) detail of the rail section.
Applsci 10 02299 g009
Table 1. Properties of the test sections.
Curvature (m)Cant (mm)VdVoTrack Components
Rail TypeRail FastenerSleeper TypeBallast
Section A600151550 kg/m rail jointE-clipWoodGravel
Section B300140636050 kg/m CWR (GPW)1)Fast clip2)--
Section C100120333050 kg/m CWR (GPW)1)E-clip3)--
Vd: maximum design speed (km/h), Vo: operational speed (km/h), 1) CWR: continuous welded rail (GPW: gas pressure welded), 2) spring stiffness of rail supporting point: kst = 45 kN/mm (kdy = 68 kN/mm), 3) spring stiffness of rail supporting point: kst = 23 kN/mm (kdy = 29 kN/mm).
Table 2. Material properties of jointed rail track.
PropertiesRail (50 kgN)Wooden Sleeper
Section area (cm2)64.2360
Elastic modulus (kN/cm2)21,0001000
Weight density (kN/cm3)7.85 × 10−50.75 × 10−5
Poisson ratio (ʋ)0.300.33
Table 3. Comparisons of track impact factor (TIF) between the design value and measured result.
Test SectionKorean Design TIF
A (Rail Joint)B (CWR)C (CWR)
Measured TIF (2σ)1.8991.2071.2201.410 V/80
Measured/design value (%)134.6885.6086.52
Table 4. Comparisons of TIF evaluation methods.
DescriptionTrack Impact Factor (i)
Using Dynamic Wheel LoadRatio (%)Using Vertical Rail DisplacementRatio (%)
Section A (rail joint)1.899(+) 57.331.326(+) 24.16
Section B (CWR)1.207-1.068-
Section C (CWR)1.220(+) 1.081.141(+) 6.84
Table 5. Frequencies of the ten modes of the jointed rail.
Number of Model12345678910
Frequency (Hz)7.724.5529.59110.44157.38214.70263.15354.11369.68491.70
Table 6. Comparison of the finite element analysis (FEA) and field measurements results on the vertical rail displacements.
DescriptionVertical Rail Displacement (mm)Relative Error (%) { ( 1 ) ( 2 ) } ( 2 )
Measurement (1)FEA (2)
Section A1.3261.357−3
Section B1.0681.145−7
Section C1.1411.160−2