Abstract
The durability problem in high-strength steel wire used for bridge cable is becoming more and more severe due to chlorine salt erosion, with the primary corrosion morphology of steel wire surfaces being pit corrosion. To simplify the pitting formation process, a machine-cut notch was used to represent a corrosion pit caused by electrochemical non-uniformity, and then the fatigue performance and corrosion fatigue performance of steel wire with initial defects were studied experimentally. A new type of test device was designed to carry out synchronous pulsating fatigue loading on multiple wires. A series of S-N curves of steel wire with initial defects under various loading conditions was obtained, and the effects of the concentration and pH value of the corrosive solution, and the shape and dimension of the initial defect on the fatigue corrosion performance of steel wire for bridge cables were investigated. The results show that the test device designed in this paper can effectively perform the life test under the combined action of corrosive medium and fatigue load, and can considerably shorten the duration of the fatigue test. Under the combined action of corrosive medium and fatigue load, the life of steel wire with an initial defect is significantly lower than that without consideration of the corrosion effect. The corrosion fatigue performance of steel wire decreases with the increase of acidity of the corrosive solution, rather than the increase of solution concentration. The life of steel wire with a narrow deep notch is much lower than that with a wide shallow notch. The stress concentration leads to a sharp reduction in wire life.
1. Introduction
Cable-stayed bridges are one of the primary structural forms of modern bridges. Due to advantages including strong spanning capacity, beautiful appearance, long span, and construction convenience, this kind of bridge has been widely used in river and sea crossing projects. During their service period, in addition to bearing alternating loads such as vehicles, waves, and earthquakes, they are also affected by environmental erosion. Therefore, the combined effect of fatigue load and corrosive environment inevitably leads to the accumulation of damage and the attenuation of resistance in the bridge, significantly weakening the ability of the structure to bear normal service loads and sudden disaster loads [1,2,3,4,5].
The phenomenon of premature cracking or accelerated failure of metal materials caused by the synergistic action of corrosive medium and alternating stress is called corrosion fatigue (CF) failure. Its essence is the interaction between the electrochemical corrosion process and the mechanical process, and it is a serious failure form. Corrosive medium and fatigue load are the two core factors that affect the durability of cable steel wire. At present, most research only focuses on the influence of one of these two factors on the durability of steel wire, without considering their coupled effect. In terms of theoretical research, Sun [6] developed a continuum damage model and an algorithm to simulate the corrosion fatigue process of high-strength steel wires used in bridge cables. The developed model was used to predict the damage curves during the corrosion fatigue process based on the concept of continuum damage mechanics (CDM), and the algorithm was used to simulate the damage evolution process from local damage to failure. Wang [7] developed a numerical simulation method for the damage evolution of high-strength steel wire in bridge cables under the action of pre-corrosion and fatigue. Based on pitting accelerated crack nucleation theory in combination with continuum mechanics, cellular automata technology (CA) and finite element (FE) analysis, the damage evolution process of steel wire under pre-corrosion and fatigue was simulated. Liu [8] proposed a stochastic time-variant reliability assessment method to evaluate the safety of suspenders, where the time-variant model for deterioration of steel wires and probabilistic critical limit states based on crack depth and failure area were integrated, so as to consider the combined effect of corrosion and cyclic loading. In terms of experimental research, Nakamura [9] confirmed that the more serious the corrosion degree, the shorter the fatigue life of steel wire according to the fatigue test of artificial corroded steel wire. Nakamura [10] believed that the sharper the notch shape, the shorter the fatigue life of steel wire with machine-cut notch according to the comparison between mechanical properties of steel wire with notches and corroded steel wire. Chlistovsky [11] found that the shortening of fatigue life was mainly caused by the combined action of the initiation of corrosion pits, anode dissolution at the crack tip and hydrogen embrittlement. Suzumura [12] believed that the main reason leading to the fatigue performance deterioration of steel wire was corrosion pits on the steel wire surface. Stress concentration accelerated crack initiation and reduced fatigue life. By comparing the fatigue test results of corroded steel wire under different humidity conditions, it was found that the fatigue life of steel wire with the same degree of corrosion in a wet environment was lower than that in a dry environment. Based on experimental data, Rokhlin [13] established the empirical relationship between corrosion pit depth and CF life and obtained the empirical formula for predicting fatigue life.
There is also much work on the fatigue S-N curve. Prabhu et al. [14] proposed a novel probabilistic method, termed the S-N Paris law (SNPL) method, to quantify the uncertainties underlying the Paris’ law parameters, by finding the best estimates of their statistical parameters from the S-N curve data using a Bayesian approach. Hasegawa et al. [15] developed an estimation method for micropitting life. They established a S-N curve by using data from rolling contact fatigue tests and estimated histories of near-surface stresses (stress history) to reflect the relationship between micropitting life and stresses acting in the region affected by surface asperities (near-surface stress). Sonsino [16] mentioned conventional design codes based on their recommendations still on the common prejudice that an "endurance limit" exists. However, several investigations proved clearly that in the high-cycle regime, a decrease of fatigue strength with an increased number of cycles still occurred, even if corrosion or temperature effects were excluded. Therefore, the fatigue design of components submitted to loadings below the knee point of the S-N curve must consider this fact to avoid failures. Concerning the course of the S-N curve in the very high-cycle area, he gave material and manufacturing dependent recommendations. Jain et al. [17] developed a hybrid (the combination of micromechanics and tests) and multi-scale (damage in micro-scale linked to macroscale fatigue properties) method of predicting the S-N curve for every point in a short fiber composite. This proposed method was-based not only on tests but on a combination of manufacturing simulation, tests, and multi-scale mechanics. An extensive test program was undertaken to study the fatigue behavior of short fiber composites and validate the concept of the Master SN curve (MSNC) approach. The MSNC approach was compared with two commonly used approaches: strength-based scaling and the test-based interpolation. The results of the MSNC approach are in good agreement with the experimental results, and the MSNC approach was confirmed to be more accurate than the prevalent methods. Ciavarella [18] generalized the concept of “crack-like” notches to finite life, according to Critical Distance Method, found that the S-N curves of all notches were very close to the SN curves for cracked jaws up to a certain number of cyclic N, and suggested new simple estimates for SN curves of notches. However, there are few systematic studies on fatigue SN curve of high strength steel wire used for bridge cables.
It can be seen that most experimental studies tend to summarize experimental phenomena, but fail to establish quantitative and systematic fatigue S-N curves for reference by other researchers. Moreover, the corrosion fatigue properties of intact steel wire are generally studied, and the properties of corroded steel wire or steel wire with initial defects are rarely considered. However, for old steel wire that has been in use for many years, some defects appear on the surface of the steel wire due to environmental erosion. A large number of studies have proved that the corrosion of the steel wire surface under chlorine salt erosion is dominated by unilateral corrosion and pit corrosion [19]. Under the chlorine salt environment, the destruction of passivation membrane by reactive ion Cl- does not happen evenly across the whole metal surface; it happens locally first. That is to say, the destruction of the passivation film occurs only in an individual point or in a small area. This area, where the iron matrix is exposed, forms a potential difference with other areas. The iron matrix in this small area acts like a micro anode and is surrounded by the cathode formed by a large area of passivation film, thus forming a micro anode- macro cathode corrosion battery and accelerating the formation of local pitting pits. The morphology of corrosion pitting on the surface of corroded old steel wire can be abstracted into four shapes: semi-ellipsoidal shape, honeycomb shape, groove shape and saddle shape [20]. To simplify the electrochemical process of corrosion pit formation, a machine-cut notch is used to represent an erosion pit caused by a corrosive medium firstly. In addition, then, a new type of test device is designed to perform the synchronous pulsating fatigue loading on multiple wires and shorten the duration of fatigue tests. Subsequently, a series of S-N curves of steel wire with initial defects under different stress ranges and corrosive medium with different concentrations and pH values can be obtained. Finally, the effects of the concentration and pH value of corrosive solution, and the shape and dimension of initial defect on fatigue corrosion performance are investigated.
2. Experiment Scheme
2.1. Test Specimen
Numerous tests have shown that the initial corrosion pits on the surface of steel wire in old bridge cable caused by chlorine salt are mostly semi-ellipsoidal [21,22], and the non-circular shape can be regarded as equivalent to a circle through simple geometric treatment. The geometric shape of a circular pit can be described by two parameters: depth and width. To simplify the electrochemical process of corrosion pit formation, a machine-cut notch is used to represent an erosion pit caused by chlorine salt. A standard high-strength steel wire sample with a diameter of 7 mm and a tensile strength of 1670 MPa specified in Chinese Specification - GB/T 17101 [23] was selected as the test sample used in this paper, and the length of steel wire was taken to be 1100 mm. The steel grade of high-strength steel wire is S82B, and its chemical composition is shown in Table 1. Zn99.99 is the zinc used in the steel wire galvanized layer, and its chemical composition is shown in Table 2. The fabrication technology processing of steel wire includes pickling, phosphating, drawing, cleaning, hot-dip galvanizing, and stabilization, among which the stabilization process involves the heat treatment process. Domestic Stelmor air-cooled wire rod is used for bridge cables. The hot rolling temperature of austenitization is 950–850 °C, and the quenching temperature of the air-cooled wire used is 620–680 °C. As the heat capacity of air is low, and the thermal stability is weak, the transformation rate of pearlite is not stable during quenching. GB/T 17101 is the specification of hot-dip galvanized steel wire for bridge cables in China, and all information about the chemical composition and fabrication technology processing of steel wire is contained in Section 7.1 of this specification. This specification is generally in line with the requirements of BS ISO 19203:2018, and a description of the steel grade and chemical composition can be obtained from Section 7 of BS ISO 19203:2018. The schematic diagram of defects on the surface of steel wire is shown in Figure 1, and the photo of the steel wire specimen is shown in Figure 2.

Table 1.
Chemical composition of S82B.
Table 2.
Chemical composition of Zn99.99.
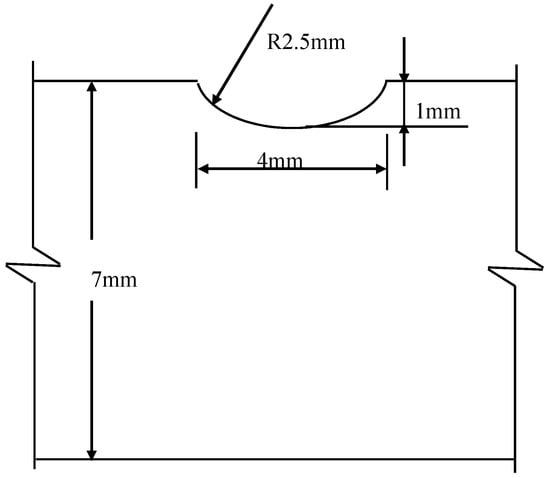
Figure 1.
Schematic diagram of machine-cut notch.
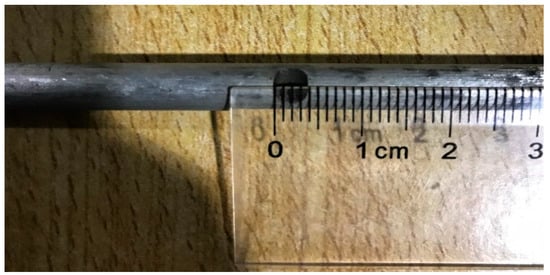
Figure 2.
Photo of steel wire specimen with machine-cut notch.
2.2. Testing Device
2.2.1. Fatigue Loading Device
In traditional fatigue tests, the fatigue load is directly applied to only one test specimen at a time through the fatigue testing machine (FTM). When the stress range is low, the test duration is extended. Due to the small size between the two clamps of FTM, it is difficult to place the corrosion box between the clamps. Therefore, the fatigue test of steel wire considering the corrosion factor is difficult to operate. Given the above reasons, in this paper, a new test device was designed, which is able to distribute the oil pressure provided by the FTM to the hydraulic jack (HJ) with a broad range to several HJs with a small range at the same time, to realize the synchronous fatigue loading of multiple wires. The schematic diagram of the device is shown in Figure 3, including FTM-INSTRON 8802, hydraulic jack with a broad range-HJ1 placed between the two clamps of FTM, computer, data acquisition equipment—National Instruments BNC-2111, hollow shaft type annular force sensor—JHBH, fatigue loading device (including 40#C channel steel, braces with a diameter of 20 mm, bolts, multiple hydraulic jacks with small range-HJ2, anchors, multiple steel wires), tubing and diverter valve, hydraulic hand pump with an oil storage capacity of 2700 cc. The FTM is shown in Figure 4. The fatigue loading device is shown in Figure 5.
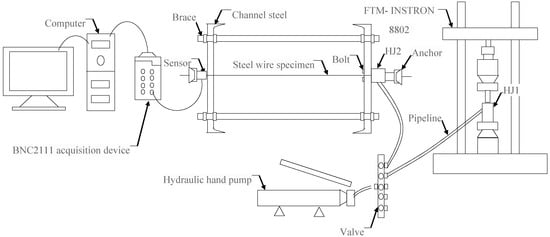
Figure 3.
Schematic diagram of loading device.
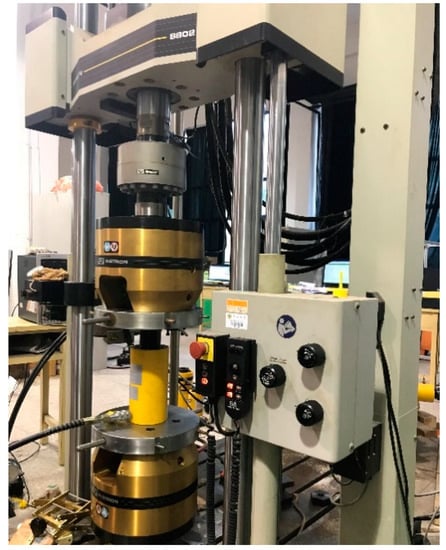
Figure 4.
Fatigue testing machine—INSTRON 8802.
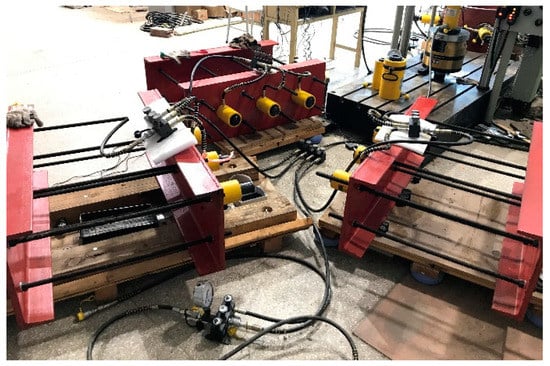
Figure 5.
Diagram of synchronous pulsation fatigue loading device.
First, the FTM is started, and the height of the clamp is adjusted to determine the position of HJ1. Then valve 1 of the diverter valve and pump oil into the tubing are opened. After filling, valve 1 is closed. In this way, an oil circuit is formed between HJ1 and HJ2 so that the fatigue load applied to HJ1 can be transferred to HJ2 through the tubing and the diverter valve. Finally, the fatigue load amplitude, frequency and other parameters of the FTM are set, and the fatigue load applied to the HJ1 is realized by the reciprocating movement of the piston. The oil pressure applied to HJ1 is equal to the fatigue load provided by the FTM divided by the cross-sectional area of the HJ1. The oil pressure of the HJ1 is transmitted to each HJ2 through each oil channel, so the force exerted on each HJ2 is equal to the oil pressure multiplied by the cross-sectional area of HJ2. This force is divided by the cross-sectional area of the steel wire to obtain the fatigue stress on the wire.
2.2.2. Counterforce Frame and Brace
The counterforce frame is made of channel steel. To improve the stability of the whole structure, steel wire goes through the predrilled holes on the channel steel and attached to the two sides of channel steel by using bolts. The counterforce frames and braces share the fatigue load transmitted from HJ1. The maximum tensile force is obtained by multiplying the maximum stress value by the sectional area of steel wire, which can be used to determine the model and size of HJ2. According to the size of the HJ2, the model of channel steel is chosen as 40#C, with a height of 400 mm, flange width of 104 mm and web thickness of 14.5 mm. The commercial software MIDAS GEN is used to build the finite element models of counterforce frames, braces and steel wires. The stress distribution of channel steel is obtained by applying equivalent pressure equal to the maximum tensile force at the end of steel wire. It can be found that the maximum stress of channel steel is higher than its yield strength, so a steel plate of the same material with the thickness of 20 mm is welded at the web of channel steel in order to significantly reduce the stress in channel steel. The finite element model of steel plate is established in MIDAS GEN [24], and eventually, the stress of channel steel is equal to 116 MPa, lower than the yield strength of ordinary carbon steel Q235. The numerical model and stress cloud diagram are shown in Figure 6. The diameters of the braces and wires are taken as 20 mm and 7 mm, respectively.
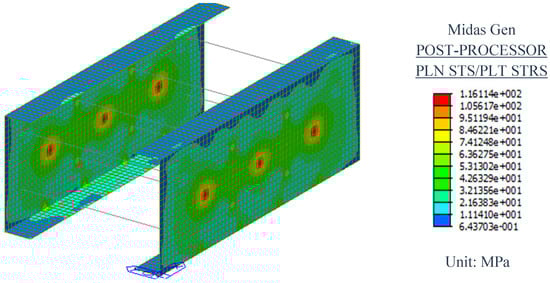
Figure 6.
The numerical model and stress cloud diagram of the test device (unit: MPa).
2.2.3. Data Acquisition and Monitoring Device
When the hydraulic system is working, the internal particles of the hydraulic oil collide with each other and produce violent friction. Hydraulic oil is also subject to friction resistance when passing through local obstacles. It causes the loss of oil in the oil circuit and the reduction of oil pressure, ultimately consuming the energy of the whole system. For the resistance in the oil circuit, there is an error between the load applied on steel wire and provided by FTM. A force sensor is used to monitor the actual load acting on steel wire and adjust it to the value set by FTM. Considering that the wire is circular, a hollow shaft type annular force sensor, named JHBH, is selected to monitor the fatigue loads, as shown in Figure 7. The working principle of this sensor is to convert the force received by the steel wire into the voltage signal. A data acquisition device, named NATIONAL INSTRUMENTS BNC-2111, is used to collect the voltage signal output from the sensor, as shown in Figure 8. The JHBH is connected to the BNC-2111 by transmission data line, and then to a computer. The computer records and reads the tension in each wire during fatigue loading. LabVIEW programming language [25] is used to calibrate the collected signal, to realize the conversion of the voltage signal to force signal and perform the monitoring and recording of fatigue load. Figure 9 demonstrates the process and working principle of data collection by LabView software, through which force loads applied on each steel wire can be collected synchronously. LabVIEW uses the graphical editing language G to write the program in block diagram form. Figure 10a,b shows the fatigue loads recorded by LabVIEW software, that is, the real-time forces applied to multiple steel wires and one of the wires, respectively.
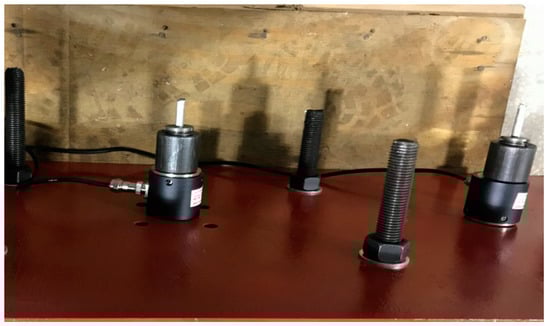
Figure 7.
Hollow shaft type annular force sensor—JHBH.
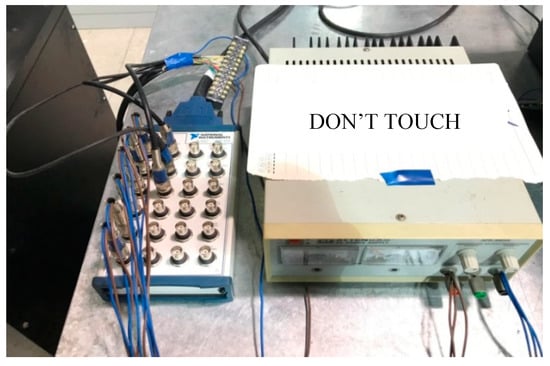
Figure 8.
Acquisition device—NATIONAL INSTRUMENTS BNC-2111.
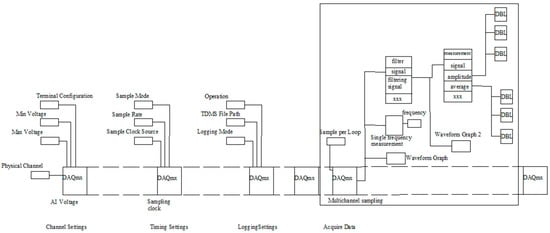
Figure 9.
Process and work principle of data collection by LabVIEW.
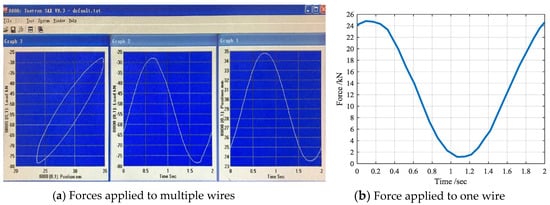
Figure 10.
Display interface of fatigue loads recorded by LabVIEW.
2.2.4. Corrosive Solution
According to the different purpose of the test, the corrosion test in the laboratory includes a chemical immersion test, semi-immersion test, inter-immersion test, etc. As shown in Figure 11, these tests can be used to simulate different corrosion conditions that may be encountered in practical applications. The method used in this paper belongs to the first type of corrosion test [26]. In this method, gauze or cotton is used to wrap the zone where the steel wire needs to be corroded. The corrosive solution is then dropped on the surface of gauze or cotton, and rapidly diffuses in the gauze or cotton to ensure full contact with the wire. Gauze or cotton can not only absorb the corrosive solution and then act on the steel wire, but can also ensure the entry of a certain amount of oxygen and reduce the volatility of the corrosive solution. It is an effective method for corrosion fatigue testing. Through preliminary experiments, it was found that one hour after each drop, the surface humidity of the gauze began to change significantly within an hour, and the moisture in the gauze nearly evaporated after about eight hours. Therefore, to ensure the constant concentration of corrosive solution on the surface of the steel wire, dropping was carried out every 10 min in the test. This interval is the same for all samples. Figure 12 shows the morphology of steel wire subjected to the corrosive solution and fatigue load at the initial stage and during a period of time.
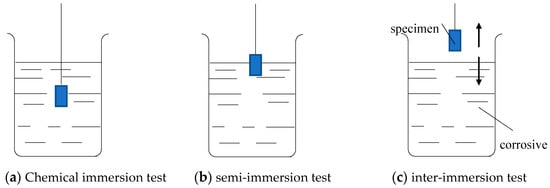
Figure 11.
Corrosion tests in the laboratory.
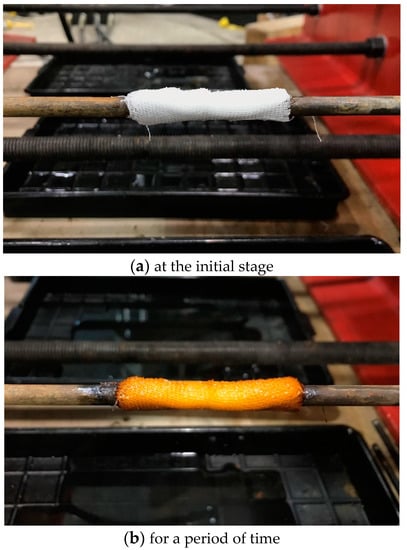
Figure 12.
Morphology of steel wire.
2.3. Test Method and Parameters
The purpose of this paper includes two aspects. One is to investigate the combined effect of corrosive solution and fatigue load on the corrosion fatigue performance of steel wire with a machine-cut notch, and another is to explore the effect of corrosive solution on the fatigue performance. The former uses the method proposed in Section 2.2.4. The surface of the steel wire is coated with cotton gauze, and the corrosive solution with different concentration and pH value is dropped on the cotton. At the same time, the fatigue load is applied on both ends of the steel wire to simulate the combination of corrosive solution and fatigue load. The latter obtains the fatigue life by applying synchronous pulsating fatigue load to steel wire, which has been corroded over 15 days and 30 days, respectively. The morphologies of the steel wire corroded over 15 and 30 days are shown in Figure 13a,b, respectively. The service life is studied by using the test device designed in this paper under the action of synchronous pulsating fatigue load.
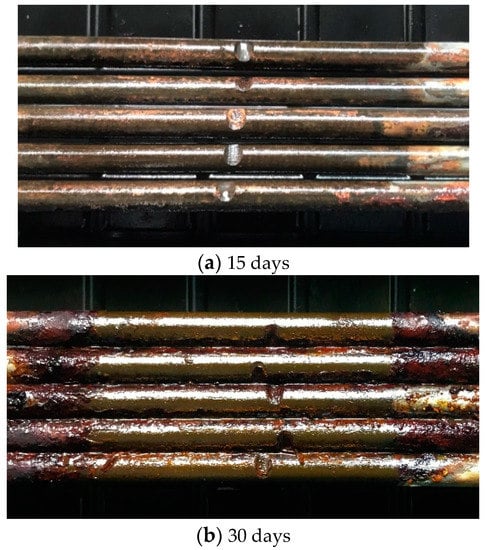
Figure 13.
Morphology of steel wire corroded in different times.
With the stress ratio unchanged, different stress ranges are selected for fatigue loading. When the wire is broken, the cyclic number is defined as the fatigue life under different stress ranges, which could reflect the fatigue performance of steel wire.
To investigate the influence of different corrosive solution and fatigue load on the life of steel wire, four kinds of corrosive solutions are used in the test, and the specimens are divided into seven groups of A–G. Fatigue test without consideration of corrosion was performed on the specimen in group A. The specimen in group B is subjected to NaCl solution with a pH of 7 and a concentration of 3.5 wt%. The specimen in group C is subjected to NaCl solution with a pH of 3 and a concentration of 3.5 wt%. The specimen in group D is subjected to NaCl solution with a pH of 7 and a concentration of 0.5 wt%. The specimen in group E is subjected to NaCl solution with a pH of 3 and a concentration of 0.5 wt%. The pH value is adjusted by acetic acid and sodium hydroxide and measured with precision paper with the accuracy of 0.1. The specimens in group F and G are corroded for 15 and 30 days, respectively, and then applied to fatigue loads.
The test is conducted at room temperature, and the loading waveform is the sinusoidal wave. The detailed design parameters are shown in Table 3. is the maximum stress; is the minimum stress; is the stress range, which can be expressed as ; is the mean stress, which can be expressed as ; is the stress ratio, which can be expressed as ; is the loading frequency.
Table 3.
Parameters of fatigue load.
3. Test Results and Analysis
Table 4 shows the life of steel wires in group A–G under different stress ranges. It can be seen that the life of steel wire with machine-cut notches increases as the stress range decreases. When the stress range decreases from 720 MPa to 360 MPa, the service life increases by more than 10 times. Comparing steel wire in group A with those in other groups, it can be seen that the corrosion significantly reduces the life of the steel wire. Comparing the wire in group B with that in group C (3.5 wt% NaCl with a pH value of 7 and 3, respectively), it can be seen that with the increase of acidity, the life of steel wire decreases significantly, and by more than 12.0% under all stress ranges. Comparing wire in group D with that in group E (0.5 wt% NaCl of pH 7 and 3, respectively), it can also be seen that the life of steel wire is significantly decreased by acid. Compared with the neutral solution, the acidic solution reduces the life to a greater extent. The life of steel wire subjected to acid solution is 14% lower than that of the neutral solution. When the stress range is low (such as 480 MPa and 360 MPa), the life of steel wire in the acid solution is reduced by more than 25% with respect to that in neutral solution. Comparing wire in group B with that in group D (0.5 wt% and 3.5 wt% NaCl with pH of 7, respectively), it can be seen that the increase of concentration actually increases the lifetime. Especially under the high-stress range (such as 720 MPa and 600 MPa), the life increases by 23% and 24%. By comparing the wires in two groups C and E (0.5 wt% and 3.5 wt% NaCl with pH of 3, respectively), it can also be seen that the increase of concentration still increases the life of steel wire. By comparing the wires in two groups F and G (Fatigue tests were carried out after 15 and 30 days of corrosion, respectively), it can be found that corrosion reduces the life of steel wire. Under a stress range of 720 MPa, the life of steel wire that corroded for 15 days is reduced by 27% compared with that of steel wire that has not been corroded; and under a stress range of 360 MPa, it is reduced by 20%.
Table 4.
The life of steel wire in groups A-G.
A large number of tests have proved that the fatigue life and stress range of components under constant load conform to a linear relationship in the log–log coordinates. The equation of stress range and fatigue life is usually in the form of a power exponent, as shown in Equation (1):
where m and C are the material constants. In logarithmic form, the following formula can be obtained:
Based on the curve fitting toolbox in MATLAB, the logarithmic S-N curves and linear correlation coefficients of specimens in group A-G can be obtained as follows:
It can be seen that the linear correlation coefficients of the fitting formulas of the specimens in groups A-G are all close to 1. The closer the correlation coefficient is to 1, the higher the linear correlation property is. The results show that that the fatigue stress range and life of high-strength steel wire maintain a good linear relationship under the double logarithmic coordinate, and the different slope of the curve reflects the different corrosion fatigue characteristics of steel wire under different environmental conditions.
Figure 14 shows the logarithmic S-N curves of the steel wire with machine-cut notch subjected to the fatigue loads and sodium chloride solution, which are the power exponential curves obtained by MATLAB fitting toolbox. The five curves correspond to corrosion free, by sodium chloride at pH value of 7 and concentration of 3.5 wt%, by sodium chloride at pH value of 7 and concentration of 0.5 wt%, by sodium chloride at pH value of 3 and concentration of 3.5 wt%, and by sodium chloride at pH value of 3 and concentration of 0.5 wt%, respectively.
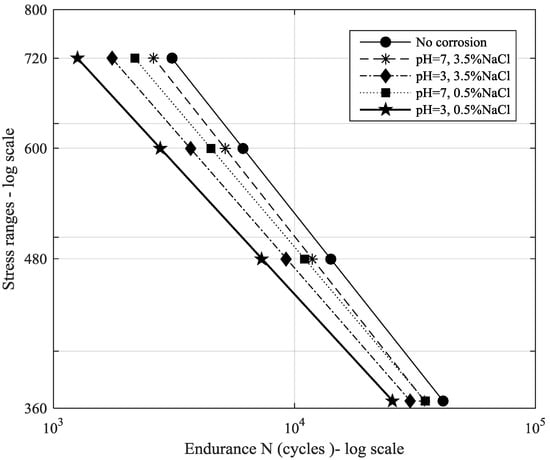
Figure 14.
Logarithmic S-N curves of steel wire with machine-cut notch subjected to the fatigue load and sodium chloride solution.
It can be seen that, with the increase in stress range, the life of steel wire is significantly reduced. The life of steel wire corroded by the corrosive medium is much shorter than that in air, which indicates that the interaction between corrosive medium and fatigue load accelerates the material failure.
It can be seen from Figure 14 that, under the same stress range, the steel wire without consideration of corrosion has the longest fatigue life, followed by steel wire with a pH of 7, and steel wire with a pH of 3 has the shortest life. The life of steel wire is shortened with increasing acidity of corrosion solution. When the stress range is large, the difference between the three is relatively small. In Figure 14, when the stress range is equal to 360 MPa, the life of wire subjected to NaCl with a pH of 7 and a concentration of 0.5 wt% is 16% shorter than that of wire without corrosion, while that subjected to NaCl with pH of 3 and concentration of 0.5 wt% is reduced by 36%.
It can also be seen from Figure 14 that, under the same stress range, the steel wire without corrosion has the longest fatigue life, followed by steel wire subjected to the corrosion concentration of 3.5 wt%, and steel wire subjected to the corrosion concentration of 0.5 wt% has the shortest life. The life of steel wire does not decrease with the increase of the concentration of NaCl solution. The reason for this may be that the excessive concentration of chloride ions affects the dissolution and diffusion of oxygen in the solution, so that the corrosion effect of the solution on the steel wire is reduced.
4. Effect of Depth of Semi-Ellipsoidal Notch on Wire Life
Semi-ellipsoidal notches with different depths are used to investigate the influence of depth of machine-cut notches on the corrosion fatigue performance of steel wire. The depths are taken as 0.6 mm, 0.8 mm, 1.0 mm, 1.1 mm and 1.2 mm, respectively. The widths of semi-ellipsoidal notches are all 4 mm. The schematic diagram of steel wire and corresponding wire specimen with different semi-ellipsoidal notches are shown in Figure 15a,b.
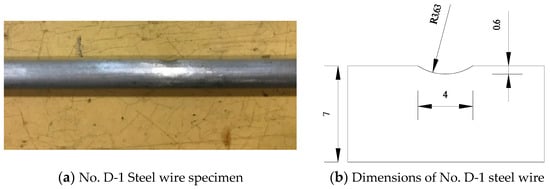
Figure 15.
Wire specimens and schematic diagram of steel wire with different semi-ellipsoidal notches of different widths.
Table 5 shows the life of steel wires with semi-ellipsoidal notches of different depths. It can be seen that the life of steel wire decreases obviously with the increase of the depth of the semi-ellipsoidal notch. When the notch depth increases from 0.6 mm to 0.8 mm, the life of the steel wire decreases sharply. When the notch depth continues to increase from 0.8 mm, the influence of depth on the life is still significant, but not as significant as when the depth increases from 0.6 mm to 0.8 mm.
Table 5.
The life of steel wire with semi-ellipsoidal notches of different depths.
Figure 16 shows the Logarithmic S-N curve of steel wire with different semi-ellipsoidal notches, which are the power exponential curves obtained by MATLAB fitting toolbox. When the stress range is 720 MPa and the depth of the semi-ellipsoidal notch increases from 0.6 mm to 0.8 mm, the service life is reduced by 25%. When the depth of the semi-ellipsoidal notch increases from 0.6 mm to 1.2 mm, the service life is reduced by 49%. When the stress range is 600 MPa and the depth of the semi-ellipsoidal notch increases from 0.6 mm to 0.8 mm, the service life is reduced by 67%. When the depth of the semi-ellipsoidal notch increases from 0.6 mm to 1.2 mm, the service life is reduced by 78.8%. When the stress range is 480 MPa and the depth of the semi-ellipsoidal notch increases from 0.6 mm to 0.8 mm, the service life is reduced by 53%. When the depth of the semi-ellipsoidal notch increases from 0.6 mm to 1.2 mm, the service life is reduced by 77.3%. When the stress range is 360 MPa and the depth of the semi-ellipsoidal notch increases from 0.6 mm to 0.8 mm, the service life is reduced by 50.7%. When the depth of the semi-ellipsoidal notch increases from 0.6 mm to 1.2 mm, the service life is reduced by 63.7%. It can be seen that under each stress range when the depth of machine-cut notch increases from 0.6 mm to 0.8 mm, the decline of wire life is the highest and the life falls by more than 25%; when the depth of semi-ellipsoidal notch increases from 0.6 mm to 1.2 mm, the life falls by more than half.
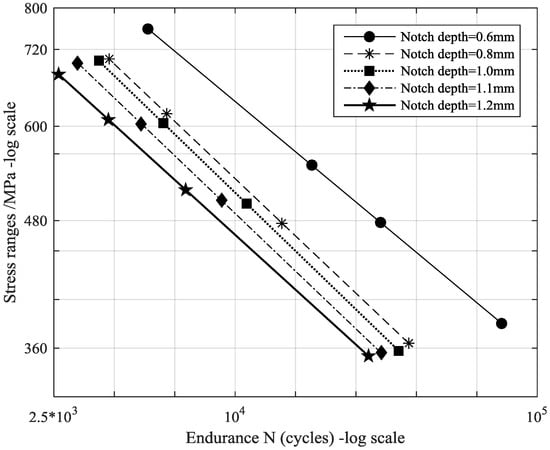
Figure 16.
Logarithmic S-N curve of steel wire with semi-ellipsoidal notch of different depth.
5. Effect of Width of Semi-Ellipsoidal Notch on Wire Life
Semi-ellipsoidal notches with different widths are used to investigate the influence of width of machine-cut notches on the corrosion fatigue performance of steel wire. The widths are taken as 3 mm, 4 mm, 5 mm, 6 mm and 7 mm, respectively. The depths of semi-ellipsoidal notches are all 1 mm. The schematic diagram of steel wire and corresponding wire specimen with different notches are shown in Figure 17.
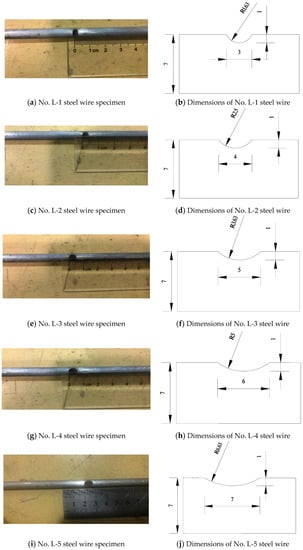
Figure 17.
Wire specimens and schematic diagram of steel wire with semi-ellipsoidal notches of different widths.
Table 6 shows the cyclic numbers of steel wire with semi-ellipsoidal notches of different widths. It can be seen that the life of steel wire increases with the reduction of stress range. At the same time, with the increase of notch width, the life of steel wire increases obviously. When the depth of the notch is constant, the width determines the stress concentration at the bottom of the notch. The smaller the width, the higher the stress concentration at the bottom of notch, the smaller the fatigue life of wire.
Table 6.
The life of steel wire with semi-ellipsoidal notches of different widths.
Figure 18 shows the S-N curves of wire life with a machine-cut notch, which are the power exponential curves obtained by MATLAB fitting toolbox. It can be seen that the life of steel wire increases gradually with the increase of notch width. When the stress range is 720 MPa and the width of semi-ellipsoidal notch increases from 3 mm to 7 mm every 1 mm, the life of steel wire increases by 56%, 10%, 14% and 12% respectively. When the stress range is 600 MPa and the width of semi-ellipsoidal notch increases from 3 mm to 7 mm every 1 mm, the life of steel wire increases by 37%, 17%, 11% and 18%, respectively. When the stress range is 480 MPa and the width of the semi-ellipsoidal notch increases from 3 mm to 7 mm every 1 mm, the life of the steel wire increases by 19%, 4%, 11% and 23%, respectively. When the stress range is 360 MPa and the width of the semi-ellipsoidal notch increases from 3 mm to 7 mm every 1mm, the life of the steel wire increases by 56%, 6%, 1% and 8%, respectively. It can be seen that when the stress range is higher, the life of the steel wire is lower, and the change rate of life is lower when the notch width is 4–6 mm. The growth rate of wire life is highest and by more than 20% when the width of the defect increases from 3 mm to 4 mm.
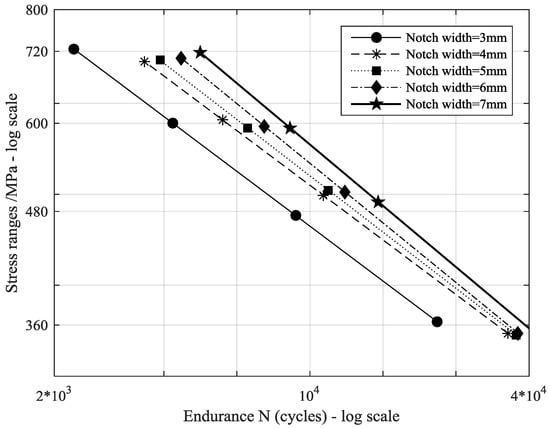
Figure 18.
Logarithmic S-N curve of steel wire with notch of different width.
6. Effect of the Shape of Machine-Cut Notch on Wire Life
Steel wires with a semi-ellipsoidal notch, trapezoidal notch and V-notch are selected to investigate the influence of notch shape on corrosion fatigue performance of steel wire. The depth and width of the three notches are the same, as shown in Figure 19.
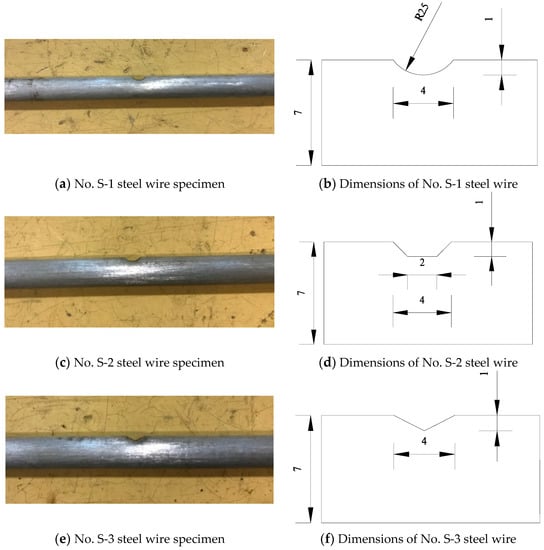
Figure 19.
Wire specimens and schematic diagram of steel wire with machine-cut notches of different shapes.
Table 7 shows the life of steel wire with different notches. It can be seen that the life of steel wire increases as the stress range decreases. At the same time, under the same stress range, steel wire with a semi-ellipsoidal notch has the highest fatigue life, followed by that with trapezoid notch, and that with V-notch has the lowest fatigue life. When the depth and width of notch are determined, its shape determines the degree of stress concentration. Due to the V-notch having the highest stress concentration, the life of the steel wire with the machine-cut V-notch is the lowest.
Table 7.
The life of steel wire with machine-cut notches of different shapes.
Figure 20 shows the logarithmic S-N curves of steel wire with semi-ellipsoidal notch, trapezoidal notch and V-notch fitted by the power function in MATLAB. It can be seen that under the same stress range, the steel wire with V-notch has the shortest life, followed by that with trapezoidal notch, and steel wire with elliptic defect has the highest life.
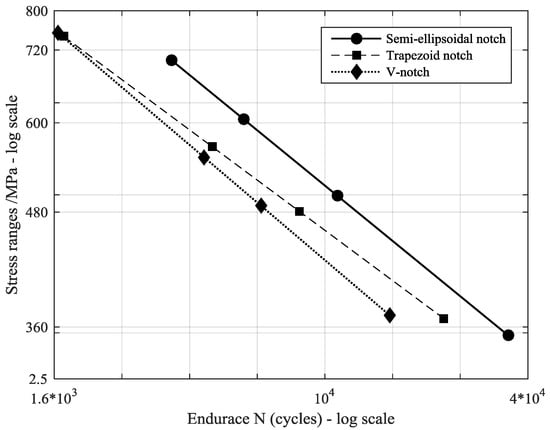
Figure 20.
Logarithmic S-N curve of steel wire with different notches of different shapes.
7. Conclusions
In this paper, the corrosion fatigue performance of bridge wire with initial defects was studied. To simplify the initiation process of pitting pits caused by electrochemical inhomogeneity, machine-cut notches are used to be equal to the corrosion pits. The influence of the action mode of corrosion and fatigue, the concentration of corrosive solution and pH value, the shape and dimension of machine-cut notch on the fatigue life of steel wire with the initial defect was explored, and the S-N curves of steel wire subjected to the corrosive solution and fatigue load were obtained. The main conclusions are as follows:
(1) The test device designed in this paper can effectively realize the synchronous pulsation fatigue loading, and simultaneously apply different fatigue stress ranges to multiple steel wires, which greatly reduces the test time;
(2) With the increase of the fatigue stress range, the life of steel wire decreases significantly. Under the coupling action of CF, the life of steel wire with an initial defect is significantly lower than that only subjected to fatigue loads.
(3) Under the coupling action of CF, the life of steel wire decreases with the increase of acidity. When the stress range is equal to 360 MPa, the life of wire subjected to NaCl with a pH of 7 and a concentration of 0.5 wt% is 16% shorter than that of wire without corrosion, while that subjected to NaCl with a pH of 3 and a concentration of 0.5 wt% is reduced by 36%. However, the life of steel wire does not decrease with the increase of concentration of NaCl solution. The reason for this may be that the excessive concentration of chloride ions affects the dissolution and diffusion of oxygen in the solution so that the corrosion effect of the solution on the steel wire is reduced.
(4) The life of steel wire decreases gradually with the increase of depth and the decrease of width of semi-ellipsoidal notch. Under each level stress range, when the depth of semi-ellipsoidal notch increases from 0.6 mm to 0.8 mm, the decline of wire life is the highest, and the life falls by more than 25%; when the depth of semi-ellipsoidal notch increases from 0.6 mm to 1.2 mm, the life falls by more than half. The growth rate of wire life is highest, and by more than 20% when the width of the defect increases from 3 mm to 4 mm. The stress concentration will lead to a sharp reduction in wire life. Under the same stress range, the steel wire with V-notch has the shortest life, followed by the steel wire with a trapezoidal notch, and steel wire with the semi-ellipsoidal defect has the highest life. When the stress ranges are equal to 720 MPa and 360 MPa, the life of steel wire with the semi-ellipsoidal notch is more than twice of that with V-notch.
Author Contributions
Conceptualization, Y.W.; Methodology, Y.W.; Software, W.Z.; Validation, Y.Z.; Formal Analysis, W.Z.; Writing-Original Draft Preparation, Y.W.; Writing-Review & Editing, Y.Z.; Funding Acquisition, Y.W. All authors have read and agreed to the published version of the manuscript.
Acknowledgments
The works described in this paper are substantially supported by the grant from National Natural Science Foundation of China (Grant No. 51678135); Natural Science Foundation of Jiangsu Province (No. BK20171350); Six Talent Peak Projects in Jiangsu Province (JNHB-007); China Scholarship Council (No.201906090261), which are gratefully acknowledged.
Conflicts of Interest
The authors declare no conflicts of interest.
References
- Hamilton, H.R.; Breen, J.E.; Frank, K.H. Investigation of Corrosion Protection Systems for Bridge Stay Cables; Research Report No. 1264-3F; Center for Transportation Research, Bureau of Engineering research, University of Texas at Austin: Austin, TX, USA, November 1995. [Google Scholar]
- Wang, Y.; Wang, Z.; Zheng, Y.Q. Analysis of Fatigue Crack Propagation of an Orthotropic Bridge Deck Based on the Extended Finite Element Method. Adv. Civ. Eng. 2019, 2019, 6319821. [Google Scholar]
- Wang, Y.; Zheng, Y.Q. Research on the Microscopic Damage Evolution of Steel Wire with Pre-corroded Defects in Cable-stayed Bridges. Appl. Sci. 2019, 9, 3113. [Google Scholar] [CrossRef]
- Zhang, Z.; Zhang, M.; Chang, Y.; Esche, S.; Chassapis, C. Real-time 3D reconstruction for facilitating the development of game-based virtual laboratories. Comput. Educ. J. 2016, 7, 85–99. [Google Scholar]
- Zhang, Z.; Zhang, M.; Tumkor, S.; Chang, Y.; Esche, S.; Chassapis, C. Integration of physical devices into game-based virtual reality. Int. J. Online Eng. 2013, 9, 25–38. [Google Scholar] [CrossRef][Green Version]
- Sun, B. A continuum model for damage evolution simulation of the high strength bridge wires due to corrosion fatigue. J. Constr. Steel Res. 2018, 146, 76–83. [Google Scholar] [CrossRef]
- Wang, Y.; Zheng, Y.Q. Simulation of Damage Evolution and Study of Multi-Fatigue Source Fracture of Steel Wire in Bridge Cables under the Action of Pre-Corrosion and Fatigue. CMES Comput. Model. Eng. Sci. 2019, 120, 375–419. [Google Scholar] [CrossRef]
- Liu, Z.; Guo, T.; Hebdon, M.H.; Zhang, Z. Corrosion Fatigue Analysis and Reliability Assessment of Short Suspenders in Suspension and Arch Bridges. J. Perform. Constr. Facil. 2018, 32, 04018060. [Google Scholar] [CrossRef]
- Nakamura, S.; Suzumura, K.; Tarui, T. Mechanical properties and remaining strength of corroded bridge wires. Struct. Eng. Int. 2004, 14, 50–54. [Google Scholar] [CrossRef]
- Nakamura, S.; Suzumura, K. Experimental study on fatigue strength of corroded bridge wires. J. Bridge Eng. 2013, 18, 200–209. [Google Scholar] [CrossRef]
- Chlistovsky, R.M.; Heffernan, P.J.; DuQuesnay, D.L. Corrosion-fatigue behaviour of 7075-T651 aluminum alloy subjected to periodic overloads. Int. J. Fatigue 2007, 29, 1941–1949. [Google Scholar] [CrossRef]
- Nakamura, S.; Suzumura, K. Hydrogen embrittlement and corrosion fatigue of corroded bridge wires. J. Constr. Steel Res. 2009, 65, 269–277. [Google Scholar] [CrossRef]
- Rokhlin, S.; Kim, J.-Y.; Nagy, H.; Zoofan, B. Effect of pitting corrosion on fatigue crack initiation and fatigue life. Eng. Fract. Mech. 1999, 62, 425–444. [Google Scholar] [CrossRef]
- Prabhu, S.R.; Lee, Y.J.; Park, Y.C. A new Bayesian approach to derive Paris’ law parameters from S-N curve data. Struct. Eng. Mech. 2019, 69, 361–369. [Google Scholar]
- Hasegawa, N.; Fujita, T.; Uchidate, M.; Abo, M.; Kinoshita, H. Estimation Method of Micropitting Life from S-N Curve Established by Residual Stress Measurements and Numerical Contact Analysis. Tribol. Online 2019, 14, 131–142. [Google Scholar] [CrossRef]
- Sonsino, C. Course of SN-curves especially in the high-cycle fatigue regime with regard to component design and safety. Int. J. Fatigue 2007, 29, 2246–2258. [Google Scholar] [CrossRef]
- Jain, A.; Veas, J.M.; Straesser, S.; Van Paepegem, W.; Verpoest, I.; Lomov, S.V. The Master SN curve approach–A hybrid multi-scale fatigue simulation of short fiber reinforced composites. Compos. Part A Appl. Sci. Manuf. 2016, 91, 510–518. [Google Scholar] [CrossRef]
- Ciavarella, M.; D’Antuono, P.; Demelio, G. Generalized definition of “crack-like” notches to finite life and SN curve transition from “crack-like” to “blunt notch” behavior. Eng. Fract. Mech. 2017, 179, 154–164. [Google Scholar] [CrossRef]
- Shen, D.J.; Wu, S.X. Experimental research on corroded steel bar performance and corrosion model in concrete under atmosphere environment. Chin. Concr. Cem. Prod. 2004, 3, 46–50. [Google Scholar]
- Qian, Y.; Sun, C.Z.; Miao, C.Q. Research on pit characteristics of corroded cables wire for cable-supported bridge. Highw. Eng. 2015, 40, 13–16. [Google Scholar]
- Zeng, H. Study on Fatigue and Fracture Properties of Corroded Steel Bar. Master’s Thesis, Central South University, Changsha, China, 2014. (In Chinese). [Google Scholar]
- Yu, J. The Research of the Fatigue Reliability of Bridge Cables under Corrosive Environment. Master’s Thesis, Southeast University, Nanjing, China, 2016. (In Chinese). [Google Scholar]
- The State General Administration of Quality Supervision, Inspection and Quarantine of the People’s Republic of China. GB/T 17101-2008. Hot-dip Galvanized Steel Wires for Bridge Cable; The State General Administration of Quality Supervision, Inspection and Quarantine of the People’s Republic of China: Beijing, China, 2008. (In Chinese)
- Tang, X.D.; Chen, H.; Guo, W.D. Operation Details of Typical Cases of Midas Gen; China Architecture & Building Press: Beijing, China, 2018. (In Chinese) [Google Scholar]
- Lin, J.; Lin, Z.Y.; Zheng, F.R. LabVIEW Virtual Instrument Programming from Entry to Mastery; Posts and Telecommunications Press: Beijing, China, 2010. (In Chinese) [Google Scholar]
- Li, J.Q.; Du, C.W. Corrosion Test Method and Monitoring Technology; China Petrochemical Press: Beijing, China, 2015. (In Chinese) [Google Scholar]
© 2020 by the authors. Licensee MDPI, Basel, Switzerland. This article is an open access article distributed under the terms and conditions of the Creative Commons Attribution (CC BY) license (http://creativecommons.org/licenses/by/4.0/).