Abstract
Traditional applanation tonometry techniques lack the necessary accuracy and reliability for measuring the intraocular pressure (IOP), and there is still a need for a reliable technique for in vivo diagnosis. A single laser-induced cavitation bubble event was optically monitored in order to precisely measure the first collapse time of the cavitation bubble, which presents a direct dependence on the liquid pressure. This can certainly be done within the IOP range. We now extend the partial transmittance modulation (STM) technique to determine its feasibility for directly measuring the IOP by studying the nanosecond (ns) pulsed laser-induced cavitation bubble dynamics for an externally pressurized fresh ex vivo porcine eye. The results demonstrate that it is possible to monitor the IOP by detecting the light of a continuous-wave (CW) laser beam which is intensity modulated by the bubble itself. This technique currently presents a measurement resolution of about 4 mmHg in the 5 to 50 mmHg pressure range, indicating the feasibility of this approach for measuring IOP. This technique provides a direct measurement within the anterior eye chamber, avoiding common pitfalls in IOP diagnosis, such as errors due to patient movement, varying physical properties of the eye globe, or central cornea thickness (CCT) effects.
1. Introduction
Nowadays, glaucoma represents the second leading cause of blindness worldwide Quigley and Broman [1], caused by the progressive increase of the intraocular pressure (IOP) above 22 mmHg; a normal IOP range is within the 10 to 21 mmHg range. Ocular hypertension (OH) could be due to a physiologically increased production of aqueous humor or to an anatomical obstruction in drainage of the aqueous humor (AH) from the anterior chamber [2] (AC), towards the trabecular meshwork (Schlemm’s canal), or in the uveoscleral pathway; the IOP then increases above normal, causing damage to the optic nerve [3,4]. Various instruments, including corneal pachymeters [5], Humphrey visual field analyzers, gonioscopes [6], ophthalmoscopes [7], and tonometers [8], have been applied to diagnose glaucoma and the related damage.
Different devices and methods for IOP measurement have been developed. Since its introduction, Goldmann applanation tonometry has been considered the gold standard for measuring IOP [8]. However, accurate IOP measurements are highly dependent on patient cooperation and corneal characteristics, such as central corneal thickness (CCT), corneal curvature, hydration, elasticity, hysteresis, and rigidity [5,9,10,11,12], requiring real-time systems to know the biomechanical properties of the cornea to then compensate in the IOP measurement, such as with the ocular response analyzer (ORA; Reichert Ophthalmic Instruments, Depew).
The use of lasers in biomedical applications has been growing steadily as the technology offers more stability, precision, and resolution in the measurements. For example, in ophthalmology, laser-induced breakdown (LIB) is used in procedures of intraocular microsurgery such as iridotomy, trabelopunction, intrastromal corneal ablation, posterior synechia, and posterior capsulotomy, among others [13,14].
The LIB phenomenon is the partial or complete ionization of a solid, liquid, or gas through thermal or electromagnetic excitation, producing a typical electron density (plasma) above 10–10 e/cm [15]. While laser-induced thermal breakdown occurs for continuous-wave (CW) or repetitive-pulse lasers in [16,17], optical breakdown occurs primarily for single short pulse exposures in the microsecond to femtosecond time regime [18,19,20]. In both cases, LIB in liquids generates cavitation bubbles, shock waves, and luminescence. The cavitation bubble grows to a maximum size, then collapses to generate a number of subsequent bubbles; this bouncing behavior generates shock waves on each bubble collapse.
The focus of this work is about the implementation and validation of the spatial transmittance modulation (STM) technique [21,22,23] using a suitable IOP sensor applied to ex vivo pig eyes under normal and glaucoma conditions (IOP between 10 to 60 mmHg). The STM technique provides the bubble collapse time data accurately through optical intensity vs. time trace. In addition, the proposed technique was previously applied and validated using a pressure sensor in a cubic quartz chamber, and then in an artificial model of a human eye, with pressures from 0 to 300 mmHg above the atmospheric pressure [16,23]. In this paper, we analyze and discuss the relationship between the induced IOP in ex vivo pig eyes and the cavitation bubble collapse time. We also study the cavitation bubble collapse time’s dependence on the laser pulse energy. In addition, we performed an assessment of potential photo-damage caused on the cornea by the pump laser pulses.
2. Materials and Methods
2.1. Tissue Collection
A total of eighteen pig eyes were used in different experimental runs. The pigs (Sus domestica) used for tissue collection were obtained through a donation from the Slaughterhouse of Ensenada, BC, which complies with the SAGARPA and SENASICA ethical norms, tissues were handeled according to NOM-062-1999. After the sacrifice, the eyes were enucleated and transported in an isolated recipient with ice for later manipulation in the laboratory. The conjunctiva, extraocular muscles, and other extraocular tissues were removed and placed in red bags for their handling and disposal under local regulations. The optic nerve was preserved cold in saline buffer (PBS: NaCl 137 mM + KCl 2.7 mM + Na2HPO4 10 mM + KH2PO4 1.8 mM ) pH 7.4, 1× to induce the IOP with a perfusion system.
To ensure a large reflection surface on the iris by the incident probe beam, each pig eye was pre-rinsed with water and placed corneal-side-up for the application of 3-4 pilocarpine drops. Figure 1 shows the relaxation effect of pilocarpine on the iris after its application. The eyes were stored individually with phosphate-buffered saline solution (PBS) at 2 C. Furthermore, the eyes were manipulated within 8 h of their collection to avoid cloudiness in the cornea.
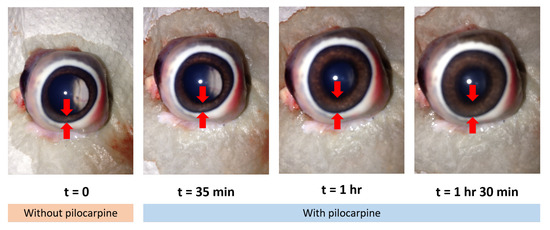
Figure 1.
Action of the pilocarpine for the iris relaxation.
2.2. STM Technique
The experiments were performed with a pump–probe system to conform the STM technique. We used a 9 ns pulsed Nd:YAG (532 nm) laser (Minilite II; Continuum, Inc.) with 25 mJ nominal energy per pulse as the pump laser. The probe laser was a continuous-wave HeNe laser at 632.8 nm (Edmund Optics) with a nominal 10 mW output power; it was used for monitoring the temporal evolution of the cavitation bubbles.
The STM technique is defined as the modulation of the optical transmission of a CW probe beam generated by the cavitation bubble itself. A cavitation bubble acts as an obstacle, specifically as a negative lens, causing the collimated probe beam to be deflected and scattered (by the bubble contents), thereby affecting the total amount of light that reaches the detector. With this technique, it is possible to capture the whole temporal evolution of a cavitation bubble by applying a single pump pulse; it offers high-resolution oscilloscope traces, which result from the cavitation bubble’s growth and its first and subsequent collapses [21,22,23].
The experimental setup used for the present work is shown schematically in Figure 2. A fraction of the energy of the pump beam was monitored with Photodiode 2 ( = 6.2 s, DET10A, Thorlabs), which was previously cross-calibrated against a pyroelectric energy monitor (PM320E, Thorlabs). The pump laser beam was first expanded by a Galilean telescope ( and , M = 2.5×) and, later, it was focused with a 12 mm microprocessing lens. The measured beam quality, M-squared, for the pump laser was 6.9, implying a beam waist radius of 3.2 m (1/), which agreed well within the measured beam size found when focused on a glass slide and imaged back onto the calibrated charge-coupled device type camera (CCD-camera, model: PLB776U, Pixelink) using the retro-reflected image relay system, named the equivalent target plane (ETP). With the ETP system, it was possible to determine the precise location of the laser beam’s focus on the cornea surface when a new pig eye was placed. Then, the beam waist was displaced about one millimeter (1 mm) below the corneal surface to position it inside the AC.
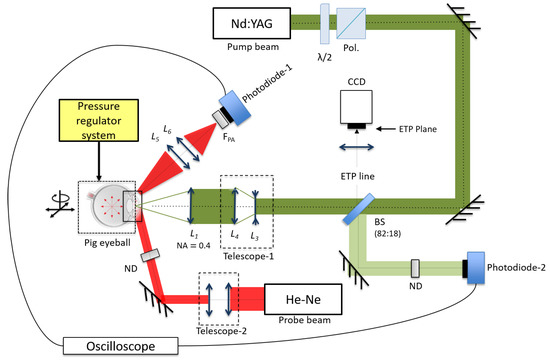
Figure 2.
Experimental setup for the spatial transmittance modulation (STM) technique and the equivalent target plane (ETP) system in ex vivo pig eyes.
The 632.8 nm HeNe probe beam was collimated down (by means of Telescope 2) to a 1.6 mm beam size measured at full width at half maximum (FWHM), allowing a maximum detectable bubble radius of 800 m. The probe beam travels through the cornea into the AC of the eye to fill the zone where the cavitation bubble is generated. At the same time, the iris was used as reflective surface (see Figure 3) in order to be able to collect the scattered beam with a lens system, and (10 and 2.54 cm), to send the transmitted light onto the Photodiode 1. This signal was read by a digital oscilloscope (1 GHz DPO4000, Tektronix). The pump laser beam was placed on the optical axis of the eye to take advantage of the maximum volume section within the AC and to have a larger free space for the generation of the cavitation bubbles.
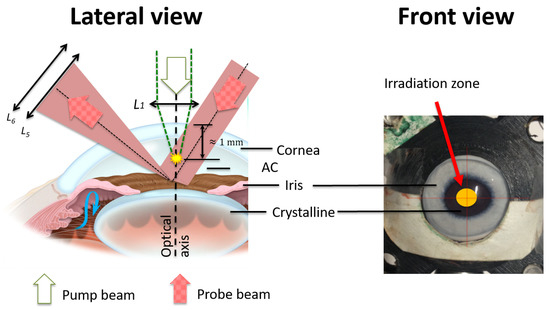
Figure 3.
Setup of the STM technique within the anterior chamber (AC). The cavitation bubbles are generated right below the cornea center 1 mm within the AC. The scattered probe beam is collected by a lens system to send the transmitted light onto a photodiode.
Every eye used was placed into a holder that exposes the cornea and the optic nerve. To induce the IOP, we used a pressurized-air-regulated system (0 to 300 mmHg) which was in line with a manometer (PDMM01, Pyle) and a needle through a ‘Y’ adapter. The needle was inserted into the vitreous chambers of the eyes through the optic nerve.
2.3. Experimental Procedure
In this study, four experiments were performed to explore three main aspects of this technique for IOP sensing: (1) Feasibility and efficacy of the STM technique (performed in the AC of an ex vivo pig eye) to estimate the collapse time, (2) the relationship between the induced IOP and the first collapse time of the laser-induced cavitation bubbles, and (3) the dependence of the first collapse time on the delivered energy per laser pulse. In all cases, we used the STM technique in the AC of an ex vivo pig eye to estimate the bubble collapse time with a good precision.
In the first experiment, we obtained and analyzed the photodiode signal from the STM technique during cavitation for a set of three energy-per-pulse values: 11.2, 12.8, and 13.9 mJ.
During the following experiments, we used and classified two types of pig eyes as functions of their transverse diameters of smaller and greater than 2.6 cm, which were labeled as Small (S) and Medium (M), respectively.
In the second experiment, we measured the first collapse time as a function of the externally induced pressure within the 10 to 60 mmHg range (which expands from normal to abnormal IOP). The externally applied pressure was varied in steps of 4 mmHg. The first collapse measurements were performed by doing a statistical averaging over 16 STM traces, i.e., 16 laser shots at a repetition rate of 1 Hz. We used two pump energy values: 13 and 16.4 mJ corresponding to a fluence at the beam waist of (including the incremental factor (1.8×) in the beam waist due to refraction, and it was obtained by simulation in WinLens 3D Basic) 7.8 and 9.9 kJ/cm.
For the third experiment, in which we studied and described the collapse time as a function of the delivered laser energy, we used three eyes of the same dimensions (M); however, for measuring the collapse time dependence with pressure, we used two medium-sized eyes and one small one.
In the fourth experiment, we used 3 shots of the pump pulses, such that we were able to analyze the data dispersion for the first collapse time at increasing (3 mmHg steps) pressure within the IOP. The delivered energy per pulse was set between 11 and 14 mJ—both at the same 1 Hz repetition rate and delivering 3–5 shots per either energy or pressure value. The pump energy range was selected such that the delivered fluence was slightly above the threshold for the first collapse time in order to be clearly identified and measured.
Figure 4 shows the trend of the collapse time for multiple shots at the same energy per pulse for three pulse energies: 12, 13, and 13.9 mJ; we defined zones I, II, and III to take into account the shot-to-shot energy fluctuations. It is possible to observe the dependence of the collapse time on the delivered laser pulse energy. The larger the delivered energy, the longer the collapse time. In addition, note that the significant dispersion of the collapse time among the three pig eyes for a certain energy value is probably due to an unintentional difference in the initial alignment of the STM setup for each one of the pig eyes, recalling that the collapse time measured from the STM technique is sensitive to the alignment of the pump–probe system.
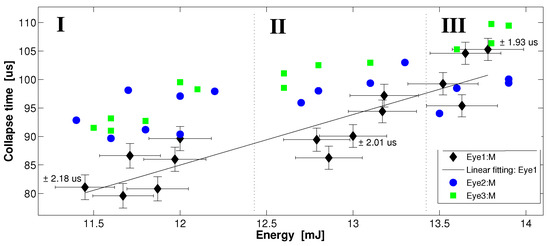
Figure 4.
Collapse time dependence on a set of three values of energy per pulse: 12, 13, and 13.9 mJ. Zones I, II, and III represent pulse-to-pulse energy fluctuations. The error bars for data represented by the circles and squares are the same as those related to the diamonds; however, to improve the display clarity of the plot, they were omitted. Each data point represents one shot of the pump beam and its corresponding cavitation bubble collapse time.
Table 1 summarizes the statistical behavior of Figure 4, analyzing the trends in the standard deviation and the interquartile range (IQR) for each pig eye and energy zone. The standard deviation of the collapse time for each pig eye (diamond, circle, and rectangle) does not show a conclusive trend; when the energy per pulse increases from ≈12 to 13.9 mJ, only the data represented by the rectangles present a clear standard deviation decrease of about 68.5%, while the standard deviation of the data represented by diamonds and circles presents slight increases of +5.4% and +15.9%, respectively. We must note that the dispersion and IQR for each zone decrease ≈−20% for increasing energy per pulse; this means that an increase in the energy of the pump pulses above the threshold makes the laser cavitation dynamics more deterministic.

Table 1.
Standard deviation and interquartile range (IQR) from the data shown in Figure 4.
2.4. Laser Beam Propagation into the AC
Previously to the irradiation experiments, we analyzed (WinLens3D Basic) the propagation of the pump–probe beams to optimize the experimental setup of the STM technique through a pig eye model, and to know the size of the pump beam waist radius within the AC. Figure 5 illustrates the simulation of the probe beam propagation through a pig eye model into the AC. The simulation parameters of the probe beam and the frontal width of a miotic iris (see Figure 5) were obtained experimentally, while the eye model parameters were obtained from a database [24,25]. The simulation shows the effect on the probe beam when varying the incidence angle of the probe beam, which is displaced by a (1.1 mm) distance with respect to the incidence spot of the pump beam on the cornea surface, and considering that the cavitation bubbles are generated just below the cornea.
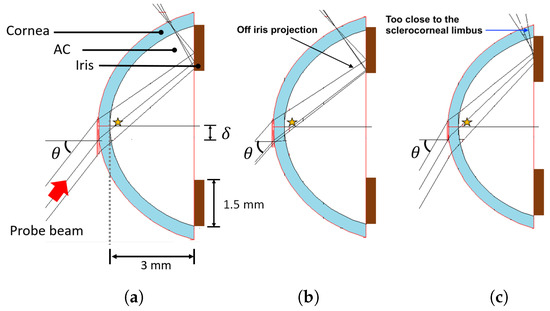
Figure 5.
Simulation on WinLens3D Basic of the probe beam propagation through the AC. (a), (b), and (c) are the results for incident angles of 52, 49, and 60 , respectively. The star indicates the cavitation bubble zone.
In Figure 5, it is shown how the probe beam fills the cavitation zone and, at the same time, it hits a region on the iris off of which it is reflected. For example, at an incident angle of 52 (see Figure 5a), both conditions are met, but if the incident angle changes to 49, as shown in Figure 5b, we have losses of the probe beam, since it partially misses the iris, regardless of if the cavitation zone is fulfilled. If the angle increases to 60, the probe beam does not miss the iris, but the reflected beam coming out is too close to the sclerocorneal limbus, where the probe beam is fully screened (see Figure 5c).
Figure 6 shows the propagation of the pump beam focused with a 12 mm focal-length lens (NA = 0.36) into the AC of the pig eye model. The software WinLens3D Basic uses the solution to the paraxial wave equation to define the beam waist radius () as a function of the wavelength , beam quality factor , Rayleigh range , beam diameter D, and beam divergence . With the ETP previously obtained experimental data for the free propagation pump beam (, , and ) using the ETP, we computed the value of for both the pig eye model and free space, obtaining = 8.4 m and 4.6 m, respectively, which agrees well with the experimental measurements and theoretical values previously obtained.
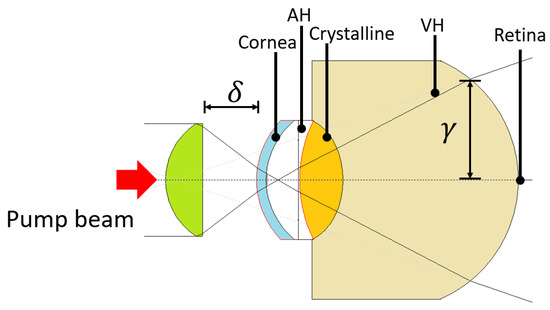
Figure 6.
Simulation on WinLens3D Basic of the pump beam propagation through the pig eye model.
2.5. Corneal Damage Assessment
To assess the potential damage that might be caused by the pump beam on the cornea when using the STM setup (see Figure 3), we analyzed the structural changes on different corneal layers. We used the Harris hematoxylin–eosin (HE) staining protocol to asses any morphological change to the corneal layers. With the HE staining protocol, we can identify cellular nuclei, cytoplasm (from the cellular layers), and collagen (Stroma) by dyeing them blue/purple, pale red, and pale pink, respectively.
For the purpose of this assessment, we used pump pulses with an energy per pulse of 13 mJ, necessary to generate cavitation bubbles within the AC, and we pressurized the eye at 15 mmHg. We established four irradiation conditions at varying numbers of delivered pulses: 1, 20, 200, and 2000. The pulse repetition rate was 1 Hz when delivering 1–20 pulses, and 10 Hz when 200–2000 pulses were delivered. Two sets of 5 pig eyes each were prepared for the experiments, and four eyes from each set were laser-irradiated under the designed protocol conditions; one eye per set was kept (non-irradiated) as a control. Later, the cornea was removed from the control and the laser-irradiated eyes and immediately placed in centrifuge tubes with Davidson fixative solution (20 mL, Sigma). Twenty-four hours later, the corneas were rinsed with 2 mL of 70% v/v ethanol and transported to the Pathology and Clinical Analysis Laboratory at Ensenada, BC., México for HE staining and morphological analysis.
2.6. STM Measurements in the AC
Figure 7 shows a typical STM signal generated into the AC of a pig eye. A typical trace from the STM technique, assuming that the bubble is located within an infinite volume of water, contains at least three well-resolved bubble collapses produced by a single laser shot [21,22,26]. In the present case, we must consider the AC boundaries (cornea, iris, and crystalline), so that it is possible to detect just the first collapse time, followed by strong interference effects from microbubbles generated at the first collapse and the boundaries. In general, this type of STM signal from the AC presents relevant features, as seen in Figure 6: (1) The growth and first collapse time of the cavitation bubble, (2) a large intensity growth in the signal after the first collapse time due to the scattered light contribution from a high density of microbubbles generated right after the collapse, possibly by a vapor jet [14,27], and (3) a slow decline in intensity (>1 ms) due to the displacement axis of the resulting microbubbles.
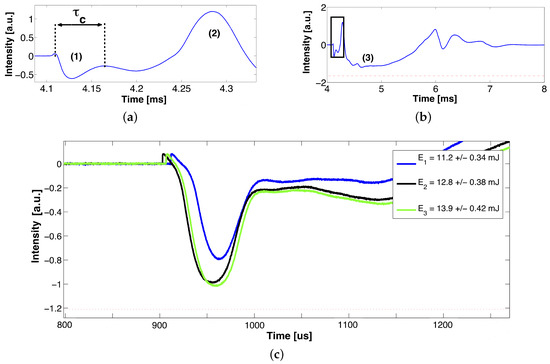
Figure 7.
Typical STM signal generated in the AC of an ex vivo pig eye. (a) Growth and first collapse of the cavitation bubble , (b) region (3) corresponds to the contribution of multiple microbubbles after the first collapse, and (c) shows a zoom into (b)’s inset, which corresponds to the segment of the STM that contains the collapse time value of interest for three close per-pulse energy levels. The signals were triggered to match at the bubble collapse.
3. Results
3.1. Iop Measurements
Analyzing the cavitation bubble dynamics through the Rayleigh–Plesset relation, or energy and momentum conservation equations, the first bubble collapse time can be related to the maximum bubble radius or to the bubble energy by [27,28]:
where is the maximum bubble radius, is the liquid pressure, is the density, and is the bubble energy. In addition, can be written as follows:
which could be rewritten as:
These relations show that the first bubble collapse time and its maximum bubble radius depend on the applied laser pulse energy [29]; part of this energy is converted into luminescence light, mechanical energy, i.e., shock waves, and about 20% of the laser pulse energy (for 6 ns pulses) is converted into bubble energy [28]. Therefore, based on Equation (4) and under constant bubble energy and media properties, it is possible to infer the liquid pressure by measuring the first bubble collapse time.
We used Equation (3) to analyze and understand the results from the cavitation effect in the AC, because it shows how the first collapse time of the cavitation bubble depends on the fluid pressure and the laser pulse energy. Figure 8 shows the influence of the applied pressure (within the IOP range) on the collapse time for two values of pump energy. These results are in good agreement with the work published by Devia-Cruz et al. and L. Martinez [21,26], where they obtained the same STM trends for a larger pressure range (0–100 or 0–250mmHg) and pressure resolution (10 or 50 mmHg). It must be noted that they used a quartz pressure chamber (2 mL) and a tonometric artificial eye model, respectively.
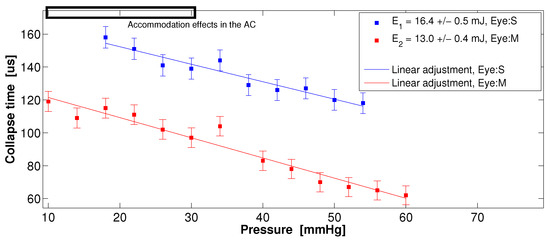
Figure 8.
Collapse time vs. external pressure induced into the AC for two ex vivo pig eyes. The slopes m based on the linear adjustment are m(13 mJ) s/mmHg and m(16.4 mJ) s/mmHg. Each point represents the average of 16 STM signals. The upper rectangle indicates the region of the AE causing a decrease in the depth of the AC.
Figure 8 shows that the collapse time follows a linear trend within the IOP range and that it is independent of the pig eye size (S and M). In the range between 10 and 30 mmHg, we can observe a slight dispersion of the collapse time, most likely due to the accommodation effects (AE) in the AC, as reported by Lin He et al. [30]. The accommodation effect occurs while pressurizing an ex vivo pig eye through the optic nerve, causing a decrease in the depth of the AC; if the external applied pressure begins on 10 mmHg and it increases up to 30 mmHg, the AC depth decreases ≈100 m. In the experimental setup, the cavitation bubbles are generated ≈200 m below the corneal endothelium.
Figure 9 is similar to Figure 8, but uses single STM signals per data point, i.e., does not use averages. With three shots-per-pressure values, we can observe a minimal dispersion of the data for medium-sized pig eyes (circles and diamonds), and a linear trend is preserved; however, for the small pig eye (squares), the dispersion increases and the linear trend is not is clear; this is probably due to the AE within the AC (10 to 30 mmHg). For small eyes, it is clear that the cavitation bubble would be closer to the boundaries, such as the iris and cornea; it could be expected, then, that the bubble growth follows a different trend.
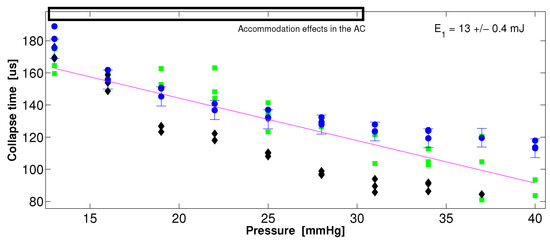
Figure 9.
Dispersion of the collapse time data at increasing intraocular pressure (IOP) for three pig eyes: Eye1 (M, circles), Eye2 (S, squares), and Eye3 (M, diamonds). The error bars for the diamonds and squares are the same as those presented in the circles; therefore, to improve the display of the plot, they were omitted. Each data point corresponds to one shot of the pump beam.
3.2. Corneal Damage
The potential damage to the cornea tissue was assessed in three specific layers: Ephitelium, stroma, and Descemet’s membrane; if optical breakdown takes place in the tissue, it can cause important damage, which has been widely documented previously by [31], among others, such as [28,32,33]. Figure 10 shows a series of optical transmission micrographs from representative cornea samples from 10 pig eyes divided into two groups, including two control eyes and eight laser-irradiated eyes under varying numbers of laser pulses (1, 20, ≈200, and ≈2000), while maintaining the energy per pulse and the intraocular pressure.
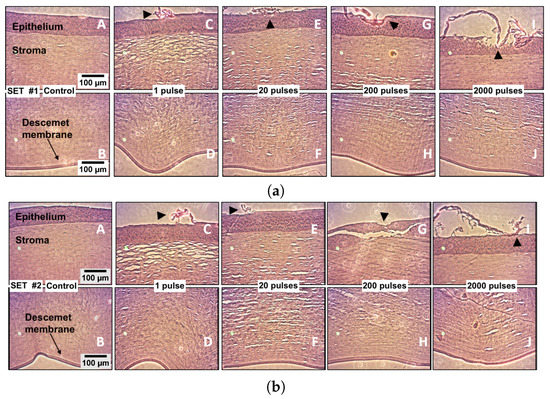
Figure 10.
Histological analysis of both the controls and the laser irradiated corneas (Ep = 13 mJ). The pump laser pulses were delivered within aqueous humor into the AC to induce the cavitation bubbles; the cavitation sites are located about 1 millimeter below the Descemet’s membrane within the AC. The first column in each set (A,B) shows the corneal epithelium, stroma, and Descement’s membrane in the controls, i.e., the non-irradiated corneas. In both sets, (C,E,G,I) show the epithelium and the upper part of the stroma, while (D,F,H,J) show the bottom part of the stroma and the Descemet’s membrane, under irradiation conditions at varying numbers of pulses. The induced pressure in the pig eye was 15 mmHg. Notice the intentionally laser ablated landmarks made on the epithelium surface, which are indicated by arrowheads in (C,E,G,I) on both sets.
For the sake of producing a landmark for irradiated region location and for illustrating how the presumable photo damage could manifest on the irradiated samples, an intentional ablation damage spot was created with a single laser pulse by directly focusing the laser beam on the corneal surface (arrowhead in micrographs C, E, G, and I) for both groups; once the landmark is created, the focused laser beam is displaced into the anterior chamber (aqueous humor) to induce cavitation bubbles.
4. Discussion
From the results obtained from the pump–probe propagation simulations, we identified an angular incidence tolerance (±5) to achieve a good alignment of the setup proposed for the STM technique in the AC of a pig eye model. This alignment compromises to fulfill the cavitation zone and the reflection surface at the iris with the probe beam. Using a paraxial propagation simulation of the pump beam (WinLens3D), we found that the fluence onto the retina is ≈8.4×10 J/cm, considering a pump energy = 13 mJ, a circular surface with radius (see Figure 6), reflective losses (≈2.68%), losses by linear absorption in the ex vivo cornea (≈38% [34] with = 5.37 cm at 532 nm), and energy partition (≈25% transmitted energy after the focal zone [19,28]). This resulting laser fluence is about three orders of magnitude below the theoretical–experimental damage threshold for human retina, as reported by Rockwell et al. [35] and Kennedy et al. [36] (≈1.3 to 2.3 × 10 J/cm) under different laser irradiation conditions, such as pulse duration, wavelength, and beam size. It is important to note that this value of the incident fluence onto the retina is just a first approximation of the real value, since the total energy losses and an estimate of the solid angle onto the retina must be considered.
The results in Figure 7 show a remarkable difference in the temporal dynamics between the growth and collapse of the cavitation bubbles generated in a large volume and those generated in the close proximity to a solid boundary, i.e., cornea, iris, and/or crystalline. The presence of walls close to the cavitation bubble leads to the appearance of vapor jets after the first collapse, producing instability and asymmetry in the bubble [37]. Fragmentation of the bubble produces the appearance of multiple micro-bubbles [15] and interference effects due to shock waves and the cavitation bubbles’ interactions with the walls. These effects after the first collapse time show up in the STM trace as a chaotic modulation on the signal. From Figure 7c, we found the threshold fluence (≈6 kJ/cm) that allows precise detection and measurement of the first collapse time. This fluence corresponds to an applied pump energy of 11 mJ and NA = 0.4.
Figure 8 shows that the STM technique implemented in the AC of an ex vivo pig eye model produces consistent measurements of the collapse time (using averaged STM signals) for applied pressure within the IOP range; it also shows that these measurements hold for two different pig eye sizes (M and S), and can stand the effects of the adjacent walls [15] and the decrease in the volume of the AC due to the AE [30]. According to Vogel et al. [27] and Tomita and Shima (1989), the dynamical behavior of a cavitation bubble strongly depends on the dimensionless distance , with being the maximum bubble radius, and s the distance between the location of bubble formation and a solid wall. They found three situations for three values of : For the first case ( = 0.75), they saw that the wall avoids the full growth of the bubble and a vapor jet is not observed; in the second case ( = 1.56), a counter-jet appears in the direction opposite to the growth of the bubble; in the third case ( = 2.30), a jet appears moving towards the wall from the bubble. In both cases, the normal growth of the bubble is not prevented. In our experiments, we estimate that we are in the second case, where the walls (cornea, iris, and/or crystalline) and the AE do not appear to strongly affect the normal growth of the bubble, since we do not observe disturbance on the trend of the first collapse time measured at increasing pressure within the IOP range. Furthermore, the vapor jet does not cause damage to the surrounding walls.
The effect of increasing the energy per pump pulse is a reduced dispersion on the collapse time data, as shown in Figure 8. Therefore, it would be suggested to use higher-energy pump pulses to get accurate measurements of the collapse time, i.e., the IOP. However, this could cause photo damage to the tissue. Thus, it is required to determine a balanced energy range for the IOP measurement to induce the cavitation above the plasma formation threshold in aqueous humor. Operating at the balanced energy will guarantee that cavitation is induced in every patient with the least collateral damage; such a study is not included in this work.
Figure 9 clearly shows how the collapse time measured using STM traces without averaging for increasing pressure produces the expected linear trend and a minimal data dispersion for the M-type pig eyes. However, it was found that the dispersion in the collapse time increases for an S-type pig eye, perhaps because of the disturbed growth of the bubble due to the proximity to the walls in this smaller volume of the AC.
The corneal damage assessment experiments clearly show that the corneal structure is not compromised by the delivery of up to 20 pulses at a 1 Hz repetition rate; that number is higher than the estimated number of pulses needed for the IOP estimation. From the resulting images, it is possible to remark that there was no convincing evidence of cumulative damage, even when up to 2000 cavitation bubbles were induced close (about 1 millimeter) to the cornea.
Therefore, the IOP measurement technique based on laser-induced cavitation seems to be viable and safe. However, a more detailed study of collateral damage within the eye tissue is still needed, including of the retina and other structures.
5. Conclusions
We have demonstrated the feasibility of developing an intraocular pressure (IOP) sensor based on the well-known laser-induced cavitation phenomenon and taking advantage of the STM technique developed by our group for the purpose of monitoring a cavitation bubble event on a single shot. Our results show that the Rayleigh cavitation model, which relates the cavitation bubble collapse time to the fluid pressure, allows for a rapid and precise estimation of the IOP. Although the pressure resolution we have achieved in the present study is still not within the clinical required value, we believe it can be improved by using laser pulses of shorter than a nanosecond, since the optical breakdown of the aqueous humor becomes much more deterministic with shorter durations of the laser pulses. An IOP sensor based on the cavitation phenomenon presents many advantages over traditional methods for IOP sensing; to mention a few: It is a noninvasive technique, a precise measurement can be obtained either on a single (ideally) or with a few shots, which allows a very fast measurement, and the measurement does not depend on the physical features of the eyeball. Our preliminary damage assessment confirms that corneal tissue is not compromised for up to tens of delivered laser pulses. There is still more work to do for improving IOP measurement resolution and for completing damage assessment in the whole eye structure. This pending work is currently underway.
Author Contributions
S.C.-L.: Conceptualization, Methodology, and Funding acquisition. C.A.Z.-R.: Data curation and Writing-Original draft preparation, Formal analysis. L.F.D.-C.: Conceptualization, Investigation, and Writing-Review & Editing. C.A.-D.: Methodology and Validation. M.A.P.-S.: Resources and Supervision: L.M.-M.: Data Curation and Formal analysis. All authors have read and agreed to the published version of the manuscript.
Funding
This research was partially funded by Clinica de Ojos de Tijuana, CONACYT grant number CB-2015-01-254304 and FONCICYT/01/2016 C0013-2014-01-246648.
Acknowledgments
The authors would like to acknowledge to the Slaughterhouse of Ensenada, BC, and the Pathology and Clinical Analysis Laboratory at Ensenada, BC.
Conflicts of Interest
The authors declare no conflict of interest.
References
- Quigley, H.A.; Broman, A.T. The number of people with glaucoma worldwide in 2010 and 2020. Br. J. Ophthalmol. 2006, 90, 262–267. [Google Scholar] [CrossRef] [PubMed]
- Lim, T.C.; Chattopadhyay, S.; Acharya, U.R. A survey and comparative study on the instruments for glaucoma detection. Med. Eng. Phys. 2012, 34, 129–139. [Google Scholar] [CrossRef] [PubMed]
- Barkan, O.; San, F. Glaucoma: Classification, causes, and surgical control. Results of Microgonioscopic Research. Am. J. Ophthalmol. 1938, 21, 1099–1117. [Google Scholar] [CrossRef]
- Fautsch, M.P.; Johnson, D.H. Aqueous humor outflow: What do we know? Where will it lead us? Investig. Ophthalmol. Vis. Sci. 2006, 47, 4181–4187. [Google Scholar] [CrossRef]
- Iester, M.; Mete, M.; Figus, M.; Frezzotti, P. Incorporating corneal pachymetry into the management of glaucoma. J. Cataract. Refract. Surg. 2009, 35, 1623–1628. [Google Scholar] [CrossRef]
- Bedford, P.G.C. Gonioscopy in the dog. J. Small Anim. Pract. 1977, 18, 615–629. [Google Scholar] [CrossRef] [PubMed]
- Helmholtz, H.V. Description of an Ophthalmoscope for examining the retina in the living eye. AMA Arch. Ophthalmol. 1951, 46, 565–583. [Google Scholar] [CrossRef]
- Sabet, F.A.; Mohammadpour, M.; Mohammad, H.N.; Yadollah, M. Intraocular Pressure Measurement by Three Different Tonometers in Primary Congenital Glaucoma. J. Ophthalmic Vis. Res. 2015, 10, 43–48. [Google Scholar]
- Nazarov, A.; Knyazer, B.; Lifshitz, T.; Schvartzman, M.; Abdulhalim, I. Assessment of intraocular pressure sensing using an implanted reflective flexible membrane. J. Biomed. Opt. 2017, 22, 047001. [Google Scholar] [CrossRef]
- Idalia, D.; Casado, T.; Yamelyn, D.; Bregado, V. Corneal thickness and the epidemiological and physiological variables seen in the glaucoma risk population. Rev. Cuba. Oftalmol. 2012, 25, 254–263. [Google Scholar]
- Medeiros, F.A.; Weinreb, R.N. Evaluation of the Influence of Corneal Biomechanical Properties on Intraocular Pressure Measurements Using the Ocular Response Analyzer. J. Glaucoma 2006, 15, 364–370. [Google Scholar] [CrossRef] [PubMed]
- Liu, J.; J Roberts, C. Influence of corneal biomechanical properties on intraocular pressure measurement: Quantitative analysis. J. Cataract. Refract. Surg. 2005, 31, 146–155. [Google Scholar] [CrossRef]
- Kennedy, K. Laser-Induced Breakdown Media. Prog. Quantum Electron. 1997, 21, 155–248. [Google Scholar] [CrossRef]
- Markolf, H.N. Laser-Tissue Interactions, 3rd ed.; Springer: Berlin/Heidelberg, Germany, 2007; p. 316. [Google Scholar]
- Lauterborn, W. Optic Cavitation. J. Phys. 1979, 40, 8–273. [Google Scholar] [CrossRef]
- Padilla-Martinez, J.P.; Berrospe-Rodriguez, C.; Aguilar, G.; Ramirez-San-Juan, J.C.; Ramos-Garcia, R. Optic cavitation with CW lasers: A review. Phys. Fluids 2014, 26, 122007. [Google Scholar] [CrossRef]
- Ramirez-San-Juan, J.C.; Rodriguez-Aboytes, E.; Martinez-Canton, A.E.; Baldovino-Pantaleon, O.; Robledo-Martinez, A.; Korneev, N.; Ramos-Garcia, R. Time-resolved analysis of cavitation induced by CW lasers in absorbing liquids. Opt. Express 2010, 18, 8735–8742. [Google Scholar] [CrossRef]
- Thiyagarajan, M.; Thompson, S. Optical breakdown threshold investigation of 1064 nm laser induced air plasmas. J. Appl. Phys. 2012, 111, 73302. [Google Scholar] [CrossRef]
- Evans, R.; Camacho-López, S.; Pérez-Gutiérrez, F.G.; Aguilar, G. Pump-probe imaging of nanosecond laser-induced bubbles in agar gel. Opt. Express 2008, 16, 7481–7492. [Google Scholar] [CrossRef]
- Toytman, I.; Simanovski, D.; Palanker, D. Optical breakdown in transparent media with adjustable axial length and location. Opt. Express 2010, 18, 24688–24698. [Google Scholar] [CrossRef][Green Version]
- Devia-Cruz, L.F.; Camacho-López, S.; Evans, R.; García-Casillas, D.; Stepanov, S. Laser-induced cavitation phenomenon studied using three different optically-based approaches—An initial overview of results. Photonics Lasers Med. 2012, 1, 195–205. [Google Scholar] [CrossRef]
- Devia-Cruz, L.F.; Pérez-Gutiérrez, F.G.; García-Casillas, D.; Camacho-López, S.; Aguilar, G.; Banks, D. High resolution optical experimental technique for computing pulsed laser-induced cavitation bubble dynamics in a single shot. At. Sprays 2013, 23, 505–515. [Google Scholar] [CrossRef]
- Devia-Cruz, L.F. Estudio del fenómeno de cavitación inducido en medios biológicos con pulsos láser cortos. Ph.D. Thesis, Centro de Investigación Científica y de Educación Superior de Ensenada, Ensenada, Mexico, 2014. [Google Scholar]
- Benes, P.; Synek, S.; Petrová, S. Corneal shape and eccentricity in population. Coll. Antropol. 2013, 37, 117–120. [Google Scholar] [PubMed]
- Vojnikovi, B.; Gabri, N.; Dekaris, I.; Juri, B. Curvature Analyses of the Corneal Front and Back Surface. Coll. Antropol. 2013, 37, 93–96. [Google Scholar]
- Martínez, L.M. Modelo de sensor de presión intraocular basado en cavitación láser. Master’s Thesis, Centro de Investigación Científica y de Educación Superior de Ensenada, Ensenada, Mexico, 2015. [Google Scholar]
- Vogel, A.; Lauterborn, W.; Timm, R. Optical and acoustic investigations of the dynamics of laser-produced cavitation bubbles near a solid boundary. J. Fluid Mech. 1989, 206, 299–338. [Google Scholar] [CrossRef]
- Vogel, A. Shock wave emission and cavitation bubble generation by picosecond and nanosecond optical breakdown in water. J. Acoust. Soc. Am. 1996, 100, 148. [Google Scholar] [CrossRef]
- Tinne, N.; Kaune, B.; Kraceger, A.; Ripken, T. Interaction Mechanisms of Cavitation Bubbles Induced by Spatially and Temporally Separated fs-Laser Pulses. PLoS ONE 2014, 9, 1–26. [Google Scholar] [CrossRef]
- He, L.; Wendt, M.; Glasser, A. Manipulation of intraocular pressure for studying the effects on accommodation. Exp. Eye Res. 2012, 102, 76–84. [Google Scholar] [CrossRef]
- Vogel, A.; Capon, M.R.; Asiyo-Vogel, M.N.; Birngruber, R. Intraocular photodisruption with picosecond and nanosecond laser pulses: Tissue effects in cornea, lens, and retina. Investig. Ophthalmol. Vis. Sci. 1994, 35, 3032–3044. [Google Scholar]
- Hammer, D.X.; Noojin, G.D.; Rockwell, B.A.; Vogel, A.; Lu, D. Influence of pulse duration on mechanical effects after laser-induced breakdown in water. J. Appl. Phys. 1998, 83, 7488–7495. [Google Scholar]
- Boettner, E.A.; Wolter, J.R. Transmission of the Ocular Media. Investig. Ophthalmol. Vis. Sci. 1962, 1, 776–783. [Google Scholar]
- Rosales, A.M. Ablación de tejido corneal con pulsos de nanosegundos y femtosegundos. Master’s Thesis, Centro de Investigación Científica y de Educación Superior de Ensenada, Ensenada, Mexico, 2008. [Google Scholar]
- Rockwell, B.A.; Thomas, R.J.; Vogel, A.; City-base, B. Ultrashort laser pulse retinal damage mechanisms and their impact on thresholds. Med. Laser Appl. 2010, 298, 84–92. [Google Scholar] [CrossRef]
- Kennedy, P.K.; Zuclich, J.A.; Lund, D.J.; Edsall, P.R.; Till, S.; Stuck, B.E.; Hollins, R.C. Laser-induced retinal damage thresholds for annular retinal beam profiles. Proc. SPIE 2004, 5319, 258–266. [Google Scholar]
- Tinguely, M. The Effect of Pressure Gradient on the Collapse of Cavitation Bubbles in Normal and Reduced Gravity. Ph.D. Thesis, École Polytechnique Fédérale de Lausanne, Lausanne, Switzerland, 2013. [Google Scholar]
© 2020 by the authors. Licensee MDPI, Basel, Switzerland. This article is an open access article distributed under the terms and conditions of the Creative Commons Attribution (CC BY) license (http://creativecommons.org/licenses/by/4.0/).