Article

Smart Helmet and Insole Sensors for Near Fall Incidence Recognition during Descent of Stairs

1
Department of Computer Science, Soonchunhyang University, Asan 31538, Korea
2
Institute of Wellness Convergence Technology, Soonchunhyang University, Asan 31538, Korea
3
School of Architectural Engineering, Hongik University, Sejong 31538, Korea
4
Department of Medical IT Engineering, Soonchunhyang University, Asan 31538, Korea
*
Author to whom correspondence should be addressed.
Appl. Sci. 2020, 10(7), 2262; https://doi.org/10.3390/app10072262
Submission received: 5 February 2020 / Revised: 12 March 2020 / Accepted: 18 March 2020 / Published: 26 March 2020

Abstract

:
Stair falls on construction sites are leading causes of fatal injuries, and the dangers for workers are greater because they usually carry heavy loads. Nevertheless, there are very few studies related to stair falls among construction workers. The purpose of this study was to detect near fall incidence during stair descent and analyze the changes in weight bearing and center of pressure. A total of 10 healthy males participated in this study. Three experimental conditions were set up to analyze stair falls: natural descent (E1), weighted descent (E2), and near fall-simulated descent (E3). While walking down the stairs, subjects wore a three-axis accelerometer sensor attached to a Smart Helmet and a pair of textile pressure sensors (insole) placed inside Smart Shoes. The collected data were analyzed for: (1) whole body balance, (2) plantar pressure distribution, (3) head tilt pattern, and (4) conformity between the helmet and insole sensors. The results showed that our proposed smart helmet and smart shoes have relatively good performance in terms of classifying the weight-shifting patterns in the head and the feet during stair descent. The results of this study may be helpful in detecting near falls of workers on construction sites.

1. Introduction

The construction industry often obliges workers to operate in poor working conditions, in which serious accidents occur due to high labor intensity, long working hours, and dangerous working environments [1]. It is also inherently a dangerous work environment and potentially contributes to workplace injuries. The Bureau of Labor Statistics (BLS, USA) cited six representative accidents that can occur on construction sites: (1) fires and explosion, (2) exposure to harmful substances or environments, (3) contact with objects and equipment, (4) violence and other injuries by persons or animals, (5) falls, slips, trips, and (6) transportation incidents. Among them, 887 of all construction workers were fatally injured due to falls, slips, and trips, which accounted for 17.23% of all fatal industrial injuries [2]. They also reported that 5147 people suffered fatal work injuries and fall accidents in construction sites, accounting for 39.2% of the fatalities in the sector in 2018. The Centers for Disease Control & Prevention (South Korea) reported that 14,306 people were injured due to falls in all industries, of which 8607 were construction workers, comprising 37.56% of the total for 2018. Falls on construction sites can cause bone fractures and bruises, and it is especially important to assess the victim as soon as possible when a fall occurs. This is because transportation to a medical institution can help prevent further injuries. Although many studies have been conducted to develop sensors and systems to monitor fall accidents on construction sites [3], only a few studies have attempted to monitor and analyze falls occurring on stairs.
Stair falls are the leading cause of job-related injuries and even workers’ deaths on construction sites [4]. Falls often occur when a heavy load is placed on the back, balance is lost, the rails are slippery or there is no stair rail, or simply due to stumbles when descending [5,6,7]. The Occupational Safety & Health Research Institute (OSHRI) in Korea reported that a total of 16,231 people were injured due to falls on construction sites, and that 18% of workers experienced falls on the stairs [8]. In the case of construction sites, there is no closed-circuit television (CCTV) and no way to check the movement of workers, unlike general work spaces. As a result, identifying a fall from the stairs is more difficult than in other places on the construction site. Therefore, fall detection systems are needed to monitor and analyze falls that can occur on the stairs.
Many studies on the development of fall detection systems have been conducted to distinguish falls from general activities of daily life, and have mainly adopted a technique of analyzing body movement using accelerometer sensors [9,10]. However, insufficient attention has been given to applying this idea to a fall detection system specifically for construction site workers. Yang et al. (2016) developed fall detection system using a three-axis accelerometer sensor, and they conducted experiments under two conditions (normal walk, near-miss fall) to detect near-miss falls on a construction site [11]. However, because the three-axis accelerometer sensor is attached to the waist, it can impede the worker’s movement, and does not take into account changes in weight when carrying heavy loads on the shoulders. Dzeng et al. (2014) developed a fall detection system using a three-axis accelerometer sensor in a smart phone. They conducted a fall test on a static posture (standing, squatting) [12]. However, carrying a smartphone on a construction site can be inconvenient, and this approach has limitations in terms of measuring body movement. The three-axis acceleration sensor is useful for detecting falls, but it may yield false information. Due to the noise caused by movement, the sensor data may be unable to distinguish between falls and ordinary movement.
On construction sites, workers are frequently exposed to fall risks and thus it is important to detect foot areas and detect changes in the balance of both feet [13]. Gifford (2007) and Altman et al. (2017) reported that potential sources of falls are bad interactions between the foot and floor-surface, with changes of workers’ gait patterns on construction sites [14,15]. Light et al. (2015) and Chaccour et al. (2016) developed an insole-type fall detection system using a pressure sensor and conducted experiments to detect falls [16,17]. They proposed a system for evaluating falls by analyzing changes in pressure on the sole surface. However, the FSR sensor used by them has low durability. In particular, low durability can be a problem in detecting worker falls, because there are more cases of carrying heavy loads on construction sites than in everyday life, and it may not be suitable for detecting falls due to sensor damage or distortion caused by external impact.
In general, all construction workers must wear a safety helmet and safety shoes [18]. Research conducted by Melzner (2012) reported that wearing appropriate safety equipment contributed to a reduction of fall accidents of more than 30% [19]. However, existing safety helmets and shoes are used only to protect construction workers against external shocks. In previous studies, safety helmets and shoes with IMU sensors were developed [20,21,22,23].
The purpose of our research was to evaluate fall incidence by simulating three experimental conditions using a three-axis accelerometer sensor and pressure sensor. In our previous studies, we developed a smart helmet and textile-based smart insole sensor [21,24,25]. Based on the data collected from the developed sensors, we analyzed whether our proposed sensor could distinguish between falls and non-falls.

2. Materials and Methods

2.1. Development of Smart Helmet and Smart Shoes

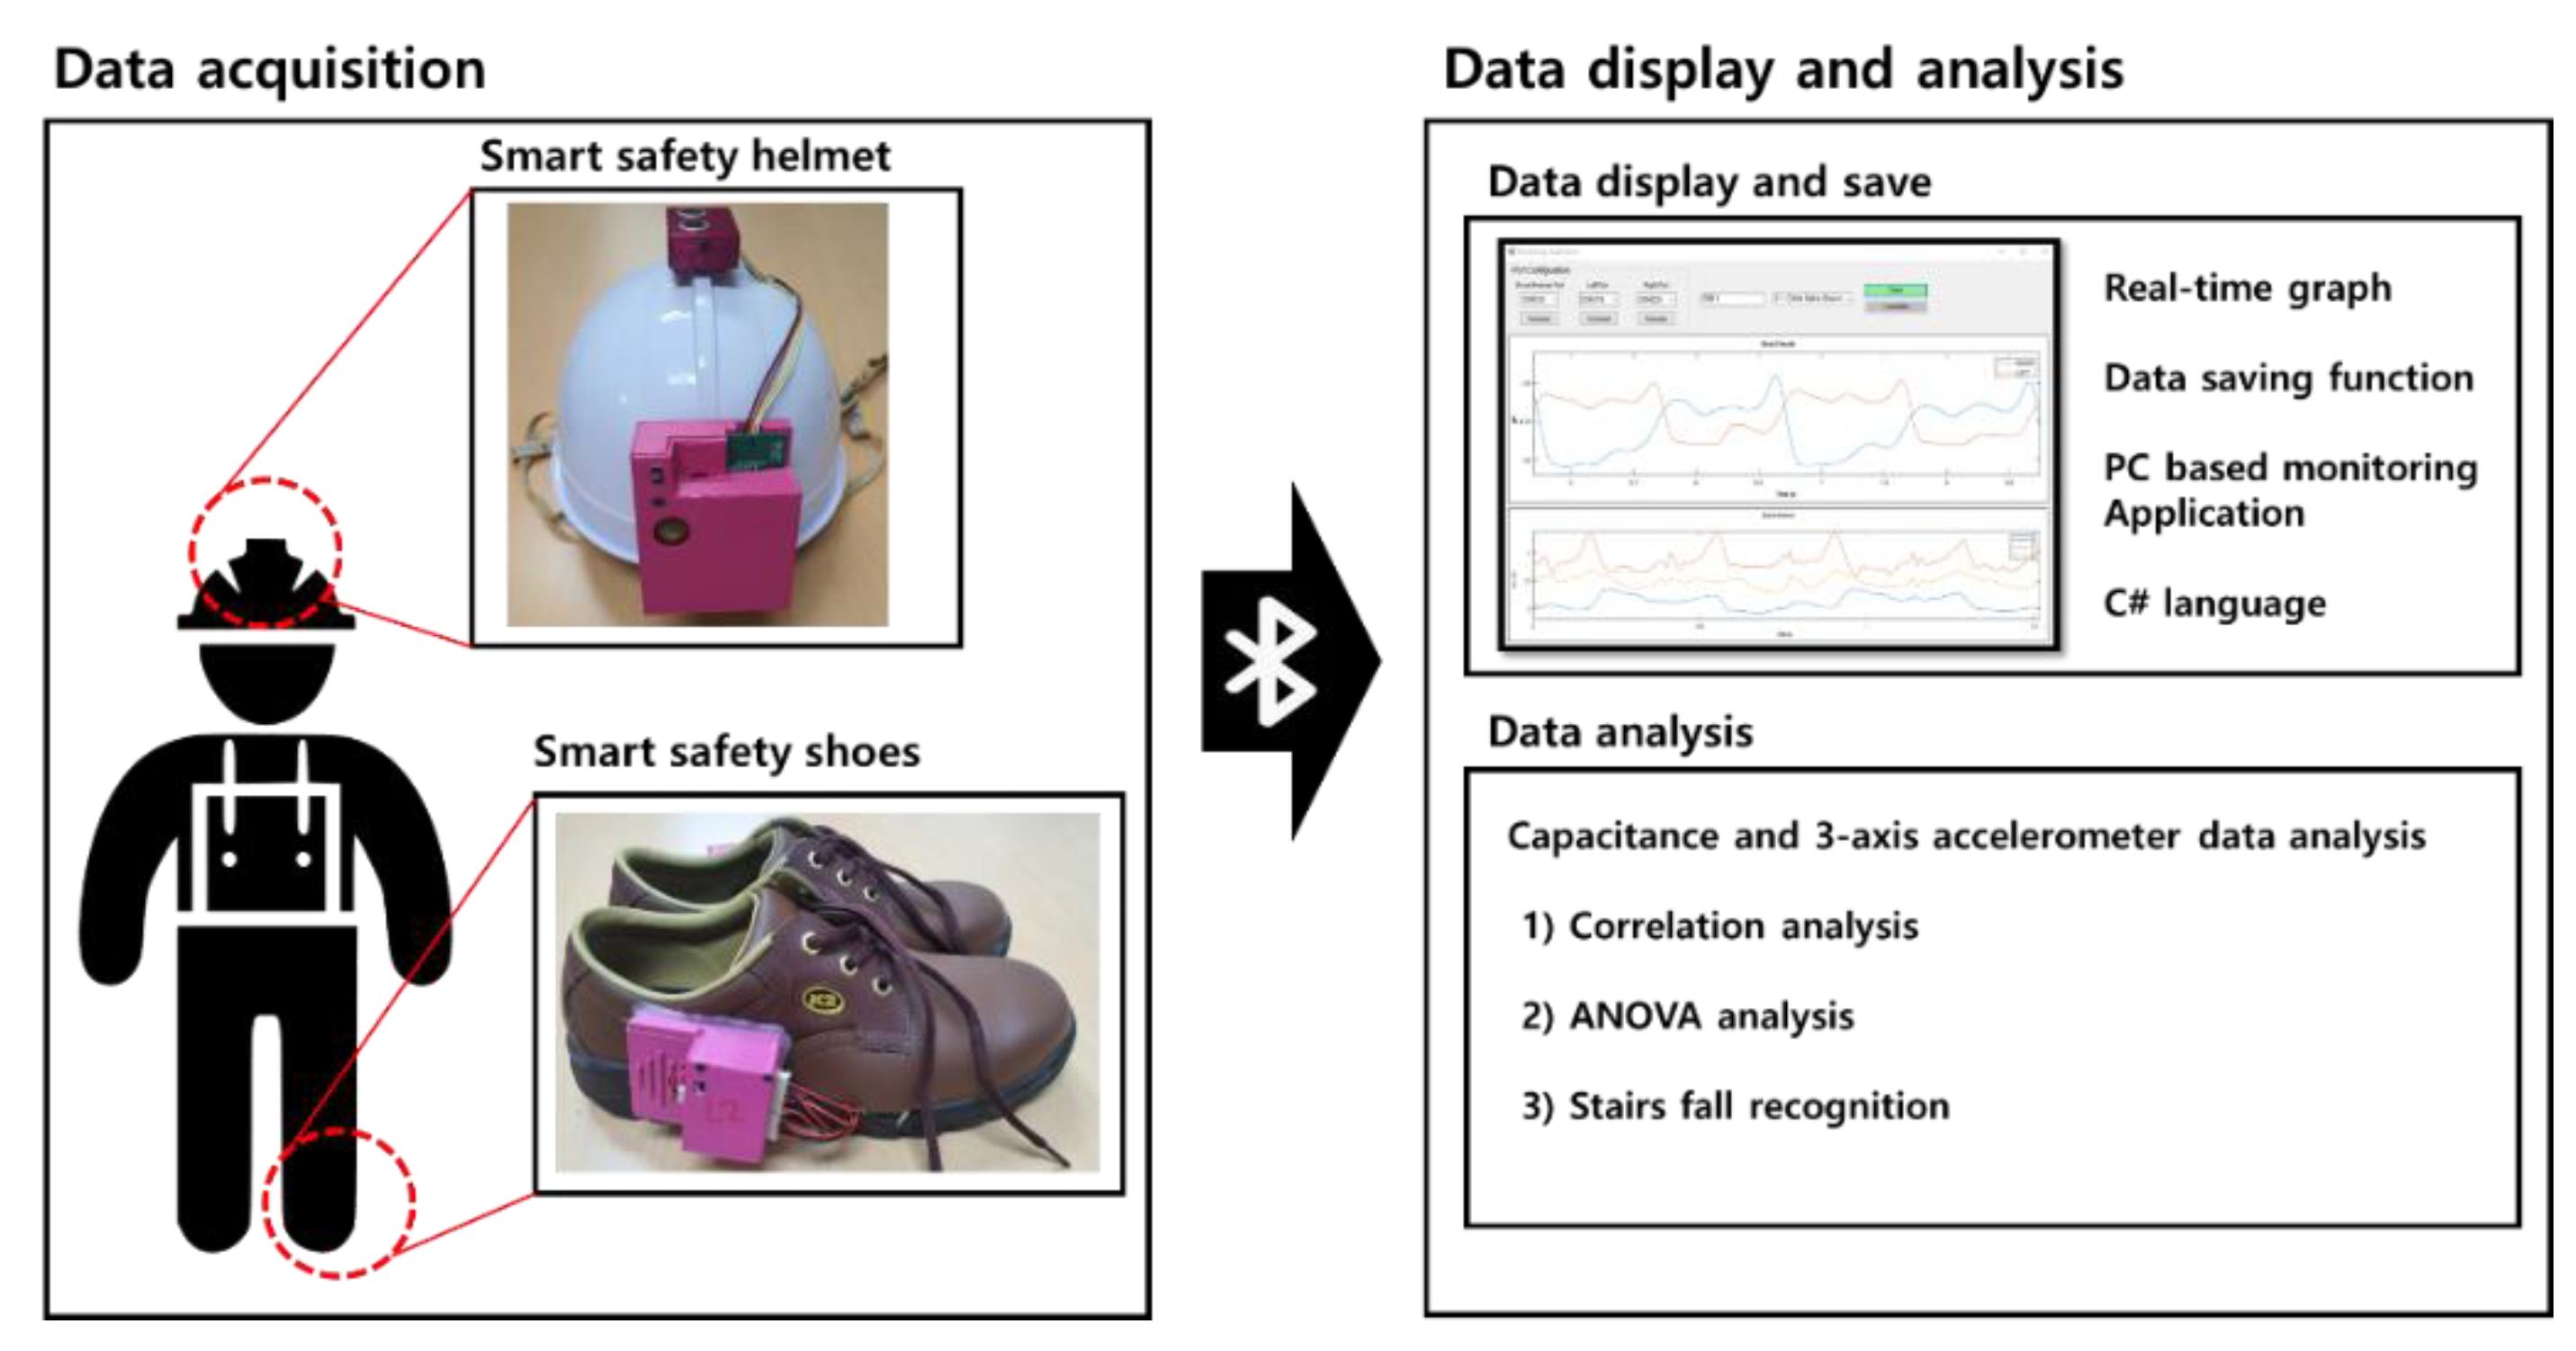
2.1.1. System Architecture

Our proposed system for near fall incidence monitoring was configured as follows: (1) smart helmet, (2) smart shoes, and (3) real-time monitoring application. Figure 1 shows the architecture of the proposed system.

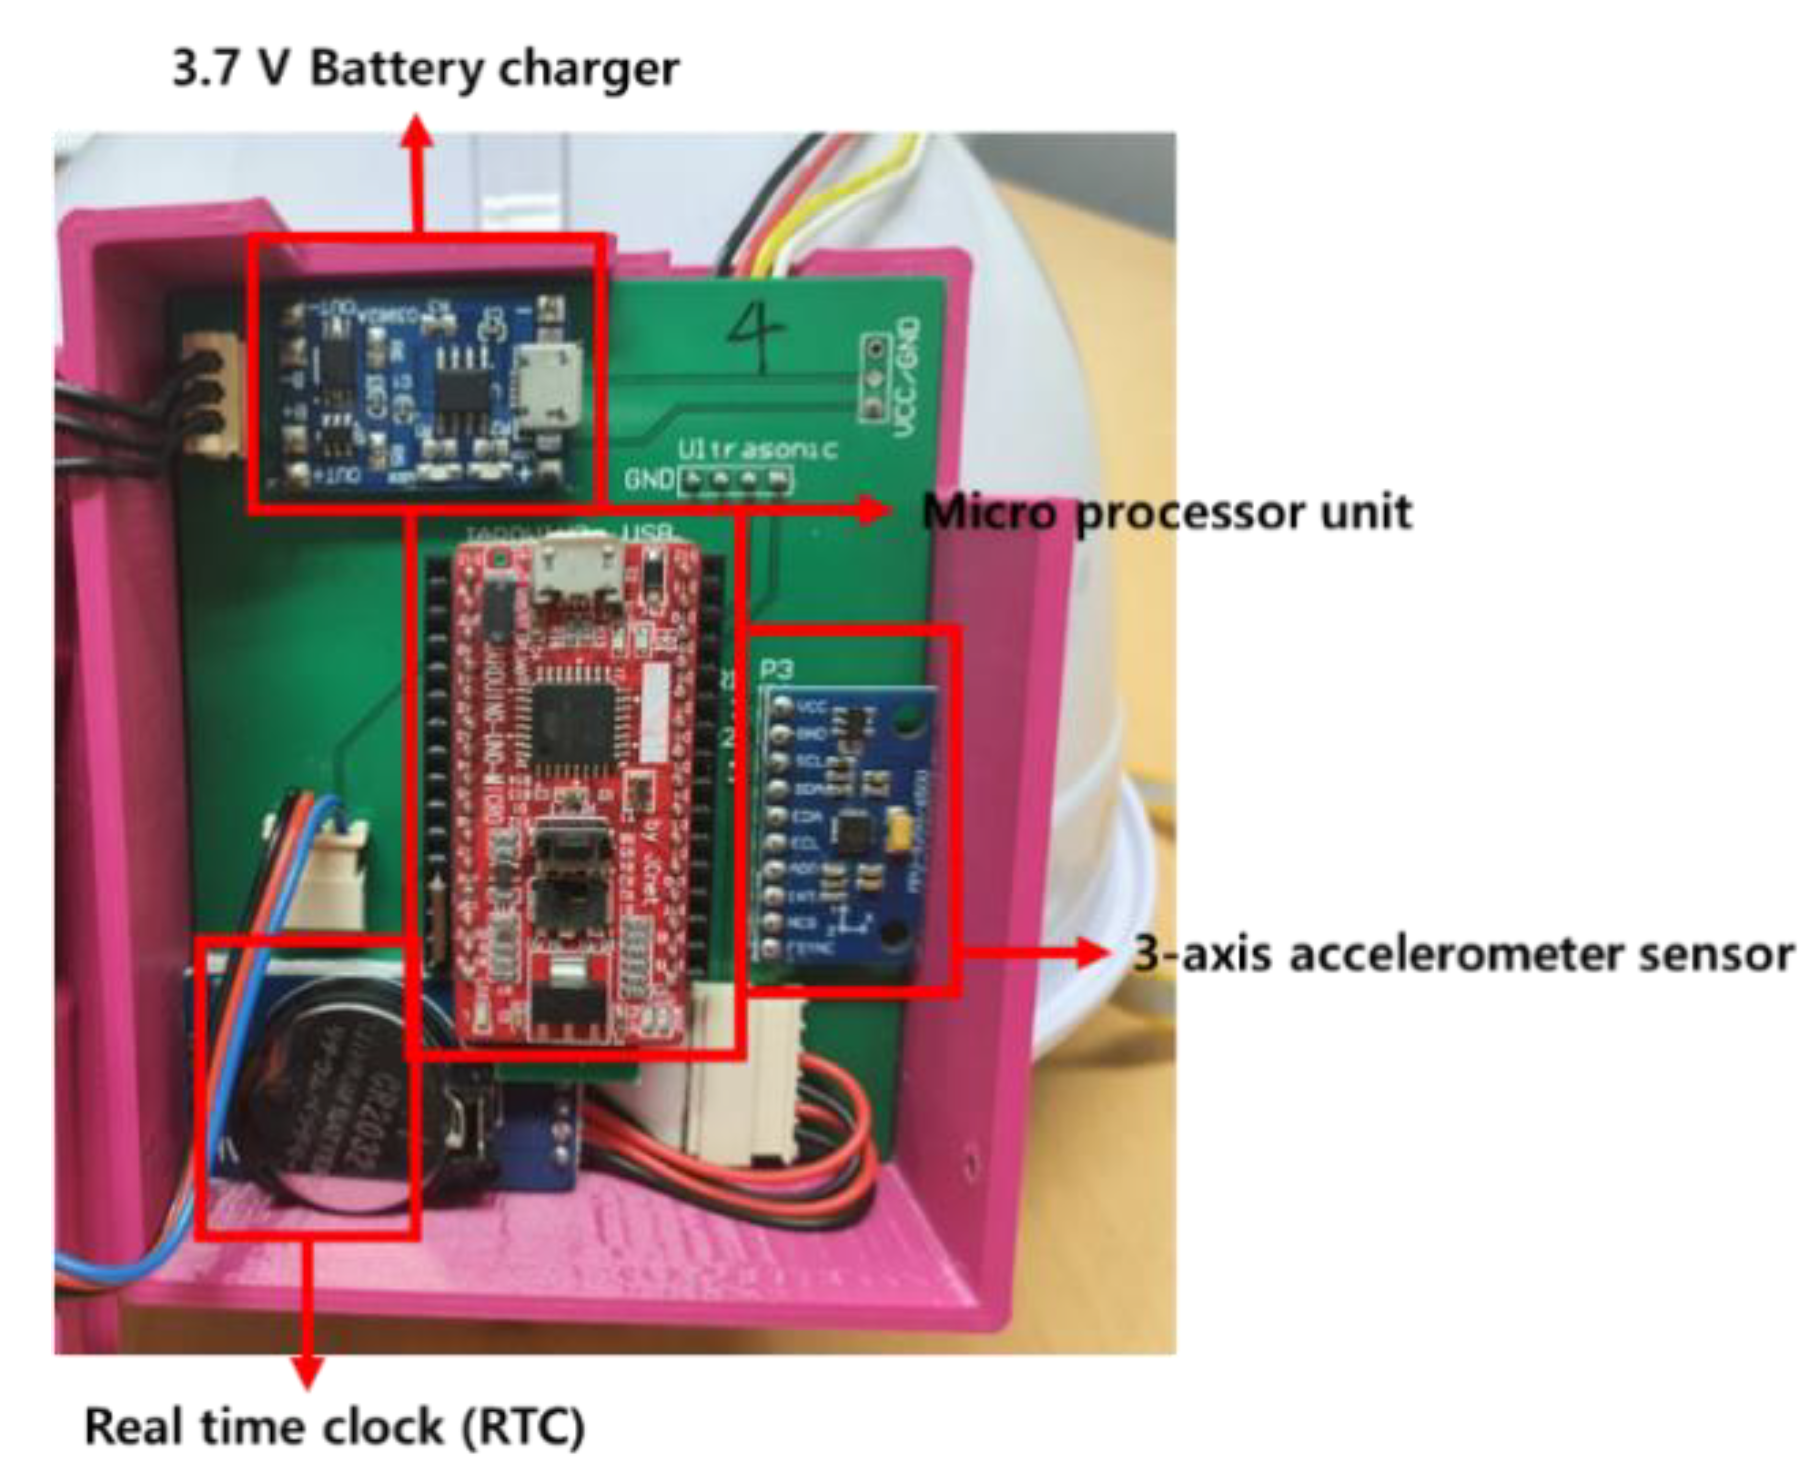
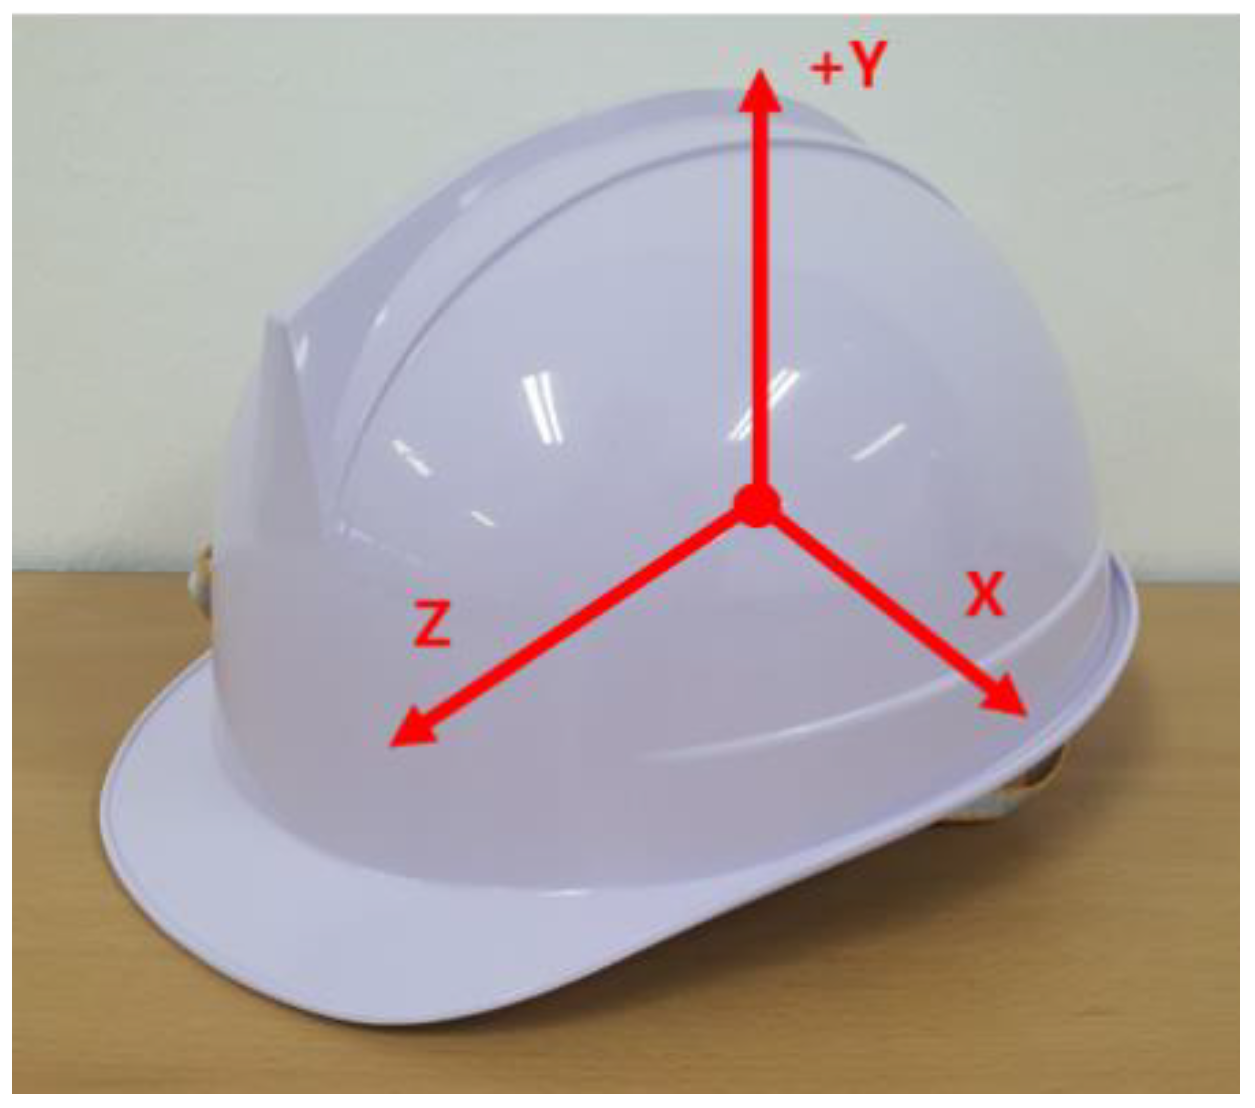
2.1.2. Development of Smart Helmet

The Smart Helmet used in this study was originally developed and tested in our previous study published in 2018, which tested the feasibility of wearing safety helmets [21]. A printed circuit board (PCB) was developed for the acquisition of three-axis accelerometer data. For the micro controller unit (MCU), an Arduino-uno-BTmini model (JCnet, Korea) was used. For the three-axis accelerometer sensor, a MPU-9250 model (SMG, China) was used; it contains a three-axis accelerometer and a gyroscope. The three-axis accelerometer data were sampled at 30 Hz. The outer case of the accelerometer was fabricated using a 3D printer to protect the PCB board and sensors from external shocks, as shown in Figure 2.

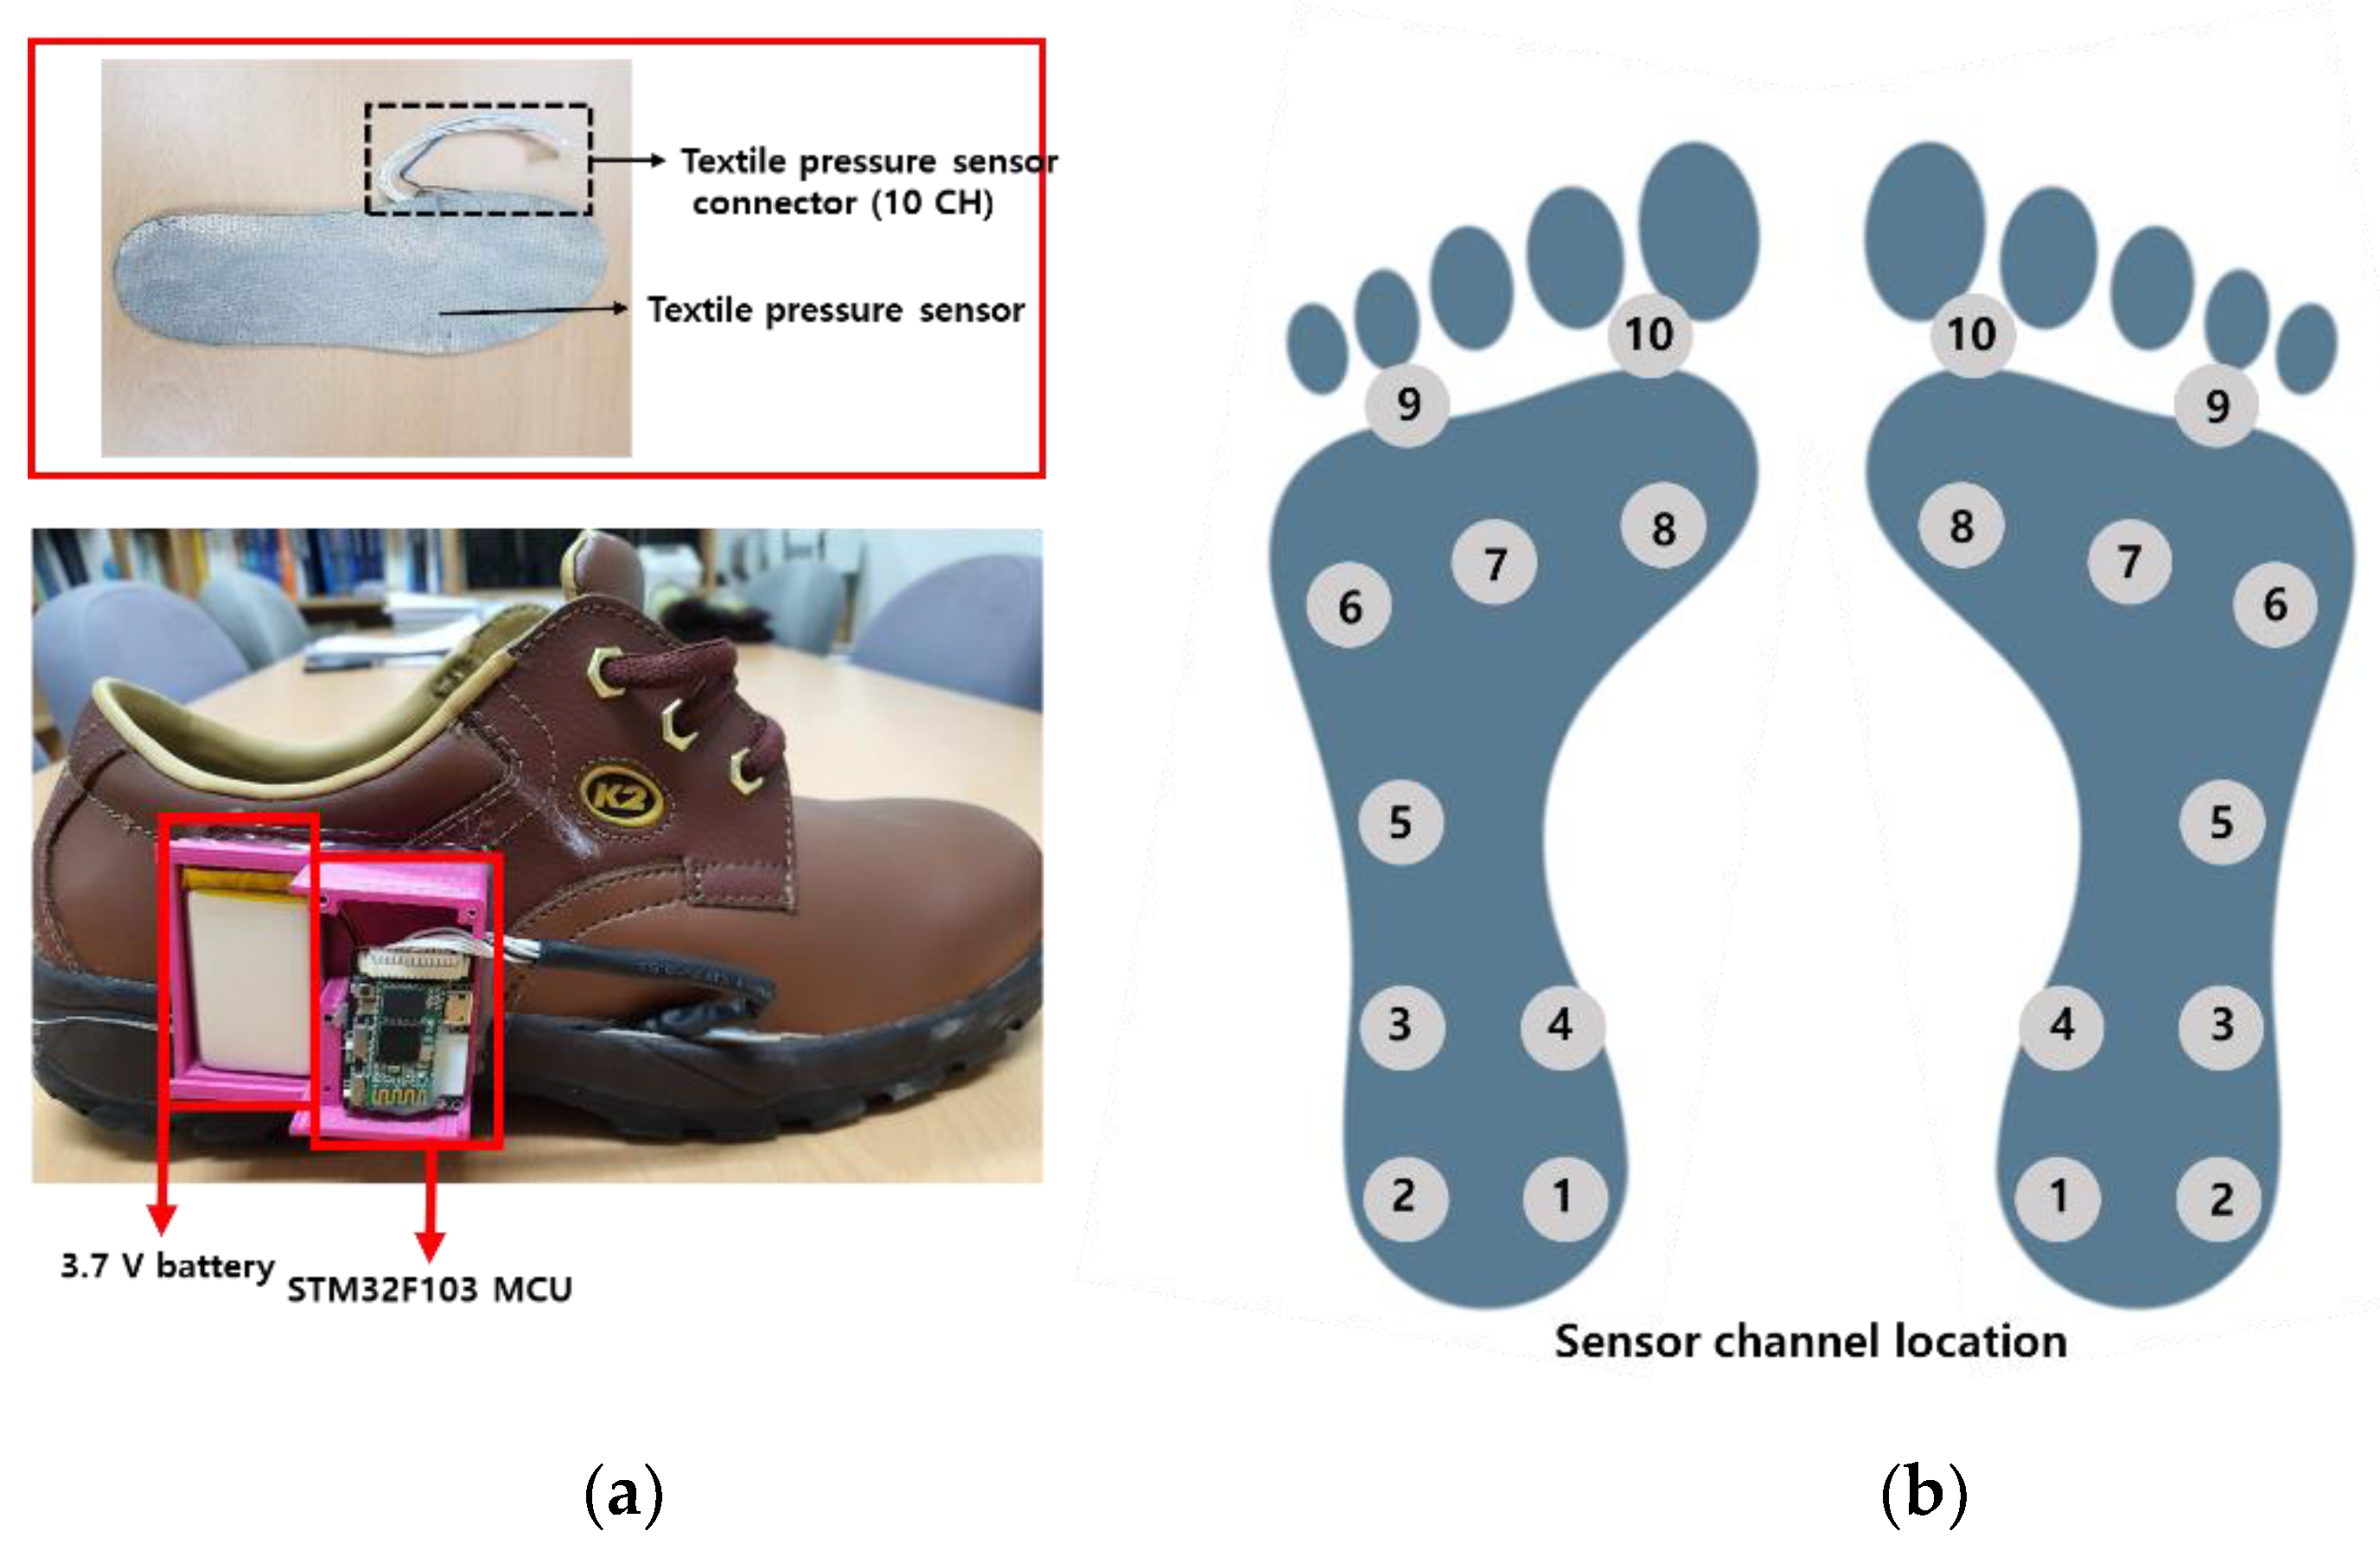
2.1.3. Development of Smart Shoes

The first version of our Smart Shoes was developed and tested in our previously published studies in which the performance of our insole was compared with that of F-scan (Tekscan, USA), and showed a high correlation (R2 > 0.90, p < 0.05) [24,25]. To measure the changes in plantar pressure distribution, capacitance values detected by conductive textile were used. Figure 3a presents the developed insole with 10 channels and the exterior of the Smart Shoe. For this study, the textile pressure sensor (the insole) was prepared in three sizes: 260 mm, 270 mm, and 280 mm. The insole was designed based on parallel capacitance theory; the sensor location of the 10 channels in each side of the insole is shown in Figure 3b.

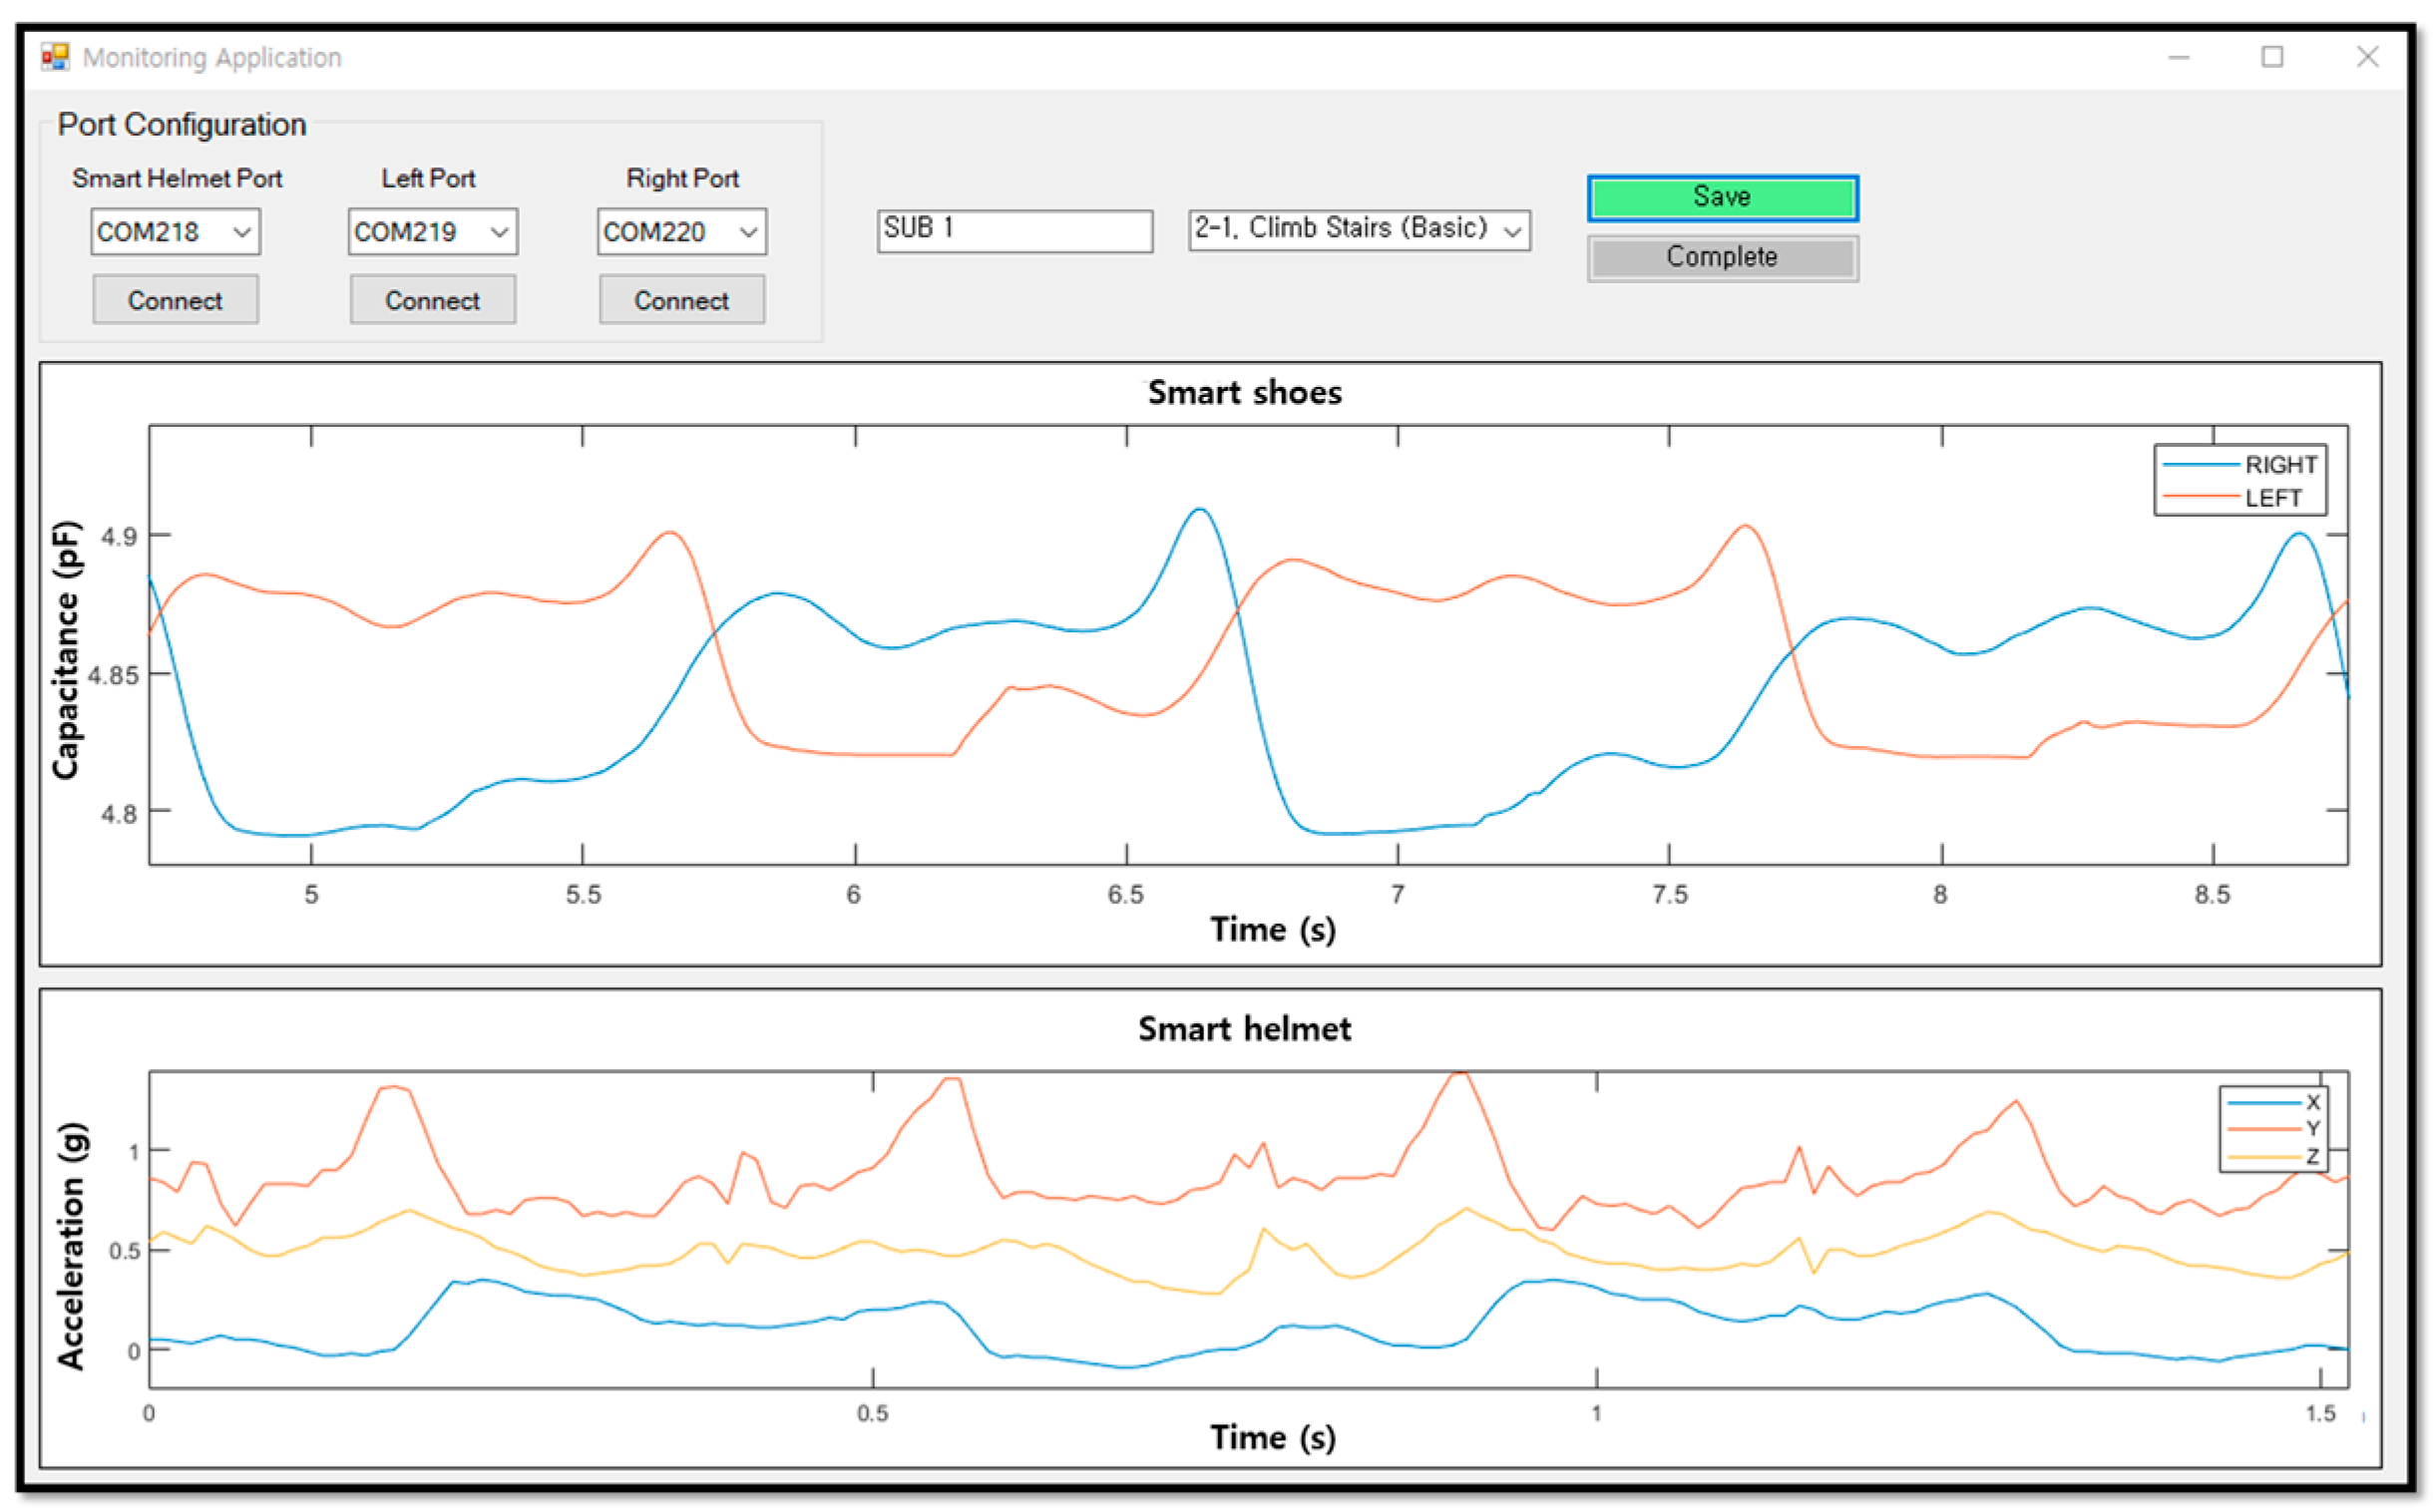
2.1.4. Development of Data Saving and Monitoring Application

Data saving and the monitoring application was developed using the C# language, as illustrated in Figure 4. The upper plot visualizes the plantar pressure changes of each foot in real time by using capacitance values from the insole sensor (Smart Shoes), while the lower plot shows the changes in the head movement captured by the three-axis accelerometer sensor (Smart Helmet). The application provides feedback on the user’s movements based on his/her weight-shifting patterns detected in the head and the feet. The software saves the data and exports them to a text or an excel file.

2.2. Stair Descent Simulation of Construction Workers

2.2.1. Subject Characteristics

A total of 10 healthy male subjects (25.5 ± 2.59 years of age) participated in this study (Table 1). Subjects were excluded if they had experienced trauma to the lower leg in the past 6 months, or pain in the feet or lower back. For the homogeneity of the subjects’ fitness levels, average daily workout hours were surveyed. Each subject reported spending an average of less than 15 min per day working out. All experimental procedures were performed in accordance with the ethical standards of the Soonchunhyang University of Korea, and with the 1964 Helsinki declaration and its later amendments or comparable ethical standards.

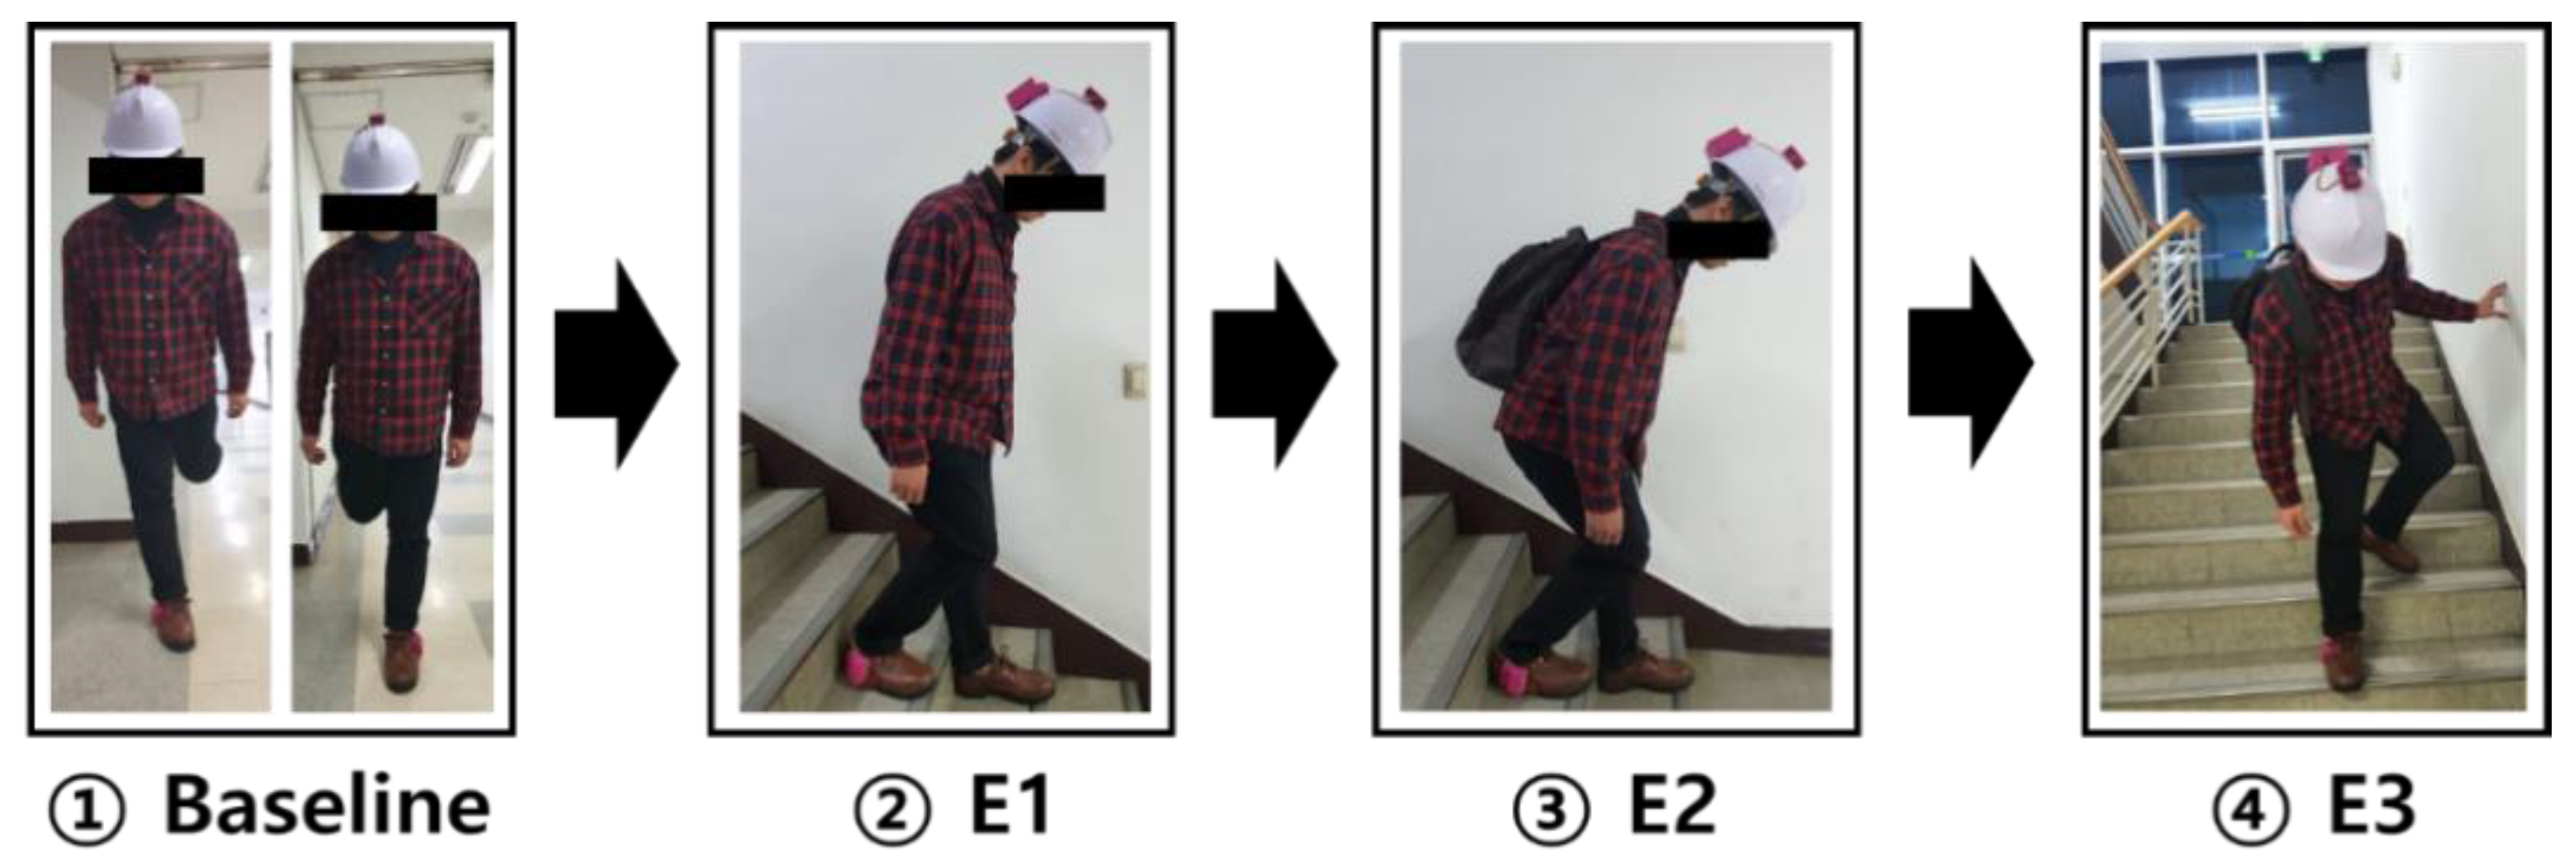
2.2.2. Experiment Procedure

According to the methods described in previous studies [26,27], fall detection analyses during the descent of stairs were performed and the experimental protocol simulated a natural descent and near fall-simulated descent. Figure 5 shows a subject performing the experiment protocol with our developed helmet sensor (Smart Helmet) and insole sensor worn inside the given workers’ shoes (Smart Shoes). The helmet was designed with a three-axis accelerometer to detect head movements and the insole was made with a capacitive sensor to detect plantar pressure changes.
While wearing both of the sensors, each subject first stood still for 5 seconds on one leg (on the right leg first, then the left) for the calibration of the insole sensor. This step was repeated three times and the average value was used as the baseline for analysis.
A total of three experimental (E) conditions were performed by each subject in random order: (1) naturally descending 10 stairs (E1), (2) naturally descending the stairs wearing a backpack weighing 15 kg (E2), and (3) descending the stairs with the backpack on while simulating a near fall (E3).
For E1 and E2, subjects walked down 10 stairs at a comfortable speed. For E2 and E3, the same weighted backpack was worn on the back and the shoulder straps were adjusted to fit each subject tightly; the bag was not allowed to hang more than two inches below the waistline. The lowest part of the backpack was on L4-L5 (lumbar) spinal segment level of each subject. The difference between E3 and E2 is that E3 moves the center of the body to the right as soon as the right foot hits the surface of the stairs. For E3 (near fall simulation), subjects were asked to step down the stairs on their dominant foot (right side for all 10 subjects) making the line of gravity fall outside the base of support (BOS) to cause instability.
Stepping down on the dominant side was done so that the subjects would be able to avoid actual falling by taking compensatory actions, as shown below. Each experimental condition was practiced several times for familiarization before the study.

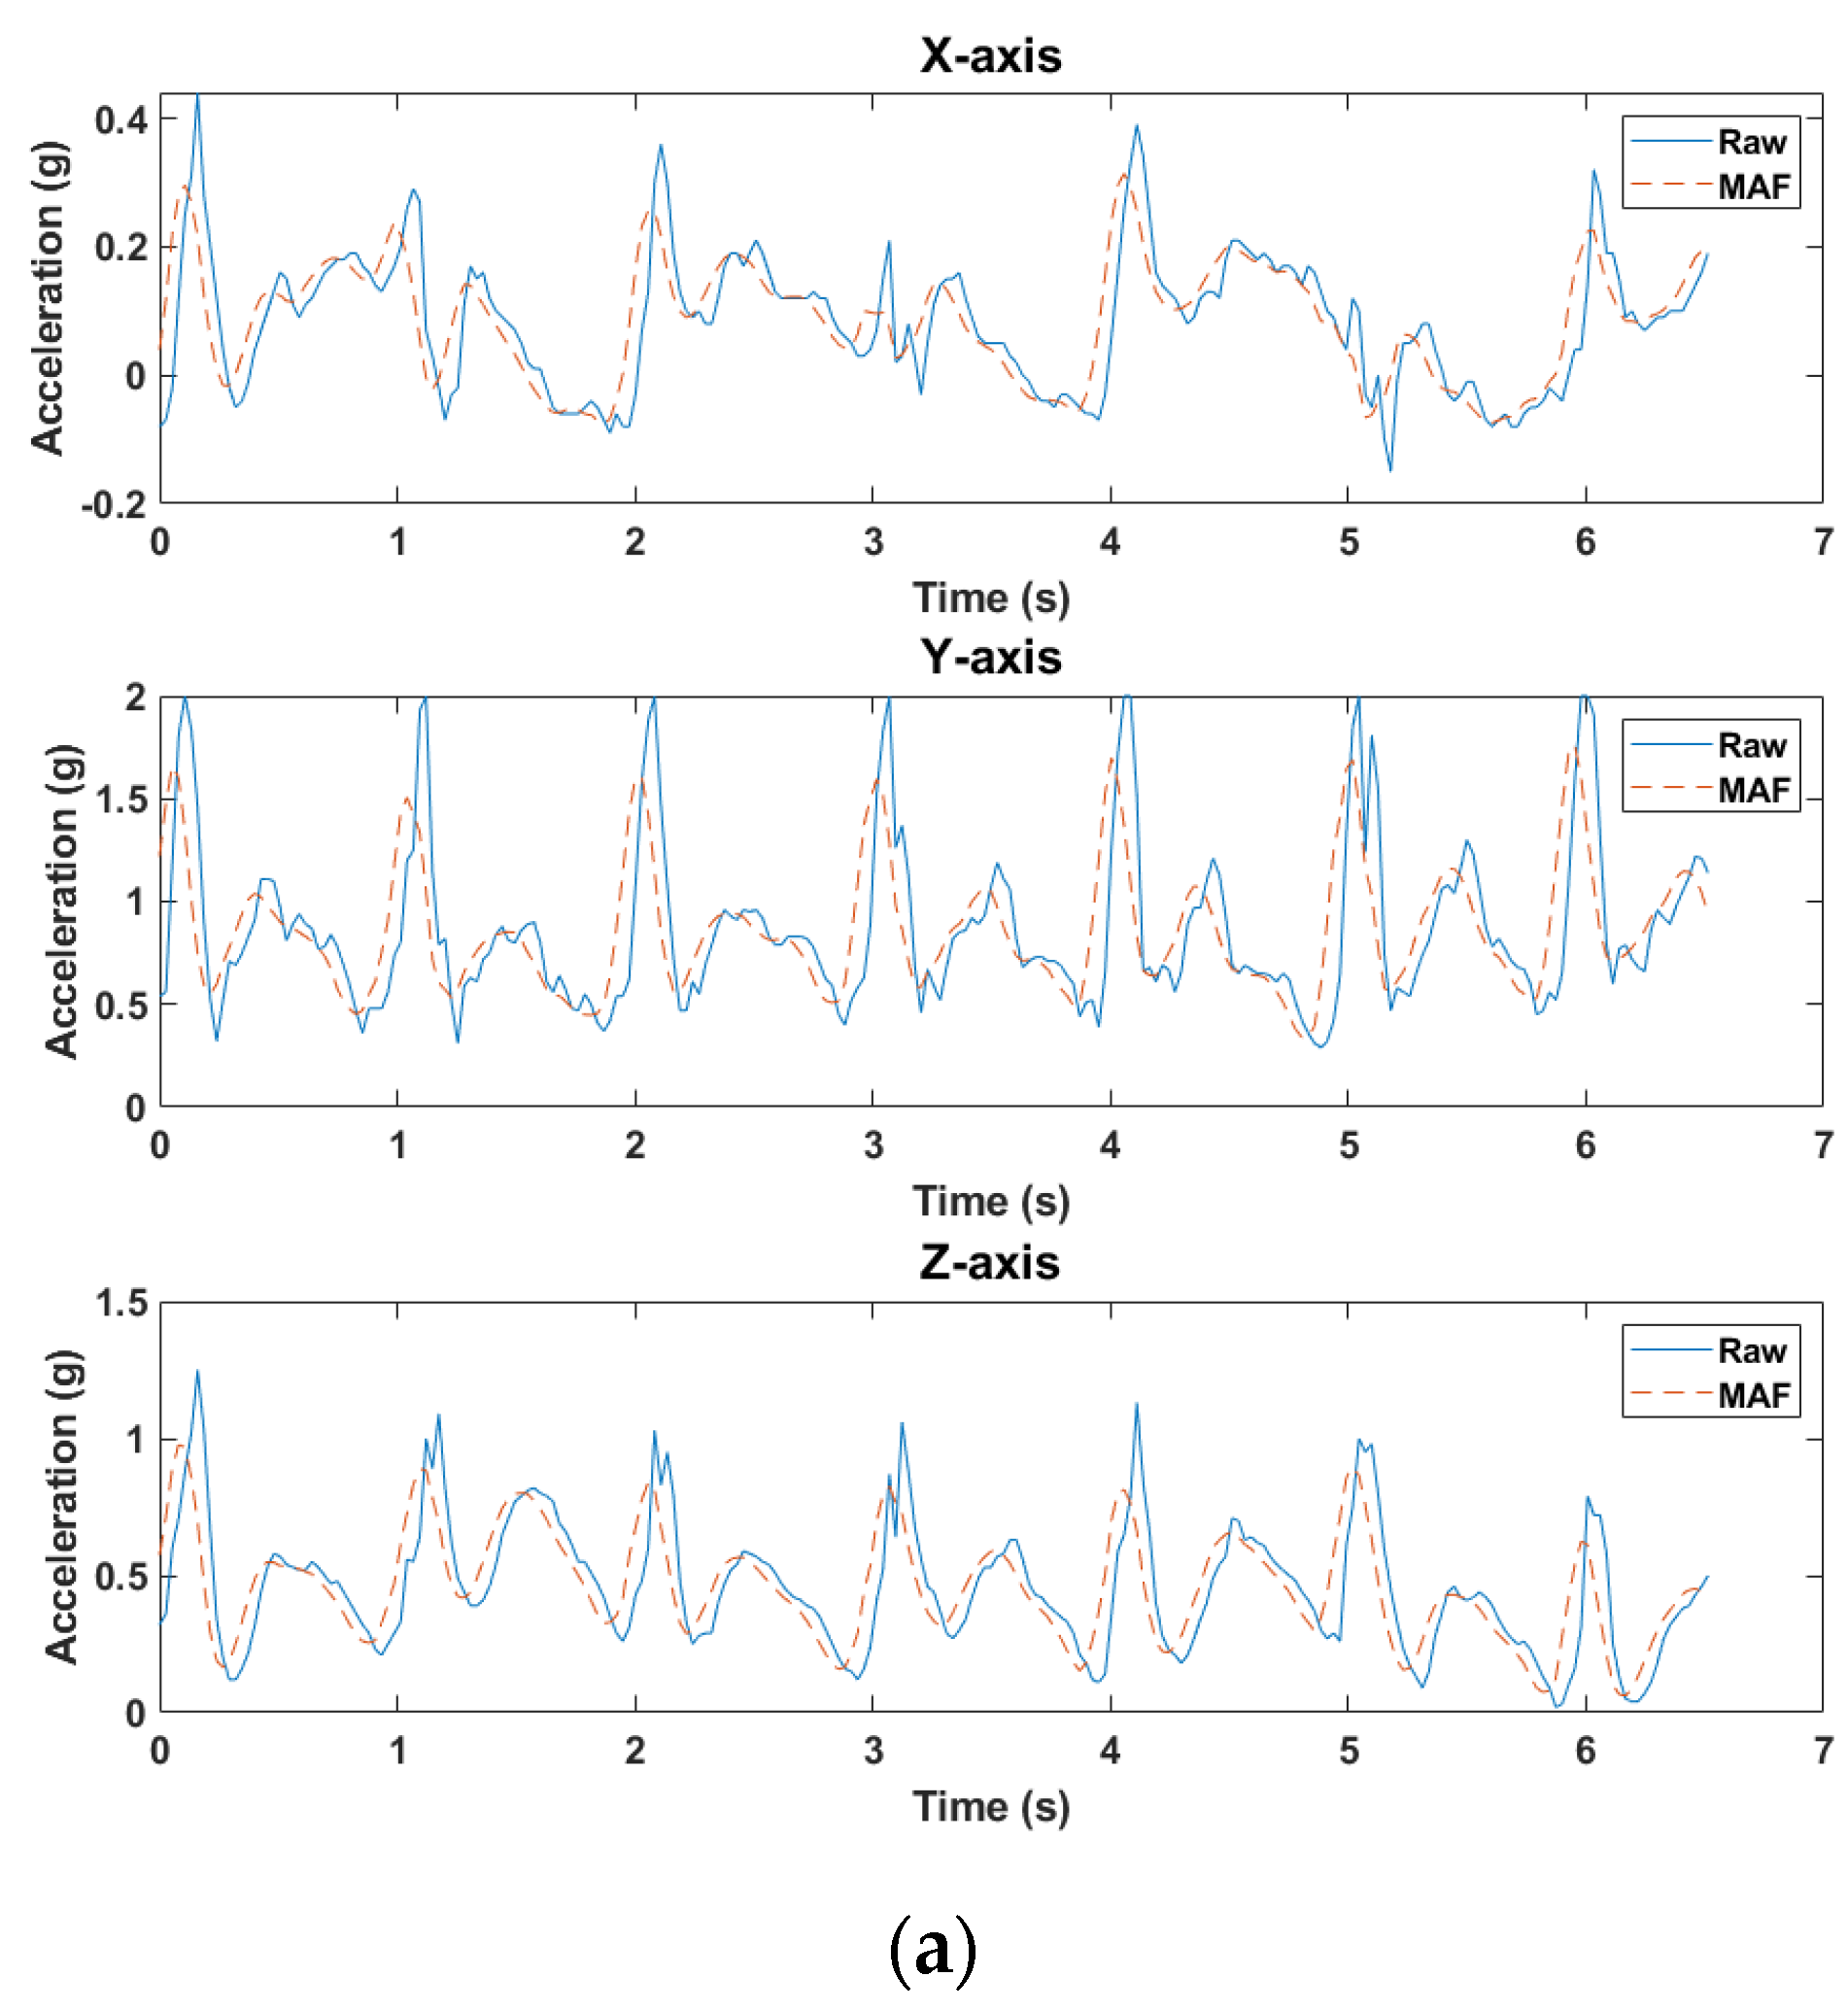
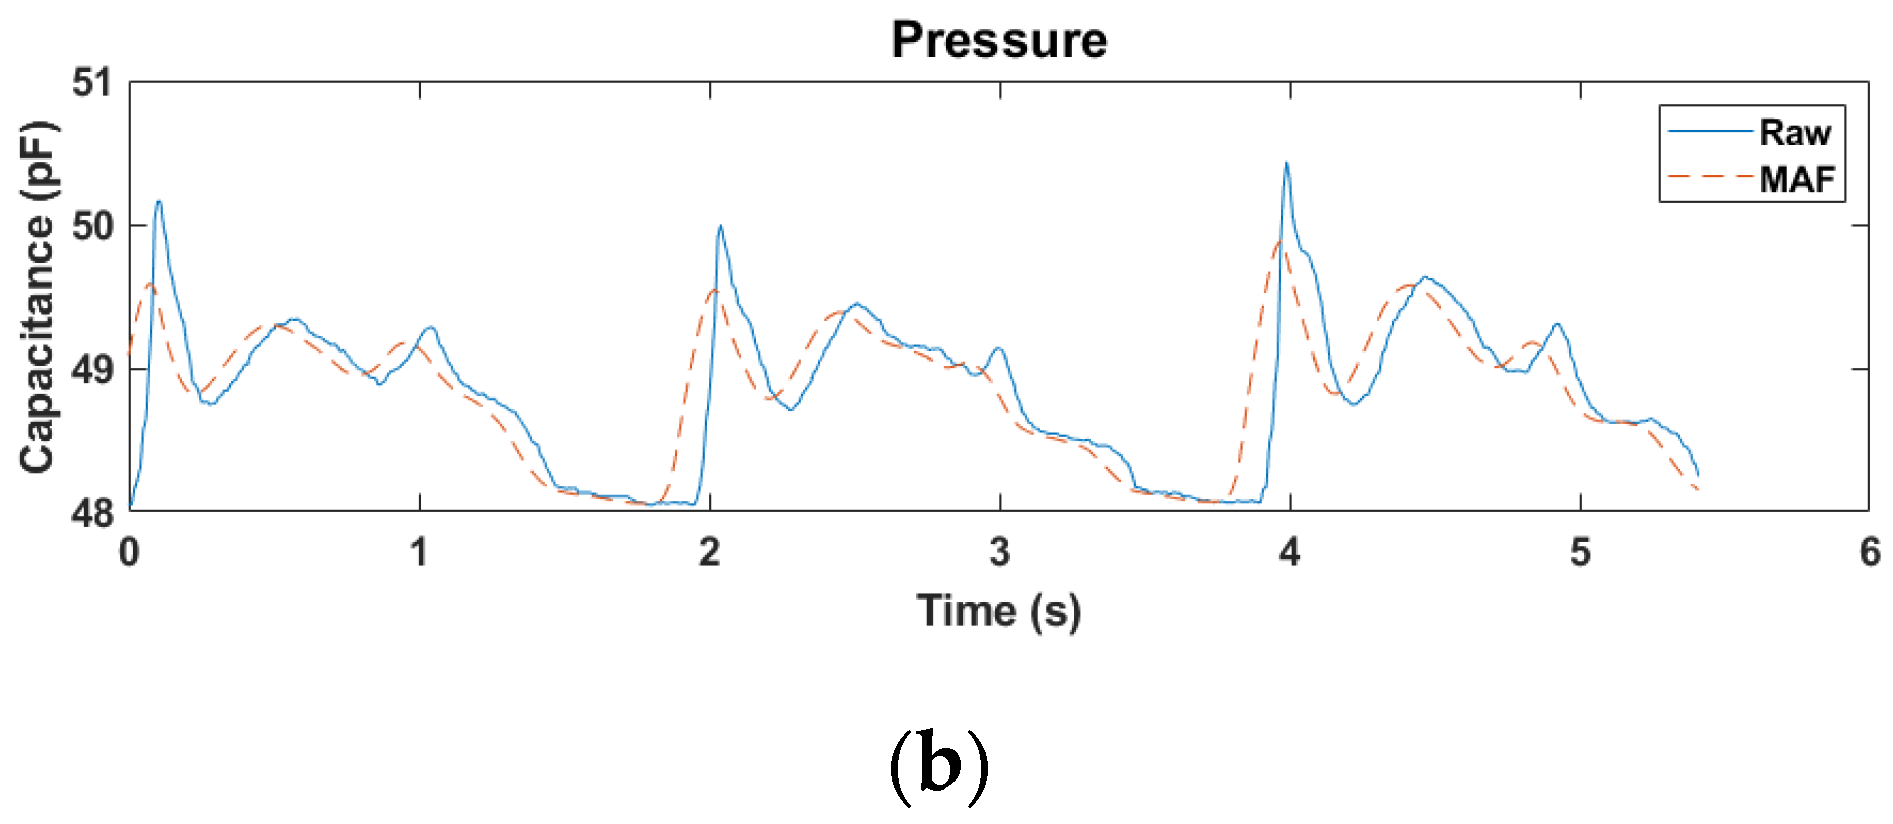
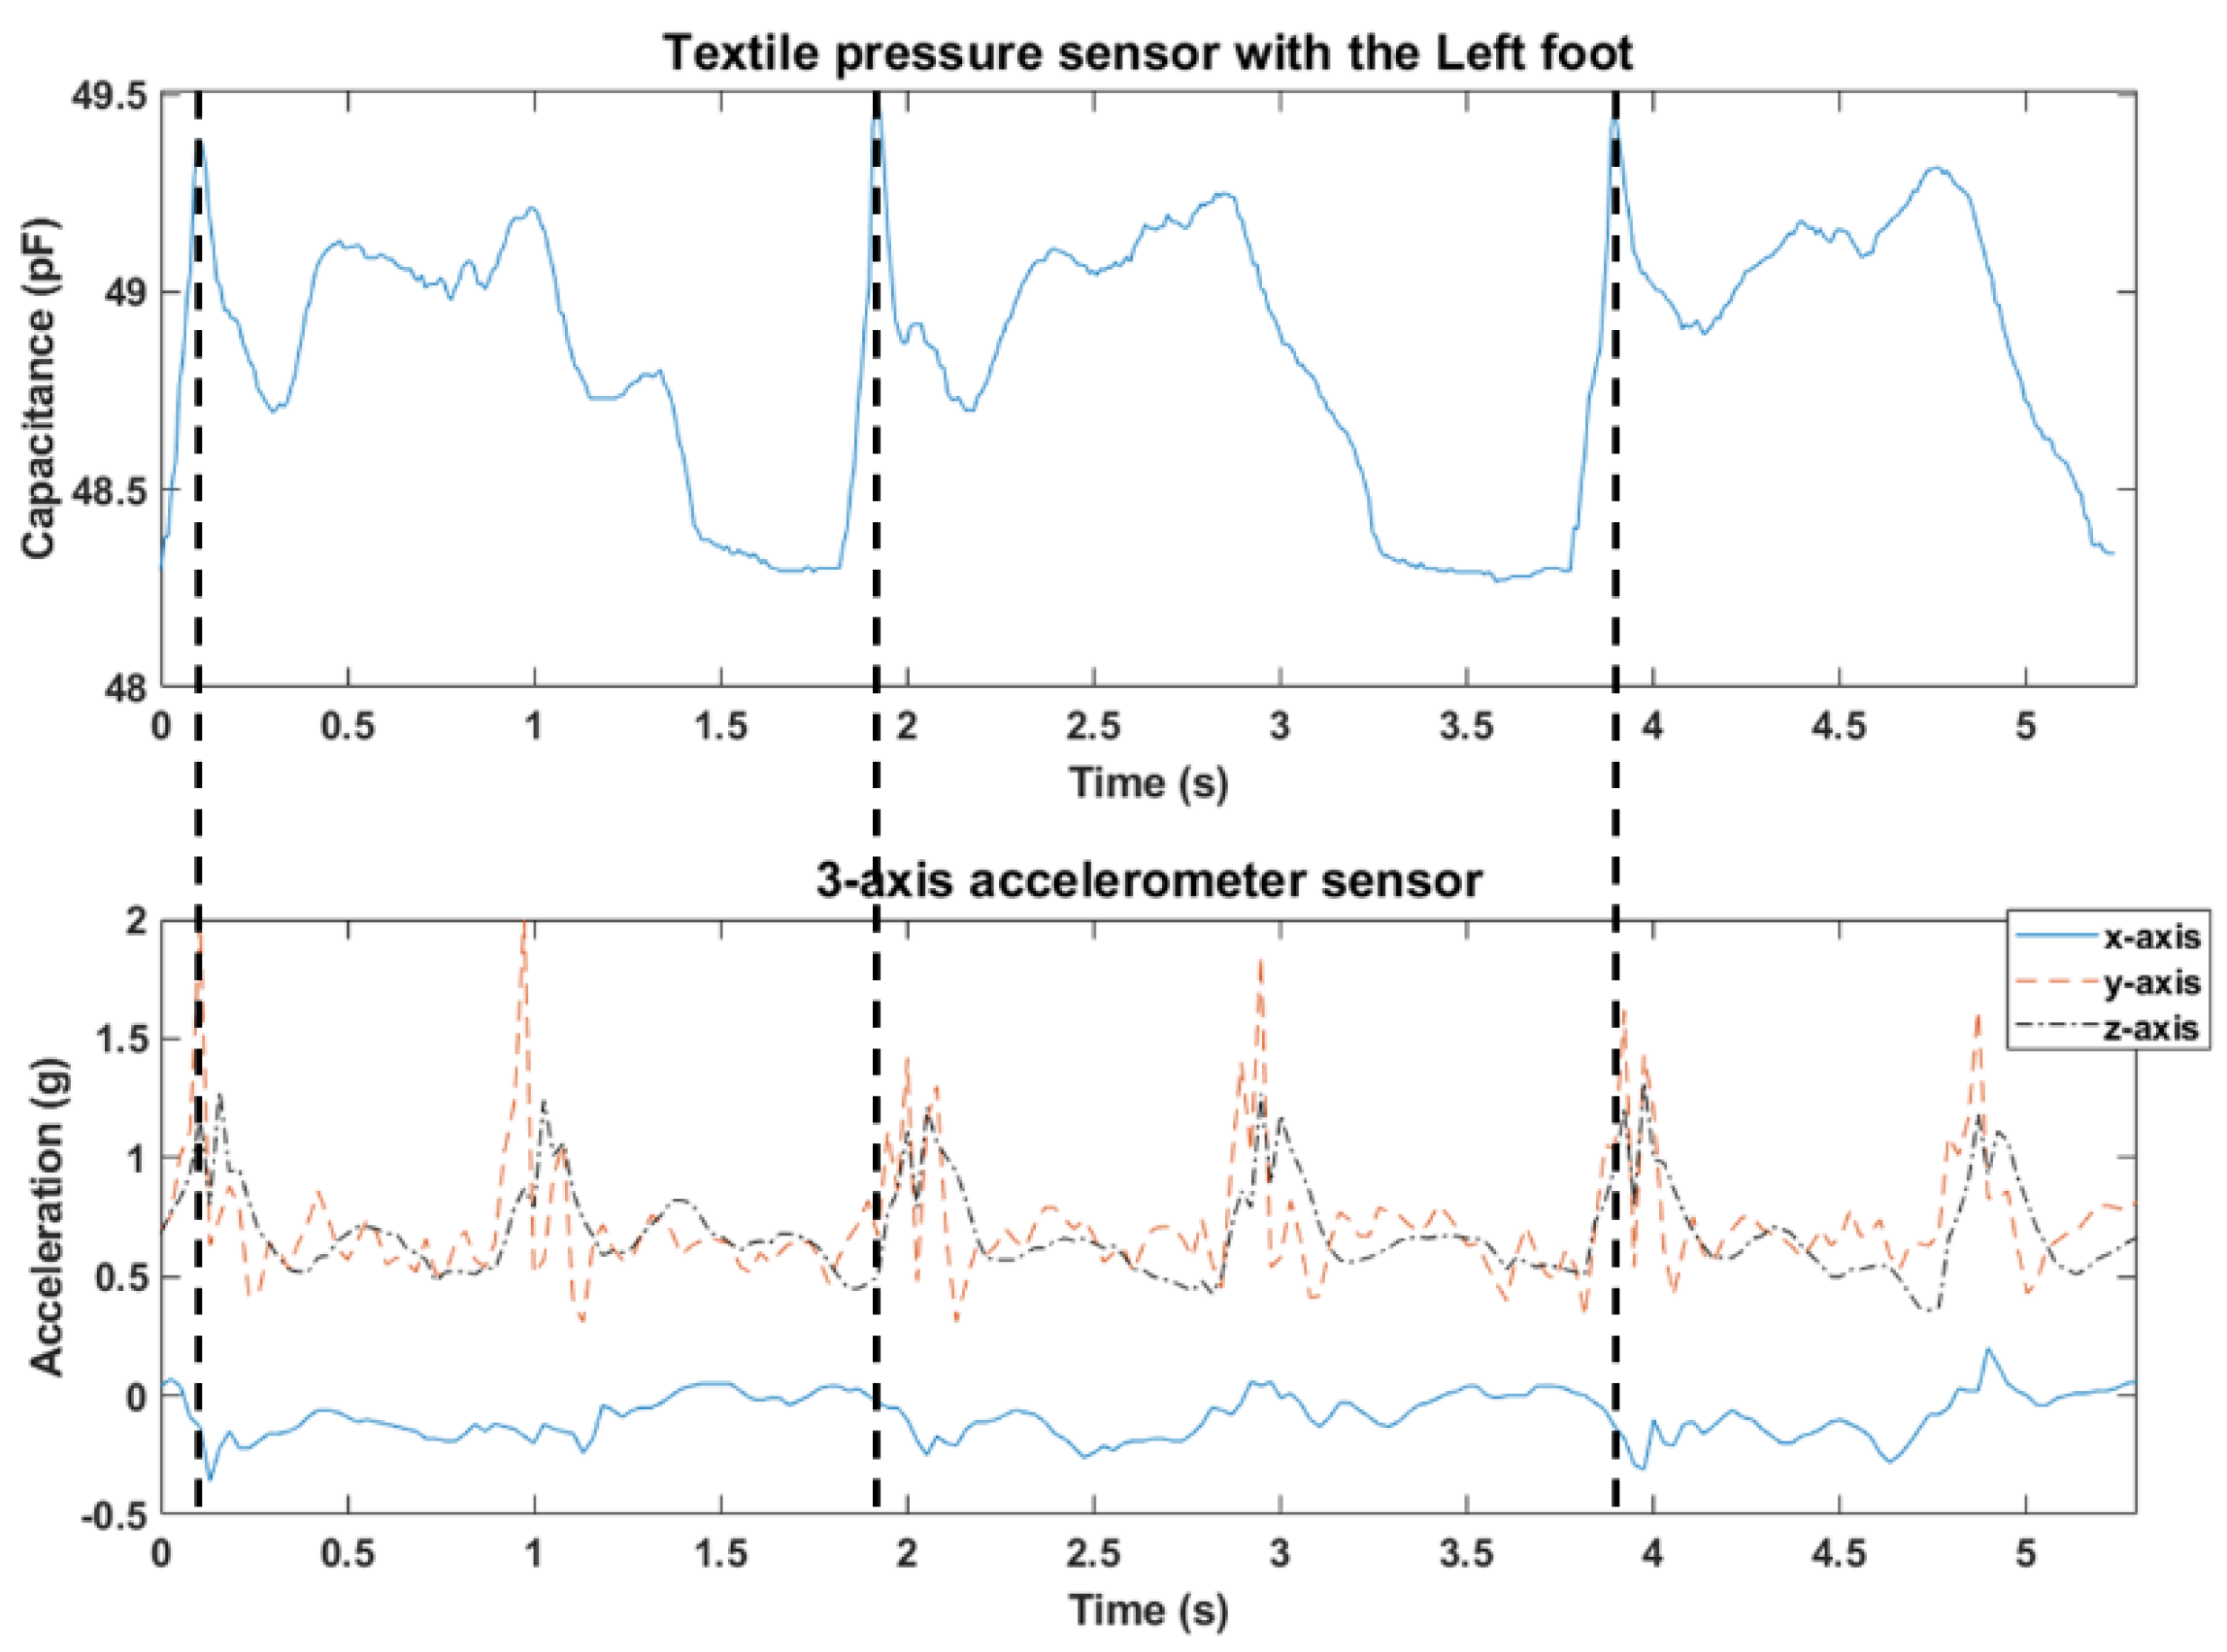
2.3. Signal Processing

A moving average filter was applied to reduce noise components from the data obtained from the Smart Helmet and Smart Shoes. Three-axis accelerometer sensor data was applied with a 5-point moving average filter, and pressure sensor data was applied with a 15-point one. Figure 6a shows the output value of the three-axis accelerometer in the smart helmet. The signal vector magnitude (SVM) was calculated to analyze head movement, as shown in Equation (1).
S V M = x 2 + y 2 + z 2
where x, y, and z are the output values of the three-axis accelerometer sensor (Smart Helmet).
Figure 6b shows the results of the moving average filtered pressure data from the Smart shoes. For plantar pressure analyses, signals from 10 channels of the smart shoe insole were collected while subjects descended a total of 10 stairs, i.e., five steps on each foot. Data from the first and the last steps were excluded due to instability, and the middle three steps (out of five) were used for the analyses. The same method was used for all three experimental conditions (E1, E2, and E3). In this case, pressure indicates capacitance value, of which the unit is pF.

2.4. Data Analysis

Catching the heels on the edges of the stairs or misplaced feet are the main causes of falls while descending stairs [28]. Therefore, we carefully observed how the plantar pressure distribution of each foot area changed with each experiment.

2.4.1. Whole Body Balance Analysis (Smart Shoes)

Data from all 10 channels of the insole in each foot were summed, and the sensor values measured by the pressure of each foot were compared in each experimental conditions. This was to analyze the output change of the whole plantar pressure.

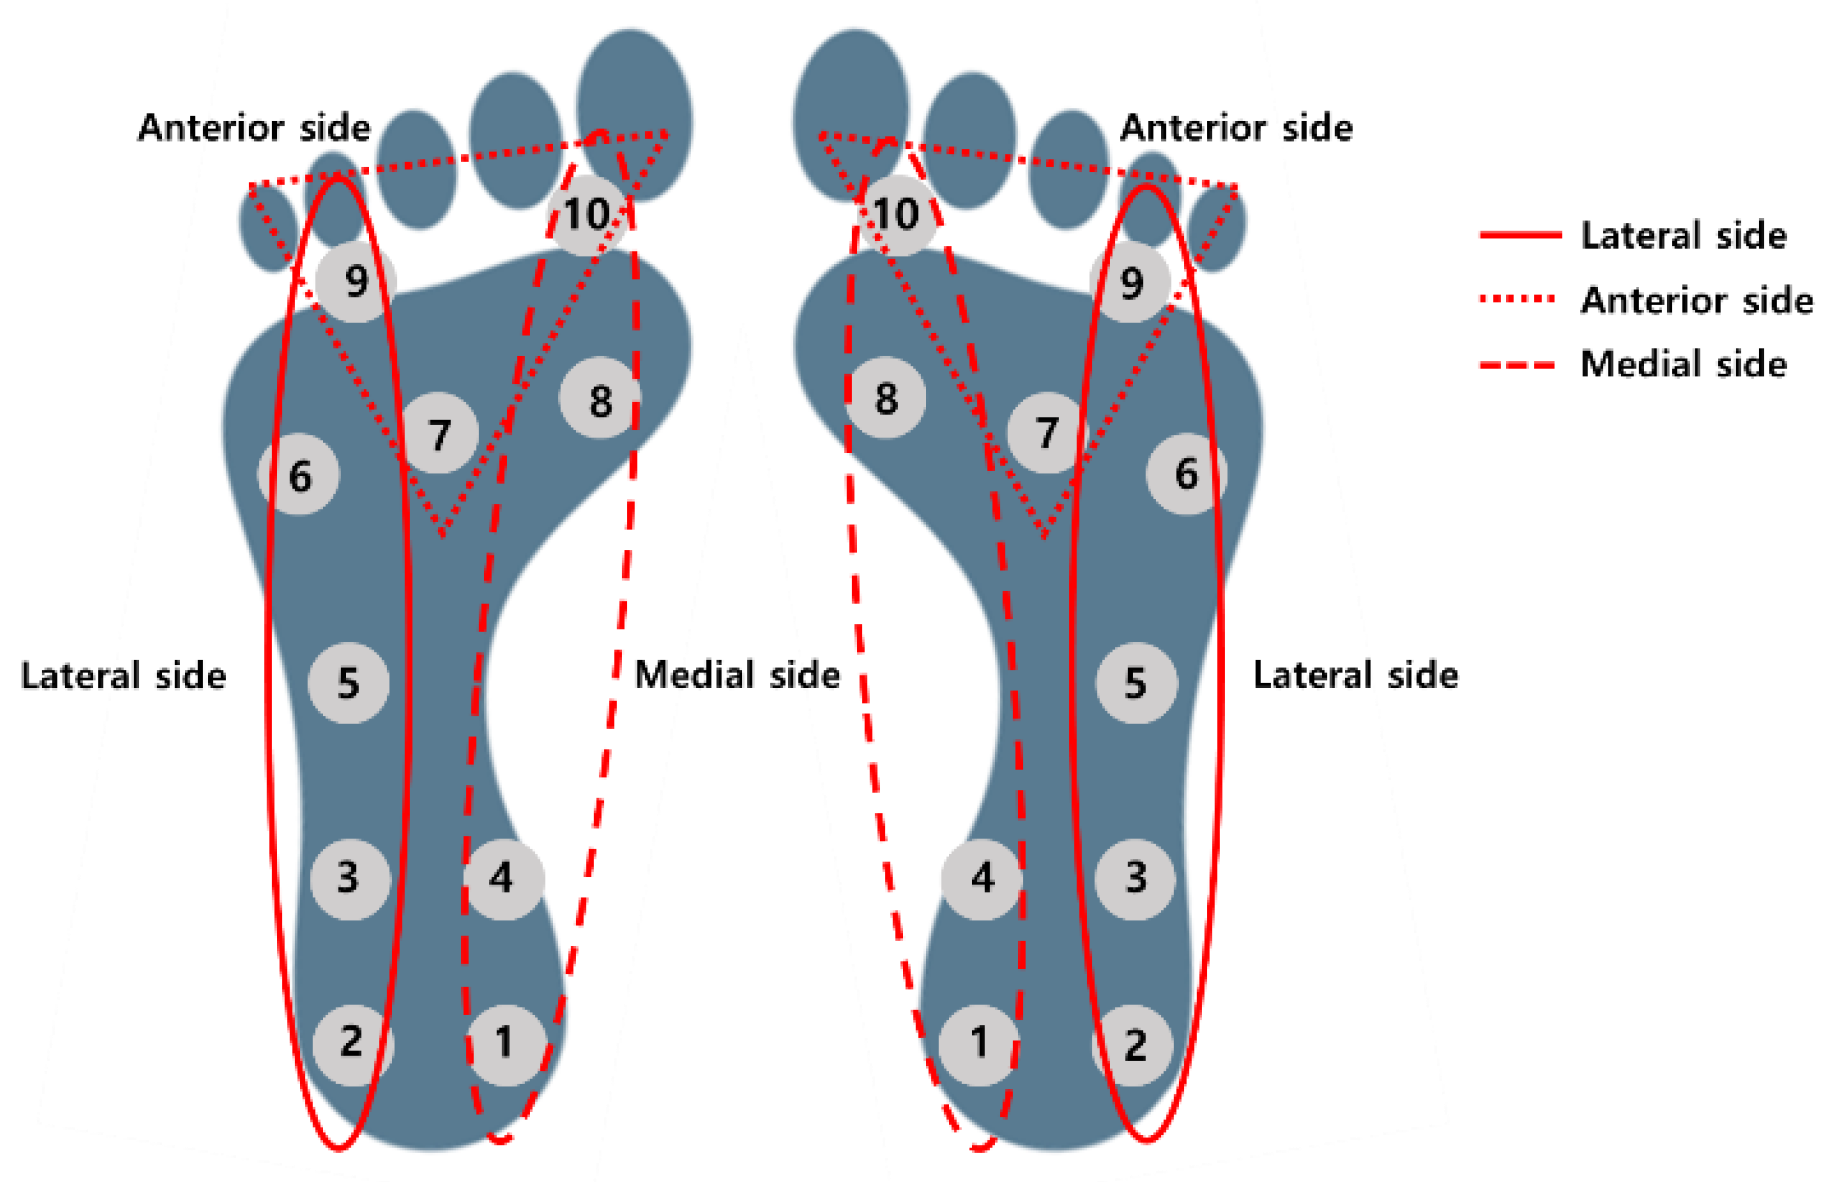
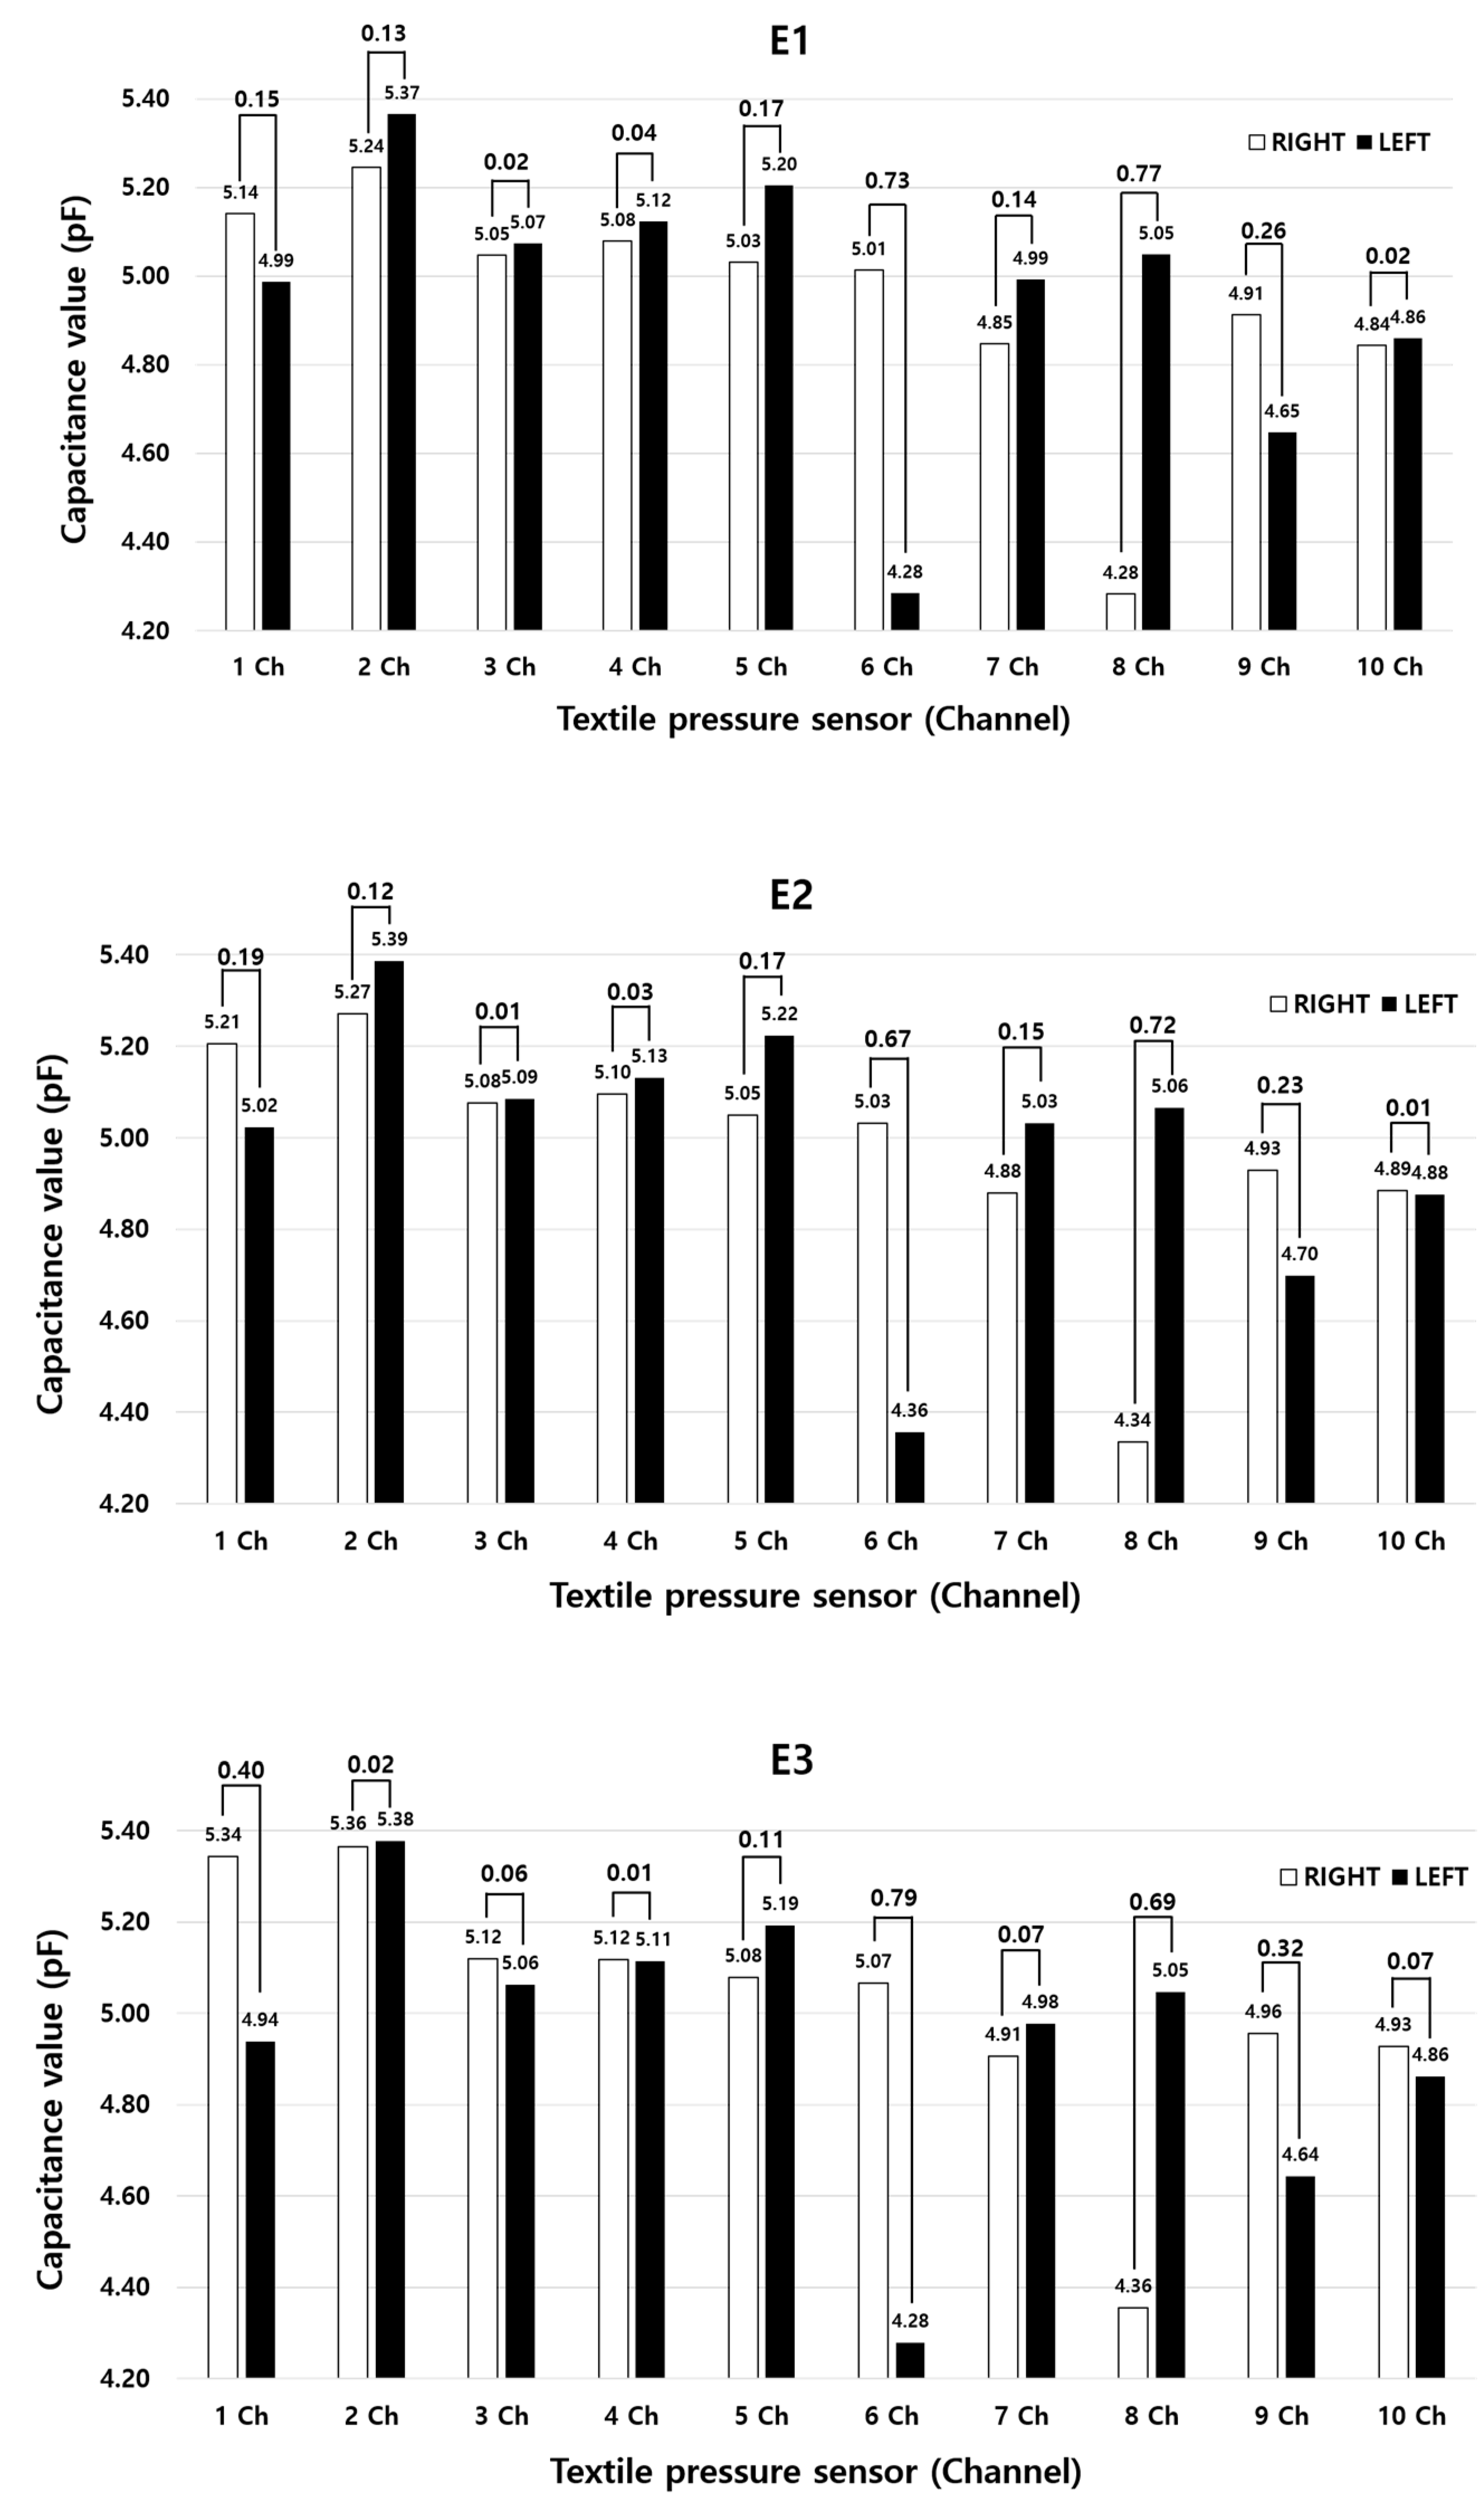
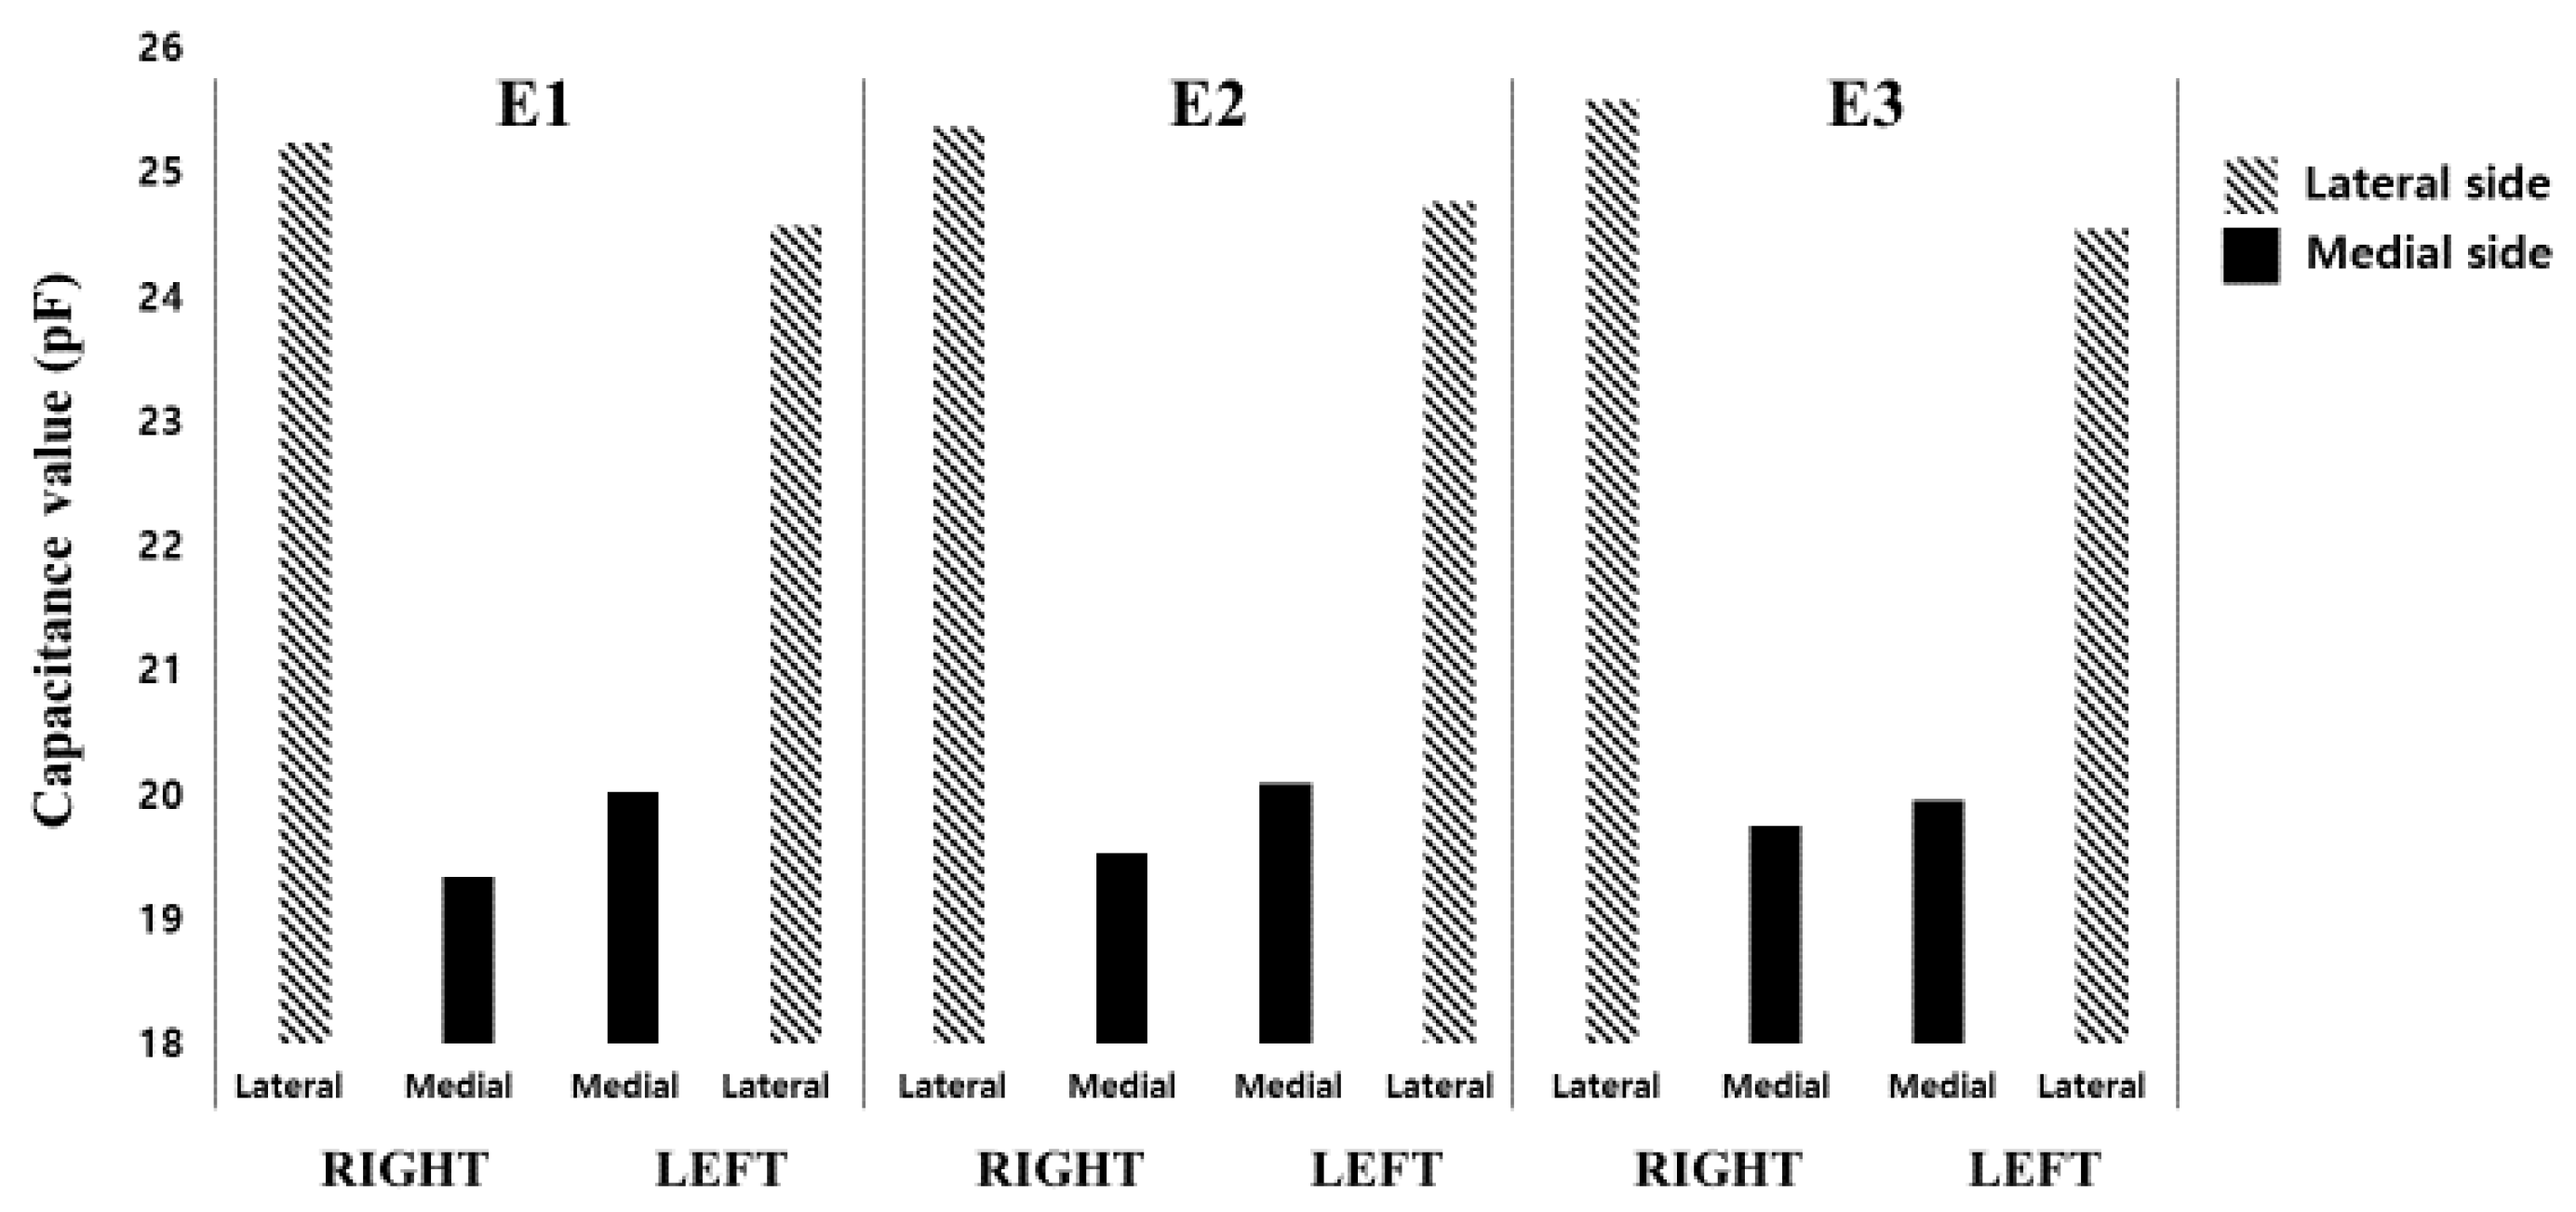
2.4.2. Plantar Pressure Distribution Analysis (Smart Shoes)

According to a previous study [29], changes were observed in the pressure distribution of each foot area as the subjects descended the stairs. Based on this, we examined mediolateral pressure changes within a foot during stair descent. Each side of the subjects’ feet was separately observed by analyzing the pressure data collected from each of the ten channels in one insole sensor (Smart Shoes). Figure 7 shows the channel locations of the capacitive pressure insole sensors. Lateral plantar pressure was analyzed by calculating the data collected from the channels 2, 3, 5, 6, and 9. Medial plantar pressure was based on the channels 1, 4, 8, and 10. Channels 9, 7, and 10 were used to observe anteriorly shifted pressure.

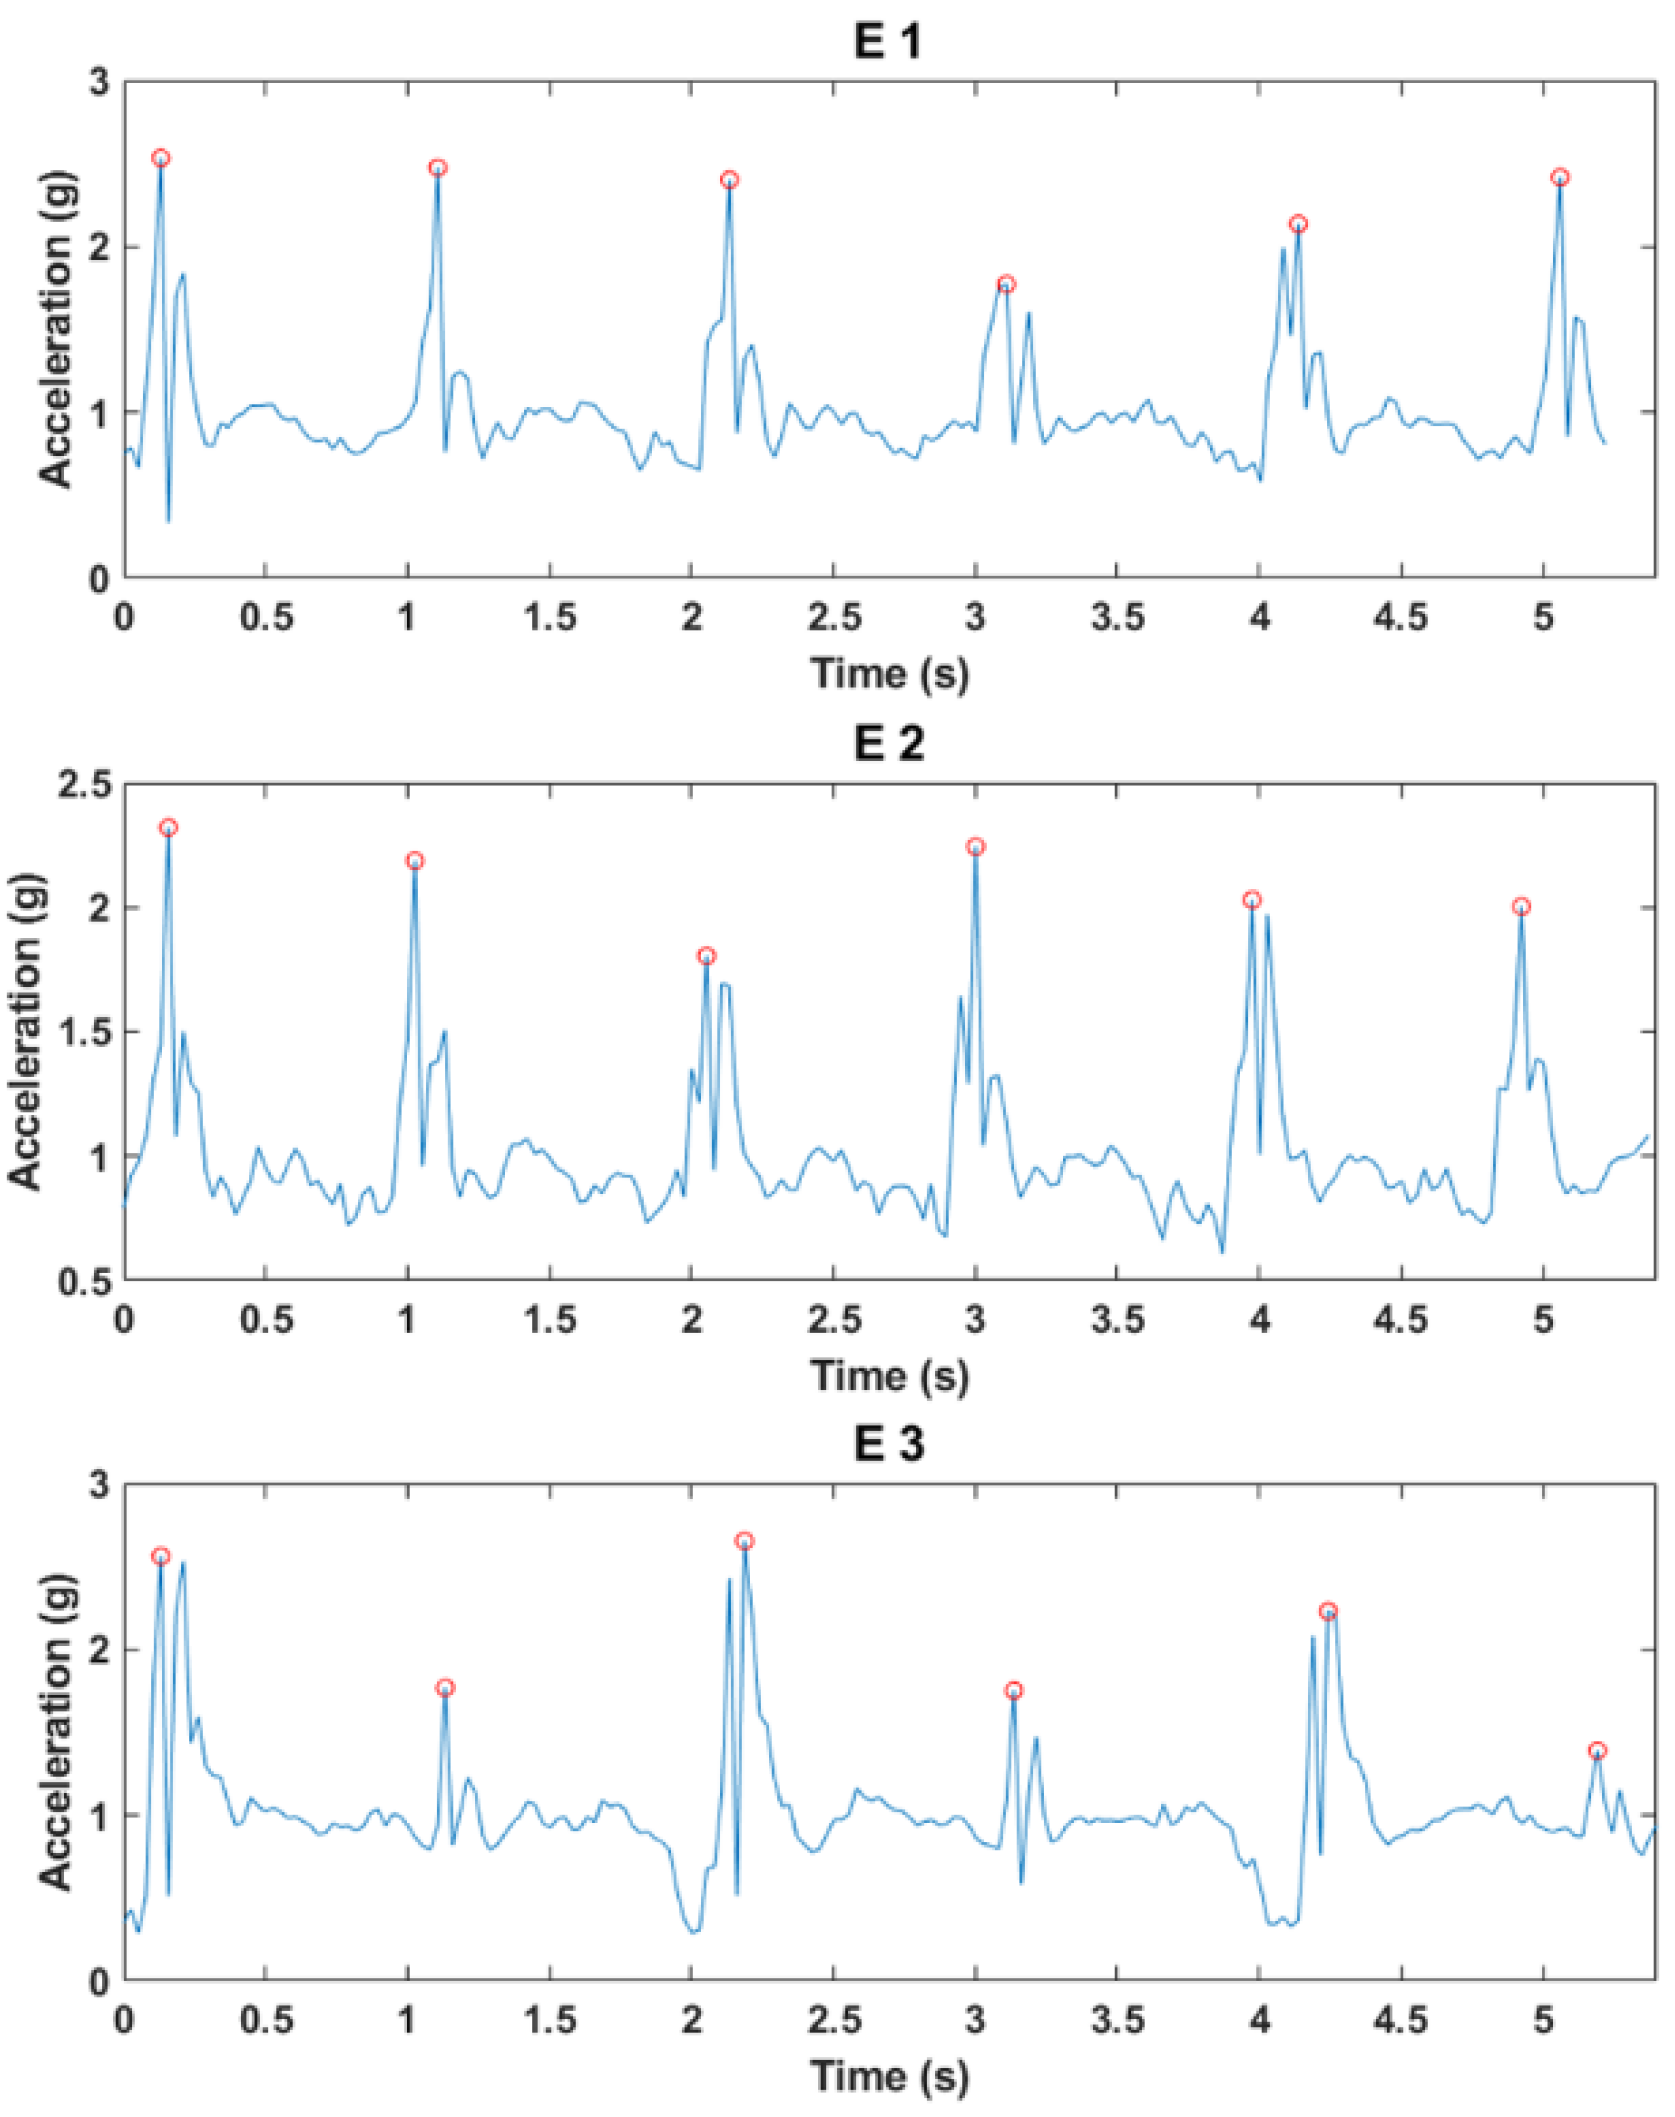
2.4.3. Head Movement Analysis (Smart Helmet)

SVM data refers to the amount of change of the slope. If the SVM value is large, the instantaneous inclination is large, which is commonly the case during falls or slips. Therefore, the SVM data was used to calculate the speed change of the head movement for each experiment, and the peak value of the SVM was calculated and compared for each experiment to observe the strength of the change.
During the stair descent, the three-axis accelerometer in the Smart Helmet detected superior–inferior, anterior–posterior, and medial–lateral head movements. SVM data of the accelerometer sensor were used to analyze the difference between falls and non-falls.

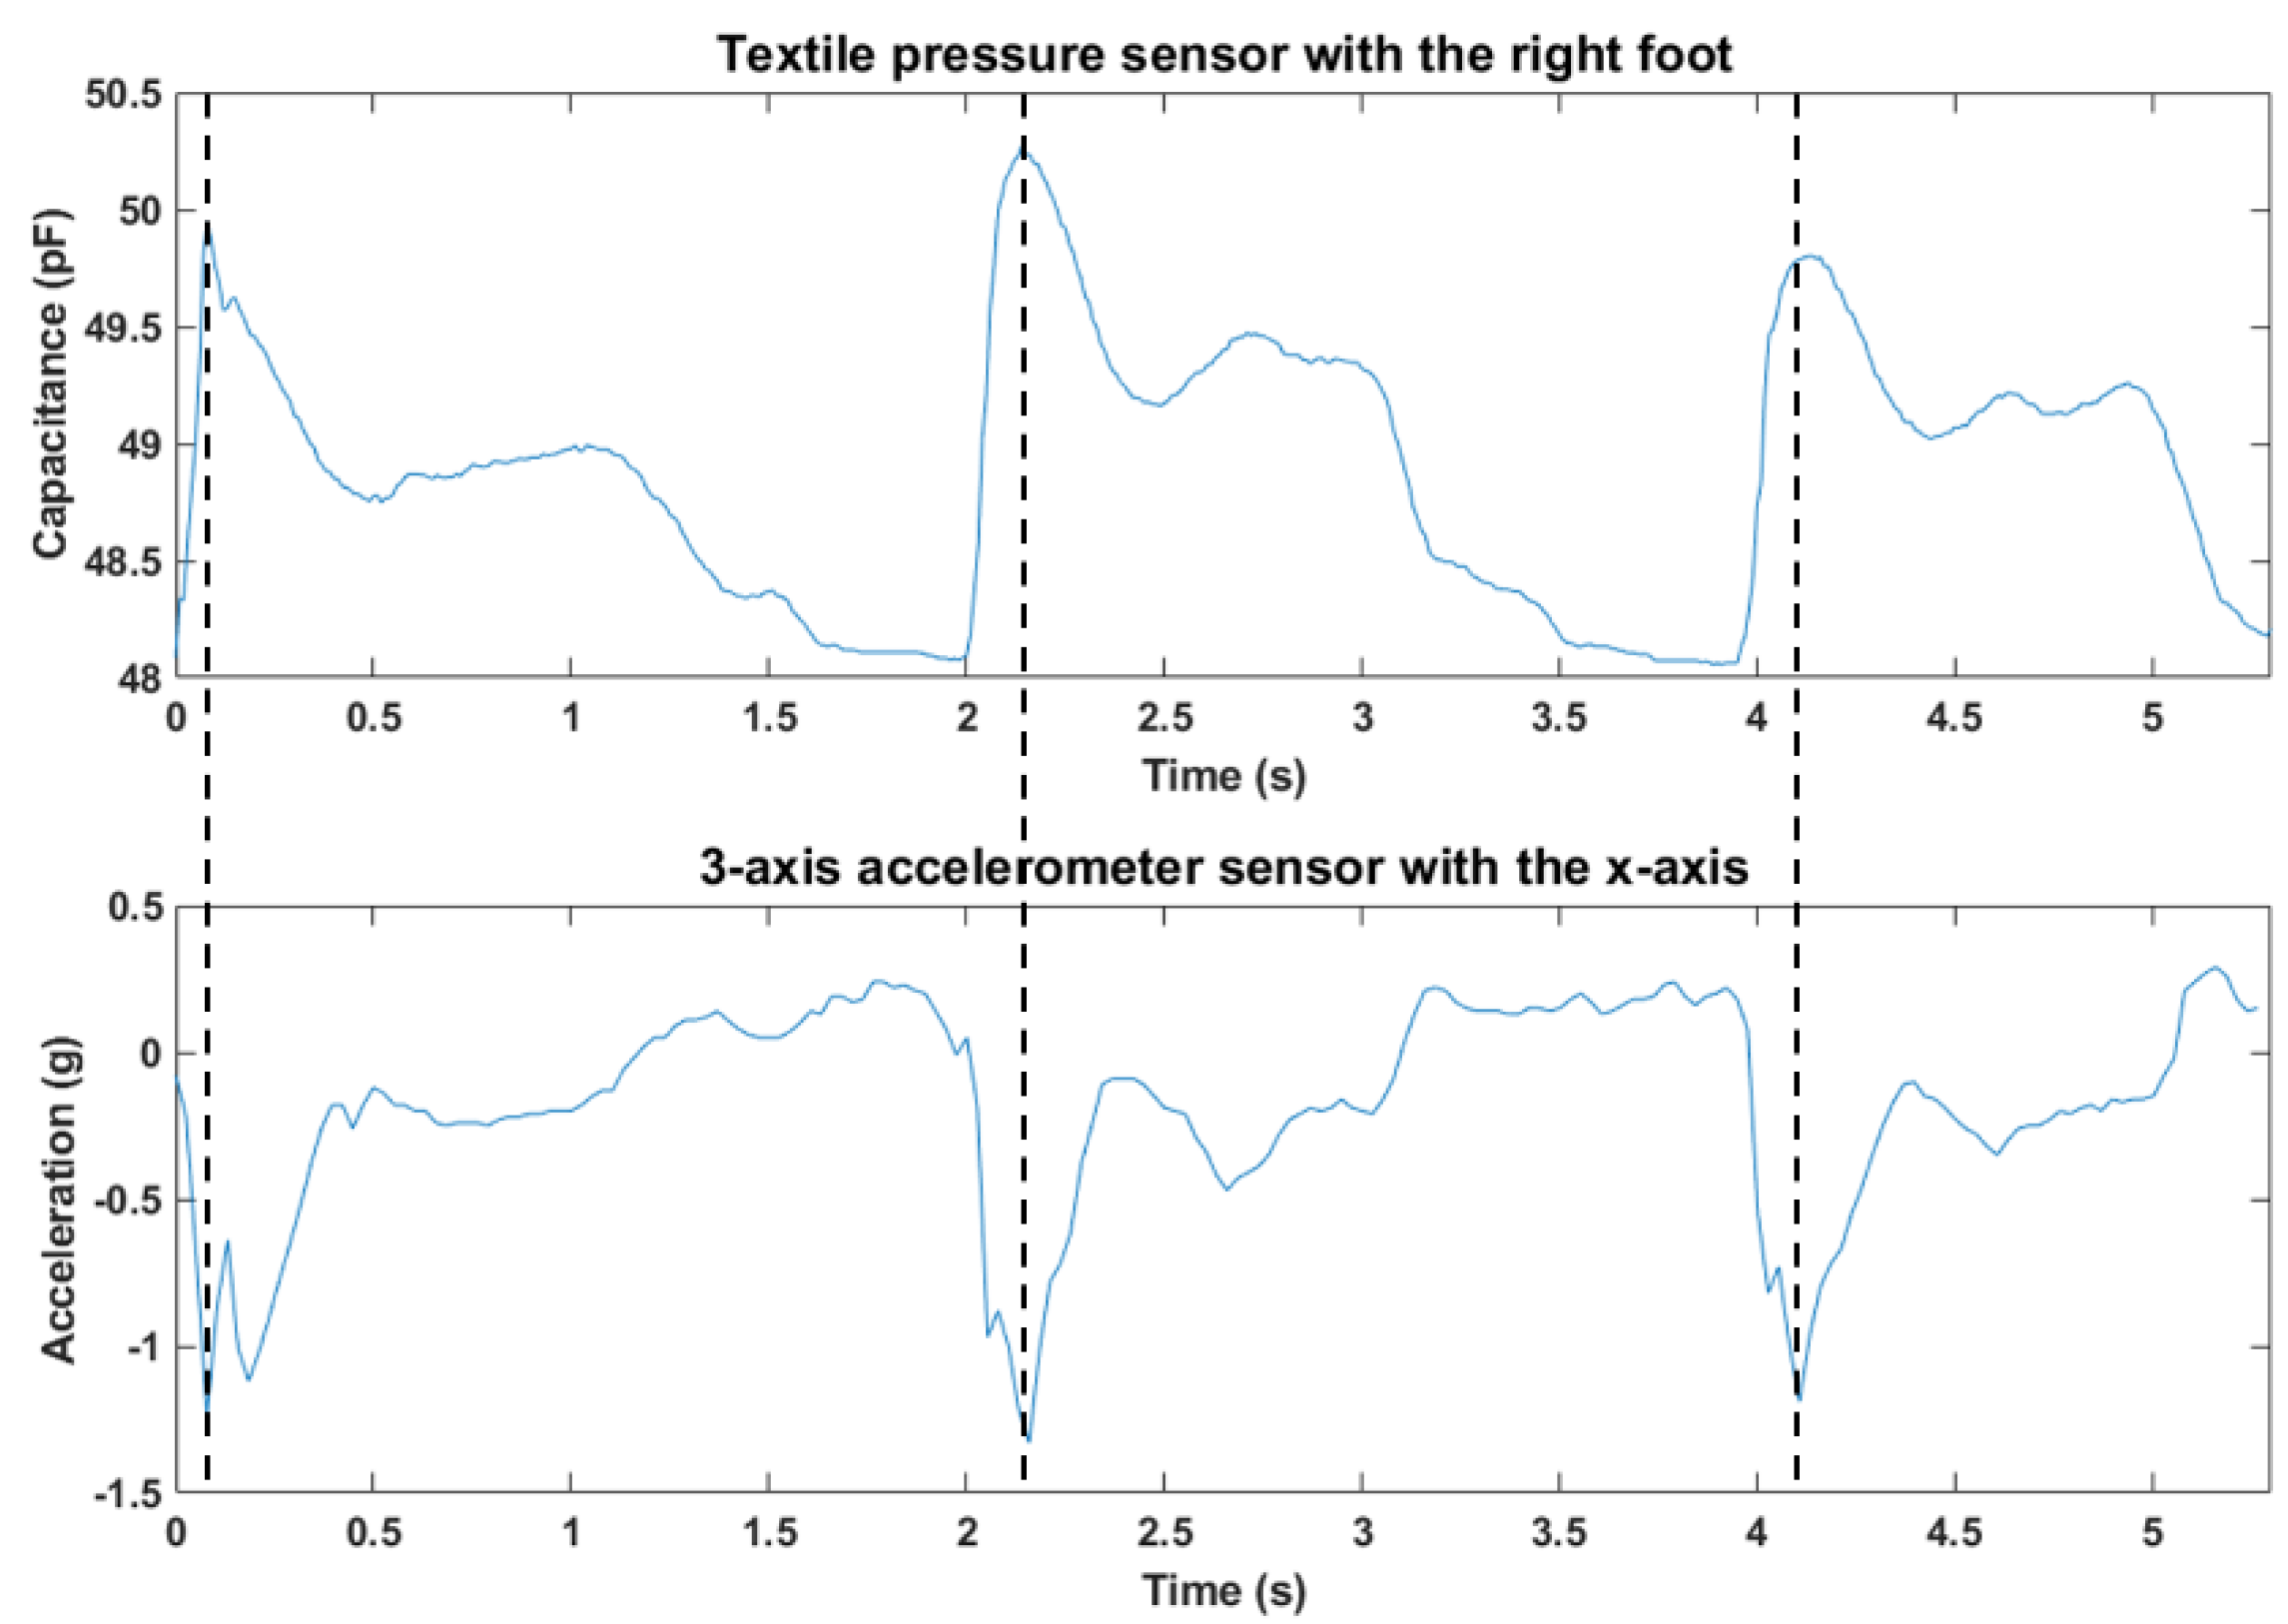
2.4.4. Smart Helmet and Smart Shoe Correlation Analysis

In order to analyze the subjects’ stair descent movements including near falls, the correlation between the head movement data from smart helmet and the plantar pressure distribution data from the smart shoe were compared using summed data from the 10 channels of pressure sensors and the three-axis accelerometer sensor data (Figure 8). The x-axis was used for the analysis of the accelerometer sensor position of the smart helmet, because the y-axis changes when the tilt of the left and right direction changes.
Figure 9 below shows the axial directions of the three-axis accelerometer in the Smart Helmet. The x-axis measured mediolateral movements of the head, where negative ( ) values refer to the right-shifted movements and positive ( + ) values to left-shifted ones. The y axis measured superior–inferior movement of the head; ( ) values were inferior and ( + ) values were superior movements. The z-axis measured the anterior–posterior movement of the head; ( ) values were posterior and ( + ) values were anterior movements.

3. Results

3.1. Results of Whole Body Balance Analysis (Smart Shoe)

Table 2 shows the average plantar pressure values of the right and left feet in each experimental condition. Data from all 10 channels of the insole in each foot were summed and the result of each foot in each condition was calculated by averaging the three highest peaks collected from the middle three steps (out of five steps taken on each foot) of each subject.
In E1, the average sensor values measured by the plantar pressure were 48.45 ± 0.17 pF and 48.75 ± 0.14 pF for the right and left foot, respectively. In E2, the average plantar pressure in the right and left foot was 48.58 ± 0.18 pF and 48.88 ± 0.16 pF, respectively. The average results of E3 were 50.56 ± 0.47 pF and 48.73 ± 0.13 pF in the right and left feet, respectively. In E1 and E2, the plantar pressure was slightly higher in the left foot, but in E3, the pressure was higher in the right foot.
The sensor values in the dominant (right) foot gradually increased as the physical load increased in each condition: 48.45 ± 0.17 pF (E1), 48.58 ± 0.18 pF (E2), 50.56 ± 0.47 pF (E3).

3.2. Results of Plantar Pressure Distribution Analysis (Smart Shoe)

Table 3 shows the results of the sensor values measured by plantar pressure in each channel and on each side of the insole sensor collected under three different experimental conditions. The average sensor value for each channel was calculated as the average of 10 subjects. Channels 1 through 6 (closer to the hindfoot area) had relatively higher pressure on both the right and left feet compared to the pressure detected in channels 7 to 10 (closer to the forefoot area).
Plantar pressure results comparing the right and left foot under each experimental condition showed that channels 6, 8, and 9 had the greatest difference under all of the three conditions (Figure 10). Plantar pressure was 0.73 pF higher in the right foot (Ch 6), 0.77 pF higher in the left foot (Ch 8), and 0.26 pF higher in the right foot (Ch 9) in E1. Plantar pressure was 0.67 pF higher in the right foot (Ch 6), 0.72 pF higher in the left foot (Ch 8), and 0.23 pF higher in the right foot (Ch 9) in E2. However, E3 had slightly different results; plantar pressure was 0.40 pF in the right foot (Ch 1), 0.79 pF higher in the right foot (Ch 6), 0.69 pF higher in the left foot (Ch 8), and 0.32 pF higher in the right foot (Ch 9).
As shown in Table 4 and Figure 11 below, plantar pressure was higher in the lateral areas of both the right and left feet. The sum of the lateral plantar pressure in the right foot gradually increased from 25.24 ± 0.12 pF (E1) to 25.36 ± 0.37 pF (E2) to 25.59 ± 0.15 pF (E3). Plantar pressure on the medial side was found to be noticeably lower than the lateral side, and the left foot had higher medial plantar pressure than the right foot under all three experimental conditions: 19.34 ± 0.39 pF and 20.02 ± 0.11 pF (E1); 19.54 ± 0.39 pF and 20.09 ± 0.11 pF (E2); 19.75 ± 0.42 pF and 19.96 ± 0.11 pF (E3) on the right and left side, respectively.

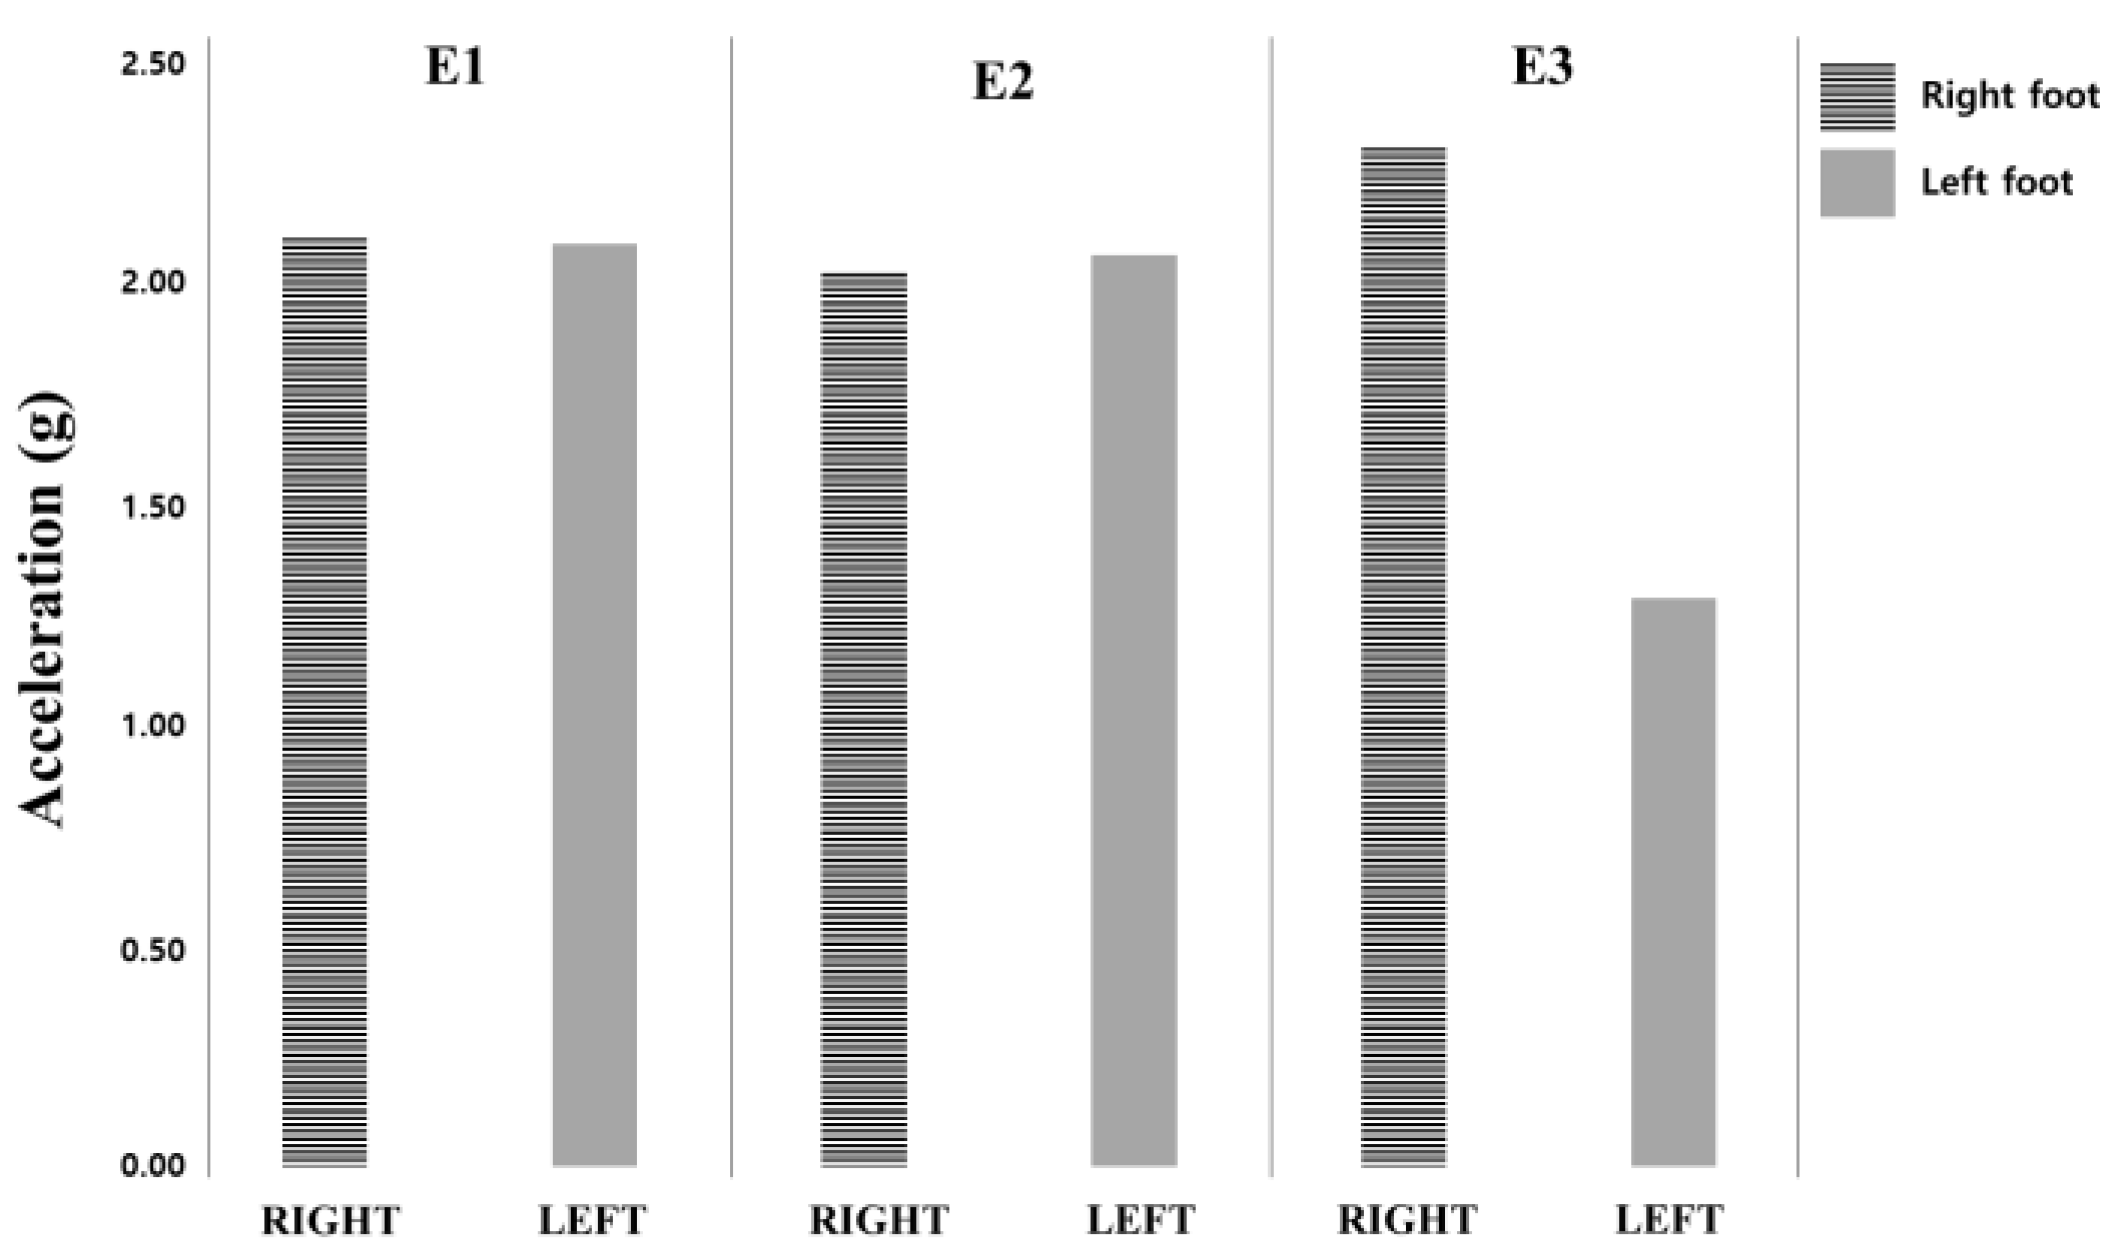
3.3. Results of Head Movement Analysis (Smart Helmet)

Figure 12 shows the results of SVM data collected from the Smart Helmet during stair descent. Out of the five steps taken down the stairs on each foot, the middle three steps were analyzed; three peak plantar pressure values from each foot were temporally matched with the SVM data of the head movements.
In E1 and E2, the head movement pattern and the plantar pressure changes were well-matched bilaterally, but in E3, the head movements were visibly different according to bilaterally different leg movements (Smart Shoe data) as a near fall was simulated.
Table 5 and Figure 13 present the results of SVM data collected from the Smart Helmet under each experiment condition. The highest head tilt movement at the time of foot contact during stair descent was found in E3 in the right foot (2.31 ± 0.28 g). The second highest head tilt was observed in E1 in the right foot (2.10 ± 0.25 g).

3.4. Results of Smart Helmet and Smart Shoe Correlation Analysis

Table 6 and Figure 14 present the results of a correlation analysis between the raw data of the whole plantar pressure and raw data of the x-axis of accelerometer sensor in E3. The R2 value of the right foot showed negative correlation between two sensors data (p < 0.05). In the case of the R2 value of the left foot, 2, 5, 7, and 8 subjects showed a p-value which was less than 0.05. Unlike the right foot, both negative and positive correlations were observed.

4. Discussion

In this study, we developed Smart Helmet and Smart Shoes to detect near fall incidence during stair descent and analyzed the changes in weight bearing.
Due to wearing a backpack weighing 15 kg (E2), the plantar pressure value on both the right and left foot was higher than that of natural descent (E1). As a result, the subject’s center of weight and neck were tilted forward to avoid falling. However, this can put a strain on back and cause a slipped disc [30]. Johnson et al. (1995) reported that backpack weight can cause back pain, muscle soreness, numbness, shoulder pain, and muscle fatigue [31]. For this, a previous study has been undertaken on safe weight carrying limits for construction workers [32]; the weight limit per person was 15 kg on construction site in Korea. Therefore, we applied a weight of 15 kg.
In the near fall simulation (E3), the plantar pressure value in each side of the foot was higher in general compared to that of E1 and E2. The difference in plantar pressure between the right and left foot in E3 was also greater than that of E1 and E2. This is considered to be caused by the near fall incident in E3. Antwi-Afari et al. (2018) undertook a fall risk assessment of construction workers using center of pressure (COP) with wearable insole pressure sensors. They demonstrated that the difference of peak pressure with the loss of balance events was about four times higher than during natural stair descent (p-value < 0.05) [33]. We also confirmed similar findings in this study.
In the case of E1 and E2, we found an interesting point where the left foot had a higher plantar pressure value than the right foot. It appeared that the size of the sensor was the same, i.e., 2 × 2 cm, but the capacitance value of one channel may have been larger due to human error. This may also have been due to differences in footwear and foot structure. Moreover, the reason for the higher left foot pressure in the E1 and E2 experiments was because the handrail was located on the left side of the stairs where the experiment was performed, while the wall was on the right side. Hence, the subjects moved their weight toward the handrail to avoid falling unintentionally during the experiment. The results of this study are expected to help prevent the occurrence of back injury by monitoring the individual load assessment of construction workers. It also shows that Smart Shoes can check for near fall incidents.
Rao et al. (2012) studied the effect of activity on regional plantar loading in different regions of the foot during stair descent [29]. They observed high plantar pressure values in the heel and central forefoot regions, which is in perfect agreement with the results of our experiment. They also reported that it is controversial to report which region has the highest pressure. In the studies by Rozema et al. (1996) and Maluf et al. (2004), lower plantar pressure values in the heel were reported during stair descent [34,35]. On the other hand, some studies have observed lower pressure values at the hallux [36].
Looking at the plantar pressure distribution of both feet in the mediolateral area, we found that the pressure values of lateral areas was higher than those of medial areas for both feet in all experiments, as shown in Table 4 and Figure 13. In our experiment, we selected subjects who had never had walking-related musculoskeletal disorders, so the pressure distribution in the lateral area was larger to prevent from falling. Conversely, larger pressure distribution in the medial area can be seen among knock-knee patients.
SVM data is widely used to recognize activity in a way that obtains magnitude by ignoring the direction of the vector about three axes [37]. The average SVM difference between E1 and E2 was 0.081 g for the right foot and 0.025 g for the left foot, and the average difference between SVM between E1 and E3 was 0.212 g for the right foot and 0.804 g for the left foot. E3 has a larger SVM average difference than E1 compared to E2, and has the same results as the previous study [38]. In E3, as soon as the right foot touched the ground on the stairs, the body was out of balance and sharply tilted to the right, resulting in high SVM data on the right foot. As a result, the SVM difference between the right and left foot in E3 was higher than those of E1 and E2, which means that the balance of the body is unstable.
Previous studies related to fall detection systems using textile pressure sensors and three-axis accelerometers have shown that there are few studies that detect falls using both sensors simultaneously [39]. They reported that the detection of falls using only pressure sensors is poorly-suited to determining if the subject is falling or if the body merely moved slightly left and right while descending the stairs. They also reported that three-axis accelerometer sensor data has limitations for identifying falls, because the three-axis accelerometer data from normal, everyday movements and those from falls are similar, and disturbances cause noise in the data. They found that the best fall detection rates were obtained by analyzing the data of the pressure sensor and the accelerometer sensor together.
Bai et al. (2013) reported that if the body flips after the fall, it will face in a different direction, and a change will occur in the x, y, and z axes before and after the fall [40]. Based on this, we selected the x-axis to observe changes of the left and right tilt for correlation analyses with the pressure sensor.
A correlation analysis was performed to detect falls using raw data of the whole plantar pressure and raw data of the x-axis in E3; the R2 values of the right foot showed negative correlation among all subjects (p-value <0.05) as shown in Table 6. When the value of the textile pressure sensor of the right foot was the largest, it was the moment when the center of the body moves to the right. Therefore, the x-axis value of the accelerometer sensor was lowered and then the center of the body returned to its original state to maintain of body balance. At the same time, the value of the textile pressure sensor decreased and the x-axis value increased. So, the data of the two sensors showed a negative correlation.
We have confirmed that our sensors can distinguish between a worker lifting and not lifting heavy loads, and the difference between falling and non-falling. Our system is also very inexpensive and has the advantage of being applicable to construction sites.
Nevertheless, there are a few weaknesses in our research. We considered and discussed only the results of our proposed experimental procedure without analyzing the similarity and relationship between fall cases which actually occur on construction sites and those in our experiments. The number of subjects participating in the experiment was limited and we did not test subjects of different ages, so it is difficult to generalize the results of this study. We did not consider the height of the stairs, the degree of slippage, and the ambient light in these experiments. In addition, although it would need to be possible to use such technology for a long time in a real construction site setting, this study did not evaluate the performance verification of the battery. According to previous studies [41,42], the pressure data for each foot area differed with changes in walking speed during stair descent. However, we did not consider the speed of the descent.
In the future, we intend to design an experimental protocol by subdividing and modeling the fall types that occur on the stairs of an actual construction site. Based on this, we also intend to prove the reliability of our experimental procedure and plan to recruit more subjects to generalize the research results in consideration of the height, slipperiness, and illumination of the stairs, and walking speeds of the subjects.

5. Conclusions

Our proposed Smart Helmet and Smart Shoes were shown to have relatively good performance in terms of classifying the weight-shifting patterns in the head and the feet during stair descent. The results of this study may be helpful in detecting near falls of construction site workers to prevent work-related injuries in the future.

Author Contributions

Conceptualization, Y.K., C.W.; writing—original draft preparation, C.W.; writing—review and editing, Y.K.; software, D.G.K.; data curation, S.H.L.; investigation, S.H.L.; supervision, S.D.M., Y.K.; project administration, S.D.M. All authors have read and agreed to the published version of the manuscript.

Funding

This study was supported by Basic Research Program through the National Research Foundation of Korea (NRF) funded by the Ministry of Education (NO.2017R1A2B1011776) and was supported by a grant (NRF-2015M3A9D7067388) of the Bio & Medical Technology Development Program of the National Research Foundation (NRF) funded by the Ministry of Science and ICT.

Conflicts of Interest

The authors declare no conflict of interest.

References

  1. Son, C.B. An Analysis on the Technical Training of Construction Skilled Workers and Its Improvement Measures. J. Korea Inst. Build. Constr. 2019, 19, 255–261. [Google Scholar]
  2. Yaghmaie, S. Investigation of Fall Accidents in the Construction Industry by Implementation of Design for Safety Concept. Doctoral Dissertation, Wayne State University, Detroit, MI, USA, 2019. [Google Scholar]
  3. Ahn, C.R.; Lee, S.H.; Sun, C.; Jebelli, H.; Yang, K.H.; Choi, B.J. Wearable Sensing Technology Applications in Construction Safety and Health 2019. J. Constr. Eng. Manag. 2019, 145, 3119007. [Google Scholar] [CrossRef]
  4. Ngwu, F.A.; Alabere, I.D.; Douglas, K.E. Prevalence of Falls and Associated Factors among Construction Workers in Port Harcourt, Nigeria. Asian J. Med. Health 2019, 14, 1–16. [Google Scholar] [CrossRef] [Green Version]
  5. Nasarwanji, M.F.; Mayton, A.G.; Pollard, J. Why Slips, Trips, and Falls Are Still Problem: A Hazard Assessment at Surface Mines. Proc. Hum. Factors Ergon. Soc. Annu. Meet. 2019, 63, 1856–1860. [Google Scholar] [CrossRef]
  6. Kemmlert, K.; Lundholm, L. Slips, trips and falls in different work groups—With reference to age and from a preventive perspective. Appl. Ergon. 2001, 32, 149–153. [Google Scholar] [CrossRef]
  7. Yoon, H.Y.; Lockhart, T.E. Nonfatal occupational injuries associated with slips and falls in the United States 2006. Int. J. Ind. Ergon. 2006, 36, 83–92. [Google Scholar] [CrossRef] [PubMed] [Green Version]
  8. Jung, E.K. Injury Prevention for Healthy & Safe Society; Korea Centers for Disease Control and Prevention (KCDC): Cheongju, Korea, 2018; pp. 6–11. [Google Scholar]
  9. Wu, J.; Feng, Y.; Sun, F. Sensor Fusion for Recognition of Activities of Daily Living. Sensors 2018, 18, 4029. [Google Scholar] [CrossRef] [Green Version]
  10. Mao, A.; Ma, X.; He, Y.; Luo, J. Highly Portable, Sensor-Based System for Human Fall Monitoring. Sensors 2017, 17, 2096. [Google Scholar] [CrossRef] [Green Version]
  11. Yang, K.H.; Ahn, C.R.; Vuran, M.C.; Aria, S.S. Semi-supervised near-miss fall detection for ironworkers with a wearable inertial measurement unit. Autom. Constr. 2016, 68, 194–202. [Google Scholar] [CrossRef] [Green Version]
  12. Dzeng, R.J.; Fang, Y.C.; Chen, I.C. A feasibility study of using smartphone built-in accelerometers to detect fall portents. Autom. Constr. 2014, 38, 74–86. [Google Scholar] [CrossRef]
  13. Kenny, R.A.; Scanaill, C.N.; McGrath, M. Falls prevention in the home: Challenges for new technologies. Intell. Technol. Bridg. Grey Digit. Divid. 2011, 46–64. [Google Scholar] [CrossRef]
  14. Altman, I.; Wohlwill, J.F. Human Behavior and Environment: Advances in Theory and Research; Springer Science & Business Media: New York, NY, USA, 2017. [Google Scholar]
  15. Gifford, R. Environmental Psychology: Principles and Practice, 4th ed.; Optimal Books: Colville, WA, USA, 2007. [Google Scholar]
  16. Light, J.; Cha, S.; Chowdhury, M. Optimizing pressure sensor array data for a smart-shoe fall monitoring system. In Proceedings of the 2015 IEEE SENSORS, Busan, Korea, 1–4 November 2015; pp. 1–4. [Google Scholar] [CrossRef]
  17. Chaccour, K.; Assaad, H.A.; Hassani, A.H.; Darazi, R.; Andres, E. Sway analysis and fall prediction method based on spatio-temporal sliding window technique. In Proceedings of the 2016 IEEE 18th International Conference on e-Health Networking, Applications and Services (Healthcom), Munich, Germany, 14–16 September 2016; pp. 1–6. [Google Scholar] [CrossRef]
  18. Habbal, F.; Habbal, F.; Nuaimi, A.A.; Shimmari, A.A.; Safi, A.; Abhushuqair, T. PPEs Compliance Technology to Legalize the Automated Monitoring of Safety Standards. In Proceedings of the 36th ISARC, Banff, AB, Canada, 21–24 May 2019; pp. 838–845. [Google Scholar] [CrossRef] [Green Version]
  19. Melzner, J.; Zhang, S.; Teizer, J.; Bargstadt, H.J. A case study on automated safety compliance checking to assist fall protection design and planning in building information models. Constr. Manag. Econ. 2013, 31, 661–674. [Google Scholar] [CrossRef]
  20. Byeon, J.H.; Jang, M.S.; Choi, S.W.; Yoo, H.D.; Lee, E.H. A Study on Smart Helmet to Efficiently Cope with the Operation and Safety of Workers in Industrial Settings. Int. J. Control Autom. 2018, 11, 169–178. [Google Scholar] [CrossRef]
  21. Kim, S.H.; Wang, C.W.; Min, S.D.; Lee, S.H. Safety Helmet Wearing Management System for Construction Workers Using Three-Axis Accelerometer Sensor. Appl. Sci. 2018, 8, 2400. [Google Scholar] [CrossRef] [Green Version]
  22. Xu, S.; Wang, Y.; Shi, L.; Gu, Y. An Advanced Deep Learning Approach for Safety Helmet Wearing Detection. In Proceedings of the International Conference on Internet of Things and IEEE Green Computing and Communications and IEEE Cyber, Physical and Social Computing and IEEE Smart Data, Atlanta, GA, USA, 14–17 July 2019; pp. 669–674. [Google Scholar] [CrossRef]
  23. Dong, S.; Li, H.; Yin, Q. Building information modeling in combination with real time location systems and sensors for safety performance enhancement. Saf. Sci. 2018, 102, 226–237. [Google Scholar] [CrossRef]
  24. Wang, C.W.; Kim, Y.; Min, S.D. Soft-Material-Based Smart Insoles for a Gait Monitoring System. Materials 2018, 11, 2435. [Google Scholar] [CrossRef] [PubMed] [Green Version]
  25. Wang, C.W.; Kim, Y.; Shin, H.S.; Min, S.D. Preliminary Clinical Application of Textile Insole Sensor for Hemiparetic Gait Pattern Analysis. Sensors 2019, 19, 3950. [Google Scholar] [CrossRef] [Green Version]
  26. Snoek, J.; Hoey, J.; Stewart, L.; Zemel, R.S.; Mihailidis, A. Automated detection of unusual events on stairs. Image Vis. Comput. 2009, 27, 153–166. [Google Scholar] [CrossRef]
  27. Parra-Dominguez, G.S.; Taati, B.; Mihailidis, A. 3D Human Motion Analysis to Detect Abnormal Events on Stairs. In Proceedings of the 2012 Second Joint 3DIM/3DPVT Conference: 3D Imaging, Modeling, Processing, Visualization & Transmission, Zurich, Switzerland, 13–15 October 2012; pp. 97–103. [Google Scholar] [CrossRef]
  28. Zietz, D.; Johannsen, L.; Hollands, M. Stepping characteristics and Centre of Mass control during stair descent: Effects of age, fall risk and visual factors. Gait Posture 2011, 34, 279–284. [Google Scholar] [CrossRef]
  29. Rao, S.; Carter, S. Regional plantar pressure during walking, stair ascent and descent. Gait Posture 2012, 36, 265–270. [Google Scholar] [CrossRef]
  30. Lundeen, S.; Lundquist, K.; Cornwall, M.W.; McPoil, T.G. Plantar pressures during level walking compared with other ambulatory activities. Foot Ankle Int. 1994, 15, 324–328. [Google Scholar] [CrossRef] [PubMed]
  31. Johnson, R.F.; Knapik, J.J.; Merullo, D.J. Symptoms during load carrying: Effects of mass and load distribution during a 20-km road march. Percept. Mot. Ski. 1995, 81, 331–338. [Google Scholar] [CrossRef] [PubMed]
  32. Park, J.K.; Park, S.H. Effects of Material Position on Postural Stability during Manual Material Handling Tasks. J. Ergon. Soc. Korea 2004, 23, 1–8. [Google Scholar]
  33. Antwi-Afari, M.F.; Li, H. Fall risk assessment of construction workers based on biomechanical gait stability parameters using wearable insole pressure sensor. Adv. Eng. Inform. 2018, 38, 683–694. [Google Scholar] [CrossRef]
  34. Rozema, A.; Ulbrecht, J.S.; Pammer, S.E.; Cavanagh, P.R. In-shoe plantar pressures during activities of daily living: Implications for therapeutic footwear design. Foot Ankle Int. 1996, 17, 352–359. [Google Scholar] [CrossRef]
  35. Maluf, K.S.; Morley, R.E.; Richter, E.J.; Klaesner, J.W.; Mueller, M.J. Foot pressures during level walking are strongly associated with pressures during other ambulatory activities in subjects with diabetic neuropathy. Arch. Phys. Med. Rehabil. 2004, 85, 253–260. [Google Scholar] [CrossRef]
  36. Guldemond, N.A.; Leffers, P.; Sanders, A.P.; Schaper, N.C.; Nieman, F.; Walenkamp, G.H. Daily-life activities and in-shoe forefoot plantar pressure in patients with diabetes. Diabetes Res. Clin. Pract. 2007, 77, 203–209. [Google Scholar] [CrossRef]
  37. Lee, H.S.; Lee, S.Y. Real-time Activity and Posture Recognition with Combined Acceleration Sensor Data from Smartphone and Wearable Device. J. KIISE Softw. Appl. 2014, 41, 586–597. [Google Scholar]
  38. Lee, Y.M.; Yeh, H.J.; Kim, K.H.; Choi, O.K. A real-time fall detection system based on the acceleration sensor of smartphone. Int. J. Eng. Bus. Manag. 2017, 10. [Google Scholar] [CrossRef]
  39. Lee, C.M.; Park, J.S.; Park, S.S.; Kim, C.H. Fall-Detection Algorithm Using Plantar Pressure and Acceleration Data. Int. J. Precis. Eng. Manuf. 2019, 1–13. [Google Scholar] [CrossRef]
  40. Bai, Y.W.; Wu, S.C.; Yu, C.H. Recognition of Direction of Fall by Smartphone. In Proceedings of the 2013 26th IEEE Canadian Conference of Electrical and Computer Engineering, Regina, SK, Canada, 5–8 May 2013; p. 13680673. [Google Scholar] [CrossRef]
  41. Segal, A.; Rohr, E.; Orenduff, M.; Shofer, J.; O’Brien, M.; Sangeorzan, B. The effect of walking speed on peak plantar pressure. Foot Ankle Int. 2004, 25, 926–933. [Google Scholar] [CrossRef] [PubMed]
  42. Riener, R.; Rabuffetti, M.; Frigo, C. Stair ascent and descent at different inclinations. Gait Posture 2002, 15, 32–44. [Google Scholar] [CrossRef]
Figure 1. The structure of our proposed system.
Applsci 10 02262 g001
Figure 2. The structure of Smart helmet.
Applsci 10 02262 g002
Figure 3. The structure of Smart shoes, (a) smart shoes structure, (b) channel location.
Applsci 10 02262 g003
Figure 4. Data saving and monitoring application.
Applsci 10 02262 g004
Figure 5. Experimental protocol, (1) Calibrated baseline, (2) Natural descent (E1), (3) Weighted descent (E2), (4) Near fall-simulated descent (E3).
Applsci 10 02262 g005
Figure 6. Moving average filtered data from Smart Helmet and Smart Shoes, (a) three-axis accelerometer data, (b) summation data from all 10 channels of the textile pressure sensor.
Applsci 10 02262 g006aApplsci 10 02262 g006b
Figure 7. The channel location of textile capacitive pressure insole sensor (Smart Shoes).
Applsci 10 02262 g007
Figure 8. Data comparison between Smart Helmet and Smart Shoes for agreement analysis.
Applsci 10 02262 g008
Figure 9. The axial directions of three-axis accelerometer sensor in the Smart Helmet.
Applsci 10 02262 g009
Figure 10. Results of bilateral plantar pressure distribution changes in each insole channel (all subjects). E1: Natural descent, E2: Weighted descent, E3: Near fall-simulated descent.
Applsci 10 02262 g010
Figure 11. Results of mediolateral plantar pressure distribution in each foot under each condition (all subjects). E1: Natural descent, E2: Weighted descent, E3: Near fall-simulated descent.
Applsci 10 02262 g011
Figure 12. Matched analysis of Smart Helmet acceleration values and Smart Shoe plantar pressure values in each foot.
Applsci 10 02262 g012
Figure 13. The average SVM data with right and left foot of each experiments.
Applsci 10 02262 g013
Figure 14. The raw data of whole plantar pressure and x-axis in E3.
Applsci 10 02262 g014
Table 1. Subject characteristics.
SubjectSexAgeHeight (cm)Weight (kg)Shoe Size (mm)
1M2618173280
2M2418193280
3M2717684280
4M2417574270
5M2318283280
6M2517279270
7M3218292270
8M2417376250
9M2417060265
10M2617269260
AVG 25.5176.478.3270.5
SD 2.594.7010.1810.12
Table 2. Results of summed average plantar pressure in each foot (unit: pF).
E1E2E3
Sub No.RightLeftRightLeftRightLeft
148.4148.6448.5548.7150.7148.62
248.6348.8248.8249.0150.1148.85
348.4048.6548.5648.7349.6548.62
448.4548.6548.5448.8150.5048.75
548.5448.6848.6348.8450.7748.60
648.6748.8948.8349.0050.2448.86
748.3348.9048.3949.0551.1048.85
848.6348.9048.7149.0651.1048.87
948.1548.4948.3248.6350.9848.49
1048.3048.8448.4248.9750.4748.77
AVG48.4548.7548.5848.8850.5648.73
SD0.170.140.180.160.470.13
E1: Natural descent, E2: Weighted descent, E3: Near fall-simulated descent.
Table 3. Results of average plantar pressure detected in each insole channel (unit: pF).
E1E2E3
Ch. No.RightLeftRightLeftRightLeft
15.144.995.215.025.344.94
25.245.375.275.395.365.38
35.055.075.085.095.125.06
45.085.125.105.135.125.11
55.035.205.055.225.085.19
65.014.285.034.365.074.28
74.854.994.885.034.914.98
84.285.054.345.064.365.05
94.914.654.934.704.964.64
104.844.864.894.884.934.86
E1: Natural descent, E2: Weighted descent, E3: Near fall-simulated descent.
Table 4. Results of mediolateral plantar pressure distribution in each condition (unit: pF).
E1E2E3
SideCh. No.RightLeftRightLeftRightLeft
Lateral25.245.375.275.395.365.38
35.055.075.085.095.125.06
55.035.205.225.225.085.19
65.014.284.364.365.074.28
94.914.654.934.704.964.64
Sum25.2424.5725.3624.7625.5924.55
SD0.120.440.370.420.150.44
Medial15.144.995.215.025.344.94
45.085.125.105.135.125.11
84.285.054.345.064.365.05
104.844.864.894.884.934.86
Sum19.3420.0219.5420.0919.7519.96
SD0.390.110.390.110.420.11
Table 5. Results of SVM data from Smart Helmet matched with Smart Shoe data (unit: g).
E1E2E3
Sub No.RightLeftRightLeftRightLeft
12.062.062.082.112.411.27
22.262.262.262.262.351.11
32.121.981.991.862.261.24
42.161.991.951.952.261.49
52.362.222.062.052.701.55
62.122.232.342.322.571.04
71.461.461.311.401.651.36
82.332.352.312.352.401.19
92.132.121.891.972.261.13
102.032.222.032.372.291.47
AVG2.102.092.022.062.311.29
SD0.250.250.300.290.280.18
Table 6. The results of correlation analysis between the sum of plantar pressure raw data and x-axis raw data in E3.
Right FootLeft Foot
Sub No.R2p-ValueR2p-Value
1−0.350.000.100.17
2−0.170.00−0.150.03
3−0.230.00−0.010.99
4−0.660.000.010.82
5−0.380.000.150.03
6−0.460.010.050.48
7−0.530.000.170.01
8−0.460.000.210.00
9−0.660.01−0.040.53
10−0.600.000.130.23

