Article

Crab Bioturbation and Seasonality Control Nitrous Oxide Emissions in Semiarid Mangrove Forests (Ceará, Brazil)

by
Xosé L. Otero
1,
José M. C. Araújo, Jr.
2,
Diego Barcellos
3,
Hermano M. Queiroz
3,
Danilo J. Romero
3,
Gabriel N. Nóbrega
4,
Marcos Siqueira Neto
5 and
Tiago O. Ferreira
3,*
1
CRESTUS Institute, Departamento Edafoloxía e Química Agrícola, Facultade de Bioloxía, Universidade de Santiago de Compostela, Rúa Lope G Marzoa, s/n. Campus sur. 15782 Santiago de Compostela, Spain
2
Graduate Program in Ecology and Natural Resources, Department of Biology, Campus of Pici, Federal University of Ceará, 60440 Fortaleza, CE, Brazil
3
Department of Soil Science, College of Agriculture Luiz de Queiroz, University of São Paulo, ESALQ/USP, Av. Pádua Dias 11, 13418 Piracicaba, SP, Brazil
4
Graduate Program in Geoscience (Geochemistry), Department of Geochemistry, Federal Fluminense University, Outeiro de São João Batista s/n, Campus do Valonguinho, Centro, 24020 Niterói, RJ, Brazil
5
Laboratório de Biogeoquímica Ambiental, Centro de Energia Nuclear na Agricultura, CENA/USP, Av. Centenário 303, 13400 Piracicaba, SP, Brazil
*
Author to whom correspondence should be addressed.
Appl. Sci. 2020, 10(7), 2215; https://doi.org/10.3390/app10072215
Submission received: 10 January 2020 / Revised: 24 February 2020 / Accepted: 2 March 2020 / Published: 25 March 2020
(This article belongs to the Section Environmental Sciences)

Abstract

:
Seasonality and crab activity affects the nutrients and physicochemical parameters in mangrove soils, thus, affecting the emissions of greenhouse gases, such as nitrous oxide (N2O). Climate change may intensify rainfall and/or enhance droughts, affecting mangroves and associated biota. Crabs are natural soil bioturbators responsible for soil aeration and turnover. We evaluated the effect of Ucides cordatus crab on N2O emissions from mangrove soils under a semiarid climate in Northeastern Brazil. Soil and gas samples were collected over the rainy and dry seasons in crab-naturally-bioturbated and crab-exclusion mangrove plots. We measured the soil’s pH, redox potential, and the total contents of carbon, nitrogen, and sulfur. We found higher N2O emissions in the crab-exclusion sites compared to the bioturbated sites, as well as higher N2O emissions in the rainy season compared to the dry season. The fluxes of N2O (µg m−2 h−1) were 47.3 ± 9.7 and 8.9 ± 0.5 for the crab-exclusion sites, and 36.5 ± 7.8 and 4.5 ± 2.1 for the bioturbated sites (wet and dry seasons, respectively). The soil turning over by macrofauna led to lower N2O fluxes in natural crab-bioturbated areas, and seasonality was the environmental factor that contributed the most to the changes in N2O emissions. Broadly, anthropic activities and seasonality influence nitrogen fate, N2O emissions, and ecological services in coastal ecosystems.

1. Introduction

Severe droughts and stronger storms are the future scenarios of global climate change, which may threaten innumerable ecosystems [1,2,3], including mangroves. Mangrove ecosystems contain the most carbon-rich soils on the planet [4,5], characterized by fluctuations in the soil redox conditions due to tidal flooding [6,7,8]. Consequently, mangrove forests are one of the most important coastal carbon (C) sinks, contributing to the mitigation of climate change by sequestering and storing significant amounts of carbon, known as blue carbon [9,10,11,12]. Mangrove macrofauna (especially the crab species) are known drivers for changing the soil’s physicochemical conditions in intertidal environments and can directly affect greenhouse gas emissions, such as nitrous oxide (N2O) [13,14,15]. Crab burrows may change the air-water fluxes, increase the soil O2 content, and oxidize the soil around the burrows [16]. The Ucides cordatus crabs are one of the most important bioturbators of mangrove soils, turning over and inducing the natural recycling of nutrients and organic matter [17,18].
Aerobic respiration, anaerobic iron, and sulfate reduction are usually the most important carbon oxidation pathways in mangrove soils [13,19], while denitrification has been considered less important in the organic matter cycling of mature mangrove forests due to the limited availability of nitrate (NO3) [20,21]. However, investigations regarding N2O emissions have been increasing because it is considered a key greenhouse gas. Nitrous oxide is produced as a by-product between the microbial pathways of denitrification and nitrification [22,23,24,25]. Denitrification consists of the reduction of nitrite (NO2) and NO3 as alternative electron acceptors to oxygen (O2), resulting in gaseous nitrogen production; this process is mediated by heterotrophic bacteria under anoxic conditions (anaerobic pathways) [26,27,28]. Nitrification may occur when ammonium (NH4+) is sequentially oxidized to nitrite/nitrate under aerobic conditions, and N2O production occurs by the reduction of NO2. The first step of nitrification is the oxidization of NH4+ to nitrite (NO2) via hydroxylamine (NH2OH) [29,30]. This biotic process is carried out under aerobic conditions by the chemoautotrophs using NH4+ as an energy source [31] and can ultimately produce N2O by several biochemical pathways [24,30,32]. Nitrous oxide is one of the most concerning non-CO2 greenhouse gas [33] due to its long atmospheric lifetime (114 years) and high capacity to absorb infrared radiation that can be returned as thermal energy (298 times higher than CO2) [34,35]. Thus, N2O production and other related biogeochemical N-cycling are important pathways in mangrove forests.
Land-use change in mangrove forests by anthropogenic activities and climate change effects (e.g., sea-level rise) substantially affects the biota and physicochemical characteristics of this important and complex marine/terrestrial/estuarine system [36,37]. The impacts of land-use change and pollution in mangroves are severe and may eradicate mangrove fauna, which are fundamental for mangrove functioning [38,39]. For instance, the lack of bioturbation promoted by crabs decreases soil aeration, enhancing anaerobic conditions [40], which are propitious for increasing the emissions of anaerobic pathways of N2O and methane (CH4), and potentially feeding back to mangroves with climate change effects.
To our knowledge, there are no studies that have evaluated the effect of crab bioturbation on N2O emission in mangrove forests, and together, investigated the effects of the seasonal climatic conditions (rainy and dry seasons). Our study was performed to evaluate the effect of crab bioturbation and seasonality on N2O emissions based on the hypothesis that crab burrows could decrease N2O emissions, since crab activity favors soil aeration and oxidation [8,18], compared to areas without crab activity (crab-exclusion plots). We also hypothesized that the dry season would lead to greater soil aeration/oxidation and lower N2O emissions, compared to the rainy season. To achieve our objectives, we monitored N2O fluxes and soil physicochemical parameters over naturally crab-bioturbated plots and over crab-exclusion plots (non-bioturbated) during dry and rainy seasons in semiarid mangrove forests (Aracati, Ceará State, Brazil). We studied a non-impacted mangrove, although this region of the Ceará coast suffers strong anthropogenic pressure by the increasing presence of shrimp farming and sewage discharge of effluents into the mangroves, as well as the deforestation of the mangroves for urbanization and agricultural purposes [11,41,42]. Crab-exclusion plots were designed to mimic the possible scenario of the death of bioturbators’ macrofauna in mangroves (by anthropic disturbances, for instance), whereas the measurements over the rainy and dry seasons demonstrate the natural seasonality in this semiarid climate and possible altered scenarios in the mangroves that can be induced by climate change (such as the potential effects of El Niño).

2. Materials and Methods

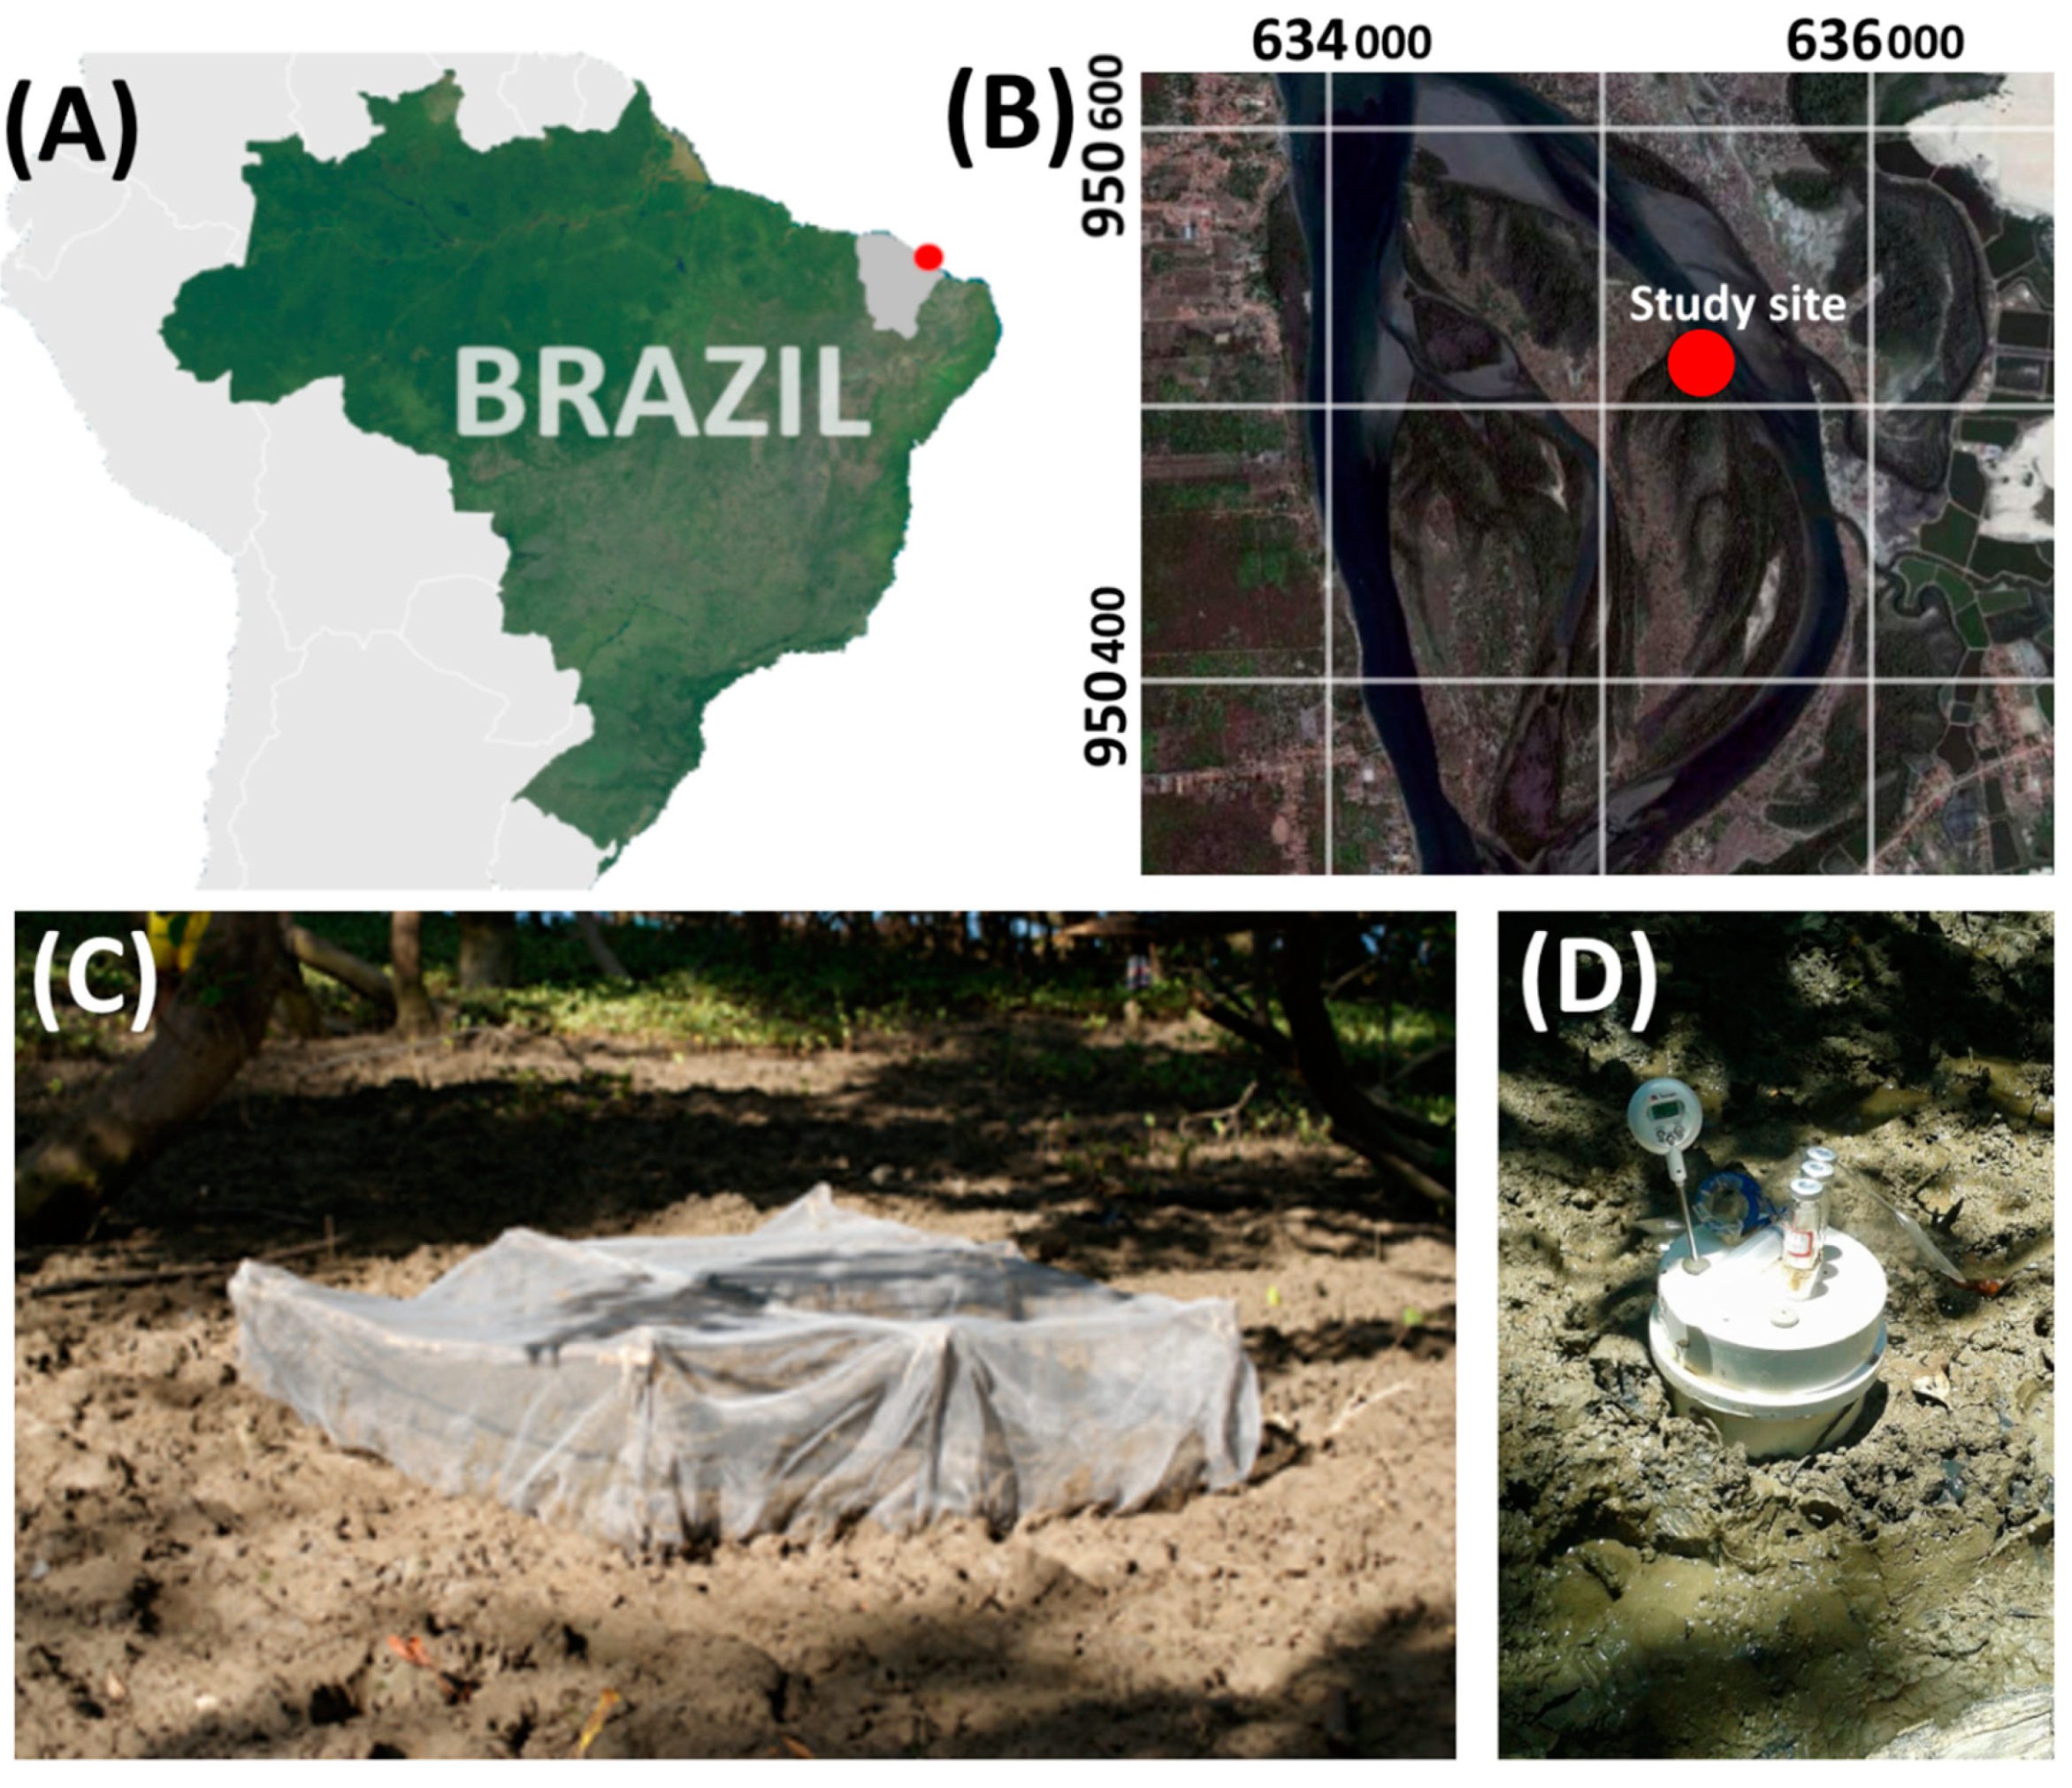
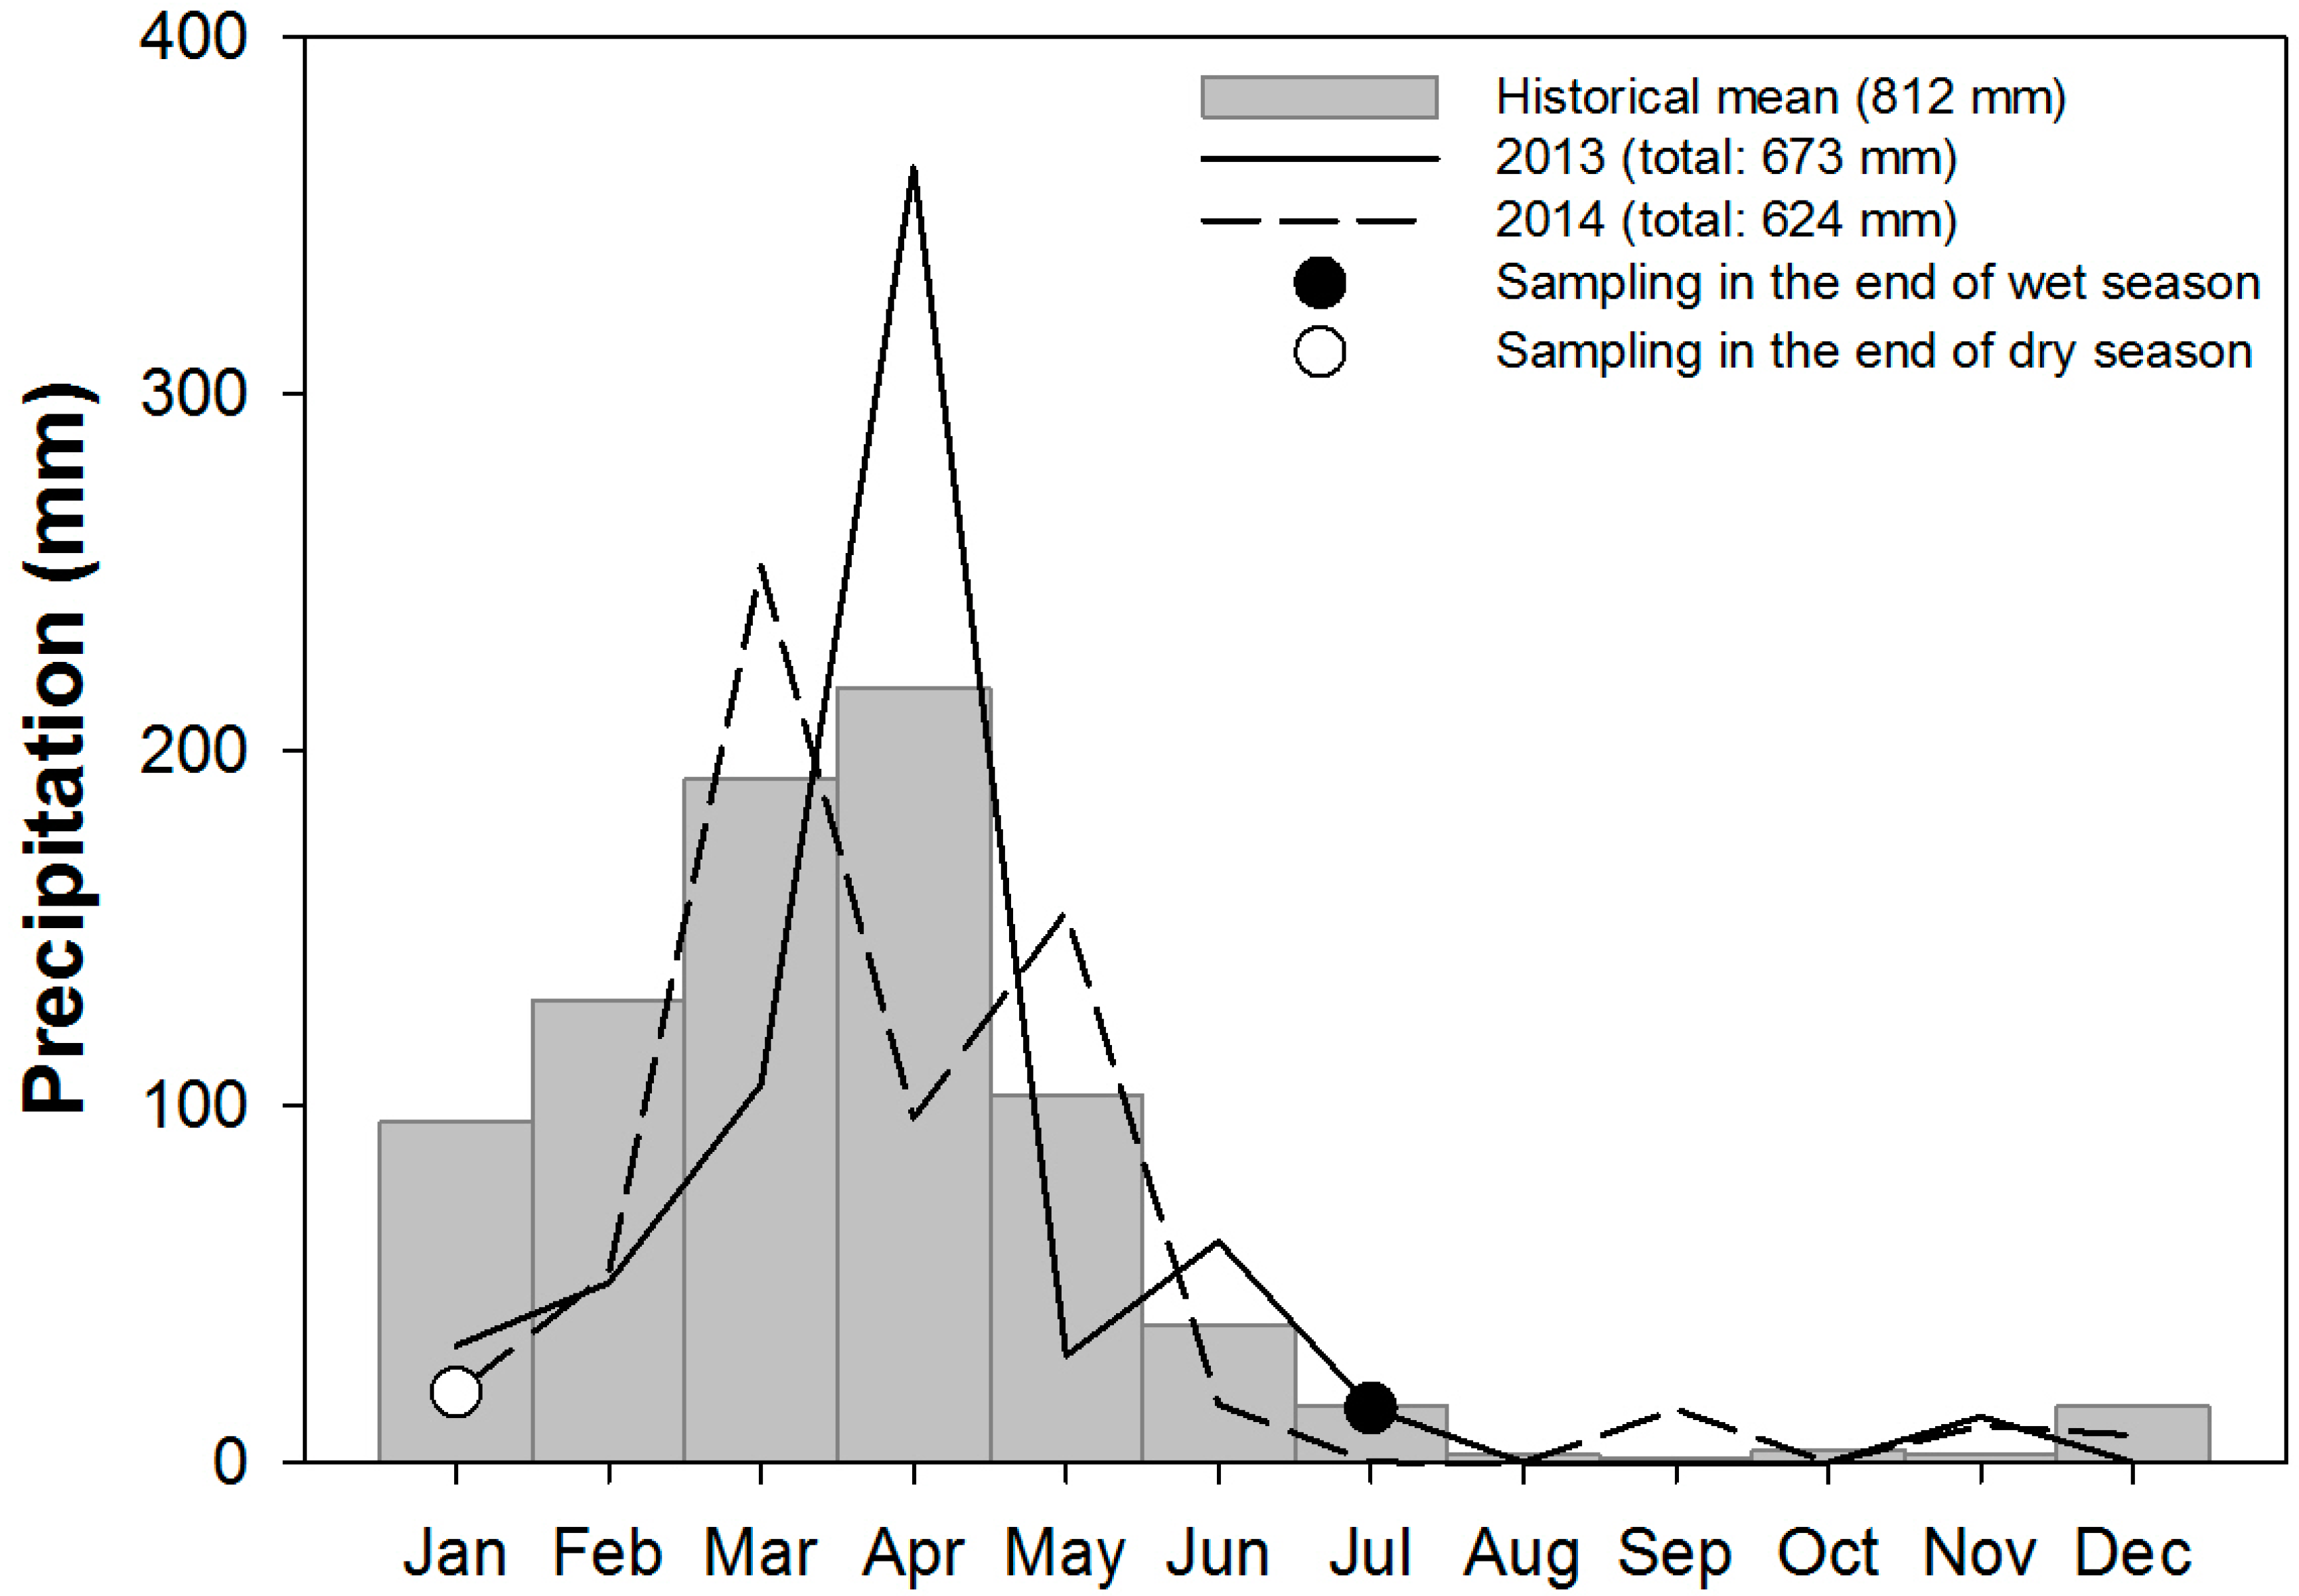
2.1. Site Description

The studied mangrove is located in the semiarid Northeastern Brazilian coast (Aracati, Ceará State, Brazil) at the Jaguaribe River estuary (Figure 1A,B). The studied mangrove forest covers 11.6 km2 and is mainly populated by Rhizophora mangle L., R. racemosa G. Mey, and Avicennia schaueriana Stapf & Leechm [43]. The estuary of the Jaguaribe River contains mangrove trees with different stages of development [40], with a tree density of 5714 trees ha-1, basal area of 22.2 m2 ha−1, and canopy heights >10 m [11].
The climate at the estuary is classified as hot and semiarid (Aw′) according to the Köppen climate’s classification [44,45]. The mean annual precipitation is 812 mm yr−1, mostly between February and May (Figure 2) [46]. Soils and gas were collected at the end of both the wet and dry season, given that in both years of collection (2013 and 2014), the total annual precipitation was lower than the historical mean of 812 mm (Figure 2). The daily average temperature ranges between 26 and 28 °C throughout the year [46]. Associated with the low precipitation, the high evaporative demand causes high evapotranspiration rates that can reach up to 5 mm day−1 [47]. The water deficit leads to an increase in soil salinity and may limit the development of mangrove forests, in comparison to the Southeastern Brazilian coast [7].

2.2. Experimental Design

To verify the effect of bioturbation on N2O emissions from mangrove forests, two contrasting sampling conditions were selected as follows: six plots naturally inhabited by Ucides cordatus [48], characterizing the natural bioturbated treatment, and another six exclusion plots without crab activity (crab-exclusion treatment). The crab-exclusion plots covered 1 m2, delimited by a 1 cm mesh nylon net buried to 1.5 m depth, which was deployed 3 months prior to the soil and gas measurements (Figure 1C) [18,40]. The plots at the natural site (bioturbated area) were just marked at the four-square corners with wooden sticks to cover the same 1 m2 of area (without any other disturbance). Both sites were closely located (within a few meters apart) and vegetated by R. mangle, and were in the same physiographic positions to avoid differences in flooding frequency and minimize vegetation effects (e.g., presence of pneumatophores, roots, and plantlets). Within each plot, samples of gas and soil were collected during low tides at the end of the wet (July) and dry (January) seasons [49].
At the bioturbated plots, the burrow density (burrow m−2) and burrow size (diameter of the entrance and burrow depth) were also measured. The burrow densities were assessed within a 1 m2 frame, whereas the burrow sizes were measured in 10 burrows in each plot, using a caliper for diameter measurements and a soft rubber wire for burrow depth assessment [18,50].

2.3. Soil Sampling and Analyses

One soil sample for each plot, to the depth of 0–30 cm, was collected using PVC tubes attached to an auger for flooded soil, comprising of a total of 24 samples (six plots/replicates x two treatments x two seasons). After collection, the PVC tubes were hermetically closed and transported in vertical position (at 4 °C) to the laboratory. Each of the individual soil samples (0–30 cm) were mixed to form one bulk sample per plot, followed by oven-drying the samples at 45 °C to perform the analysis of the total organic carbon (TOC), total nitrogen (TN), and total sulfur (TS) [51]. The TOC content was quantified by an elemental analyzer (LECO SE-144DR®, Michigan, USA), after removing inorganic carbon with 3M HCl [51], whereas the TS and TN contents were quantified in untreated samples (LECO SE-144DR® and TruSpec® analyzers, LECO, Michigan, USA).
Additionally, the pH and redox potential (Eh) values were measured in situ during sampling. The Eh values were acquired by a platinum electrode, corrected to the reference calomel electrode (adding +244 mV to the readings), whereas the pH measurements were obtained using a glass electrode calibrated with pH 4.0 and 7.0 standard solutions.
The equipment used during sampling and laboratory analysis was previously cleaned, using 10% HCl overnight and rinsing with distilled water. The contents of the analyzed variables were quantified from the dried weight, which was determined after drying the subsamples at 105 °C to constant weight and obtaining a conversion factor.

2.4. N2O Sampling and Analyses

At each of the sampling plots (bioturbated and crab-exclusion), during each season (dry and rainy), one static rigid chamber for gas collection was installed. The chambers, measuring 17.5 cm diameter and 17.5 cm high, were inserted 5 cm into the soil [37], and were left open for the stabilization of the internal pressure for approximately 30 min. After stabilization, the chambers were closed, and the gas samples were collected using nylon syringes. The gas samples from each site were simultaneously collected during a 45-min sampling period (at intervals of 0, 15, 30, and 45 min) to avoid significant tidal variation. During the gas sample collection, the air temperature and atmospheric pressure were recorded [37,51].
The N2O flux (µg m−2 h−1) was measured from a linear fitting for N2O concentrations from the sampling intervals (0, 15, 30, and 45 min). The N2O concentrations were measured in a gas chromatograph (Shimadzu® GC 2014, Kyoto, Japan). The N2O mass at each interval was calculated using the universal gas equation, considering air temperature, chamber volume and area, and atmospheric pressure [37,51].

2.5. Statistical Analyses

We performed the non-parametric Friedman test (equivalent for the two-way ANOVA) to assess the differences in N2O emissions between sites and between seasons at the 5% significance level, with multiple pairwise comparisons using Nemenyi’s procedure, a two-tailed test (software XLSTAT version 3 May 2014) [52]. Similar analyses were performed for the soil parameters pH, Eh, TOC, TN, and TS.
Over our field campaign at the Brazilian mangroves, we initially had six plots per treatment (bioturbated and crab-exclusion), but we lost three plots for each treatment (at both wet and dry seasons) because of vandalism by local communities and fisherman and several flooding events that destroyed these built plots, leaving only three plots for each treatment (bioturbated and crab-exclusion) for the measurements. Thus, we used the bootstrap method, which takes into consideration that the training data represents the population data-set and several realizations of the population may be simulated [53,54], thus, bootstrapping from three to six plots, and then running the Friedman test. We bootstrapped all parameters (N2O flux, pH, Eh, TOC, TN, and TS) for both seasons. Additionally, we conducted a non-parametric Kruskal–Wallis test (equivalent for the one-way ANOVA) to assess the differences in crab burrow density and size over seasonal changes for the bioturbated mangrove areas, and the differences between seasonal changes in crab burrowing activity.
We additionally performed a principal component analysis (PCA) for the parameters N2O, Eh, pH, TOC, TN, and TS to assess the patterns driven by seasonality and the absence/presence of bioturbation, followed by varimax rotation, which allowed the improvement of the data structure predominantly into two components (software XLSTAT version 3 May 2014) [52].

3. Results

3.1. Crab Burrow Densities and Burrow Characteristics

Crab burrow characteristics (burrow density, diameter, and depth) directly affected the oxidation of mangrove soils and may have influenced N2O emissions. The crab burrow density and size did not show any seasonal changes (p > 0.05) in the bioturbated mangrove areas. In the dry season, 3.3 ± 1.2 burrows m−2 were quantified, measuring 5.7 ± 1.1 cm in diameter and 73 ± 11 cm in depth, while in the rainy season, the burrow density was 2.3 ± 0.6 burrows m−2, measuring 5.9 ± 1.0 cm in diameter and 76.2 ± 3.6 cm in depth.

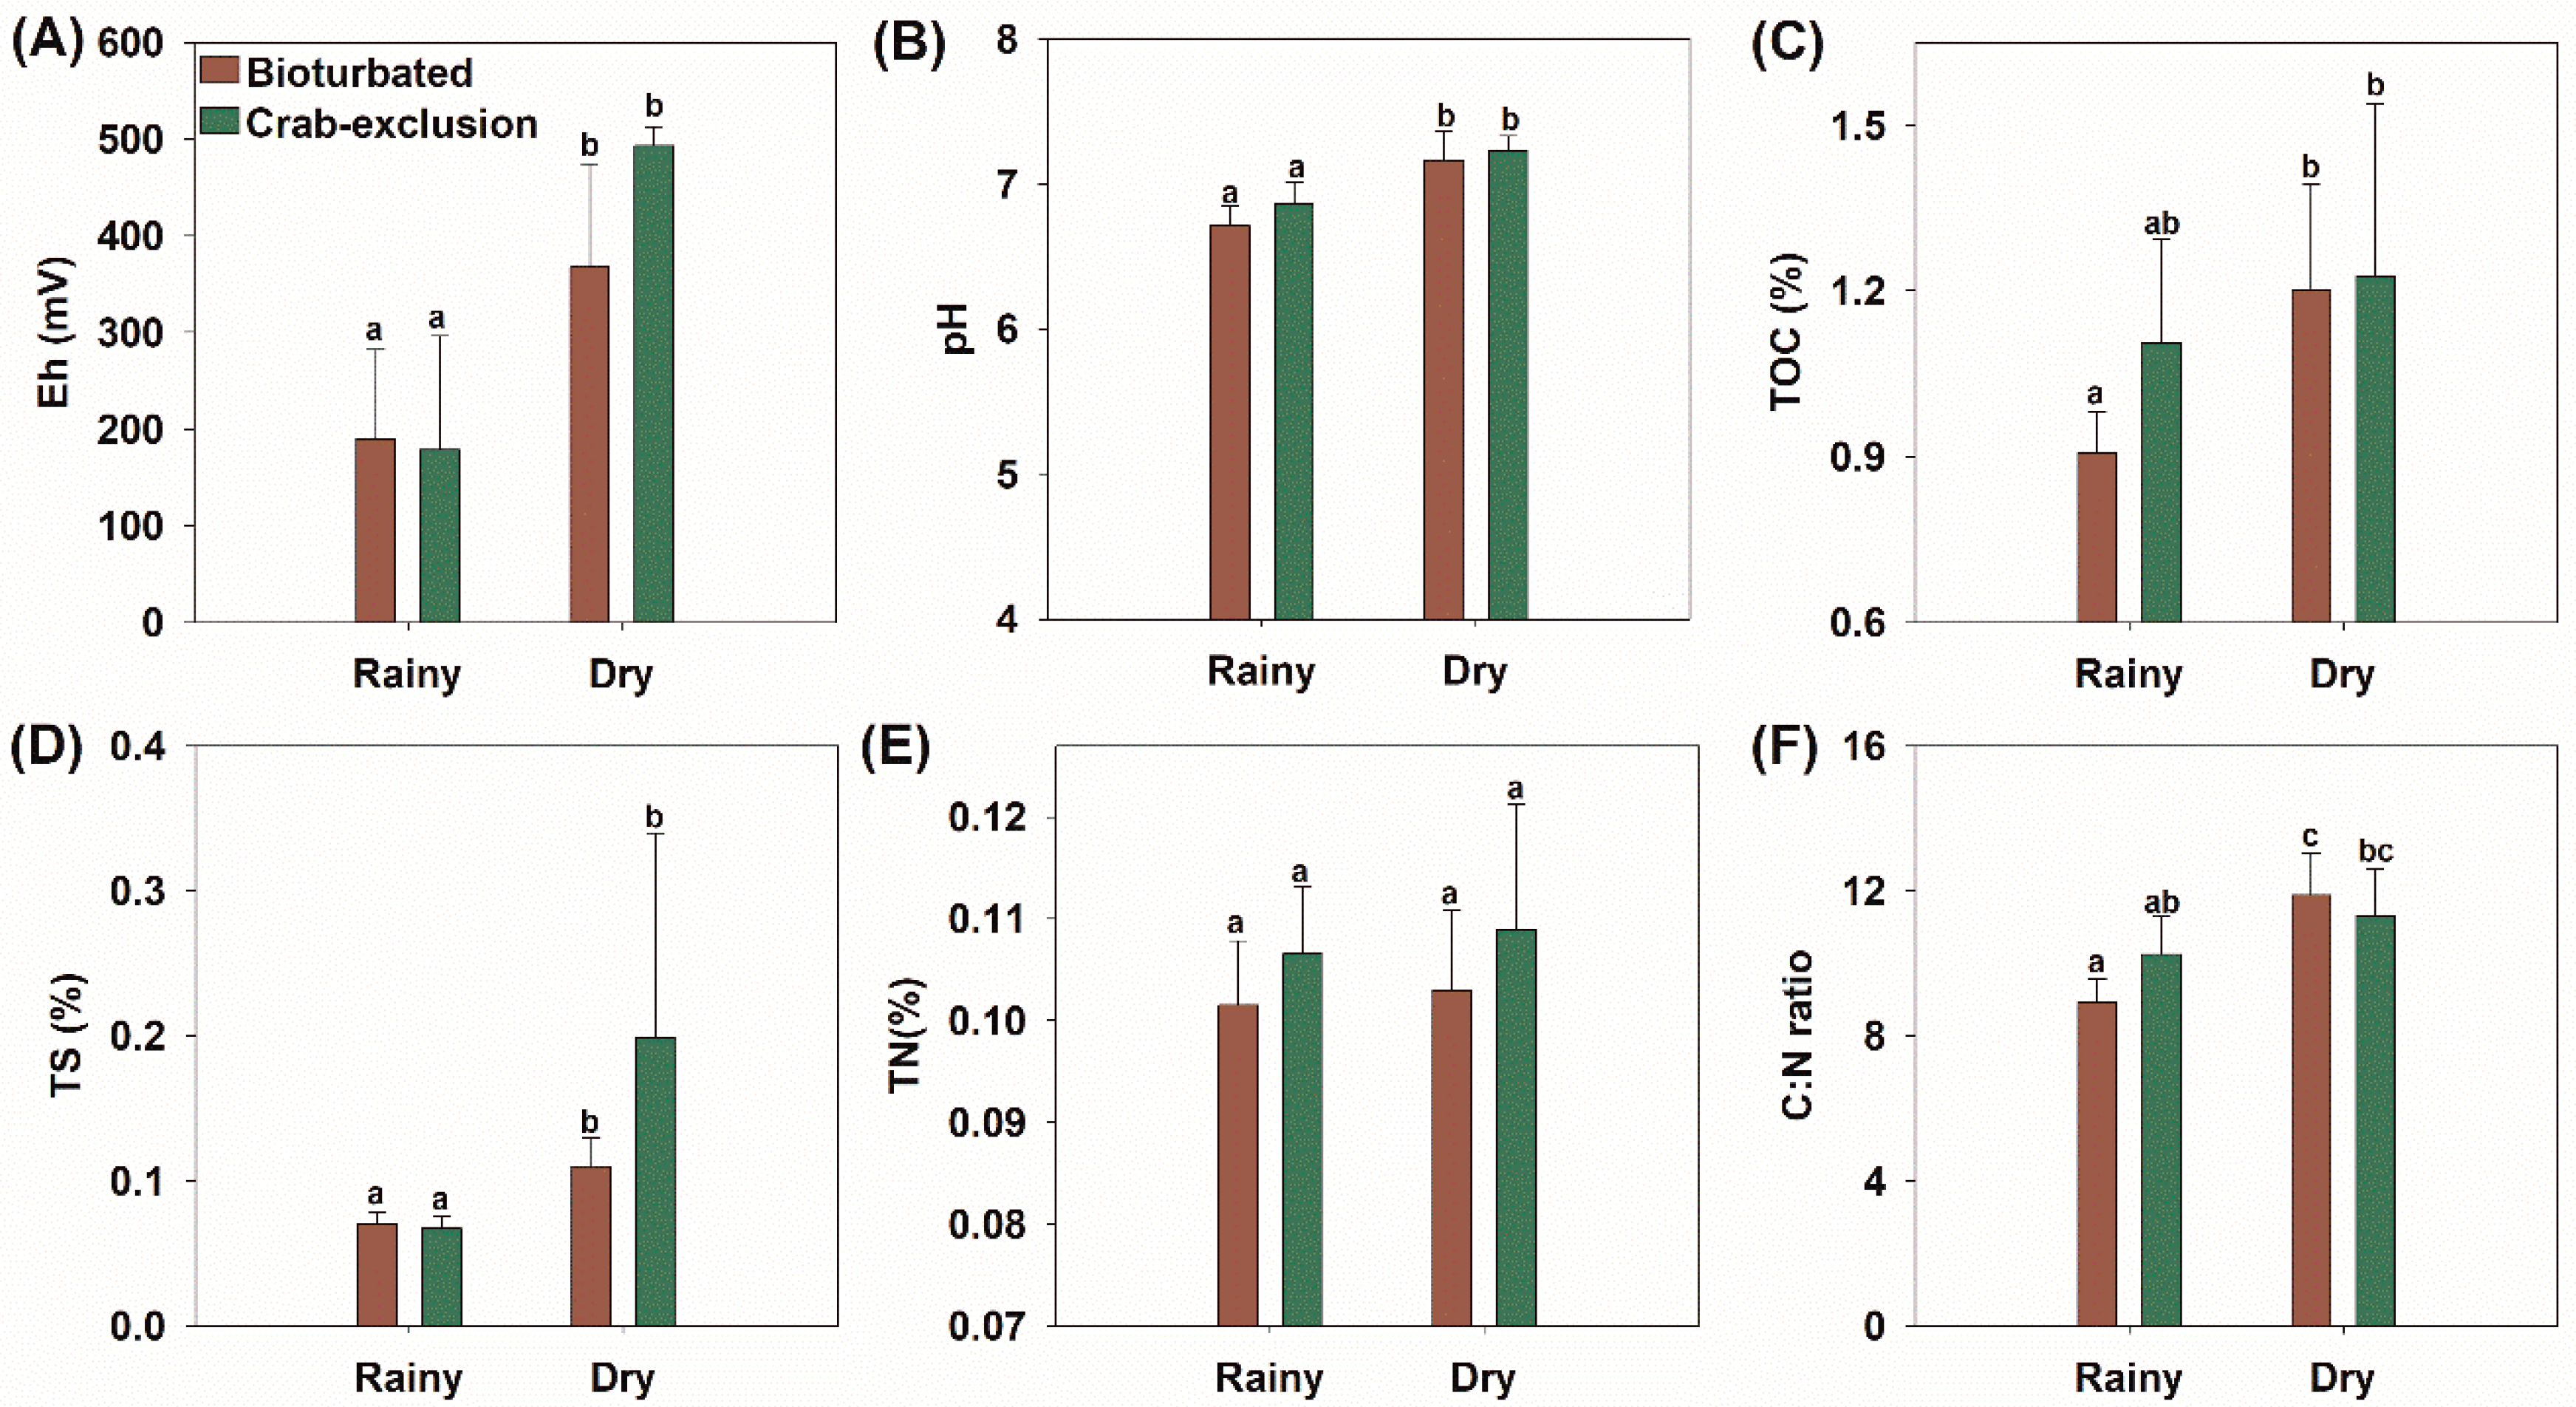
3.2. Soil Characterization
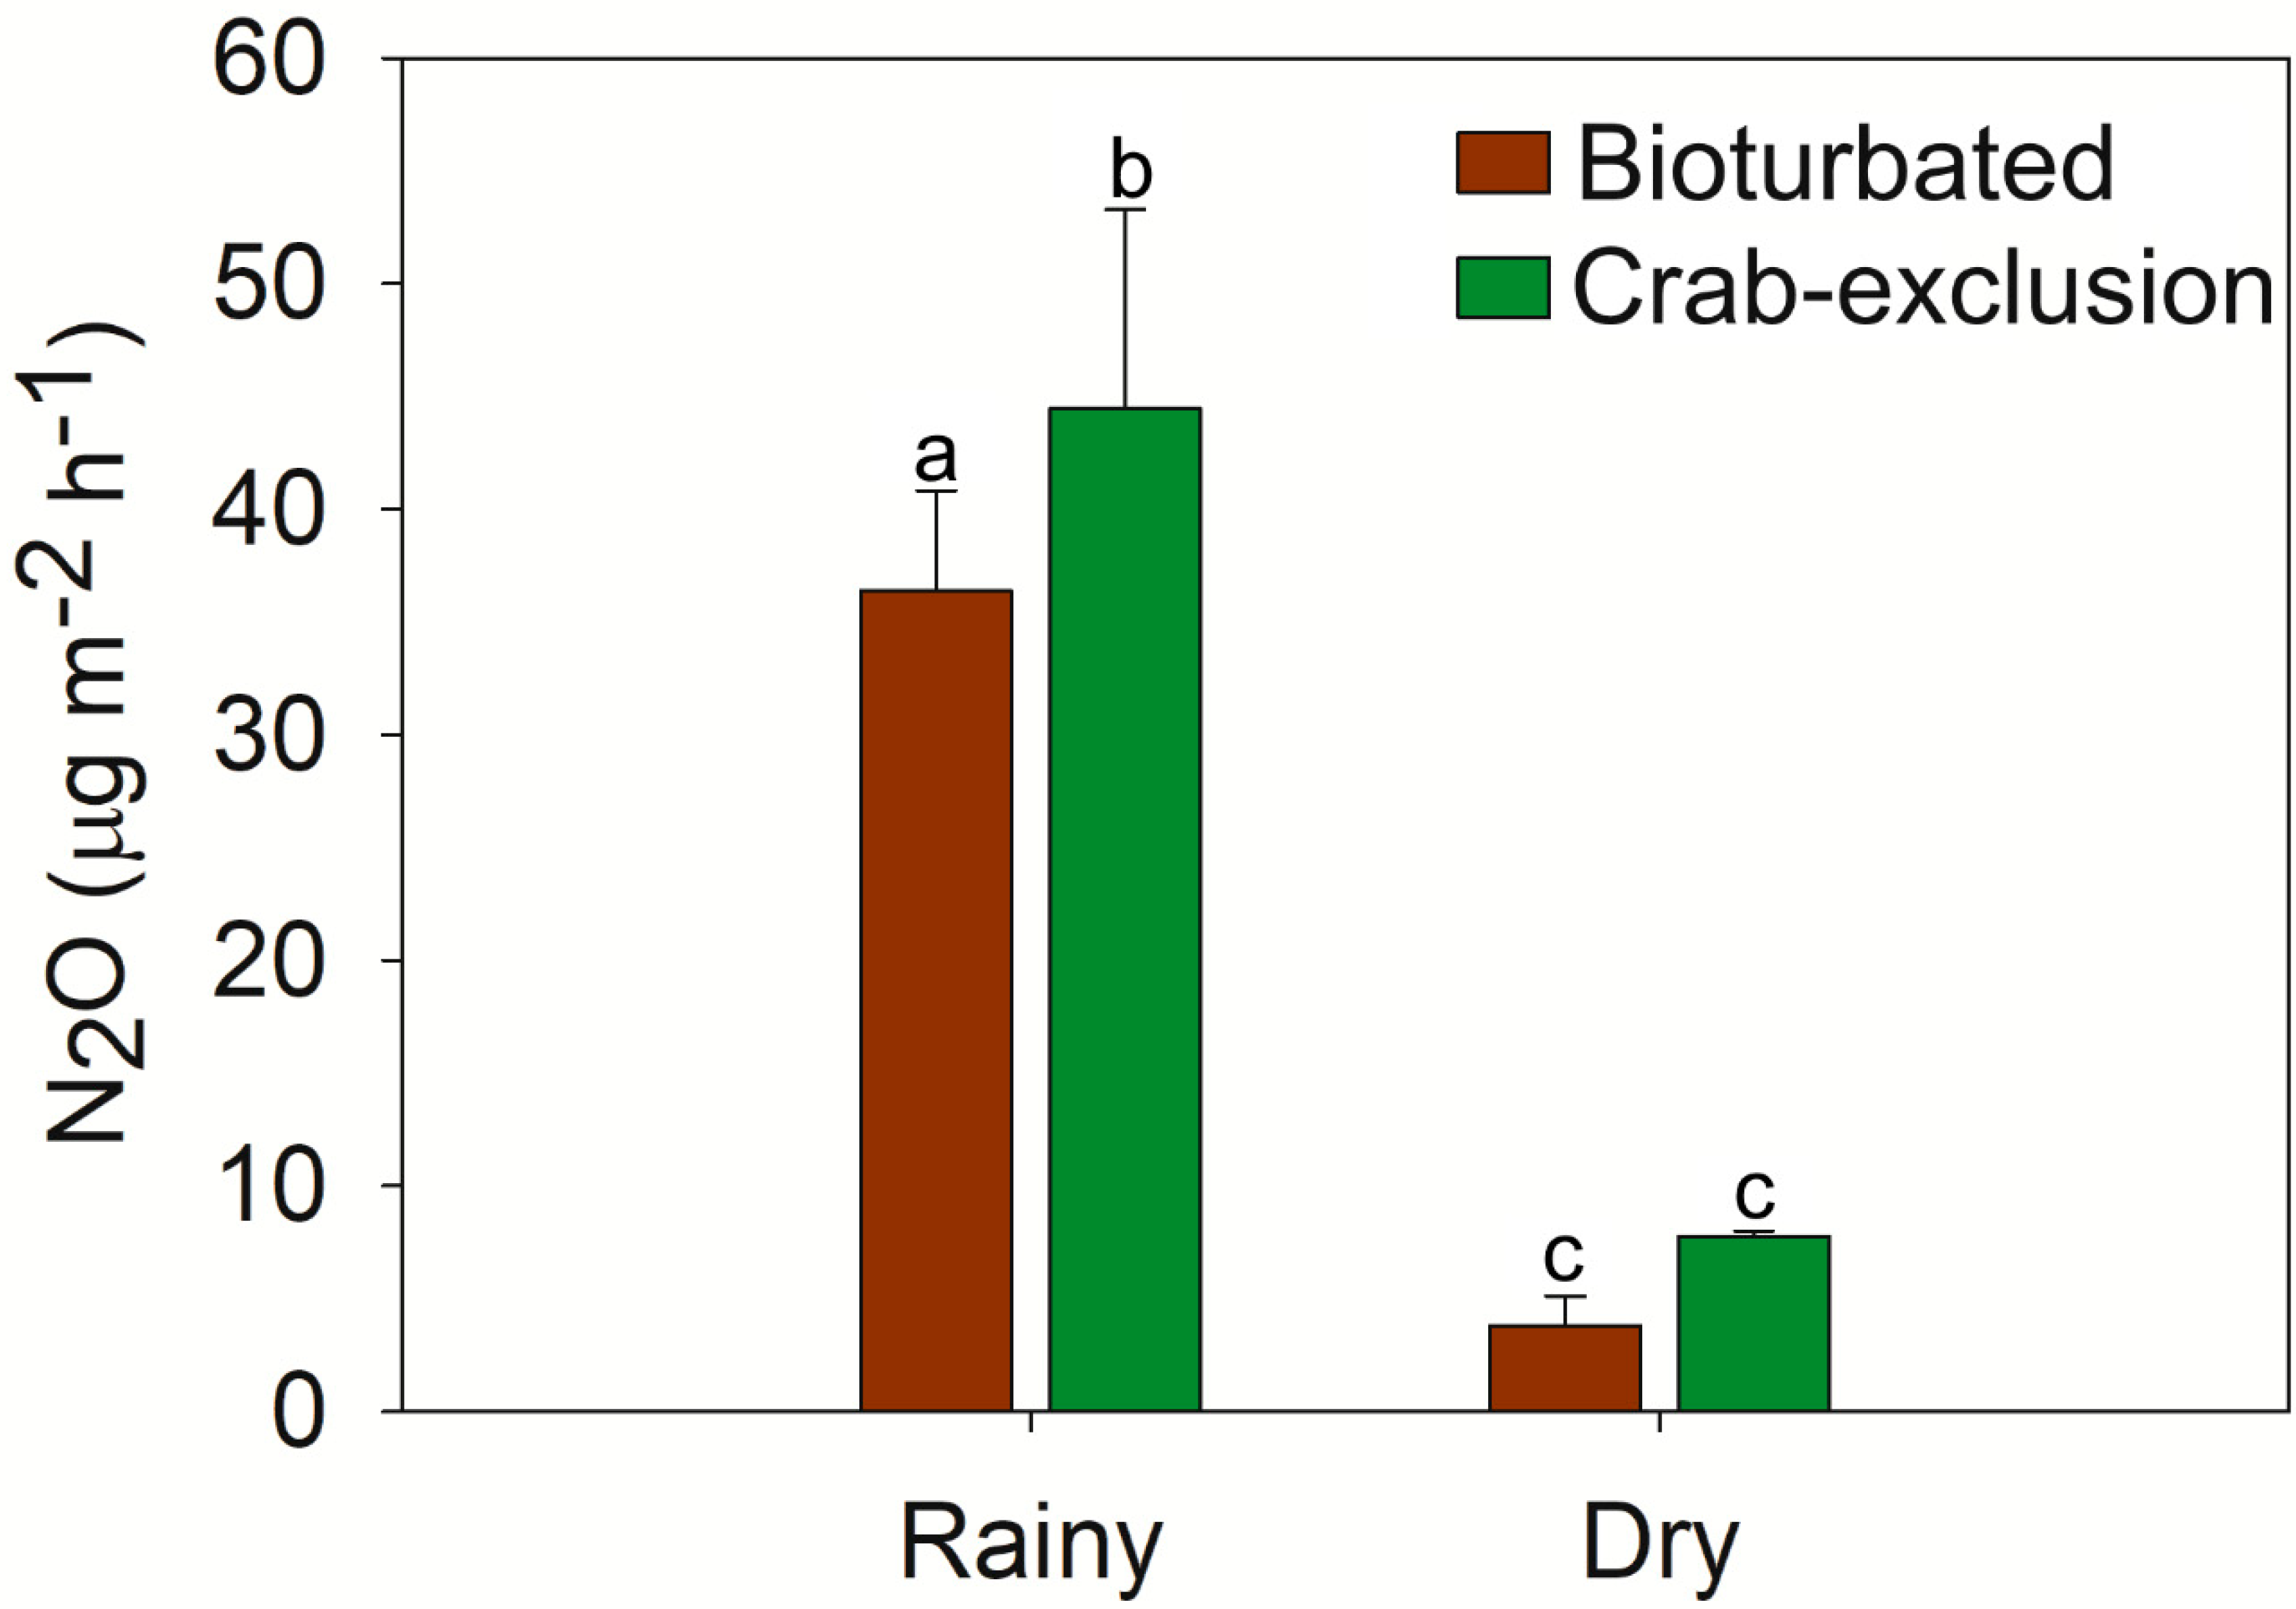
Fluxes of N2O were influenced by the decomposition of soil organic matter (driven by the total contents of C, N, and S), and by environmental physicochemical characteristics (Eh and pH). There was no significant difference between bioturbated and crab-exclusion treatments for Eh and pH (p > 0.05; Figure 3A,B). However, the seasonal variation led to distinct soil physicochemical conditions when the rainy and dry seasons were compared. Higher Eh values were recorded during the dry season, characterizing the predominance of oxic conditions for both sites (Eh > +350 mV). During the rainy season, though, the Eh values significantly decreased compared to the dry season (p < 0.05), ranging between +79 and +395 mV, which indicated suboxic conditions (Eh: +100 to +300 mV; [55]). The bioturbated site showed slightly higher Eh values (202 ± 141 mV) during the rainy season than the crab-exclusion plot (174 ± 156 mV; Figure 3A), whereas during the dry season, higher Eh values were recorded at the crab-exclusion site (489 ± 32 mV). The pH values were near neutral, with no difference between sites in each season (dry season – crab-exclusion site: 6.9 ± 0.2, bioturbated site: 6.7 ± 0.2; rainy season—crab-exclusion site: 7.2 ± 0.2, bioturbated site: 7.2 ± 0.3) (Figure 3B).
During the dry season, the TOC content was similar for both sites (crab-exclusion 1.2 ± 0.4%, bioturbated 1.2 ± 0.3%) (p > 0.05), which was similar during the rainy season (crab-exclusion 1.1 ± 0.3%, bioturbated 0.9 ± 0.1%) (p > 0.05) (Figure 3C). The TN contents in the crab-exclusion site ranged from 0.11 ± 0.02% in the rainy season to 0.11 ± 0.01% in the dry season, whereas in the bioturbated site, TN was 0.10 ± 0.01% for both seasons, with no statistical differences for treatments/seasons (Figure 3E). Statistically similar TS contents (p > 0.05) were recorded for both crab-bioturbated and crab-exclusion sites (0.09 ± 0.03% and 0.133 ± 0.12%, respectively), but the TS values were significantly higher in the dry season (0.15 ± 0.11%) compared to the rainy season (0.07 ± 0.01%) (p < 0.05). The C:N ratio during the dry season ranged from 11.1 ± 2.1 in the crab-exclusion site to 11.5 ± 1.7 in the bioturbated site, whereas in the rainy season, the values were 10.2 ± 1.6 and 8.9 ± 0.9 for the crab-exclusion and bioturbated sites, respectively (Figure 3F). We observed statistically higher C:N ratios in the dry season compared to the wet season in the naturally bioturbated mangrove soils. Between the dry/wet season, the crab-exclusion treatment had statistically similar C:N rations (Figure 3F).

3.3. N2O Emissions

The emissions of N2O were higher in the crab-exclusion site compared to the bioturbated for the rainy season (p < 0.05), but the N2O emissions were statistically similar in both sites for the dry season (Figure 4). Indeed, the N2O emissions during the rainy season were almost 10 times greater than those in the dry season. Fluxes of N2O were recorded as follows (in µg m−2 h−1): crab-exclusion site/rainy season as 47.3 ± 9.7, crab-exclusion site/dry season as 8.9 ± 0.5, bioturbated site/rainy season as 36.5 ± 7.8, and bioturbated site/dry season as 4.5 ± 2.1 (Figure 4).

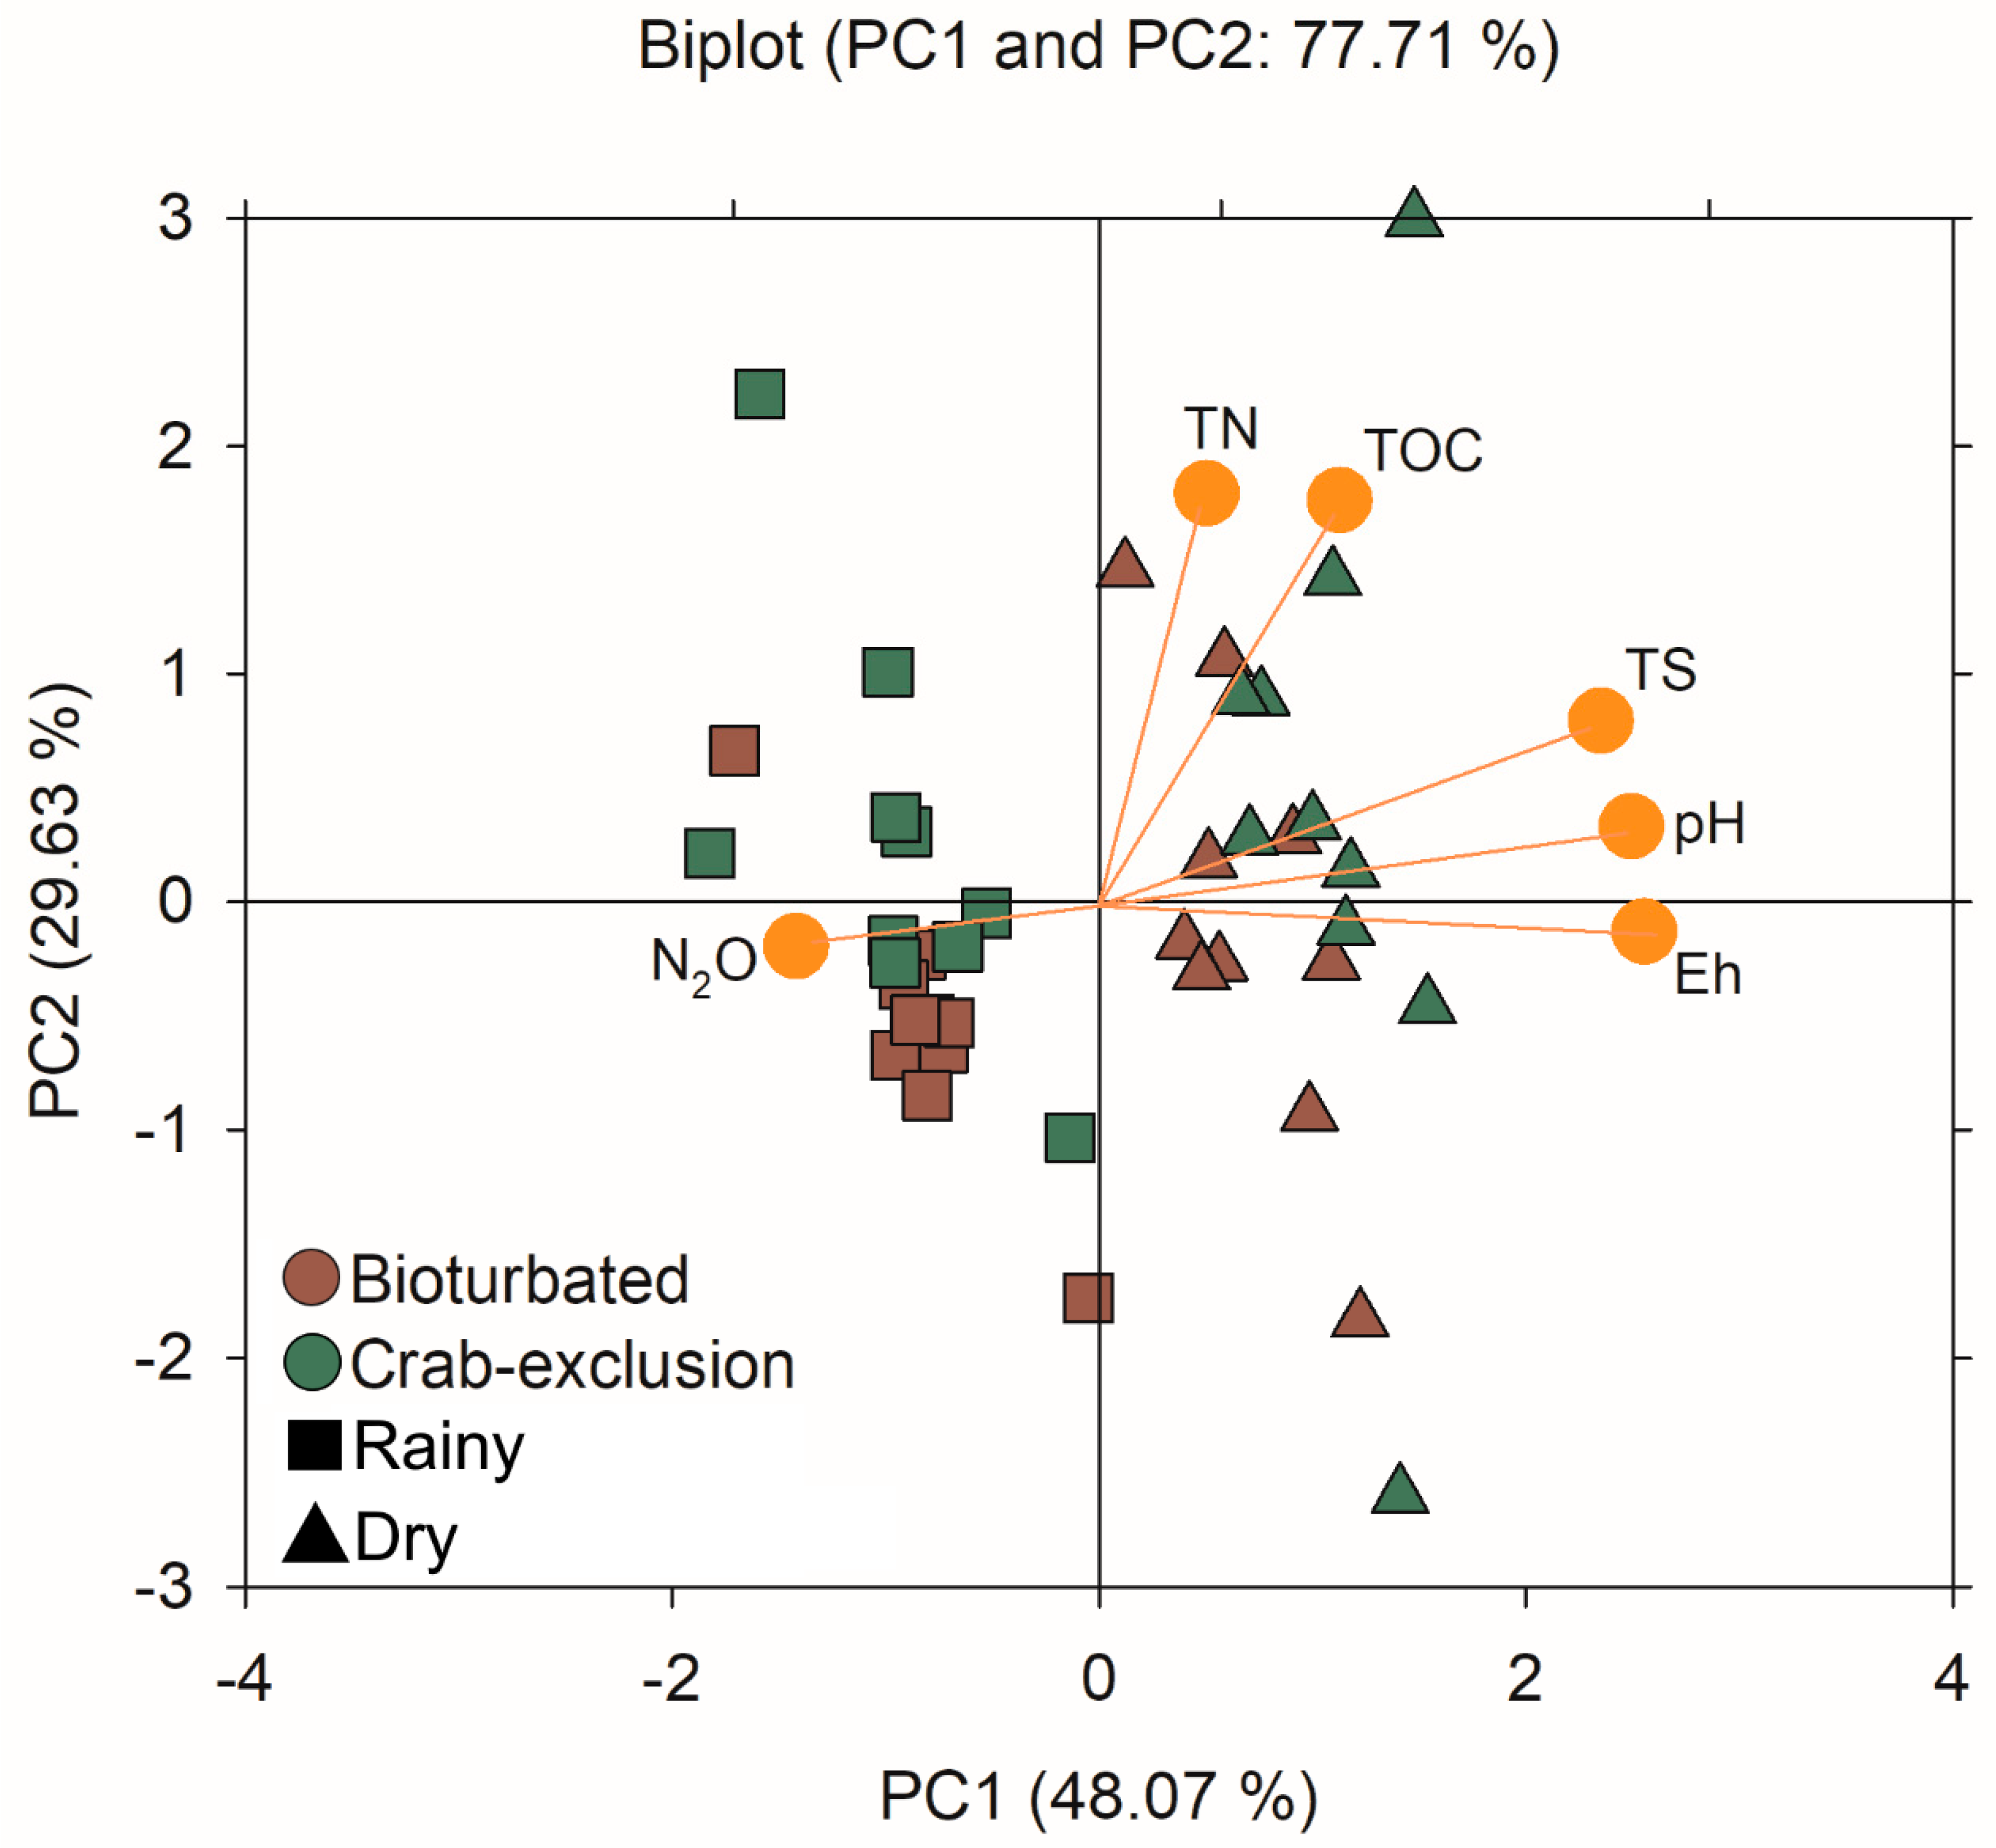
3.4. Effect of Seasonality and Bioturbation on Soil Composition and N2O Emissions

The PCA explained 77.71% of the variation in the studied parameters (Figure 5), with the squared cosines of the observations from the first axis (PC1) explaining 48.01% and the second axis, PC2 (soil organic matter, SOM) explaining 29.63% of the data variation (Table S8). The squared cosines indicate a goodness-of-fit for the projection to be interpreted. Seasonality is driving the parameters N2O, pH, Eh, and TS, as the squared cosines for these variables are the largest in the PC1 (season effect), whereas bioturbation drives the parameters TOC and TN, which may be attributed to the SOM, with these variables’ largest square cosines in the PC2 (Table S8). Indeed, the N2O emissions are higher in the rainy season and the values of Eh and pH are greater in the dry season, which is well explained by the PCA biplot, demonstrating a strong influence of seasonality in the emissions of N2O and the soil’s physicochemical characteristics. Moreover, the fauna (i.e., crabs) directly affects the content of SOM, since the PCA biplot (Figure 5) indicates that crab-exclusion (absence of bioturbation) has a greater content of TOC and TN, compared to the bioturbation treatment, mainly in the rainy season.

4. Discussion

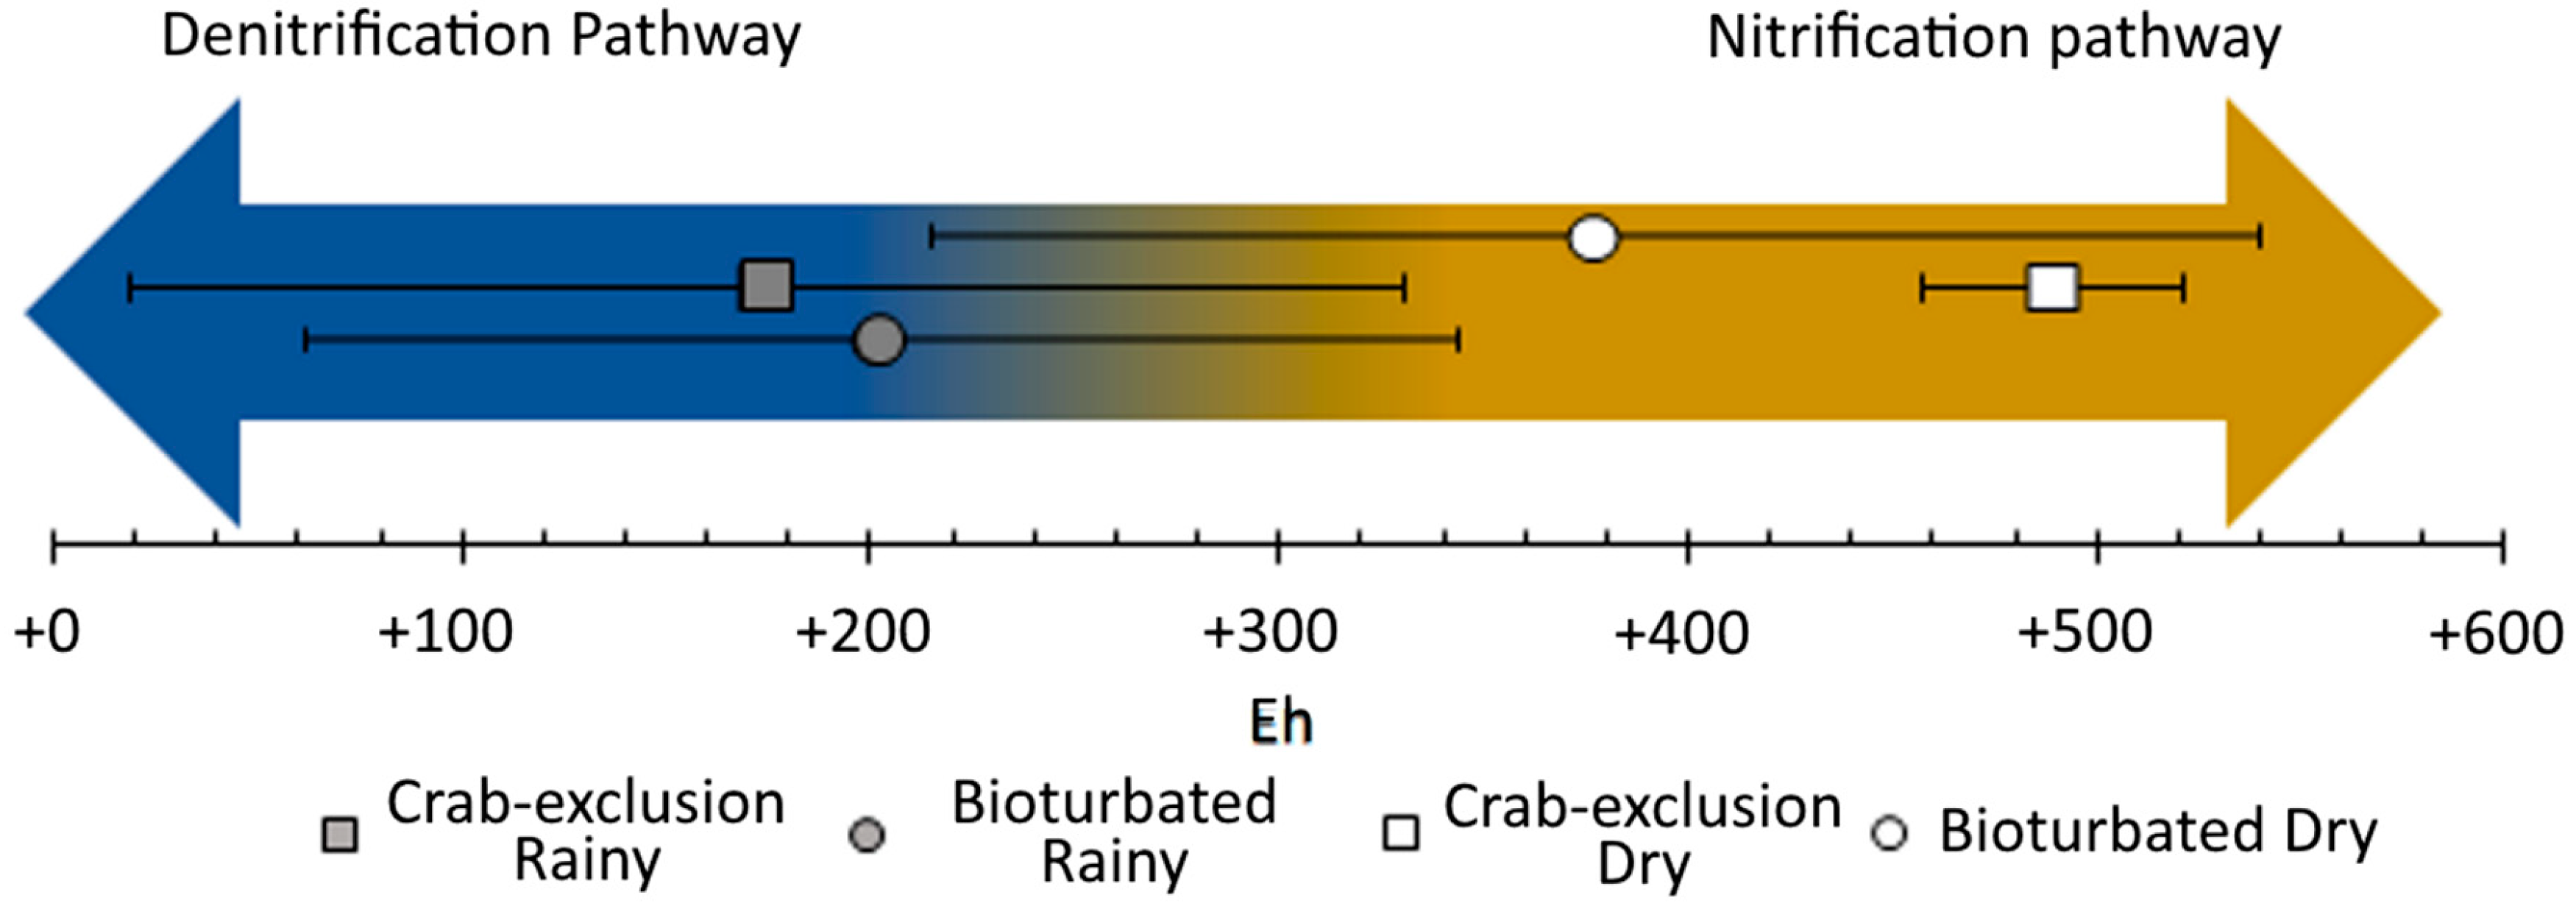
4.1. N2O Emissions from Mangrove Soils are Controlled by Crab Activity and Seasonal Variation

Our major finding was the decrease of N2O fluxes in the bioturbated plots compared to the crab-exclusion plots, as well as the enhancement of N2O emissions from dry to rainy seasons at both sites. In the crab-exclusion areas, the suboxic to anoxic soil microsites were preserved (because of the absence of crab bioturbation), stimulating higher N2O emissions. Similarly, during the rainy season, large amounts of water were drained to the estuary, reducing redox potential (Eh) and, thus, inducing higher N2O emissions. In addition, the absence or presence of bioturbation was driving the SOM dynamics in these mangrove soils. For instance, the bioturbated sites in the rainy season had lower SOM contents and a lower C:N ratio, probably driven by greater soil aeration and oxidation of organic compounds, leading to SOM consumption (Figure 3 and Figure 5). Therefore, bioturbation is significantly important for keeping lower N2O emissions (compared to crab-exclusion areas), but seasonality has a key role in the dynamics of nitrogen and N2O emissions from mangrove soils in semiarid regions.
Denitrification can be one of the major contributors for N2O production in mangrove soils [56]. In our study, the Eh values over the rainy season were mostly within the range associated to denitrification, whereas over the dry season, when N2O emissions decreased significantly, the Eh values were mostly within the range of nitrification (Figure 6). Mechanistically, comparing the presence or exclusion of crabs, the crab-exclusion treatment led to less soil aeration/oxidation (i.e., more reducing soil condition), which favored denitrification and higher N2O emissions, while the presence of crab bioturbation led to greater soil aeration/oxidation (i.e., less reducing conditions) and lower N2O emissions.
Furthermore, the burrow densities measured during the study (mean: 3.3 ± 1.2 and 2.3 ± 0.6 during the dry and rainy seasons, respectively) were significantly lower than the densities measured for the same estuary by other studies carried out before 2012 (crab burrow density in the rainy season: 12 ± 3 burrows m−2; dry season: 38 ± 12 burrows m−2; [40]). Additionally, the densities were also lower than those obtained in other parts of the world, where authors have observed clear seasonal differences (Southern Brazil: 30–210 m−2, [57]; Tanzania: 68 ± 17 to 626 ± 65 m−2, [58]), indicating that a decrease in crab populations may affect N2O emissions.
Crab burrowing activity allows oxidizing compounds (mainly O2) to enter throughout wet soils, aerating and oxidizing mangrove soils [40,57]. Consequently, N2O emissions demonstrated a remarkable seasonal influence at both crab-bioturbated and crab-exclusion sites, with significantly higher N2O emissions during the rainy season compared to the dry season (Figure 4). These results are similar to N2O emissions from subtropical mangroves in India [59,60,61], but contrast with other studies that reported higher N2O emissions over the dry season [26,62,63], although some other studies in the pristine mangroves of India found no significant seasonal differences for N2O and CH4 emissions [64,65].
Therefore, mangrove ecosystems are mostly encountered in tropical and subtropical climate zones, occupying approximately 140,000 km2 [66,67,68], so that mangroves are widely variable because of alterations in some of the key environmental parameters, including temperature, precipitation, seasonality, tidal regimes, and substrate composition and properties [26,27]. Even within the same estuarine system, high soil heterogeneity can be observed [41,69,70,71], which leads to variability in N2O emission among mangroves [72].
Additionally, the abundance and activity of benthic organisms in coastal environments is regulated mainly by long-term climatic patterns; however, there is also evidence that an interannual oceanic-atmospheric oscillation, such as El Niño, can affect crabs at the population level [73]. El Niño events exert a strong influence on intertidal zones, affecting food availability for intertidal herbivores, which may lead to a strong decrease in crab populations [74]. The Northeastern Brazilian coast experiences drier climate conditions under the effects of El Niño, compared to the normal regional climate conditions. El Niño had a particularly strong influence in the climate of Ceará’s coast (area of study) in 2013 and 2014. The precipitation was lower (673 mm in 2013 and 624 mm in 2014) than the historical mean (812 mm, Figure 2), leading to drier soil conditions and a remarkably lower N2O flux over the dry season (in both crab-exclusion and bioturbated treatments). Other extreme climatic events may enhance rainfall events and may lead to larger N2O fluxes driven by wetter soil conditions.

4.2. Comparison of N2O Emissions from Mangroves and Estuarine Forests around the World

Few studies have reported N2O emissions from mangrove forest soils (Table 1). Our results uniquely showed a wide variation in N2O fluxes due to crab bioturbation as well as seasonality, demonstrating that during the rainy season, the N2O fluxes were among the highest values reported in the mangroves and estuarine forests around the world (Table 1).
The high heterogeneity between mangrove forests (within the site, regionally, and globally) because of distinct physical and biological factors leads to particular characteristics of each mangrove ecosystem [75,76,77]. Additionally, microbial processes operate on a scale of seconds to hours, changing substantially for the same location throughout the day, inducing differences of N biogeochemistry in marine and coastal areas—all of which influence the fate of N2O emissions [75].

5. Conclusions

Our study highlighted the influence of anthropic activities and seasonal changes on the emissions of N2O from mangrove soils, contributing to climate change effects. Lower N2O fluxes in natural crab-bioturbated areas are due to constant soil oxidation by macrofauna, whereas higher N2O fluxes in crab-exclusion mangrove areas are due to wet/anaerobic soil conditions that favor denitrification. Consequently, campaigns to maintain and preserve the mangrove’s macrofauna are greatly advised, mainly because humid coastal areas are increasingly deforested by anthropogenic threats (shrimp farming, urbanization, and agriculture).
We found an enhancement of N2O emissions from dry to rainy seasons. We concluded that seasonality is a major environmental factor that drives the emissions of N2O and the soil’s physicochemical dynamics, whereas natural crab bioturbation is driving greater soil aeration/oxidation and decreases the SOM contents, compared to crab-exclusion conditions. Additionally, we demonstrated that mangroves under highly wet conditions can be among the largest emitters of N2O in mangrove and estuarine forests around the world. The results elucidated the potential impacts of seasonality, as well as for the climatic changes (increase in rain or severe droughts) in mangrove ecosystems, together with the impact of bioturbation in soils, which can be used for biogeochemical cycling models of nitrogen and other nutrients in these coastal wetland systems.

Supplementary Materials

The following are available online at https://www.mdpi.com/2076-3417/10/7/2215/s1, Table S1. p-values for Eh measurements among Sites/Seasons (non-parametric Friedman). Table S2. p-values for pH measurements among Sites/Seasons (non-parametric Friedman). Table S3. p-values for TOC measurements among Sites/Seasons (non-parametric Friedman). Table S4. p-values for TN measurements among Sites/Seasons (non-parametric Friedman). Table S5. p-values for TS measurements among Sites/Seasons (non-parametric Friedman). Table S6. p-values for C:N ratios among Sites/Seasons (non-parametric Friedman). Table S7. p-values for emissions of N2O among Sites/Seasons (non-parametric Friedman). Table S8: Correlation-based principal component analysis (PCA) of soil parameters in wet and dry seasons. Eigenvalues and % of variation explained by the first 2 ordination axes (PC1 and PC2) is given as well as linear coefficients (eigenvector).

Author Contributions

Conceptualization, X.L.O., J.M.C.A., G.N.N., T.O.F.; methodology, X.L.O., G.N.N., M.S.N., T.O.F.; software, D.B., H.M.Q., D.J.R.; validation, X.L.O., D.B., T.O.F.; formal analysis, J.M.C.A., H.M.Q., M.S.N., T.O.F.; investigation, X.L.O., J.M.C.A., T.F.; resources, X.L.O., T.O.F.; data curation, X.L.O., D.B., H.M.Q., D.J.R., T.O.F.; writing—original draft preparation, J.M.C.A., G.N.N., T.O.F.; writing—review and editing, X.L.O., D.B., T.O.F.; visualization, H.M.Q., D.J.R.; supervision, T.O.F.; project administration, T.O.F.; funding acquisition, X.L.O., T.O.F. All authors have read and agreed to the published version of the manuscript.

Funding

The authors are grateful for the financial support provided by São Paulo Research Foundation (FAPESP, grant number 2018/04259-2), National Council for Scientific and Technology Development (CNPq, process 305996/2018-5; 409593/2018-4), Fundação Cearense de Apoio ao Desenvolvimento Científico e Tecnológico (FUNCAP), Foundation for Research and Scientific and Technological Development of Maranhão and National Council of Technological and Scientific Development (FAPEMA/CNPq, grant #03572/2016), Coordenação de Aperfeiçoamento de Pessoal de Nível Superior—Brasil (CAPES)—Finance Code 001, Consellería de Innovación e Industria-Xunta de Galicia (PGIDIT08MDS036000PR), Cross-Research in Environmental Technologies of the Santiago de Compostela University (CRETUS) strategic group (AGRUP2015/02), and Fundação de Amparo à Pesquisa do Estado do Rio de Janeiro (GNN, JCNE Grant #202.757/2019).

Conflicts of Interest

The authors declare no conflict of interest. The authors confirm there are no copyright issues in all of figures.

References

  1. Alongi, D. Impact of Global Change on Nutrient Dynamics in Mangrove Forests. Forests 2018, 9, 596. [Google Scholar] [CrossRef] [Green Version]
  2. Chadwick, R.; Good, P.; Martin, G.; Rowell, D.P. Large rainfall changes consistently projected over substantial areas of tropical land. Nat. Clim. Chang. 2016, 6, 177–181. [Google Scholar] [CrossRef]
  3. Khalyani, A.H.; Gould, W.A.; Harmsen, E.; Terando, A.; Quinones, M.; Collazo, J.A. Climate Change Implications for Tropical Islands: Interpolating and Interpreting Statistically Downscaled GCM Projections for Management and Planning. J. Appl. Meteorol. Climatol. 2016, 55, 265–282. [Google Scholar] [CrossRef]
  4. Donato, D.C.; Kauffman, J.B.; Murdiyarso, D.; Kurnianto, S.; Stidham, M.; Kanninen, M. Mangroves among the most carbon-rich forests in the tropics. Nat. Geosci. 2011, 4, 293–297. [Google Scholar] [CrossRef]
  5. Romero, D.J.; Nóbrega, G.N.; Otero, X.L.; Ferreira, T.O. Diffuse Reflectance Spectroscopy (Vis-Nir-Swir) as a Promising Tool for Blue Carbon Quantification in Mangrove Soils: A Case of Study in Tropical Semiarid Climatic Conditions. Soil Sci. Soc. Am. J. 2017, 81, 1661. [Google Scholar] [CrossRef]
  6. Komiyama, A.; Ong, J.E.; Poungparn, S. Allometry, biomass, and productivity of mangrove forests: A review. Aquat. Bot. 2008, 89, 128–137. [Google Scholar] [CrossRef]
  7. Schaeffer-Novelli, Y.; Cintrón-Molero, G.; Adaime, R.R.; de Camargo, T.M. Variability of Mangrove Ecosystems along the Brazilian Coast. Estuaries 1990, 13, 204. [Google Scholar] [CrossRef]
  8. Ferreira, T.O.; Otero, X.L.; Vidal-Torrado, P.; Macias, F. Redox processes in mangrove soils under Rhizophora mangle in relation to different environmental conditions. Soil Sci. Soc. Am. J. 2007, 71, 484–491. [Google Scholar] [CrossRef]
  9. Bouillon, S.; Borges, A.V.; Castañeda-Moya, E.; Diele, K.; Dittmar, T.; Duke, N.C.; Kristensen, E.; Lee, S.Y.; Marchand, C.; Middelburg, J.J.; et al. Mangrove production and carbon sinks: A revision of global budget estimates. Glob. Biogeochem. Cycles 2008, 22, GB2013. [Google Scholar] [CrossRef] [Green Version]
  10. Chmura, G.L.; Anisfeld, S.C.; Cahoon, D.R.; Lynch, J.C. Global carbon sequestration in tidal, saline wetland soils. Glob. Biogeochem. Cycles 2003, 17, 1111. [Google Scholar] [CrossRef]
  11. Kauffman, J.B.; Bernardino, A.F.; Ferreira, T.O.; Giovannoni, L.R.; de O. Gomes, L.E.; Romero, D.J.; Jimenez, L.C.Z.; Ruiz, F. Carbon stocks of mangroves and salt marshes of the Amazon region, Brazil. Biol. Lett. 2018, 14, 20180208. [Google Scholar] [CrossRef] [PubMed]
  12. Murdiyarso, D.; Purbopuspito, J.; Kauffman, J.B.; Warren, M.W.; Sasmito, S.D.; Donato, D.C.; Manuri, S.; Krisnawati, H.; Taberima, S.; Kurnianto, S. The potential of Indonesian mangrove forests for global climate change mitigation. Nat. Clim. Chang. 2015, 5, 1089–1092. [Google Scholar] [CrossRef]
  13. Kristensen, E.; Bouillon, S.; Dittmar, T.; Marchand, C. Organic carbon dynamics in mangrove ecosystems: A review. Aquat. Bot. 2008, 89, 201–219. [Google Scholar] [CrossRef] [Green Version]
  14. Kitaya, Y.; Yabuki, K.; Kiyota, M.; Tani, A.; Hirano, T.; Aiga, I. Gas exchange and oxygen concentration in pneumatophores and prop roots of four mangrove species. Trees 2002, 16, 155–158. [Google Scholar] [CrossRef]
  15. Kreuzwieser, J.; Buchholz, J.; Rennenberg, H. Emission of Methane and Nitrous Oxide by Australian Mangrove Ecosystems. Plant Biol. 2003, 5, 423–431. [Google Scholar] [CrossRef]
  16. Nielsen, O.I.; Kristensen, E.; Macintosh, D.J. Impact of fiddler crabs (Uca spp.) on rates and pathways of benthic mineralization in deposited mangrove shrimp pond waste. J. Exp. Mar. Bio. Ecol. 2003, 289, 59–81. [Google Scholar] [CrossRef]
  17. Booth, J.M.; Fusi, M.; Marasco, R.; Mbobo, T.; Daffonchio, D. Fiddler crab bioturbation determines consistent changes in bacterial communities across contrasting environmental conditions. Sci. Rep. 2019, 9, 3749. [Google Scholar] [CrossRef] [Green Version]
  18. Júnior, J.M.D.C.A.; Ferreira, T.O.; Suarez-Abelenda, M.; Nóbrega, G.N.; Albuquerque, A.G.B.M.; de Carvalho Bezerra, A.; Otero, X.L. The role of bioturbation by Ucides cordatus crab in the fractionation and bioavailability of trace metals in tropical semiarid mangroves. Mar. Pollut. Bull. 2016, 111, 194–202. [Google Scholar] [CrossRef]
  19. Kristensen, E.; Alongi, D.M. Control by fiddler crabs (Uca vocans) and plant roots (Avicennia marina) on carbon, iron, and sulfur biogeochemistry in mangrove sediment. Limnol. Oceanogr. 2006, 51, 1557–1571. [Google Scholar] [CrossRef] [Green Version]
  20. Kristensen, E.; Flindt, M.; Ulomi, S.; Borges, A.; Abril, G.; Bouillon, S. Emission of CO2 and CH4 to the atmosphere by sediments and open waters in two Tanzanian mangrove forests. Mar. Ecol. Prog. Ser. 2008, 370, 53–67. [Google Scholar] [CrossRef] [Green Version]
  21. Neue, H.U.; Gaunt, J.L.; Wang, Z.P.; Becker-Heidmann, P.; Quijano, C. Carbon in tropical wetlands. Geoderma 1997, 79, 163–185. [Google Scholar] [CrossRef]
  22. Van Cleemput, O.; Samater, A.H. Nitrite in soils: Accumulation and role in the formation of gaseous N compounds. Fertil. Res. 1995, 45, 81–89. [Google Scholar] [CrossRef]
  23. Corredor, J.E.; Morell, J.M.; Bauza, J. Atmospheric nitrous oxide fluxes from mangrove sediments. Mar. Pollut. Bull. 1999, 38, 473–478. [Google Scholar] [CrossRef]
  24. Butterbach-Bahl, K.; Baggs, E.M.; Dannenmann, M.; Kiese, R.; Zechmeister-Boltenstern, S. Nitrous oxide emissions from soils: How well do we understand the processes and their controls? Philos. Trans. R. Soc. B Biol. Sci. 2013, 368, 20130122. [Google Scholar] [CrossRef] [PubMed]
  25. Russow, R.; Sich, I.; Neue, H.U. The formation of the trace gases NO and N2O in soils by the coupled processes of nitrification and denitrification: Results of kinetic 15N tracer investigations. Chemosph. Glob. Chang. Sci. 2000, 2, 359–366. [Google Scholar] [CrossRef]
  26. Chen, G.C.; Tam, N.F.Y.; Ye, Y. Spatial and seasonal variations of atmospheric N2O and CO2 fluxes from a subtropical mangrove swamp and their relationships with soil characteristics. Soil Biol. Biochem. 2012, 48, 175–181. [Google Scholar] [CrossRef]
  27. Chen, G.C.; Tam, N.F.Y.; Ye, Y. Summer fluxes of atmospheric greenhouse gases N2O, CH4 and CO2 from mangrove soil in South China. Sci. Total Environ. 2010, 408, 2761–2767. [Google Scholar] [CrossRef]
  28. Meyer, R.L.; Allen, D.E.; Schmidt, S. Nitrification and denitrification as sources of sediment nitrous oxide production: A microsensor approach. Mar. Chem. 2008, 110, 68–76. [Google Scholar] [CrossRef]
  29. Firestone, M.K.; Davidson, E.A. Microbial basis of NO and N2O production and consumptino in soil. In Exchange of Trace Gases between Terrestrial Ecosystems and Atmosphere; Andreae, M.O., Schimel, D.S., Eds.; John Wiley & Sons: Berkeley, CA, USA, 1989; pp. 7–21. [Google Scholar]
  30. Zhu, X.; Burger, M.; Doane, T.A.; Horwath, W.R. Ammonia oxidation pathways and nitrifier denitrification are significant sources of N2O and NO under low oxygen availability. Proc. Natl. Acad. Sci. USA 2013, 110, 6328–6333. [Google Scholar] [CrossRef] [Green Version]
  31. Hollocher, T.C.; Tate, M.E.; Nicholas, D.J. Oxidation of ammonia by Nitrosomonas europaea. Definite 18O-tracer evidence that hydroxylamine formation involves a monooxygenase. J. Biol. Chem. 1981, 256, 10834–10836. [Google Scholar]
  32. Thomson, A.J.; Giannopoulos, G.; Pretty, J.; Baggs, E.M.; Richardson, D.J. Biological sources and sinks of nitrous oxide and strategies to mitigate emissions. Philos. Trans. R. Soc. B Biol. Sci. 2012, 367, 1157–1168. [Google Scholar] [CrossRef] [PubMed] [Green Version]
  33. Tian, H.; Yang, J.; Xu, R.; Lu, C.; Canadell, J.G.; Davidson, E.A.; Jackson, R.B.; Arneth, A.; Chang, J.; Ciais, P.; et al. Global soil nitrous oxide emissions since the preindustrial era estimated by an ensemble of terrestrial biosphere models: Magnitude, attribution, and uncertainty. Glob. Chang. Biol. 2019, 25, 640–659. [Google Scholar] [CrossRef] [PubMed] [Green Version]
  34. Ravishankara, A.R.; Daniel, J.S.; Portmann, R.W. Nitrous oxide (N2O): The dominant ozone-depleting substance emitted in the 21st century. Science 2009, 326, 123–125. [Google Scholar] [CrossRef] [PubMed] [Green Version]
  35. Ciais, P.; Sabine, C.; Bala, G.; Bopp, L.; Brovkin, V.; Canadell, J.; Chhabra, A.; DeFries, R.; Galloway, J.; Heimann, M.; et al. Carbon and Other Biogeochemical Cycles; Intergovernmental Panel on Climate Change, Ed.; Cambridge University Press: Cambridge, UK, 2013. [Google Scholar]
  36. Bhomia, R.K.; MacKenzie, R.A.; Murdiyarso, D.; Sasmito, S.D.; Purbopuspito, J. Impacts of land use on Indian mangrove forest carbon stocks: Implications for conservation and management. Ecol. Appl. 2016, 26, 1396–1408. [Google Scholar] [CrossRef] [PubMed] [Green Version]
  37. Nóbrega, G.N.; Ferreira, T.O.; Neto, M.S.; Queiroz, H.M.; Artur, A.G.; Mendonça, E.D.S.; Silva, E.D.O.; Otero, X.L. Edaphic factors controlling summer (rainy season) greenhouse gas emissions (CO2 and CH4) from semiarid mangrove soils (NE-Brazil). Sci. Total Environ. 2016, 542, 685–693. [Google Scholar] [CrossRef] [PubMed] [Green Version]
  38. Gopal, B.; Chauhan, M. Biodiversity and its conservation in the Sundarban Mangrove Ecosystem. Aquat. Sci. 2006, 68, 338–354. [Google Scholar] [CrossRef]
  39. Duke, N.C.; Meynecke, J.-O.; Dittmann, S.; Ellison, A.M.; Anger, K.; Berger, U.; Cannicci, S.; Diele, K.; Ewel, K.C.; Field, C.D.; et al. A World Without Mangroves? Science 2007, 317, 41b–42b. [Google Scholar] [CrossRef] [Green Version]
  40. Araújo Júnior, J.M.C.; Otero, X.L.; Marques, A.G.B.; Nóbrega, G.N.; Silva, J.R.F.; Ferreira, T.O. Selective geochemistry of iron in mangrove soils in a semiarid tropical climate: Effects of the burrowing activity of the crabs Ucides cordatus and Uca maracoani. Geo-Mar. Lett. 2012, 32, 289–300. [Google Scholar] [CrossRef]
  41. Barcellos, D.; Queiroz, H.M.; Nóbrega, G.N.; de Oliveira Filho, R.L.; Santaella, S.T.; Otero, X.L.; Ferreira, T.O. Phosphorus enriched effluents increase eutrophication risks for mangrove systems in northeastern Brazil. Mar. Pollut. Bull. 2019, 142, 58–63. [Google Scholar] [CrossRef]
  42. Queiroz, H.M.; Artur, A.G.; Taniguchi, C.A.K.; da Silveira, M.R.S.; do Nascimento, J.C.; Nóbrega, G.N.; Otero, X.L.; Ferreira, T.O. Hidden contribution of shrimp farming effluents to greenhouse gas emissions from mangrove soils. Estuar. Coast. Shelf Sci. 2019, 221, 8–14. [Google Scholar] [CrossRef]
  43. Tanaka, M.O.; Maia, R.C. Shell Morphological Variation of Littoraria angulifera among and within Mangroves in NE Brazil. Hydrobiologia 2006, 559, 193–202. [Google Scholar] [CrossRef]
  44. Kottek, M.; Grieser, J.; Beck, C.; Rudolf, B.; Rubel, F. World map of the Köppen-Geiger climate classification updated. Meteorol. Zeitschrift 2006, 15, 259–263. [Google Scholar] [CrossRef]
  45. Peel, M.C.; Finlayson, B.L.; McMahon, T.A. Updated world map of the Köppen-Geiger climate classification. Hydrol. Earth Syst. Sci. 2007, 11, 1633–1644. [Google Scholar] [CrossRef] [Green Version]
  46. Instituto de Pesquisa e Estratégia Econômica do Ceará. Perfil Básico Municipal—Aracati; IPECE: Fortaleza, Brazil, 2014. [Google Scholar]
  47. De Sales, J.C. Climatic Characterization and Comparison of Estimated Methods of the Reference Evapotranspiration in the Regions of Ceará State. Ph.D. Thesis, São Paulo State University, São Paulo, Brazil, 2008. [Google Scholar]
  48. Schmidt, A.J. Estudo da Dinâmica Populacional do Caranguejo-uçá, Ucides Cordatus Cordatus (Linnaeus, 1763) (Crustacea-Decapoda-Brachyura), e dos Efeitos de Uma Mortalidade em Massa Desta Espécie em Manguezais do Sul da Bahia. Ph.D. Thesis, São Paulo State University, São Paulo, Brazil, 2006. [Google Scholar]
  49. Kauffman, J.B.; Donato, D. Protocols for the Measurement, Monitoring and Reporting of Structure, Biomass and Carbon Stocks in Mangrove Forests; CIFOR: Bongor, Indonesia, 2012. [Google Scholar]
  50. Branco, J.O. Aspectos bioecológicos do caranguejo Ucides cordatus (Linnaeus, 1763) (Crustacea, Decapoda) do manguezal do Itacorubi, Santa Catarina, BR. Braz. Arch. Biol. Technol. 1993, 36, 133–148. [Google Scholar]
  51. Howard, J.; Hoyt, S.; Isensee, K.; Telszewski, M.; Pidgeon, E.; Telszewski, M. Coastal Blue Carbon: Methods for Assessing Carbon Stocks and Emissions Factors in Mangroves, Tidal Salt Marshes, and Seagrasses; International Union for Conservation of Nature: Arlington, VA, USA, 2014; Volume 1, ISBN 9782831717623. [Google Scholar]
  52. Reimann, C.; Filzmoser, P.; Garrett, R.G.; Dutter, R. Statistical Data Analysis Explained; John Wiley & Sons, Ltd.: Chichester, UK, 2008; ISBN 9780470987605. [Google Scholar]
  53. McBratney, A.B.; Minasny, B.; Viscarra Rossel, R. Spectral soil analysis and inference systems: A powerful combination for solving the soil data crisis. Geoderma 2006, 136, 272–278. [Google Scholar] [CrossRef]
  54. Johnson, R.W. An Introduction to the Bootstrap. Teach. Stat. 2001, 23, 49–54. [Google Scholar] [CrossRef]
  55. Ferreira, T.O. Bioturbation and its role in iron and sulfur geochemistry in mangrove soils. In Biogeochemistry and Pedogenetic Process in Saltmarsh and Mangrove Systems; Nova Science Publishers: New York, NY, USA, 2010; pp. 199–222. ISBN 9781617282690. [Google Scholar]
  56. Allen, D.E.; Dalal, R.C.; Rennenberg, H.; Meyer, R.L.; Reeves, S.; Schmidt, S. Spatial and temporal variation of nitrous oxide and methane flux between subtropical mangrove sediments and the atmosphere. Soil Biol. Biochem. 2007, 39, 622–631. [Google Scholar] [CrossRef]
  57. Ferreira, T.O.; Otero, X.L.; Vidal-Torrado, P.; Macías, F. Effects of bioturbation by root and crab activity on iron and sulfur biogeochemistry in mangrove substrate. Geoderma 2007, 142, 36–46. [Google Scholar] [CrossRef]
  58. Kristensen, E. Mangrove crabs as ecosystem engineers; with emphasis on sediment processes. J. Sea Res. 2008, 59, 30–43. [Google Scholar] [CrossRef]
  59. Chauhan, R.; Datta, A.; Ramanathan, A.; Adhya, T.K. Factors influencing spatio-temporal variation of methane and nitrous oxide emission from a tropical mangrove of eastern coast of India. Atmos. Environ. 2015, 107, 95–106. [Google Scholar] [CrossRef]
  60. Krithika, K.; Purvaja, R.; Ramesh, R. Fluxes of methane and nitrous oxide from an Indian mangrove. Curr. Sci. 2008, 94, 218–224. [Google Scholar]
  61. Hashimoto, S.; Gojo, K.; Hikota, S.; Sendai, N.; Otsuki, A. Nitrous oxide emissions from coastal waters in Tokyo Bay. Mar. Environ. Res. 1999, 47, 213–223. [Google Scholar] [CrossRef]
  62. Allen, D.; Dalal, R.C.; Rennenberg, H.; Schmidt, S. Seasonal variation in nitrous oxide and methane emissions from subtropical estuary and coastal mangrove sediments, Australia. Plant Biol. 2011, 13, 126–133. [Google Scholar] [CrossRef] [PubMed]
  63. Zhang, G.; Zhang, J.; Xu, J.; Zhang, F. Distributions, sources and atmospheric fluxes of nitrous oxide in Jiaozhou Bay. Estuar. Coast. Shelf Sci. 2006, 68, 557–566. [Google Scholar] [CrossRef]
  64. Barnes, J.; Ramesh, R.; Purvaja, R.; Rajkumar, A.N.; Kumar, B.S.; Krithika, K.; Ravichandran, K.; Uher, G.; Upstill-Goddard, R. Tidal dynamics and rainfall control N2O and CH4 emissions from a pristine mangrove creek. Geophys. Res. Lett. 2006, 33, 4–9. [Google Scholar] [CrossRef]
  65. Livesley, S.J.; Andrusiak, S.M. Temperate mangrove and salt marsh sediments are a small methane and nitrous oxide source but important carbon store. Estuar. Coast. Shelf Sci. 2012, 97, 19–27. [Google Scholar] [CrossRef]
  66. Food and Agriculture Organization of the United Nations. Global Forest Resources Assessment 2005: Thematic Study on Mangroves: Brazil, Country Profile; FAO - Forestry Department: Rome, Italy, 2005; p. 10. [Google Scholar]
  67. Giri, C.; Ochieng, E.; Tieszen, L.L.; Zhu, Z.; Singh, A.; Loveland, T.; Masek, J.; Duke, N. Status and distribution of mangrove forests of the world using earth observation satellite data. Glob. Ecol. Biogeogr. 2011, 20, 154–159. [Google Scholar] [CrossRef]
  68. Spalding, M.; Kainuma, M.; Collins, L. Book review: World atlas of mangroves. Wetlands 2010, 31, 1003–1005. [Google Scholar]
  69. Otero, X.L.; Macias, F. Spatial variation in pyritization of trace metals in salt-marsh soils. Biogeochemistry 2003, 62, 59–86. [Google Scholar] [CrossRef]
  70. Ferreira, T.O.; Otero, X.L.; de Souza Junior, V.S.; Vidal-Torrado, P.; Macías, F.; Firme, L.P. Spatial patterns of soil attributes and components in a mangrove system in Southeast Brazil (São Paulo). J. Soils Sediments 2010, 10, 995–1006. [Google Scholar] [CrossRef]
  71. Otero, X.L.; Méndez, A.; Nóbrega, G.N.; Ferreira, T.O.; Meléndez, W.; Macías, F. High heterogeneity in soil composition and quality in different mangrove forests of Venezuela. Environ. Monit. Assess. 2017, 189, 511. [Google Scholar] [CrossRef] [PubMed]
  72. Murray, R.H.; Erler, D.V.; Eyre, B.D. Nitrous Oxide Fluxes in Estuarine Environments: Response to Global Change. Glob. Change Biol. 2015, 21, 3219–3245. [Google Scholar] [CrossRef]
  73. Sanchez-Rubio, G.; Perry, H.M.; Biesiot, P.M.; Johnson, D.R.; Lipcius, R.N. Climate-related hydrological regimes and their effects on abundance of juvenile blue crabs (Callinectes sapidus) in the northcentral Gulf of Mexico. Fish. Bull. 2011, 109, 139–146. [Google Scholar]
  74. Vinueza, L.R.; Branch, G.M.; Branch, M.L.; Bustamante, R.H. Top-down herbivory and bottom-up El Niño effects on Galápagos rocky-shore communities. Ecol. Monogr. 2006, 76, 111–131. [Google Scholar] [CrossRef]
  75. Alongi, D. The Energetics of Mangrove Forests; Springer: Dordrecht, The Netherlands, 2009; ISBN 978-1-4020-4270-6. [Google Scholar]
  76. Wolanski, E. Hydrodynamics of mangrove swamps and their coastal waters. Hydrobiologia 1992, 247, 141–161. [Google Scholar] [CrossRef]
  77. Woodroffe, C. Mangrove sediments and geomorphology. In Tropical Mangrove Ecosystems; Alongi, D.M., Robertson, A.I., Eds.; American Geophysical Union (AGU): Washington, DC, USA, 1992; Volume 41, pp. 7–41. [Google Scholar]
  78. Chen, Y.; Chen, G.; Ye, Y. Coastal vegetation invasion increases greenhouse gas emission from wetland soils but also increases soil carbon accumulation. Sci. Total Environ. 2015, 526, 19–28. [Google Scholar] [CrossRef]
  79. Chen, G.C.; Ulumuddin, Y.I.; Pramudji, S.; Chen, S.Y.; Chen, B.; Ye, Y.; Ou, D.Y.; Ma, Z.Y.; Huang, H.; Wang, J.K. Rich soil carbon and nitrogen but low atmospheric greenhouse gas fluxes from North Sulawesi mangrove swamps in Indonesia. Sci. Total Environ. 2014, 487, 91–96. [Google Scholar] [CrossRef]
Figure 1. (A) Location of the studied mangroves in Brazil, (B) location of the sampling sites, (C) crab-exclusion plot, and (D) static chambers used for N2O collection.
Applsci 10 02215 g001
Figure 2. Mean annual precipitation (mm) for the studied mangrove forests, total precipitation for 2013 and 2014, and sampling dates (for soils and gas) at the end of both the wet and dry seasons.
Applsci 10 02215 g002
Figure 3. Soil measurements of mangrove soils for both bioturbated and crab-exclusion plots and over rainy and dry seasons. (A) In situ recorded redox potential (Eh), (B) in situ recorded pH, (C) total organic carbon (TOC), (D) total sulfur (TS), (E) total nitrogen (TN), and (F) C:N ratio. Labelled bars (standard error bars) with different lowercase letters (a and b) on the bars indicate statistical differences among Seasons/Sites (Rainy/Bioturbated, Rainy/Crab-exclusion, Dry/Bioturbated, Dry/Crab-exclusion), at the 5% probability level (non-parametric Friedman test). p-values for each parameter are provided in Tables S1–S6.
Applsci 10 02215 g003
Figure 4. N2O emissions for bioturbated and crab-exclusion mangrove soils for both seasons. Labelled bars (standard error bars) with different lowercase letters (a, b, and c) on the bars indicate statistical differences among Seasons/Sites (Rainy/Bioturbated, Rainy/Crab-exclusion, Dry/Bioturbated, Dry/Crab-exclusion), at the 5% probability level (non-parametric Friedman test). p-values are provided in Table S7.
Applsci 10 02215 g004
Figure 5. Principal component analysis (PCA) for the studied parameters N2O, Eh, pH, TOC, TN, and TS, and the effects of the factors Seasonality and Bioturbation.
Applsci 10 02215 g005
Figure 6. Comparison of measured N2O emissions (mean and standard deviation) from the studied mangroves in relation to redox soil conditions across sites and seasons.
Applsci 10 02215 g006
Table 1. N2O fluxes of different mangrove and estuarine forests worldwide.
SiteEnvironment CharacterizationSeasonN2O flux (µg m−2 h−1)Reference
Brazil. Ceará StateCrab-exclusion/Control area (without crabs Ucides cordatus)Rainy47.0 ± 18.0This study
Dry6.0 ± 5.0
Naturally bioturbated area (with crabs Ucides cordatus)Rainy36.5 ± 12.0
Dry4.50 ± 2.0
Australia. QueenslandFringe river with high human influence. High nitrate and phosphate concentrationAutumn (April)28.5 ± 9.10[56]
Summer (February). Rainy season15.2 ± 8.80
Winter (July)24.5 ± 5.20
Avicennia marina forestAutumn (April)29.17 ± 11.6
Summer (February). Rainy season6.0 ± 3.0
Winter (July)11.2 ± 6.34
India. South Andaman islandPristine area. Mangrove creekRainy9.24 (water creek)[64]
Dry11.04 (water creek)
Mangrove forest of Rhizophora sp.Rainy9.66
Dry5.52
India. Odisha state.Avicennia sp. Monsoon16.55
Winter26.54[59]
Rhizophora mucronateMonsoon18.79
Winter (high nitrate concentration)112.8
Mangrove eutrophicated with nitrateMonsoon14.13
Winter39.00
China. Jiulong estuaryVegetation: Kandelia obovataWinter-dry season16.0 ± 6.0[78]
Spring52.0 ± 0.010
Summer-Rainy season37.0 ± 7.0
Autumn31.0 ± 3.0
Vegetation Sonneratia apetalaWinter-dry season25.0 ± 3.0
Spring51.0 ± 11.0
Summer-Rainy season50.0 ± 7.0
Autumn80.0 ± 7.0
Vegetation: Cyperus malaccensisWinter-dry season13.0 ± 7.0
Spring46.0 ± 9.0
Summer-Rainy season90.0 ± 7.0
Autumn50.0 ± 10.0
Vegetation: Spartina alternifloraWinter-dry season6.0 ± 1.0
Spring0.081 ± 0.008
Summer-Rainy season60.0 ± 5.0
Autumn56.0 ± 3.0
Indonesia. North Sulawesi.Rhizophora apiculata, Bruguiera gymnorrhiza, −16.8–29.3[79]
Puerto RicoMagueyes Island. Vegetation: Rhizophora mangueJanuary/December. Rainy season~28.8[23]
Enrique reef. Vegetation: R. mangueNovember/February. Rainy season12
Bird Island. Vegetation: R. mangue affected by guanoNovember/February. Rainy season374
Seawage treatment plant. Vegetation R. mangue/ Laguncularia racemosa. High nitrate concentrationJanuary-June. Rainy-dry season~33.6
Seawage treatment plant.Vegetation: Avicennia germinans. High nitrate concentrationJanuary/June. Rainy/dry season5.76

