Article

Investigation of Ytterbium Incorporation in Lithium Niobate for Active Waveguide Devices

Faculty of Electrical Engineering, Helmut Schmidt University, 22043 Hamburg, Germany
*
Author to whom correspondence should be addressed.
Appl. Sci. 2020, 10(6), 2189; https://doi.org/10.3390/app10062189
Submission received: 14 February 2020 / Revised: 10 March 2020 / Accepted: 11 March 2020 / Published: 24 March 2020
(This article belongs to the Special Issue Ion-exchange in Glasses and Crystals: from Theory to Applications )

Abstract

:

Featured Application

Active waveguide devices, waveguide lasers.

Abstract

In this work, we report on an investigation of the ytterbium diffusion characteristics in lithium niobate. Ytterbium-doped substrates were prepared by in-diffusion of thin metallic layers coated onto x- and z-cut congruent substrates at different temperatures. The ytterbium profiles were investigated in detail by means of secondary neutral mass spectroscopy, optical microscopy, and optical spectroscopy. Diffusion from an infinite source was used to determine the solubility limit of ytterbium in lithium niobate as a function of temperature. The derived diffusion parameters are of importance for the development of active waveguide devices in ytterbium-doped lithium niobate.

1. Introduction

The ferroelectric crystal lithium niobate (LiNbO3) is a well-known material for various optical applications due to its favorable electro-optical, acousto-optical, piezoelectric, and nonlinear properties. Furthermore, low-loss waveguides can be implemented in rare-earth-doped LiNbO3 via several fabrication techniques [1,2,3,4,5,6], leading to the development of waveguide amplifiers as well as waveguide lasers. In the past, a variety of efficient erbium- (Er) and neodymium (Nd)-doped LiNbO3 waveguide lasers have been realized [7,8,9,10]. Another attractive laser material is Yb:LiNbO3. Due to the simple energy level scheme of ytterbium (Yb) with only one excited state, a small laser quantum defect can be achieved, allowing for the development of highly efficient Yb lasers [11]. Another benefit of Yb is the large gain bandwidth, which allows for wide wavelength tuning and the generation of ultrashort pulses [12,13].
In 1995, Jones et al. reported the demonstration of an Yb:LiNbO3 waveguide laser with a slope efficiency of 16% [14]. Due to photorefractive damage, the y-propagation Ti-diffused Yb:LiNbO3 waveguide laser showed unstable laser operation. Later, Fujimura et al. reported continuous-wave lasing with a slope efficiency of 7% in z-cut LiNbO3 annealed/proton-exchanged (APE) waveguides [15] by using thermally in-diffused Yb. While in the latter works, channel waveguides were used, another method which also reduces photorefractive damage is using ridge waveguides [16]. In such geometry, further improvement of the laser performance can be achieved due to the smaller mode fields and significantly improved overlap of optical pump and laser modes, when compared to their channel counterparts. Recently, a novel fabrication method has been reported comprising ridge definition by diamond blade dicing followed by three-side Er/Nd and Ti in-diffusion for the development of highly efficient rare-earth-doped Ti:LiNbO3 ridge waveguide lasers [17,18,19]. This fabrication technique is a promising method for increasing the slope efficiency of Yb:LiNbO3 waveguide lasers, too. For the development of low-loss Yb:Ti:LiNbO3 ridge waveguides with optimized overlap of the Yb doping profile and the intensity profiles of the guided modes, it is essential to know the diffusion constants and the maximum solubility of Yb in LiNbO3. Apart from a single value for the diffusivity at 1100 °C in z-direction [20], only a few data regarding the diffusion doping of LiNbO3 with Yb can be found [14,21].
In this work, we report on an investigation of the incorporation of Yb into LiNbO3 by in-diffusion. To determine the diffusion constants and the maximum solubility of Yb in LiNbO3, diffusion profiles measured by SNMS (secondary neutral mass spectrometry) were analyzed. With these data, a first ridge waveguide sample was prepared, and the absorption and emission spectra of the in-diffused Yb ions were measured and compared with literature values.

2. Experimental Methods

2.1. Sample Preparation

For the sample fabrication, optical-grade x- and z-cut wafers of congruent LiNbO3 (Yamaju Ceramics Co., LTD) were used. Pieces of 10 × 10 × 1 mm3 were prepared by diamond saw dicing. The samples were cleaned using successive baths of acetone, isopropanol and deionized water, and an ultrasonic cleaner. Plasma cleaning in oxygen was applied as the final cleaning step prior to vacuum deposition. The samples were coated with 20 nm thick layers of Yb, with a purity of 99.9%, using electron beam evaporation. For annealing, the samples were placed in a platinum crucible in a high temperature elevator furnace for diffusion time of 30 h at different temperatures between 930 and 1130 °C. The heating and cooling rates were constant for all samples.
One sample with dimensions of 1 × 25 × 8 mm3 (x y z) from the x-cut wafer was also used to prepare Yb-doped ridge waveguides. For this, ridges were prepared in the x surface running parallel to the y-axis by precise diamond blade milling, and these samples were coated with 22 nm of Yb under symmetric angles of ±60°. For diffusion, the coated ridges were annealed at T = 1125 °C for t = 216 h. Afterwards, 85 nm of Ti were deposited under symmetric angles of ±60° and in-diffused to prepare the ridge waveguides as described in [17].

2.2. SNMS Measurements

The SNMS measurements were performed using the Multimethod System with INA-X from SPECS. For the direct bombardment mode during sputtering, an RF-excited Krypton plasma was used. Samples were protected by a copper mask defining a free area with a diameter of 5 mm in the central part of each sample. After SNMS analysis, the sputtered crater was measured using a white light interferometer (WLI from FRT) to determine the sputtering rate. The rate was (0.45 ± 0.02) nm/s for all samples.

3. Results and Discussion

Figure 1 shows the depth profiles of 7Li, 93Nb, 16O, and 70Yb on a semilogarithmic scale giving two examples of SNMS spectra of the Yb-doped LiNbO3 samples used in this analysis. Figure 1a demonstrates that at lower temperatures, a certain amount of Yb remains in form of a thin film on the surface, indicating that the Yb reservoir has not been exhausted.

Diffusion Theory

The Yb concentration profiles obtained in this work can be well approximated utilizing the one-dimensional diffusion theory described by Fick’s second law of diffusion.
C t = D 2 C y 2 ,
where D is the diffusion coefficient and y quantifies the direction normal to the surface. Assuming an inexhaustible source (i.e., a thick film) of Yb on the surface, the solution of Fick’s law (1) can be approximated by
C ( y ) = C max erfc ( y / d e r f ) ,
with Cmax being the concentration of Yb at the crystal surface and the diffusion depth d e r f = 4 D t . In the thick-film diffusion regime. Cmax describes the solubility of Yb in LiNbO3. This value is given by
C max = π 4 D t 0 C ( y ) d y .
Using the law of mass conservation, the time needed for the Yb source to be depleted can be calculated with the metallic Yb density ρ, the atomic mass mYb, and the thickness τ of the initial Yb layer
t d = ( ρ τ 2 m Y b C max ) 2 π D .
For sufficiently thin films and/or sufficiently long in-diffusion times (t > td), the Yb source is depleted and the diffusion profile can be approximated by a Gaussian function
C ( y ) = C 0 exp ( y 2 d exp 2 ) .
In this case, d exp = 4 D t describes the 1/e-depth of the profile. The surface concentration C0 is below the solubility and given by
C 0 = τ C max π D t .
The temperature dependence of the diffusion coefficient D is given by the Arrhenius relation
D ( T ) = D 0 exp ( E A k B T ) .
Here, D0 is the diffusion constant, EA the activation energy, kB the Boltzmann constant, and T is the temperature used for in-diffusion.
As the solubility describes the equilibrium between Yb in LiNbO3 and the pure metallic Yb on the surface, the concentration at the surface can also be written in terms of an Arrhenius-type equation as
C max ( T ) = C ^ exp ( Δ H k B T ) ,
where ∆H is the mixing enthalpy and C ^ is a pre-factor.
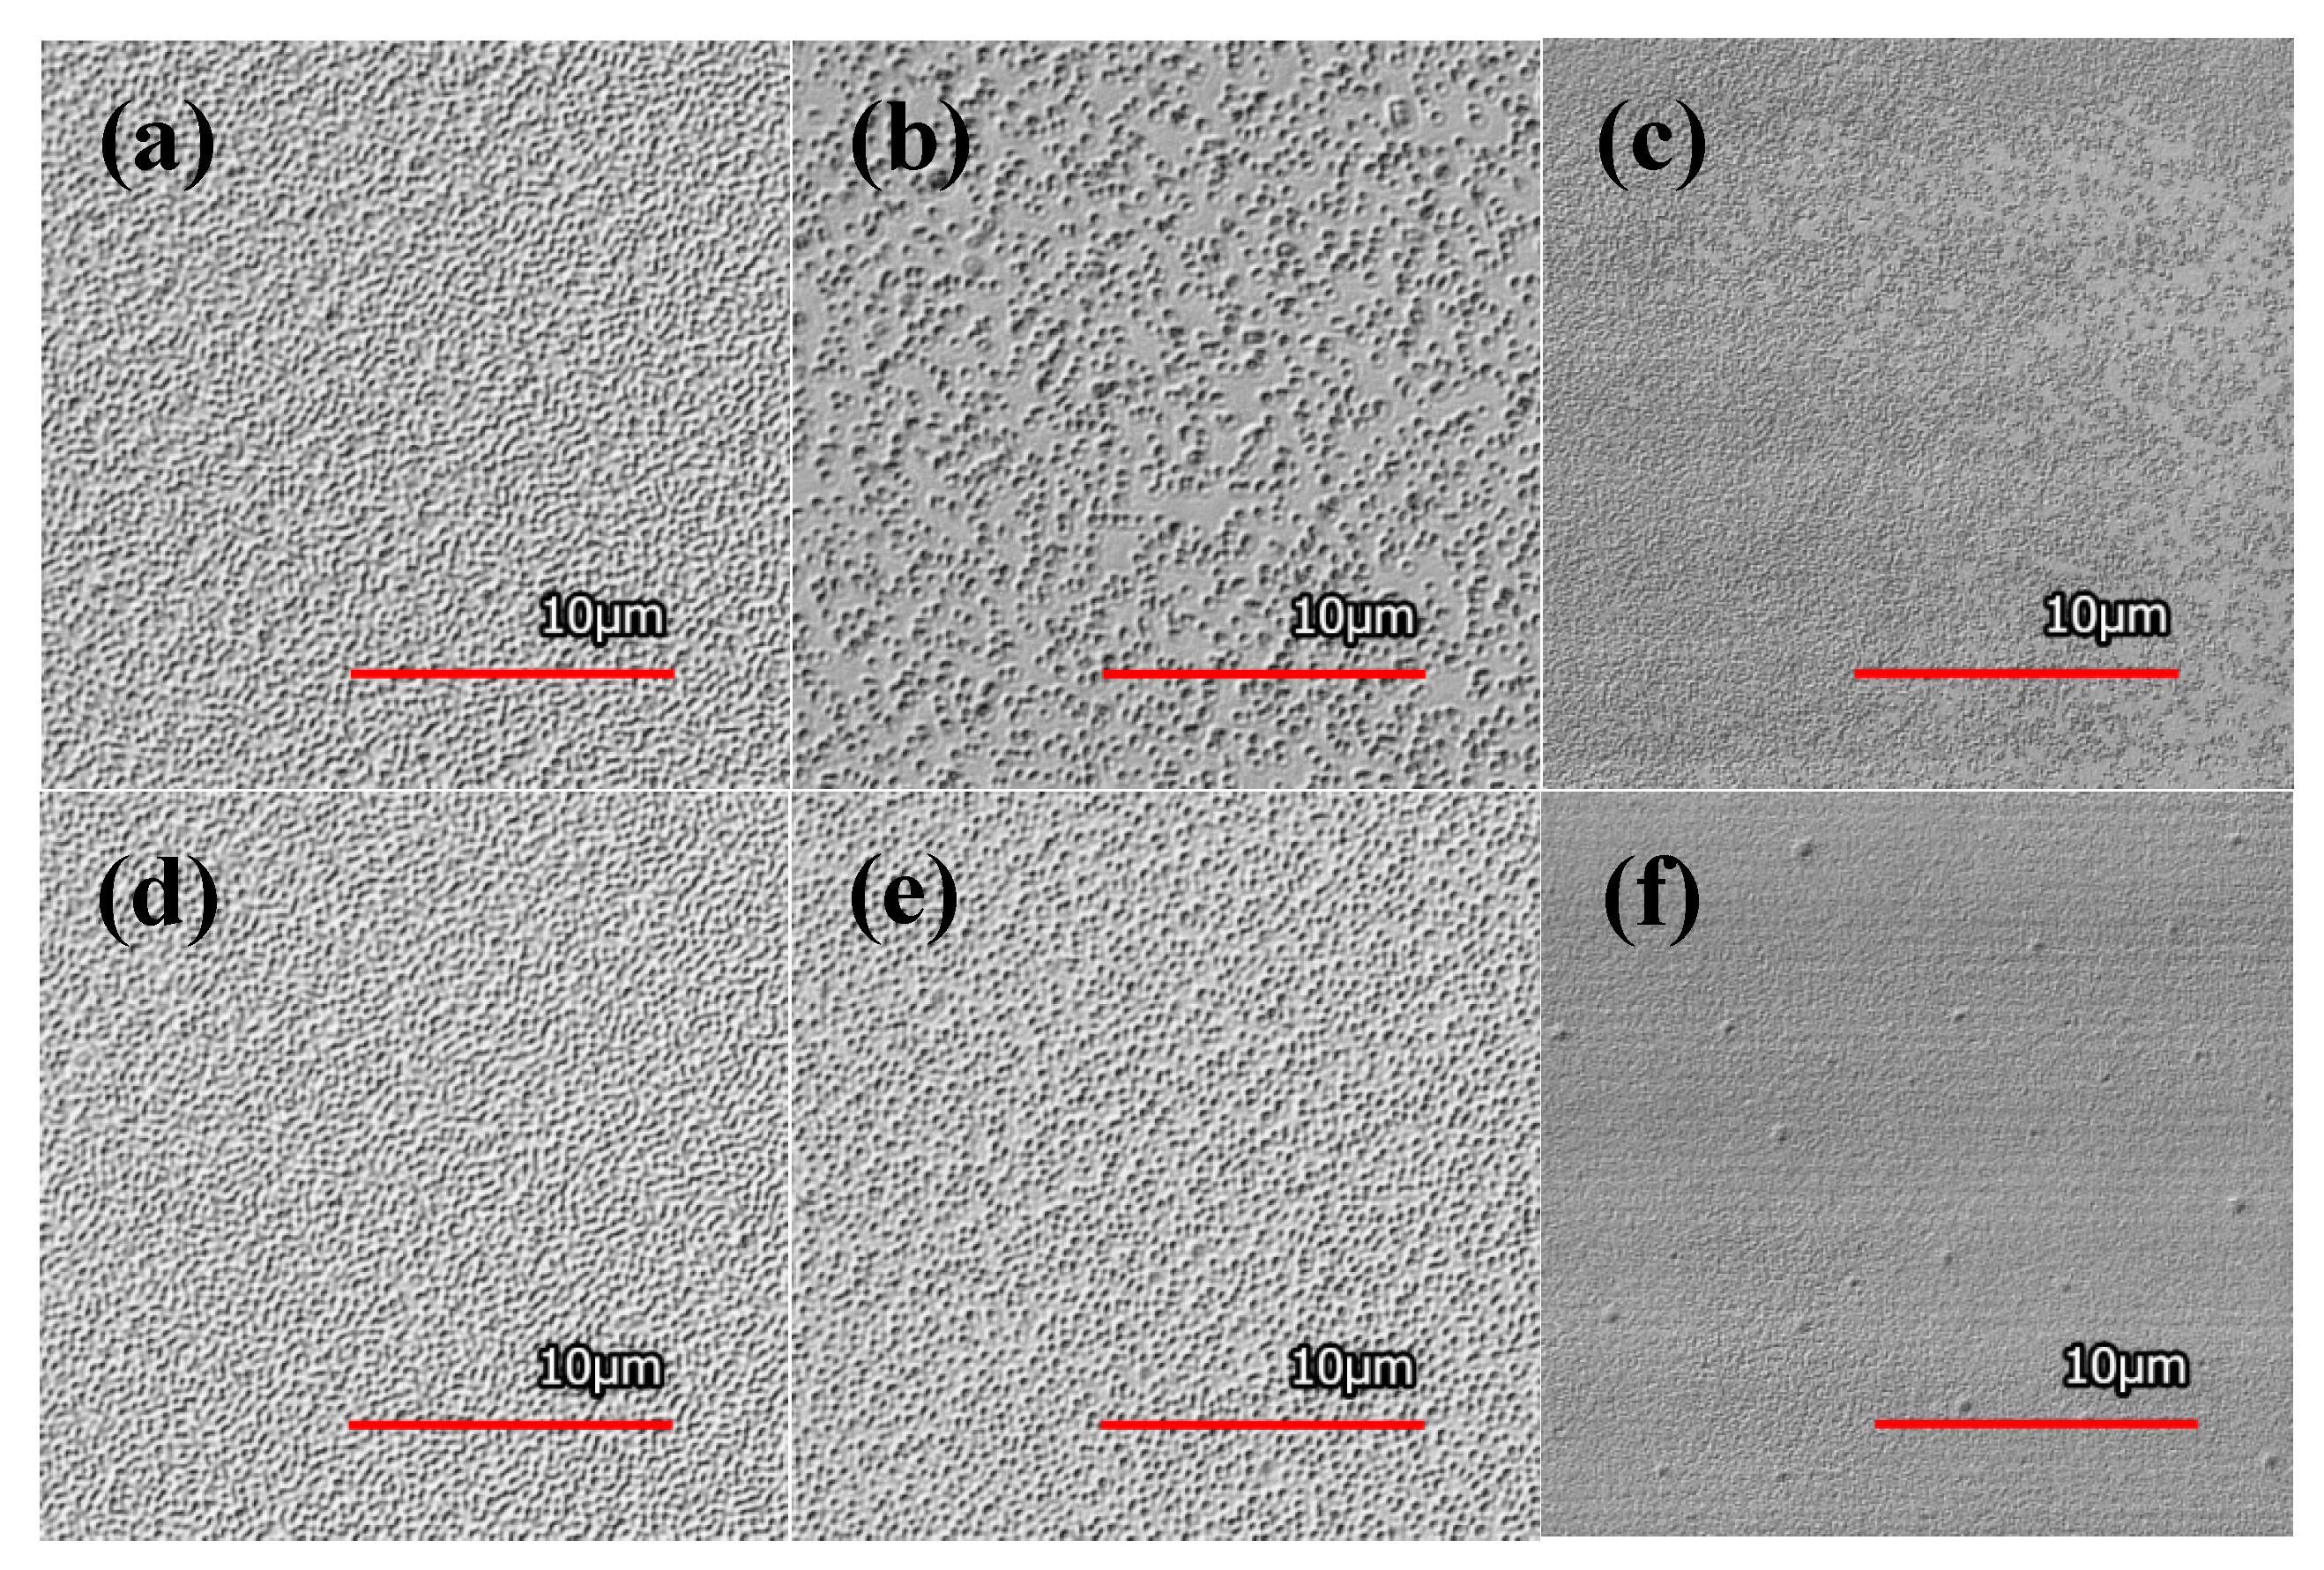
Figure 2 shows the high-resolution images of the crystal surfaces obtained using a confocal microscope and applying the differential interference contrast method for the two crystal orientations. When the temperature used for annealing is less than 1130 °C, an increased surface roughness caused by insufficient diffusion is visible. For the x-cut surfaces, the arithmetical mean height (Sa) slightly decreases from 12 to 10 nm when the temperature increases from (a) 1000 to (b) 1060 °C.
For the z-cut surface shown in (d) and (e), the Sa is reduced from 11 to 7 nm. Annealing for 30 h at 1130 °C results in a smooth surface with Sa = 2 nm for both (c) x- and (f) z-cut surfaces, indicating that the Yb ion source at the surface is completely exhausted, and the Yb profile can be described by the thin-film diffusion regime of Equation (5).
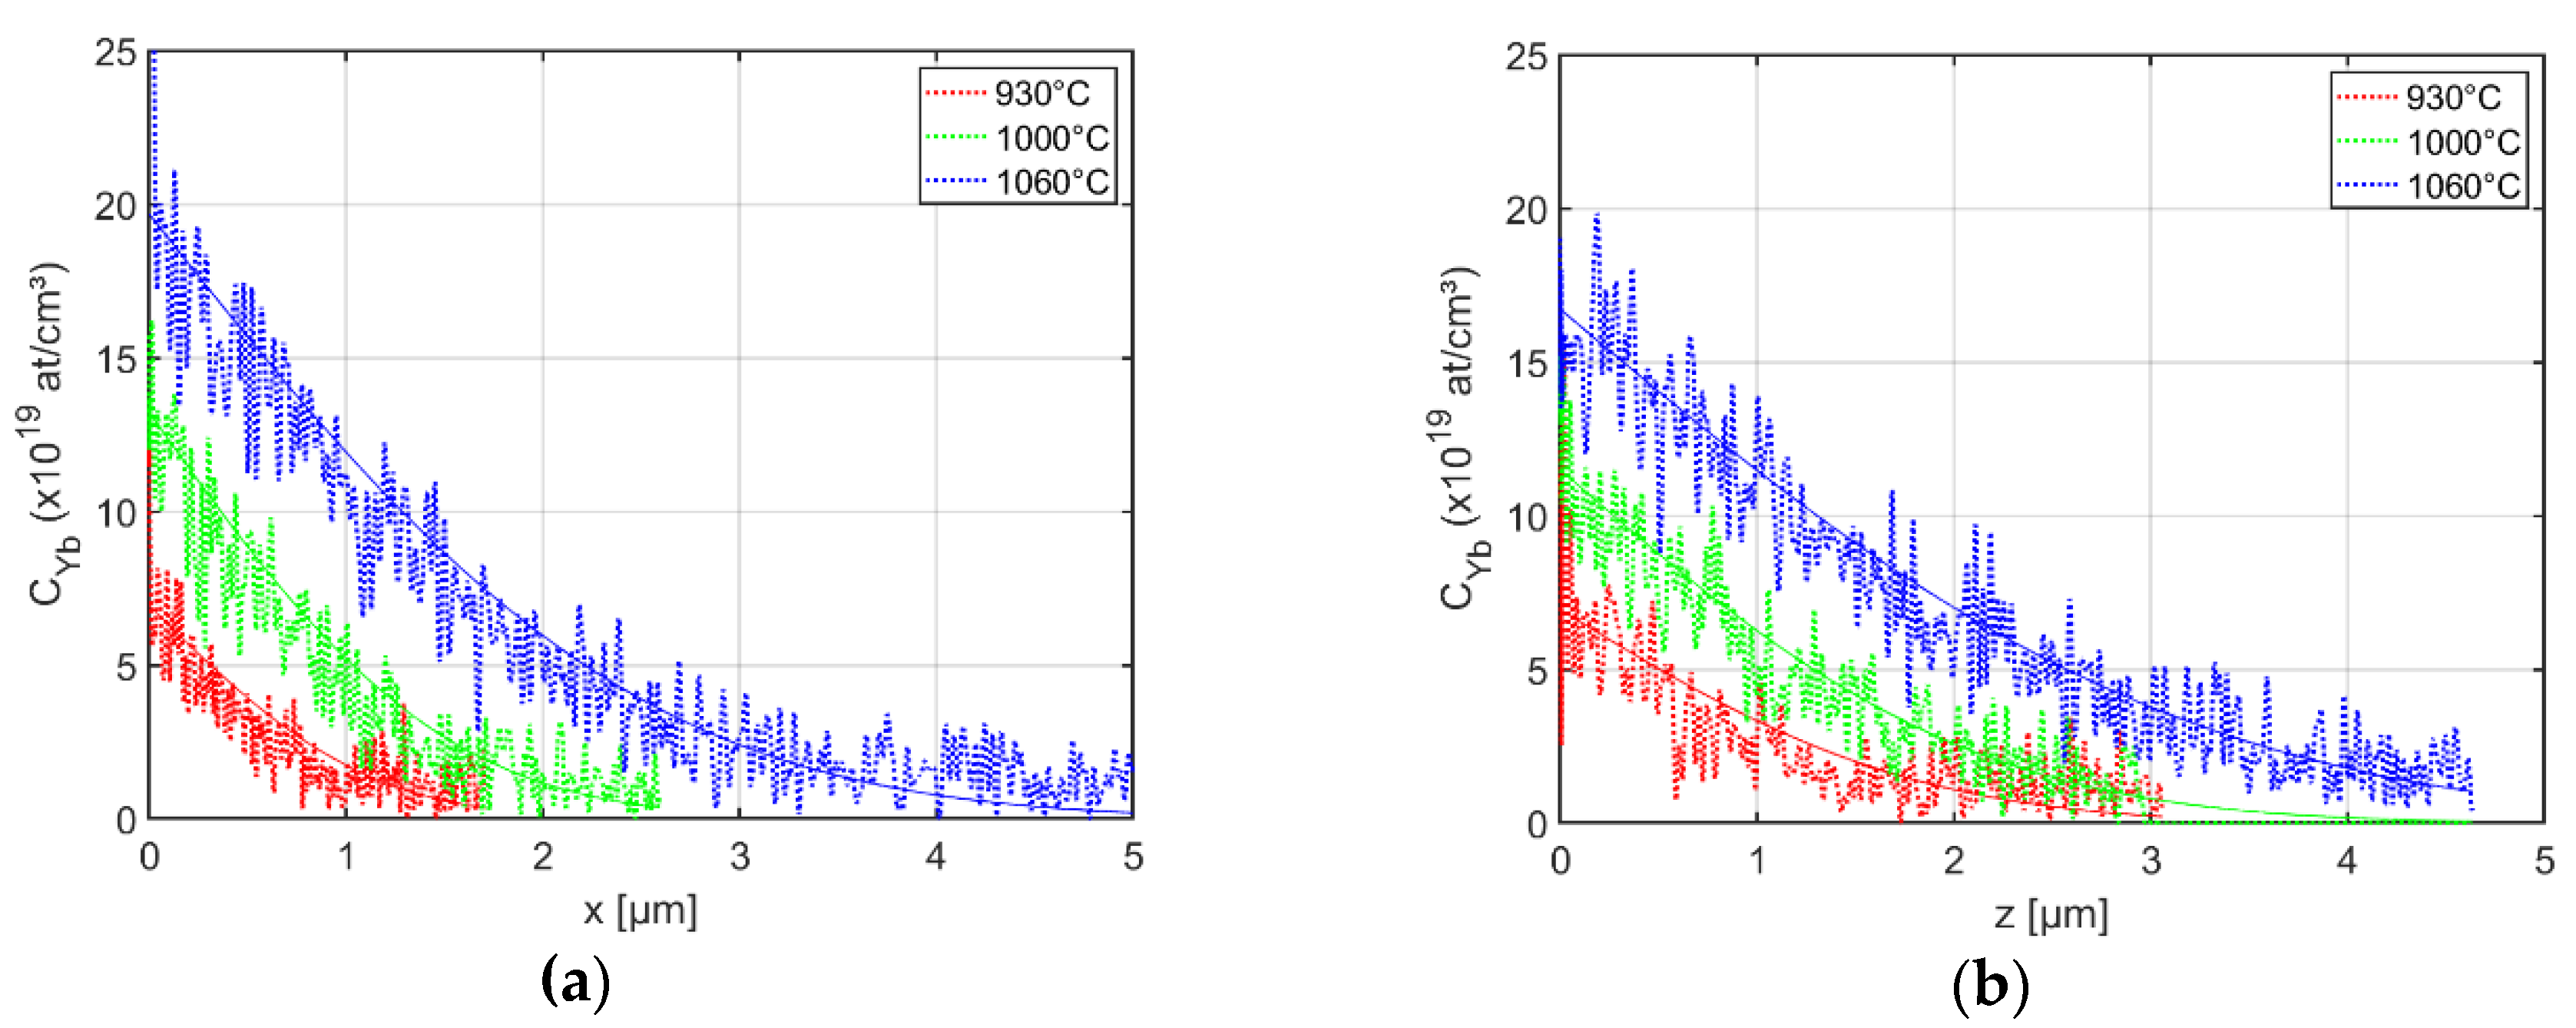
For calibration of the SNMS data, the samples annealed at 1130 °C were used assuming a linear relation between ion yield and concentration as well as mass conservation in the diffusion process. For lower temperatures, the experimentally obtained profiles can be best fitted by complementary error functions, as can be seen in Figure 3.
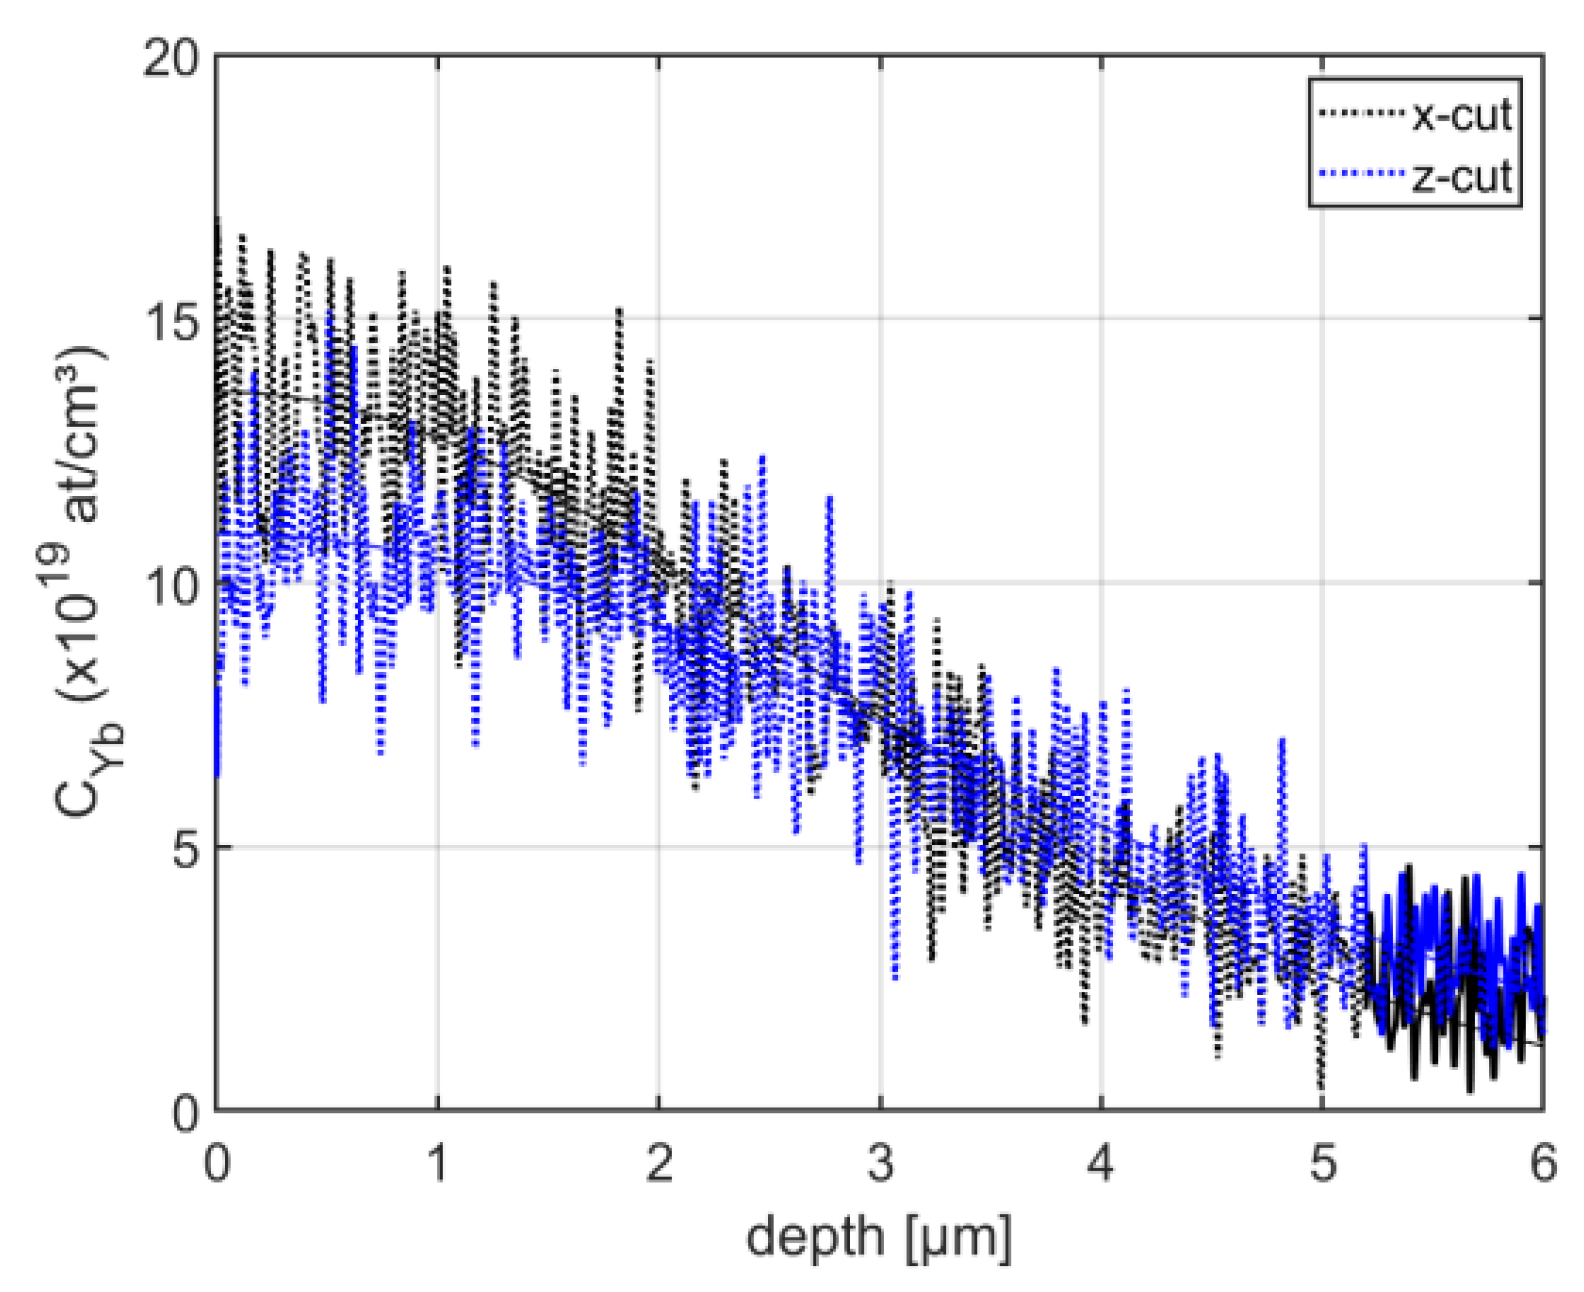
The profiles obtained using the highest temperature were fitted by Gaussian functions; see Figure 4. The results obtained for the surface concentration and for the depths derf or dexp are summarized in Table 1.
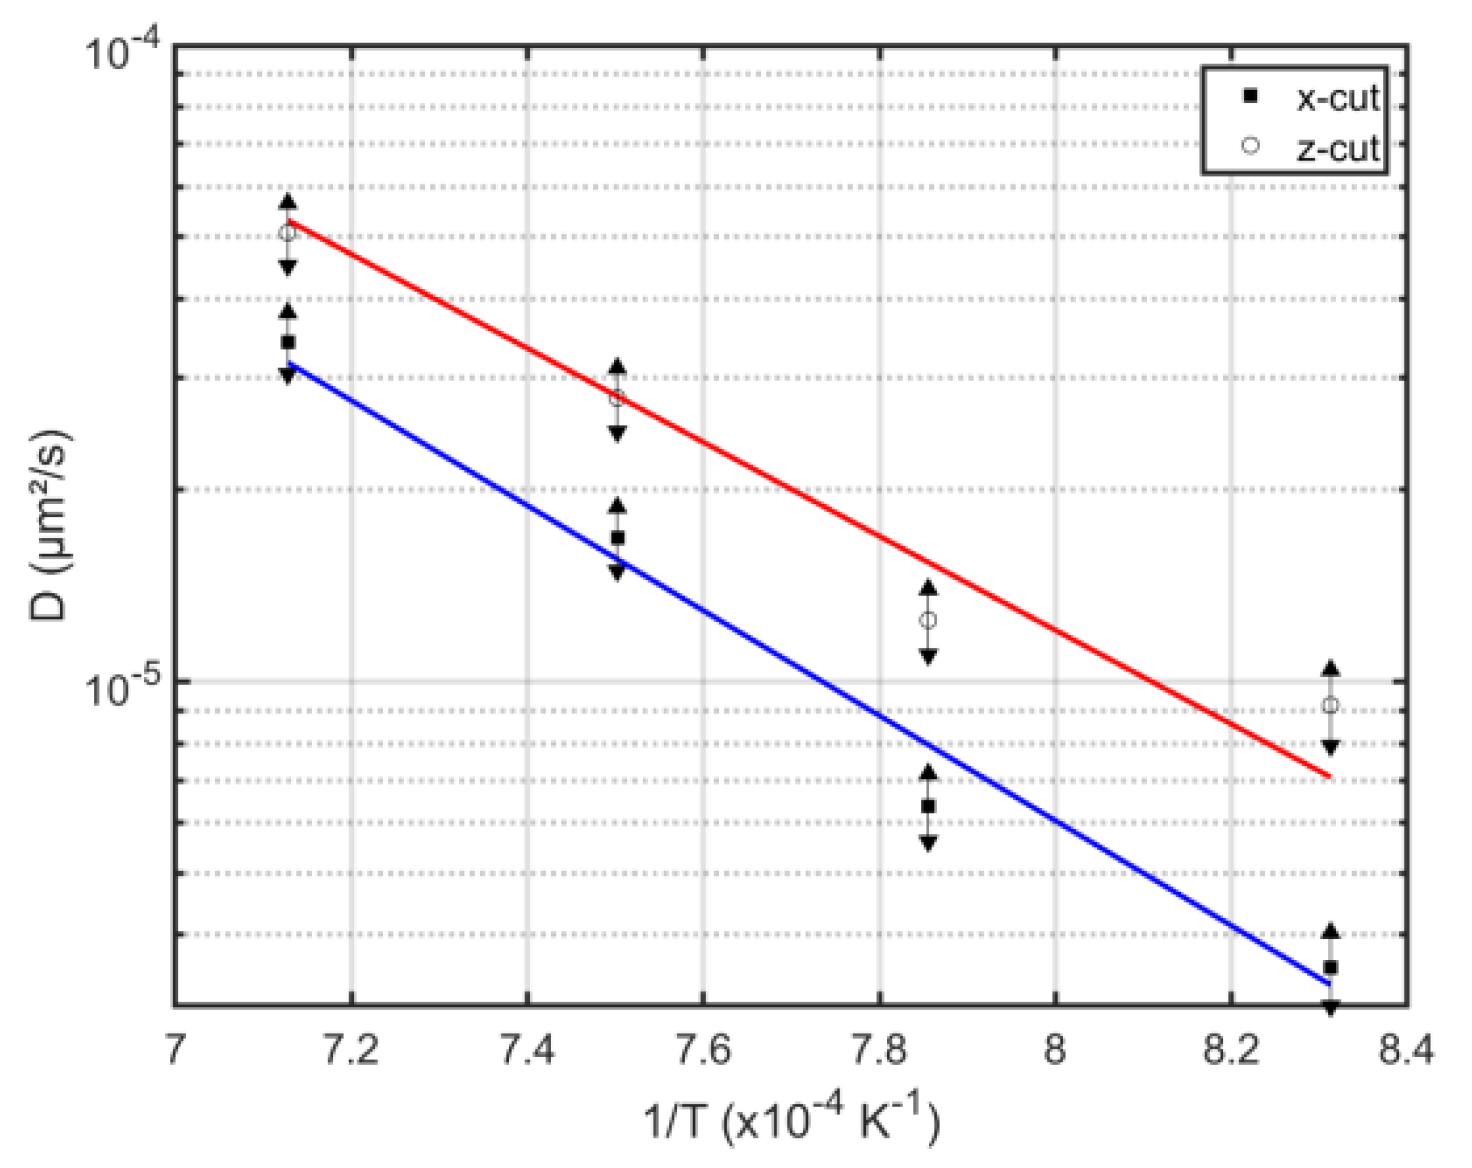
With the values for the diffusion depth, the diffusion coefficients D are calculated. The temperature dependence of the diffusion coefficient is given by Equation (7). Figure 5 shows the corresponding Arrhenius plots for the two crystal-cut directions used. By correlating the fitted lines with Equation (7), the values for the diffusion coefficients and the activation energy for the x- and z-direction were obtained. The results are summarized in Table 2.
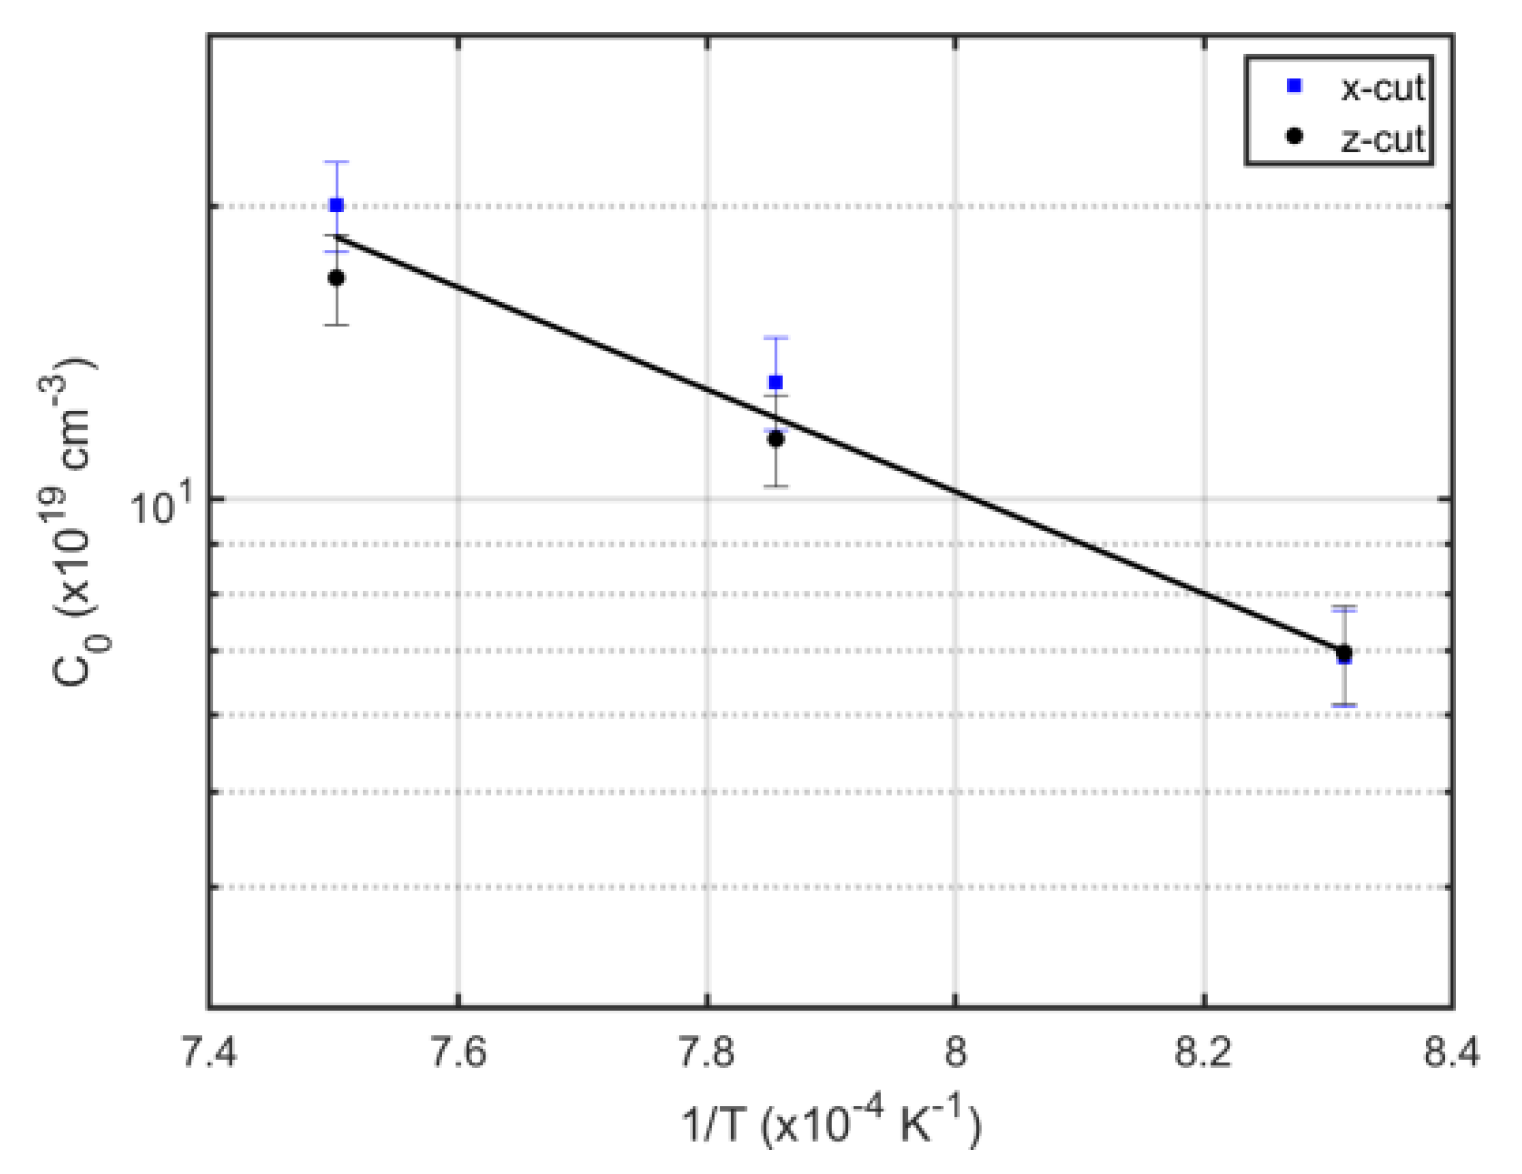
The temperature dependence of the surface concentration is presented in Figure 6. As can be seen, the measured values for the surface concentration of Yb for the three lowest temperatures indicate that, in contrast to the diffusivity, the solubility of Yb in LiNbO3 shows no anisotropic behavior. The solid line is a fit to the data with Equation (8). This way, the values of ∆H = (1.04 ± 0.23) eV and C ^ = (1.6 ± 0.35) × 1024 cm−3 were found.
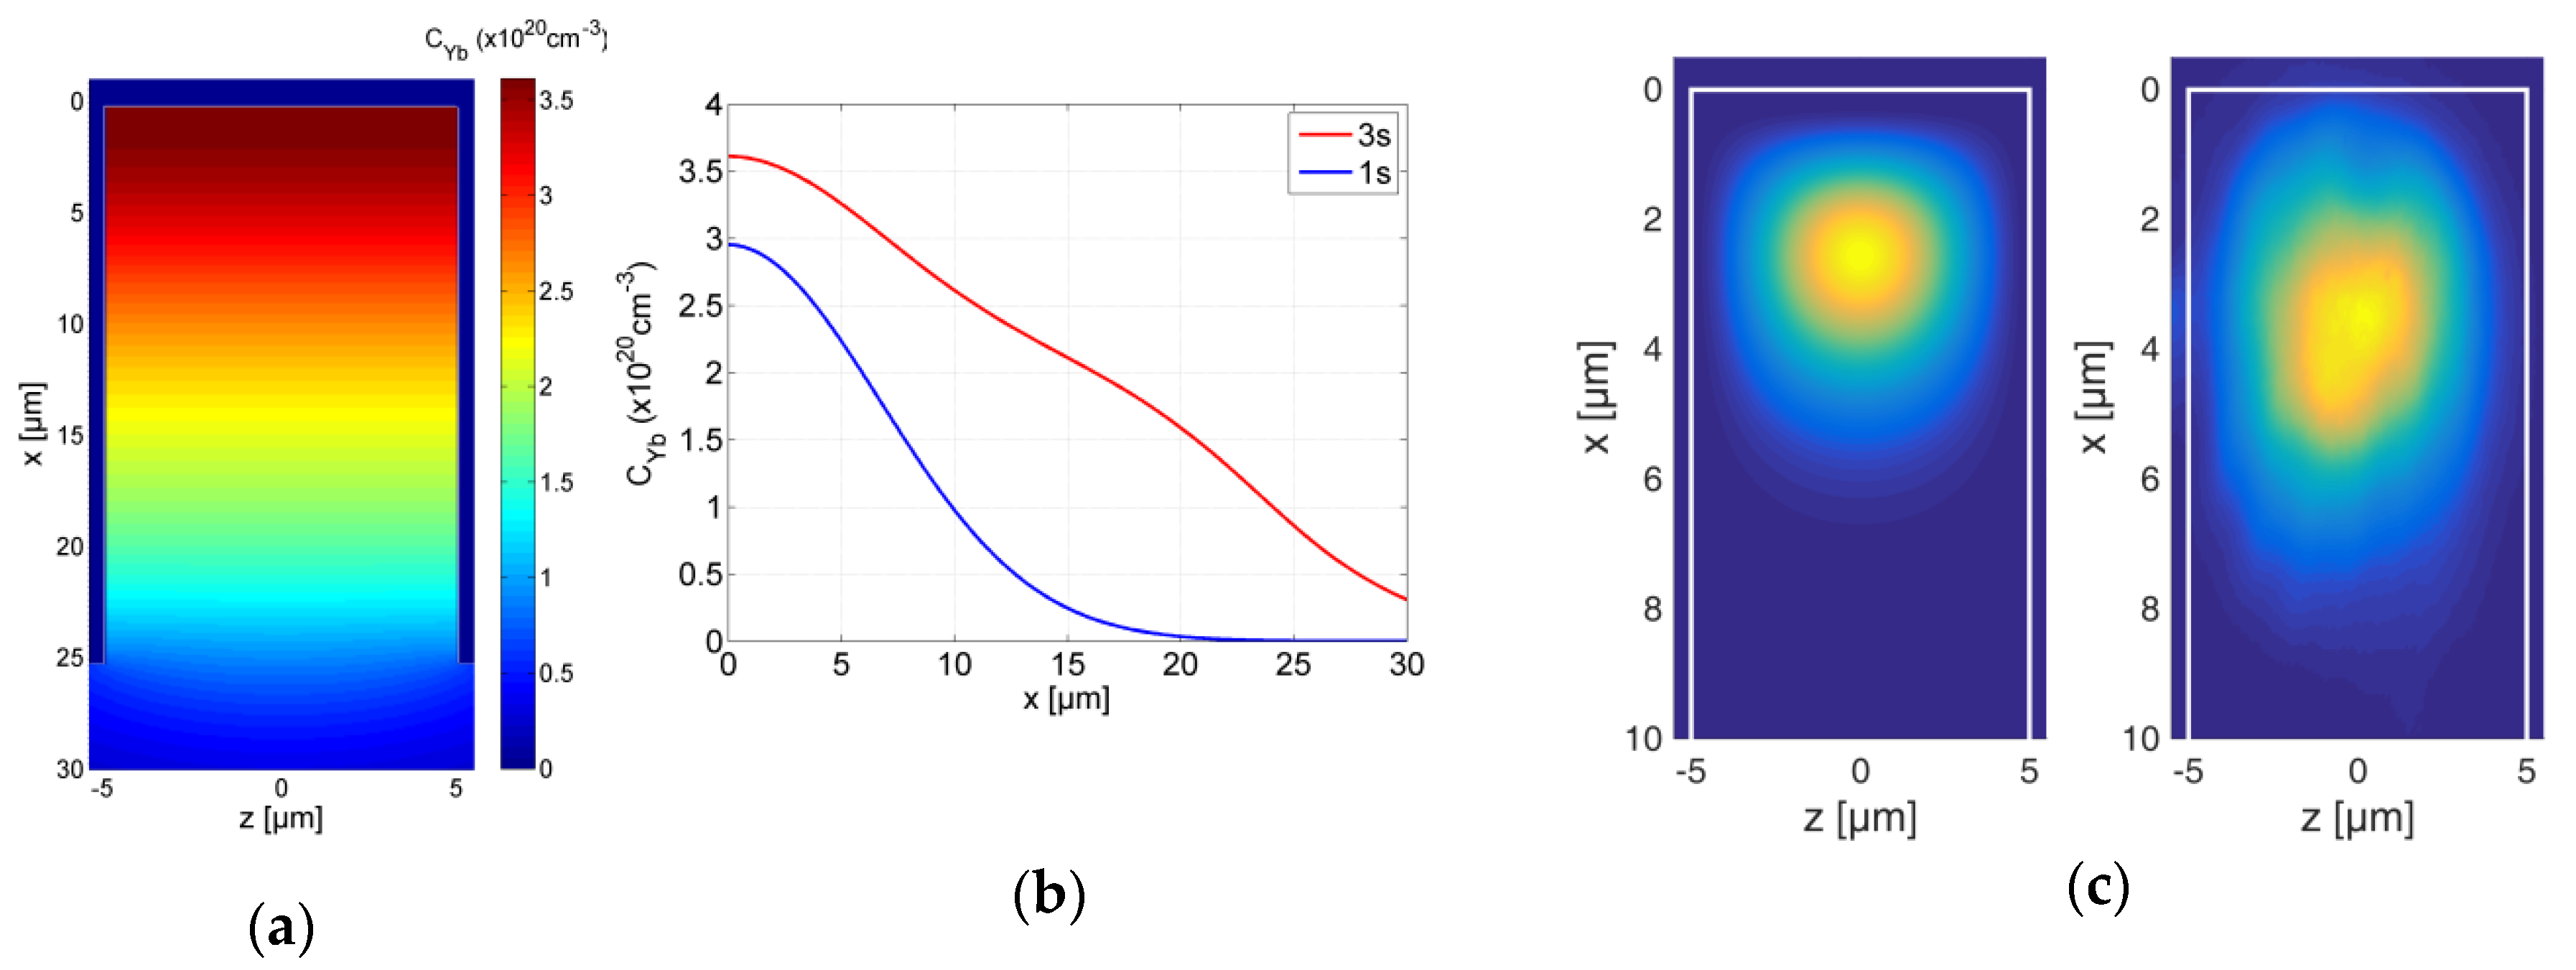
With these characteristic values for the diffusion of Yb in LiNbO3, a first test was performed for diffusion doping of a ridge waveguide prepared in an x-cut LiNbO3 substrate oriented parallel to the y-axis by diamond blade dicing. Figure 7a shows the simulated Yb concentration profile in the ridge for the case of two 22 nm thick Yb layers being coated under ±60° with respect to the x-axis obtained by numerically solving Fick’s second law. For in-diffusion, the sample is annealed for 216 h at 1125 °C. The concentration profile also shows that at the upper right and left corners of the ridge, the expected concentration is below the solubility limit. Thus, no additional surface defects are to be expected. To achieve waveguiding, the upper part of the ridge is additionally doped by in-diffusion of Ti.
Figure 7c shows the expected intensity distribution of the quasi-TE modes at 800 nm and the intensity distribution measured at 796 nm. It is clearly visible that a good overlap between the Yb profile and the intensity distribution of the mode is achieved. The simulated concentration profiles shown in Figure 7a,b prove that ridge waveguides can be almost homogeneously doped by three-side in-diffusion while avoiding any surface damage that might be caused by exceeding the maximum solubility of Yb in LiNbO3.
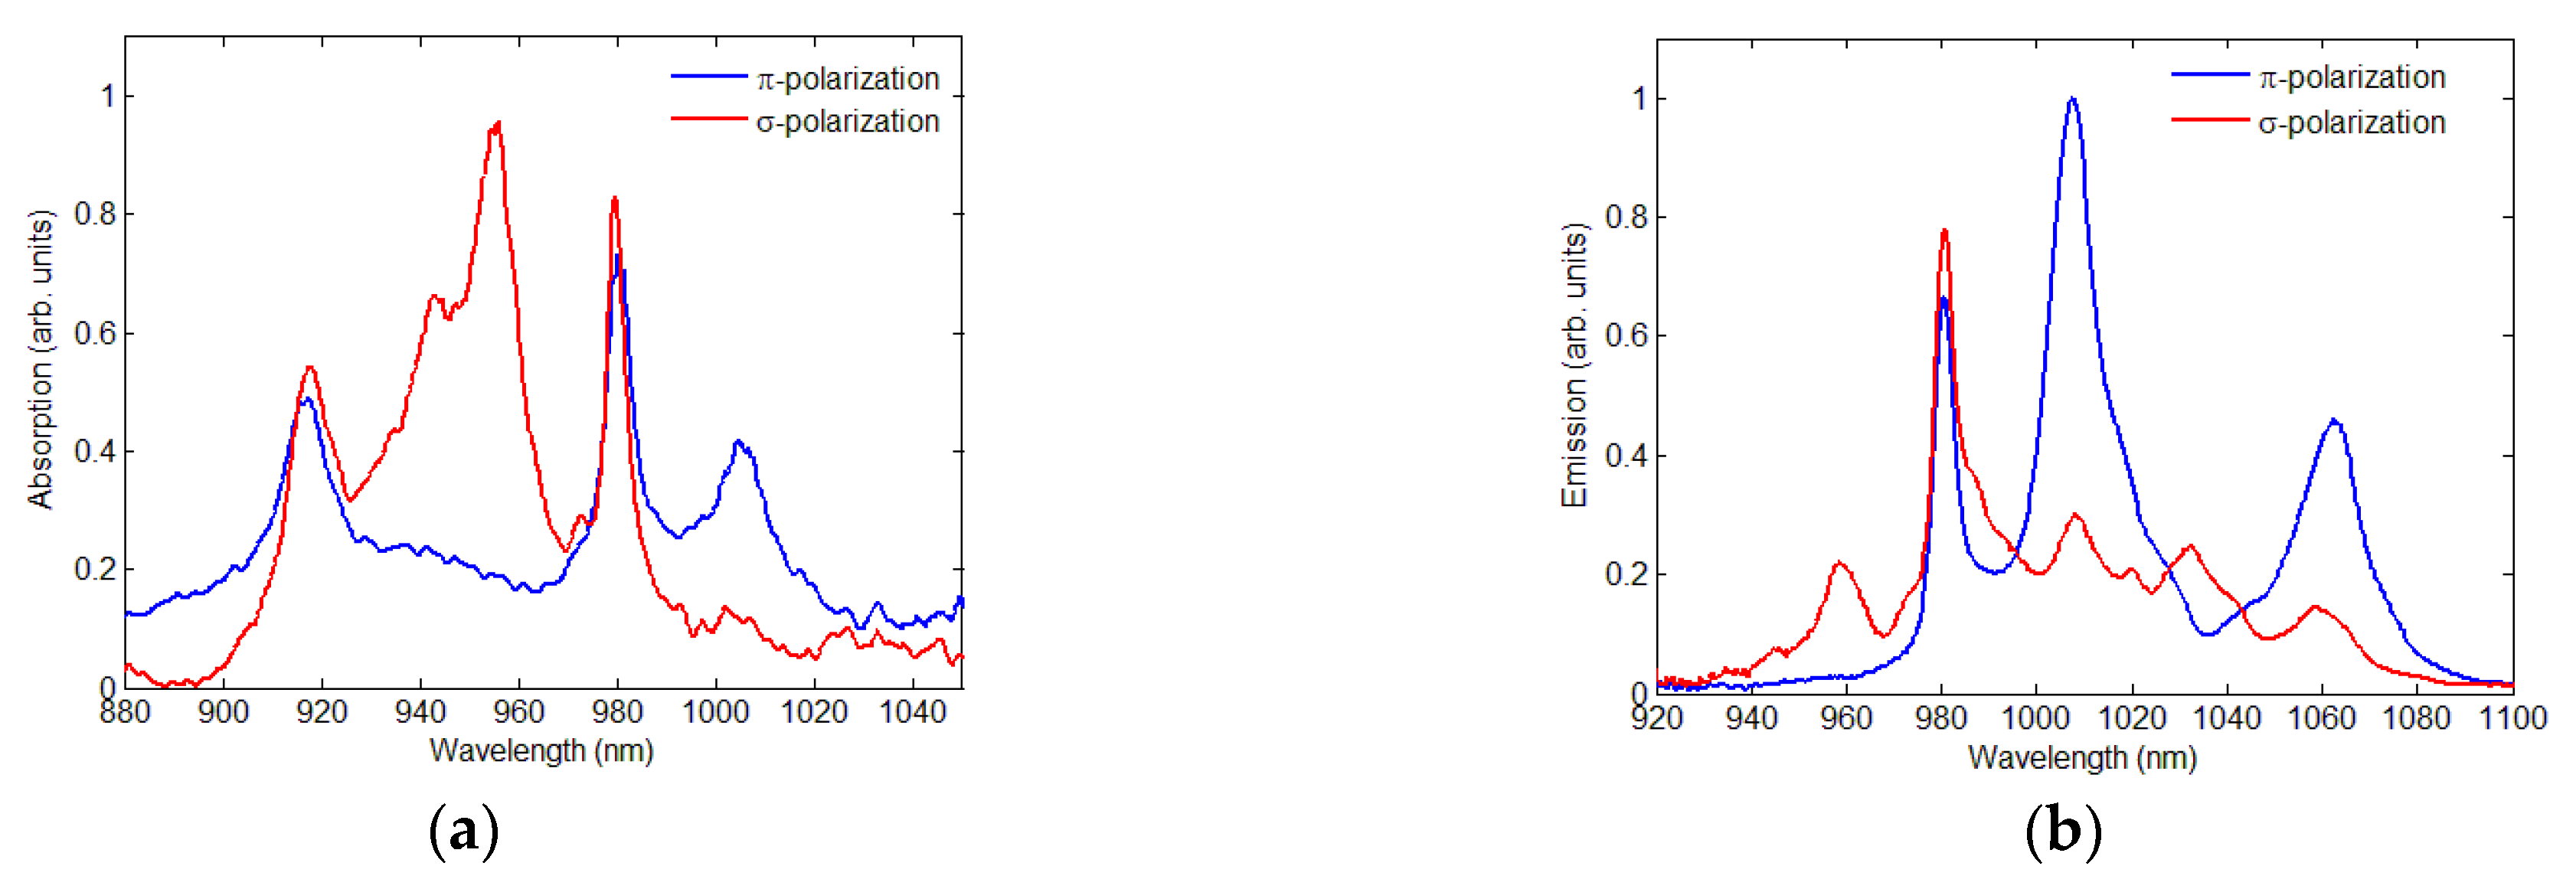
The transmission spectrum of such a 10 µm wide and 2.2 cm long ridge waveguide was measured using unpolarized white light coupled into the waveguide by means of a 40× microscope objective. At the output facet, the transmitted light was collected and coupled into a spectrometer. To measure absorption as a function of polarization, a polarizer was placed in front of the collimator of the spectrometer. The measured absorption spectra (π and σ polarization) show three main peaks at 918, 956, and 980 nm (see Figure 8a), which is in good agreement with the absorption spectra reported for bulk-doped Yb:LiNbO3 [22] and Yb:Ti:LiNbO3 channel waveguides [14]. The losses of the waveguide of 0.8 dB/cm were determined at 1064 nm using the Fabry–Perot method. Fluorescence spectra (π and σ polarization) were measured for pumping with a titanium-sapphire laser at 918 nm. Figure 8b shows the polarized fluorescence spectrum. In agreement with previously reported results for Yb:LiNbO3 waveguides [14,20], we observed the expected four main peaks around 960, 980, 1008, and 1062 nm.

4. Summary

The diffusion of Yb in LiNbO3 can be described by Fick’s law of diffusion. The experimental values determined in this work reveal an anisotropic diffusion coefficient with higher values for the diffusion along the crystallographic c-axis (z-axis). No anisotropy was found for the (maximum) solubility of Yb in LiNbO3. However, the solubility is temperature-dependent. When the diffusion reservoir is not exhausted, small grains of Yb remain on top of the surface, leading to high surface roughness, which has to be strictly avoided when fabricating optical waveguides. Absorption and fluorescence measurements for Yb diffusion-doped ridge waveguides are in good agreement with results published for volume-doped bulk substrates. These results are essential for the future development of efficient Yb-based laser sources in LiNbO3 ridge waveguides.

Author Contributions

Investigation C.E.R., D.B., and S.S.; writing—original draft preparation, C.E.R.; writing—review and editing, D.B., S.S., and D.K.; supervision, D.K.; project administration, D.K.; funding acquisition, D.K. All authors have read and agreed to the published version of the manuscript.

Funding

This research was funded by Deutsche Forschungsgemeinschaft (grant DFG Ki482/17-1).

Conflicts of Interest

The authors declare no conflict of interest.

References

  1. Hu, H.; Ricken, R.; Sohler, W.; Wehrspohn, R.B. Lithium Niobate Ridge Waveguides Fabricated by Wet Etching. IEEE Photon Technol. Lett. 2007, 19, 417–419. [Google Scholar] [CrossRef]
  2. Hu, H.; Ricken, R.; Sohler, W. Low-loss ridge waveguides on lithium niobate fabricated by local diffusion doping with titanium. Appl. Phys. A 2010, 98, 677–679. [Google Scholar] [CrossRef]
  3. Volk, M.F.; Suntsov, S.; Rüter, C.E.; Kip, D. Low loss ridge waveguides in lithium niobate thin films by optical grade diamond blade dicing. Opt. Express 2016, 24, 1386–1391. [Google Scholar] [CrossRef]
  4. Courjal, N.; Guichardaz, B.; Ulliac, G.; Rauch, J.-Y.; Sadani, B.; Lu, H.; Bernal, M.-P. High aspect ratio lithium niobate ridge waveguides fabricated by optical grade dicing. J. Phys. D Appl. Phys. 2011, 44, 305101. [Google Scholar] [CrossRef]
  5. Gerthoffer, A.; Guyot, C.; Qiu, W.; Ndao, A.; Bernal, M.-P.; Courjal, N. Strong reduction of propagation losses in LiNbO3 ridge waveguides. Opt. Mater. 2014, 38, 37–41. [Google Scholar] [CrossRef]
  6. Cai, L.; Wang, Y.; Hu, H. Low-loss waveguides in a single-crystal lithium niobate thin film. Opt. Lett. 2015, 40, 3013–3016. [Google Scholar] [CrossRef] [PubMed]
  7. Becker, C.; Oesselke, T.; Pandavenes, J.; Ricken, R.; Rochhausen, K.; Schreiber, G.; Sohler, W.; Suche, H.; Wessel, R.; Balsamo, S.; et al. Advanced Ti:Er:LiNbO3 waveguide lasers. IEEE J. Sel. Top. Quantum Electron. 2000, 6, 101–113. [Google Scholar] [CrossRef]
  8. Lallier, E.; Pocholle, J.; Papuchon, M.; Grezes-Besset, C.; Pelletier, E.; De Micheli, M.; Li, M.; He, Q.; Ostrowsky, D. Laser oscillation of single-mode channel waveguide in Nd:MgO:LiNbO3. Electron. Lett. 1989, 25, 1491. [Google Scholar] [CrossRef]
  9. De Micheli, M.; Lallier, E.; Grezes-Besset, C.; Pelletier, E.; Pocholle, J.P.; Li, M.J.; He, Q.; Papuchon, M.; Ostrowsky, D.B. Nd:MgO:LiNbO3 waveguide laser and amplifier. Opt. Lett. 1990, 15, 682–684. [Google Scholar] [CrossRef]
  10. Di Paolo, R.E.; Cantelar, E.; Pernas, P.; Pedrola, G.L.; Cussó, F. Continuous wave waveguide laser at room temperature in Nd[sup 3+]-doped Zn:LiNbO[sub 3]. Appl. Phys. Lett. 2001, 79, 4088–4090. [Google Scholar] [CrossRef] [Green Version]
  11. Siebenmorgen, J.; Calmano, T.; Petermann, K.; Huber, G.; Huber, G. Highly efficient Yb:YAG channel waveguide laser written with a femtosecond-laser. Opt. Express 2010, 18, 16035–16041. [Google Scholar] [CrossRef] [PubMed]
  12. Okhotnikov, O.G.; Gomes, L.; Xiang, N.; Jouhti, T.; Grudinin, A.B. Mode-locked ytterbium fiber laser tunable in the 980-1070-nm spectral range. Opt. Lett. 2003, 28, 1522–1524. [Google Scholar] [CrossRef]
  13. Malinowski, A.; Piper, A.; Price, J.H.V.; Furusawa, K.; Jeong, Y.; Nilsson, J.; Richardson, D. Ultrashort-pulse Yb3+-fiber-based laser and amplifier system producing >25-W average power. Opt. Lett. 2004, 29, 2073–2075. [Google Scholar] [CrossRef] [PubMed]
  14. Jones, J.K.; De Sandro, J.P.; Hempstead, M.; Shepherd, D.P.; Large, A.C.; Tropper, A.C.; Wilkinson, J. Channel waveguide laser at 1 µm in Yb-indiffused LiNbO3. Opt. Lett. 1995, 20, 1477–1479. [Google Scholar] [CrossRef] [PubMed]
  15. Fujimura, M.; Tsuchimoto, H.; Suhara, T. Yb:LiNbO3 Annealed/Proton-Exchanged Waveguide Lasers Pumped by InGaAs Laser Diode at 980 nm Wavelength. Jpn. J. Appl. Phys. 2007, 46, 5447–5449. [Google Scholar] [CrossRef]
  16. Pal, S.; Das, B.K.; Sohler, W. Photorefractive damage resistance in Ti:PPLN waveguides with ridge geometry. Appl. Phys. A 2015, 120, 737–749. [Google Scholar] [CrossRef]
  17. Suntsov, S.; Rüter, C.E.; Kip, D. Er:Ti:LiNbO3 ridge waveguide optical amplifiers by optical grade dicing and three-side Er and Ti in-diffusion. Appl. Phys. B Laser Opt. 2017, 123, 118. [Google Scholar] [CrossRef]
  18. Kip, D.; Brüske, D.; Suntsov, S.; Rüter, C.E. Efficient ridge waveguide amplifiers and lasers in Er-doped lithium niobate by optical grade dicing and three-side Er and Ti in-diffusion. Opt. Express 2017, 25, 29374. [Google Scholar]
  19. Brüske, D.; Suntsov, S.; Rüter, C.E.; Kip, D. Efficient Nd:Ti:LiNbO3 ridge waveguide lasers emitting around 1085 nm. Opt. Express 2019, 27, 8884–8889. [Google Scholar] [CrossRef]
  20. Fujimura, M.; Tsuchimoto, H.; Suhara, T. Yb-diffused LiNbO/sub 3/ annealed/proton-exchanged waveguide lasers. IEEE Photon Technol. Lett. 2004, 17, 130–132. [Google Scholar] [CrossRef]
  21. Amin, J.; Aust, J.; Veasey, D.; Sanford, N. Dual wavelength, 980 nm-pumped, Er/Yb-codoped waveguide laser in Ti:LiNbO3. Electron. Lett. 1998, 34, 456. [Google Scholar] [CrossRef]
  22. Burns, G.; O’Kane, D.F.; Title, R.S. Optical and Electron-Spin-Resonance Spectra ofYb3+,Nd3+, andCr3+in LiNbO3 and LiTaO3. Phys. Rev. 1968, 167, 314–319. [Google Scholar] [CrossRef]
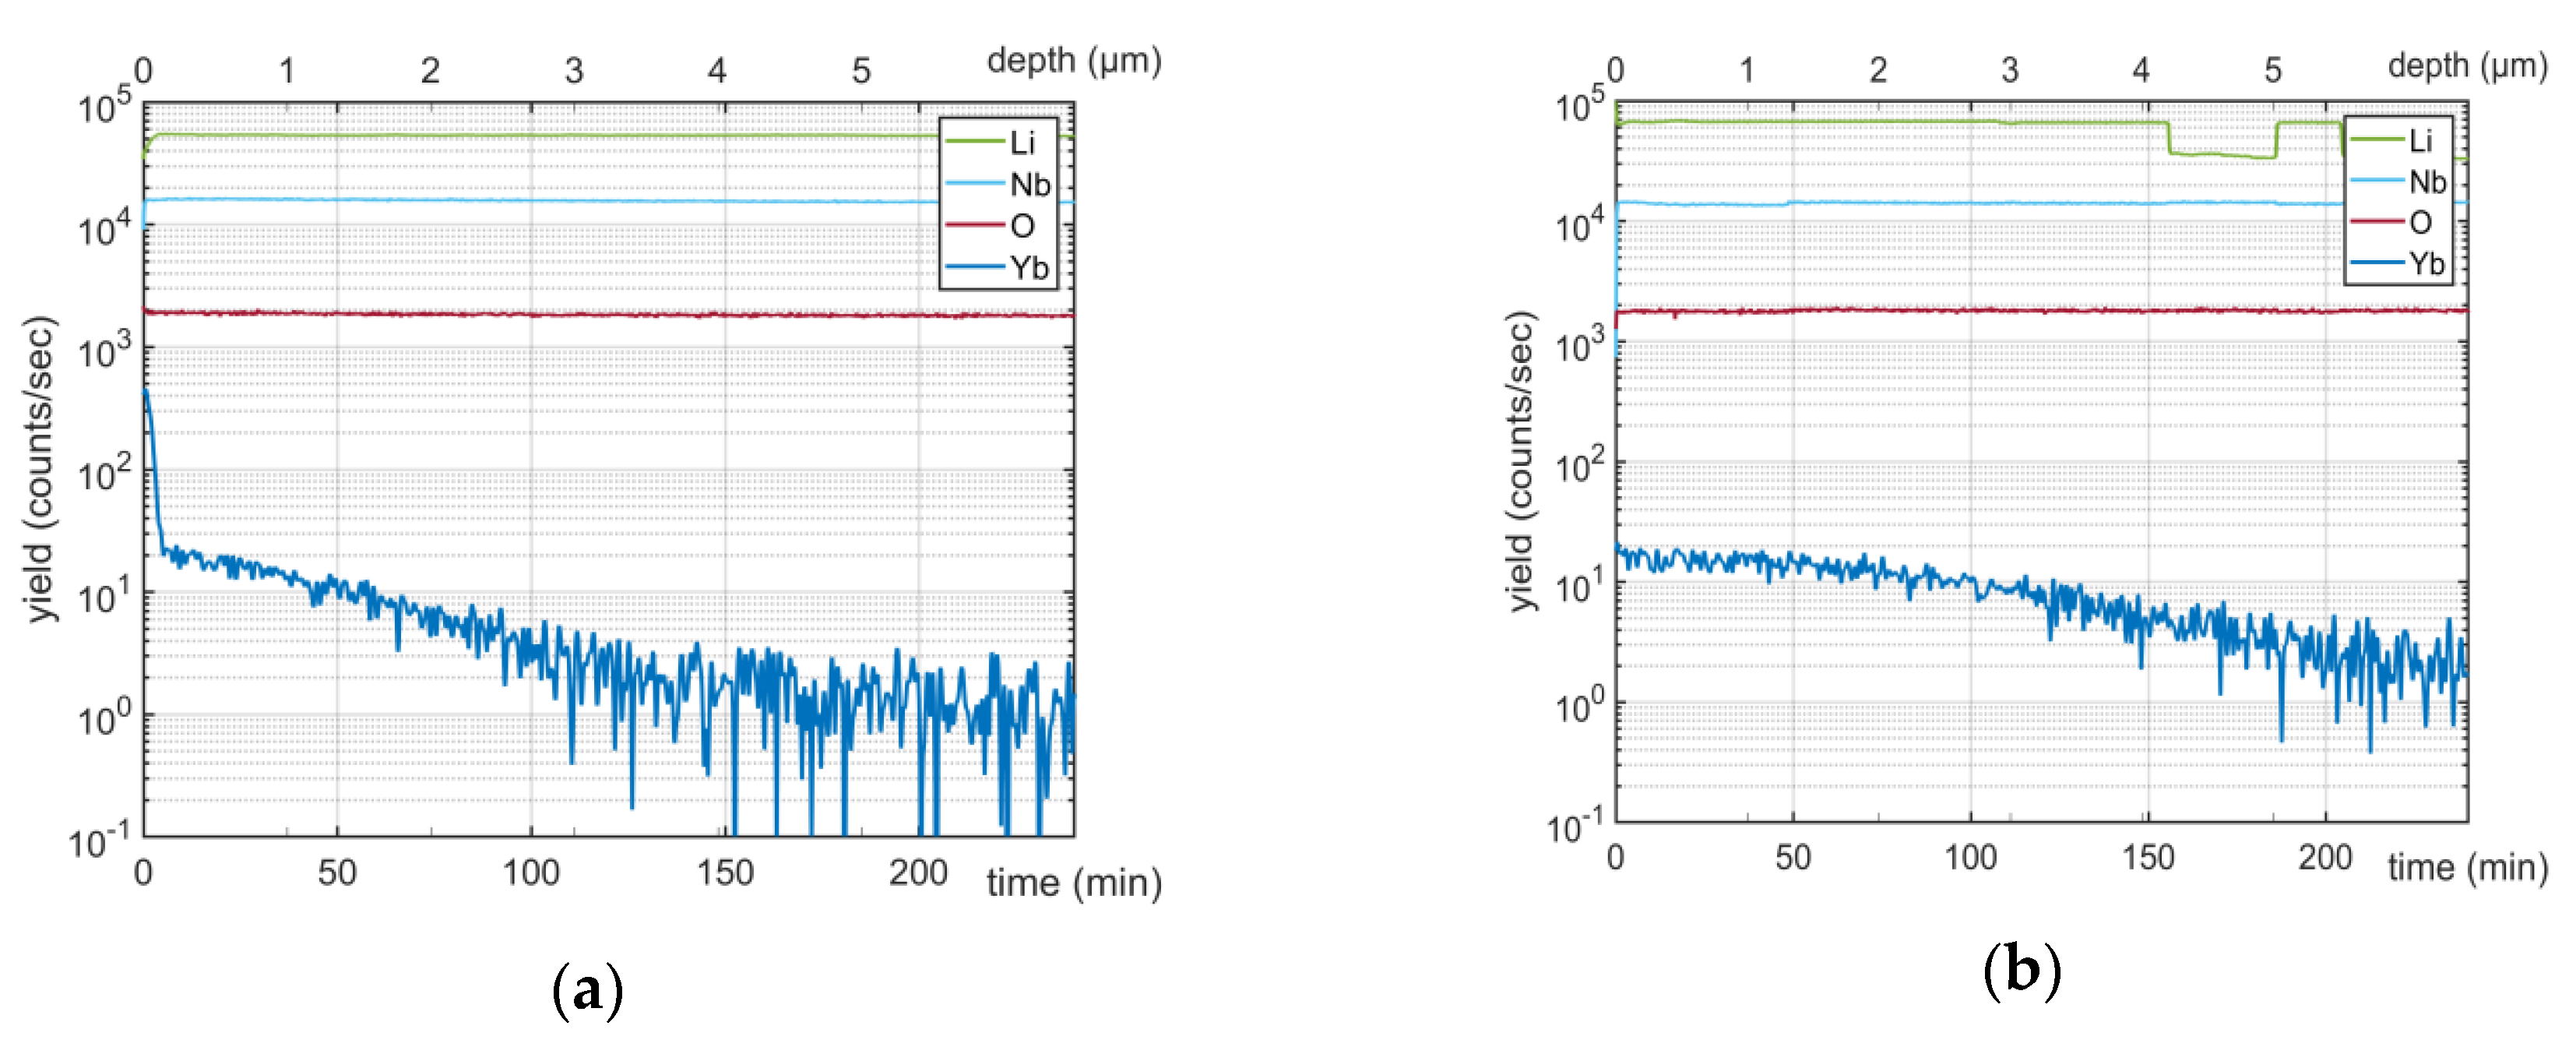
Figure 1. Secondary neutral mass spectrometry (SNMS) spectra of x-cut Yb:LiNbO3. The two samples were coated with 20 nm Yb, and the diffusion parameters are (a) T = 1060 °C, t = 30 h and (b) T = 1130 °C, t = 30 h, respectively.
Applsci 10 02189 g001
Figure 2. Confocal microscope images of LiNbO3 surfaces coated with 20 nm thick Yb films after annealing for 30 h. Results for x-cut surfaces annealed at (a) 1000, (b) 1060, and (c) 1130 °C; results for z-cut surfaces annealed at (d) 1000, (e) 1060, and (f) 1130 °C.
Applsci 10 02189 g002
Figure 3. SNMS depth profiles of Yb in LiNbO3 for in-diffused layers with an initial thickness of 20 nm annealed for 30h at different temperatures for (a) x-cut and (b) z-cut substrates. The dotted lines show the measured profiles and the solid lines indicate complementary error function fits.
Applsci 10 02189 g003
Figure 4. SNMS depth profiles of Yb in LiNbO3 for in-diffused layers with an initial thickness of 20 nm annealed for 30 h at 1130 °C for different cut directions.
Applsci 10 02189 g004
Figure 5. Arrhenius plot of the diffusion coefficients of Yb in LiNbO3 for diffusion parallel to the x- and z-axis. The fitted lines correspond to Equation (7).
Applsci 10 02189 g005
Figure 6. Arrhenius plot of the solubility data of Yb in LiNbO3. The line is a fit of the data using Equation (8).
Applsci 10 02189 g006
Figure 7. (a) Simulated Yb profile in LiNbO3 for the in-diffusion of two 22 nm thick layers evaporated under ±60° and in-diffused for 216 h at 1125 °C. (b) The Yb profile in x-direction in the middle of the ridge (red line). The results for a plane layer of Yb diffused in from the surface only are included as a blue line. (c) Simulated (left) and measured (right) intensity distribution for the fundamental mode at 980 nm for a 10 µm-wide ridge-waveguide formed by three-side Ti in-diffusion.
Applsci 10 02189 g007
Figure 8. Polarization-dependent absorption (a) and fluorescence (b) spectrum of a 10 µm wide and 2.2 cm long Yb:Ti:LiNbO3 ridge waveguide.
Applsci 10 02189 g008
Table 1. Parameters obtained for the Yb diffusion in LiNbO3.
Temperature (°C)Time (h)C0 × 1019 (ions/cm3)Cmax × 1019 (ions/cm3)derf (µm)dexp (µm)
z-cut
930 306.96 ± 0.10 1.99 ± 0.13
10003011.53 ± 0.09 2.32 ± 0.14
10603016.89 ± 0.10 3.47 ± 0.19
113030 10.94 ± 0.05 4.68 ± 0.26
x-cut
930306.89 ± 0.10 1.24 ± 0.08
10003013.21 ± 0.12 1.66 ± 0.10
10603020.06 ± 0.12 2.70 ± 0.15
113030 13.62 ± 0.06 3.84 ± 0.21
Table 2. Diffusion constants and activation energies for Yb diffusion in LiNbO3.
D0 ( × 10-8 cm²/s)EA (eV)
Diffusion in z-direction9.7 ± 0.81.46 ± 0.07
Diffusion in x-direction24.1 ± 1.91.64 ± 0.07