Abstract
The effect of sintering atmosphere (O2, air, N2, N2-5% H2, and H2) on the densification, grain growth, and structure of KNbO3 was studied. KNbO3 powder was prepared by solid state reaction, and samples were sintered at 1040 °C for 1–10 h. The sample microstructure was studied using Scanning Electron Microscopy (SEM). The sample structure was studied using X-Ray Diffraction (XRD). H2-sintered samples showed reduced density, whereas other sintering atmospheres did not affect density much. Samples sintered in N2-5% H2 showed abnormal grain growth, whereas sintering in other atmospheres caused stagnant (O2, air, N2) or pseudo-normal (H2) grain growth behavior. Samples sintered in reducing atmospheres showed decreased orthorhombic unit cell distortion. The grain growth behavior was explained by the mixed control theory. An increase in vacancy concentration caused by sintering in reducing atmospheres led to a decrease in the step free energy and the critical driving force for appreciable grain growth. This caused grain growth behavior to change from stagnant to abnormal and eventually pseudo-normal.
1. Introduction
KNbO3 is a ferroelectric perovskite material and is one of the end members of the KNbO3-NaNbO3 pseudo-binary system [1,2]. It has an orthorhombic Amm2 unit cell at room temperature, with phase transitions to a tetragonal P4mm and a cubic phase at ~225 and ~435 °C, respectively [3,4,5,6]. KNbO3 has many potential applications including electro-optic modulators and frequency convertors [7,8], photocatalysts [9,10], photovoltaic materials [10,11,12], phosphor hosts [13,14,15], and in biomedical applications [16,17,18,19]. KNbO3 has also been studied as a potential lead-free piezoelectric material for the replacement of Pb(Zr,Ti)O3 [12,20,21,22,23,24,25,26,27,28,29,30,31], although it has received less attention than its cousin (K0.5Na0.5)NbO3 due to its inferior piezoelectric properties [32]. KNbO3 shares the same challenges in processing (hygroscopic starting materials, difficulty in sintering to high density, the formation of water-soluble second phases, abnormal grain growth) as (K0.5Na0.5)NbO3 [21,25,26,30,33,34,35]. However, it has the advantages of a lower sintering temperature (1040 °C vs. 1100 °C) and less tendency towards abnormal grain growth. It also has unusually good shear mode piezoelectric properties (k15 = 0.55, d15 = 207 pC/N), making it a candidate for actuators and high-power applications [31]. An advantage of (K0.5Na0.5)NbO3 over Pb(Zr,Ti)O3 is its stability during sintering in reducing atmospheres [36,37,38]. This allows the possibility of co-firing with lower cost base-metal electrodes [39,40,41,42]. Sintering in an inert atmosphere also reduces the nonlinear behavior of (K0.5Na0.5)NbO3-based materials through the formation of oxygen vacancies that pin the domain walls [43]. It is known that the use of reducing sintering atmospheres can change the densification behavior, grain growth behavior, and also the structure of (K0.5Na0.5)NbO3 [44,45,46,47], but the behavior of KNbO3 during sintering in reducing atmospheres has not previously been studied. The effect of different reducing atmospheres on the densification, grain growth behavior, and structure of KNbO3 is examined in this work.
2. Materials and Methods
KNbO3 powder was prepared via solid state reaction. K2CO3 (>99.5%) and Nb2O5 (>99.9%) (Daejung Chemicals) were dried (250 °C, 5 h) to eliminate adsorbed moisture. Stoichiometric amounts were weighed and ball milled for 24 h using high-purity ethanol (99.9%) and ZrO2 balls in a polypropylene jar. After milling, the slurry was heated on a hotplate/magnetic stirrer to evaporate the ethanol, followed by drying in an oven at 80 °C. After drying, the slurry was ground and passed through a 180 μm sieve to remove agglomerates, followed by calcination at 850 °C for 5 h in flowing O2 (flow rate 100 cc.min−1) in a covered alumina crucible. The calcined powder was examined by X-Ray Diffraction (XRD, X’Pert PRO, PANalytical, Almelo, the Netherlands) using CuKα radiation with 2θ = 20–90°, a scan speed of 3°.min−1, and a step size of 0.02°. The calcined powder was ball-milled again to reduce particle size.
Powder was hand pressed into pellets using a 6 mm die, then cold isostatically pressed at 147 MPa. Pressed pellets were buried in KNbO3 packing powder in a covered alumina crucible and sintered in atmospheres of O2, air, N2, N2-5 vol % H2, and H2 (flow rate 50 cc.min−1) at 1040 °C for 1–10 h. Heating and cooling rates were 5 °C.min−1. The sintered sample density was measured by the Archimedes method. Samples were vertically sectioned, polished with diamond suspension (1 μm finish), and thermally etched at 990 °C for 1 h in the same atmosphere in which they were sintered. The microstructure of Pt-coated samples was examined by Scanning Electron Microscopy (SEM, Hitachi S-4700 FE-SEM, Hitachi High-Tech, Tokyo, Japan) with an attached Energy Dispersive Spectrometer (EDS, EMAX Energy EX-200, Horiba, Kyoto, Japan) using standardless quantification. Mean matrix grain size and grain size distributions were analyzed using Image J v1.46 (National Institute of Mental Health, Bethesda, MD). Samples sintered at 1040 °C for 5 h were examined using XRD as before. Differential Thermal Analysis (DTA, DTG-60, Shimadzu, Kyoto, Japan) was carried out on samples sintered at 1040 °C for 3 h. Analysis was carried out in the temperature range 50–450 °C in N2 with heating and cooling rates of 10 °C.min−1.
3. Results
The as-calcined KNbO3 powder’s XRD pattern is shown in Figure 1. The pattern was indexed with ICDD Card # 71-0946 for orthorhombic KNbO3 (space group Amm2). No secondary phase peaks were visible. The Archimedes density values of the KNbO3 samples sintered at 1040 °C for 1–10 h in different atmospheres are shown in Figure 2. All of the samples had densities between 95 and 98% theoretical density except for samples sintered in H2, which had densities between 89 and 92% (theoretical density of KNbO3 = 4.624 g.cm−3 [48]). Apart from H2, the sintering atmosphere did not have much effect on density. Sintering time also did not affect density.
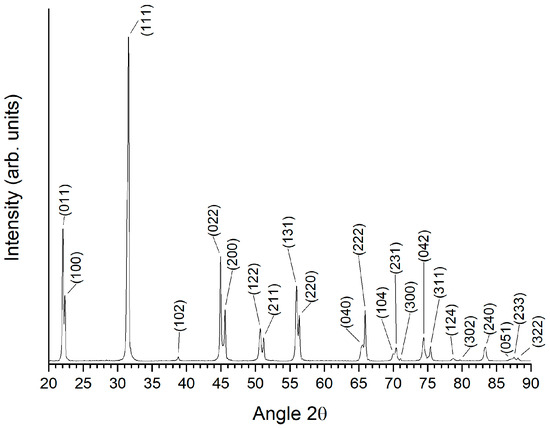
Figure 1.
XRD pattern of calcined KNbO3 powder.
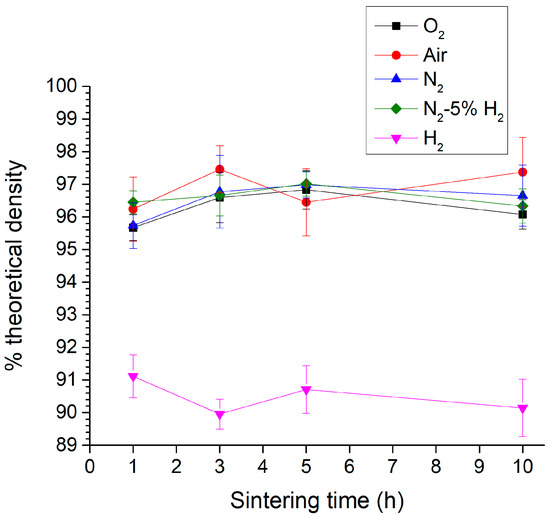
Figure 2.
Archimedes density of KNbO3 samples sintered at 1040 °C for 1–10 h in different atmospheres.
SEM micrographs of KNbO3 samples sintered at 1040 °C for 3 h in different atmospheres are shown in Figure 3. The O2-sintered sample contained cube-shaped equiaxed grains 1–2 μm in diameter. The tiny particles on the surface of the grains are an artefact caused by the Pt coating. The air- and N2-sintered samples appeared similar, with slightly smaller grains. The N2-5%H2-sintered sample showed very different behavior. Many abnormal grains up to 30 μm in diameter were present. A few micron-sized grains were still visible in spaces between the abnormal grains. The abnormal grains contained many entrapped pores. In the H2-sintered sample, the grains were again micron-sized. The samples sintered for other sintering times showed similar behavior.
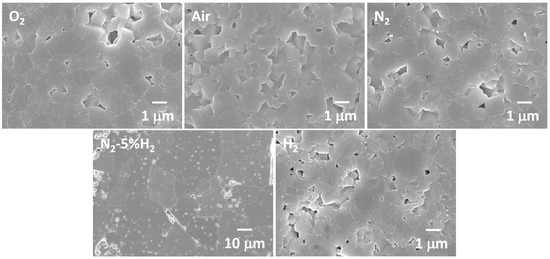
Figure 3.
SEM micrographs of KNbO3 samples sintered at 1040 °C for 3 h in different atmospheres.
Figure 4 shows SEM micrographs taken from the edges of samples sintered at 1040 °C for 10 h. Abnormal grains were present at the edges of the O2-, air-, and N2-sintered samples. The degree of abnormal grain growth at the edges of the samples increased with sintering time. Samples sintered in N2-5%H2 showed the opposite behavior, with less abnormal grain growth taking place at the edges of the sample than in the bulk. The sample sintered in H2 contained large plate-like grains of a secondary phase at the edges. EDS analysis of these grains (mean and standard deviation of four point analyses) is shown in Table 1. The matrix grains appeared to be potassium-deficient. This may be due to potassium evaporation or to the difficulty in measuring alkali elements by EDS [49]. The K/Nb ratio of the secondary phase was much smaller than that of the matrix grains and was quite close to that of K4Nb6O17. Apart from this secondary phase, no abnormal grains were present at the edges of the sample sintered in H2. It is worth noting that the samples sintered in H2 were more fragile than the other samples.
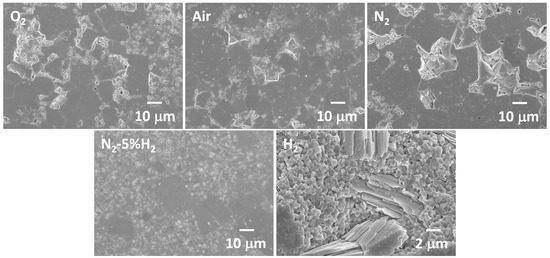
Figure 4.
SEM micrographs of the edges of KNbO3 samples sintered at 1040 °C for 10 h in different atmospheres.

Table 1.
EDS analysis of matrix grains and secondary phase in a KNbO3 sample sintered at 1040 °C for 10 h in H2.
The mean grain radius of KNbO3 samples sintered at 1040 °C for 1–10 h in different atmospheres is shown in Figure 5. Error bars represent the standard deviation. At least 200 grains were measured per sample sintered in O2, air, N2, and H2. For samples sintered in N2-5% H2, between 120 and 180 grains were measured per sample. Only grains from the bulk of the samples sintered in O2, air, and N2 were measured, i.e., abnormal grains found at the edges of these samples were not included. O2-, air-, and N2-sintered samples had similar values of mean grain radius, between 0.4 and 0.6 μm. The samples sintered in N2-5%H2 had a much larger mean grain radius between 6 and 8 μm, as well as wider error bars. The mean radius of H2-sintered samples was smaller than that of the other samples at ~0.35 μm. Sintering time did not have much effect on the mean grain radius of any of the samples.
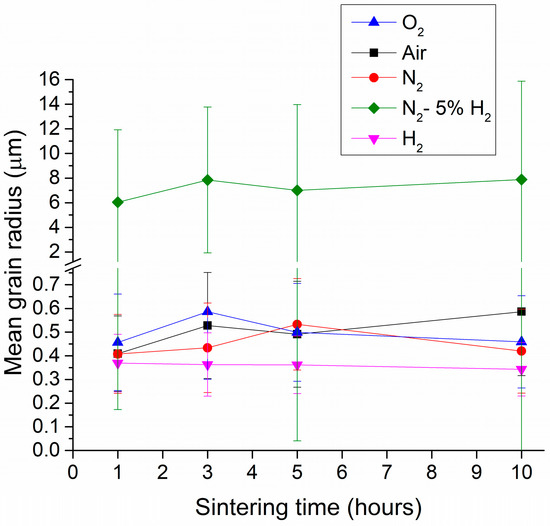
Figure 5.
Mean grain radius of KNbO3 samples sintered at 1040 °C for 1–10 h in different atmospheres.
Grain size distributions of KNbO3 samples sintered at 1040 °C for 1 h in different atmospheres are given in Figure 6. Dashed black lines indicate the radius value that was three times the mean radius. Grains larger than this value were classified as abnormal grains [50]. Samples sintered in O2, air and N2 showed narrow unimodal distributions. O2- and air-sintered samples did not have any abnormal grains. A small fraction of abnormal grains appeared in the sample sintered in N2. The sample sintered in N2-5% H2 showed a very broad size distribution with many abnormal grains. The grains were also much larger than in the previous samples. For the H2-sintered sample, the grain size distribution became narrow and unimodal again with no abnormal grains. The grain size distributions at increased sintering times did not change much. SEM micrographs of KNbO3 powder samples annealed for 1 h at 1040 °C in O2 and H2 are shown in Figure 7. The powder particles were of a cubic morphology with faceted faces and sharp edges and corners. The H2-annealed sample had rounder edges and corners than the O2-annealed sample.
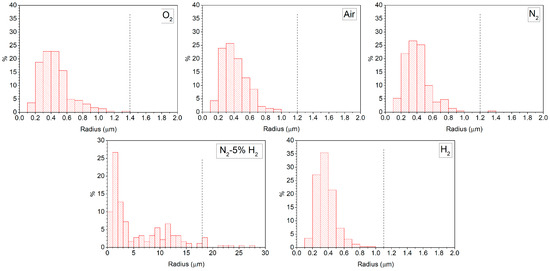
Figure 6.
Grain size distributions of KNbO3 samples sintered at 1040 °C for 1 h in different atmospheres.
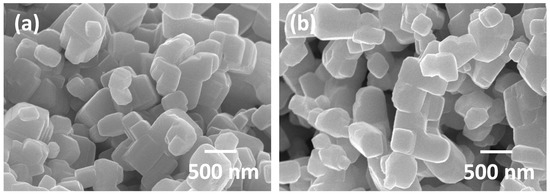
Figure 7.
SEM micrographs of KNbO3 powder annealed at 1040 °C for 1 h in (a) O2 and (b) H2.
Figure 8a shows the XRD patterns of KNbO3 samples sintered at 1040 °C for 5 h in different atmospheres. All patterns were indexed using ICDD Card # 71-0946 for orthorhombic KNbO3 (space group Amm2). No secondary phase peaks were visible in O2-, air-, N2-, and N2-5% H2-sintered samples. The H2-sintered sample contained Nb12O29, K4Nb6O17, and NbO2 secondary phases (Figure 8b). The (011)/(100) peak splitting at 22–23°, the (002)/(020)/(111) peak splitting at 31–32°, and the (022)/(200) peak splitting at 44–46° progressively diminished in reducing sintering atmospheres. Unit cell parameters were refined via the least-squares method (MDI Jade 6.5, Materials Data Inc., Livermore, CA). Results are shown in Figure 9. In progressively reducing sintering atmospheres, the a unit cell parameter tended to increase, whereas the b and c unit cell parameters decreased. The difference in value between the b and c unit cell parameters decreased noticeably for the H2-sintered sample.
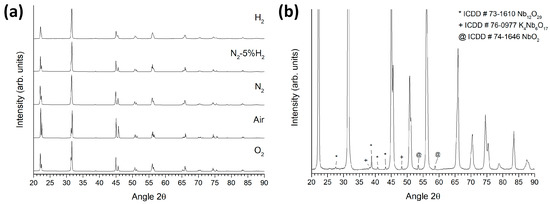
Figure 8.
(a) XRD patterns of KNbO3 samples sintered at 1040 °C for 5 h in different atmospheres; (b) magnified pattern of the H2-sintered sample.
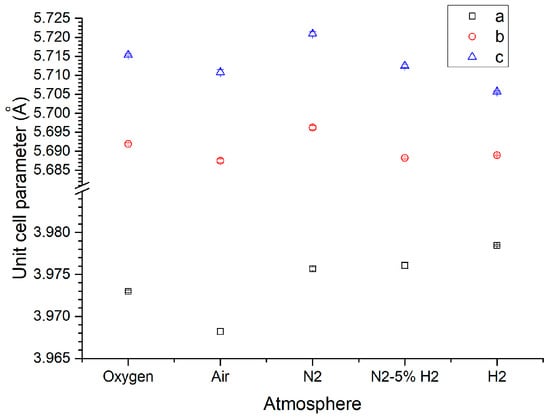
Figure 9.
Unit cell parameters of KNbO3 samples sintered at 1040 °C for 5 h in different atmospheres.
Figure 10 shows DTA traces of KNbO3 samples sintered at 1040 °C for 3 h in different atmospheres. Endothermic peaks corresponding to transitions from orthorhombic to tetragonal phases and from tetragonal to cubic phases can be seen in the ascending traces (Figure 10a) [45,51]. The peak temperatures initially increased slightly as the sintering atmosphere changed from O2 to air and then progressively decreased in reducing sintering atmospheres. An orthorhombic-tetragonal phase transition peak could not be seen in the H2-sintered sample. Exothermic peaks corresponding to the transition from cubic to tetragonal phases could be seen in the descending traces (Figure 10b). Peak temperature decreased for the samples sintered in N2-5% H2 and H2 atmospheres. Peaks corresponding to the tetragonal-orthorhombic phase transition were not visible. Peak temperatures are given in Table 2. Cubic-tetragonal phase transition temperatures on cooling were lower than those of the tetragonal-cubic phase transitions on heating. This hysteresis indicated that the phase transitions were first order.
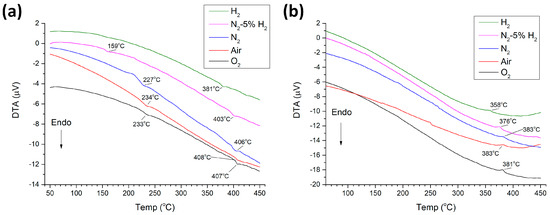
Figure 10.
(a) Ascending and (b) descending DTA traces of KNbO3 samples sintered at 1040 °C for 3 h in different atmospheres.
Table 2.
DTA phase transition temperatures of KNbO3 samples sintered at 1040 °C for 3 h in different atmospheres.
4. Discussion
During solid state sintering of a polycrystalline ceramic, grain growth takes place due to grain boundary curvature-induced differences in pressure and atom chemical potential between grains of differing size [52,53,54]. Driving force ΔG for the growth of a grain is given by [54,55,56]:
where γ = grain boundary energy, Vm = molar volume, r* = critical grain radius (radius of a grain that does not grow or shrink, usually considered to be the mean grain radius), and r = radius of the grain of interest. For a faceted grain, r = perpendicular distance from the grain center to the surface and γ = specific surface energy [54]. The chemical potential (and hence, ΔG) of atoms in a grain with faceted surfaces also depends on grain size [57,58].
The grain growth rate also depends on the grain boundary structure, as well as the driving force. Grain boundaries have disordered (rough) or ordered (faceted) structures on an atomic scale [59,60]. For grains with disordered grain boundaries, there are many possible atom attachment sites on the grain surface. Grain growth is limited by atom diffusion across the grain boundary [54,56]. The grain growth rate shows a linear increase with ΔG. Grains with r > r* have positive values of ΔG and can grow (the black dotted line in Figure 11), whereas grains with r < r* have negative values of ΔG and will shrink [54]. Grain size distribution remains unimodal with sintering time, and abnormal grain growth will not occur [54].
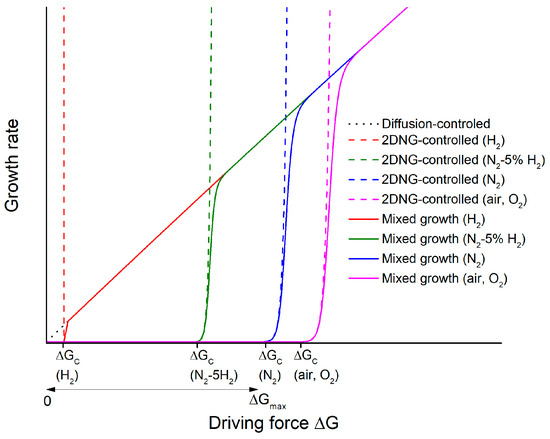
Figure 11.
Schematic of growth rate vs. driving force for samples sintered in different atmospheres (2DNG = 2D nucleation-controlled growth).
If the grain boundaries are ordered, atoms attaching to the surface of a grain are unstable due to their many broken bonds. They will quickly detach from the grain unless they can migrate and attach to low-energy kink sites such as 2D nuclei, screw dislocations, steps, and re-entrant edges [54,60,61]. Grain growth is now limited by the rate of atom attachment at such kink sites (interface-reaction controlled growth). For a system in which grain growth is controlled by 2D nucleation and growth, the rate at which 2D nuclei form varies exponentially with ΔG [62,63]. Below a critical driving force ΔGc, the 2D nuclei form at a very slow rate, and atom attachment to the grain is difficult. At ΔG = ΔGc, the rate at which 2D nuclei form increases exponentially. For ΔG > ΔGc, kinetic roughening takes place [60,64,65]. Many 2D nuclei form, and atom attachment to the grain becomes easy. Grain growth becomes diffusion-limited, as in the case of a rough grain boundary. Hence, the grain growth rate is negligible at ΔG < ΔGc, increases exponentially at ΔG ≈ ΔGc (the dashed lines in Figure 11), and then becomes a linear function of ΔG (the solid lines in Figure 11) [66]. Grains with negative values of ΔG will shrink as a linear function of ΔG, as the energy requirement for atoms to detach from grain corners and edges is low [54,56,67]. If the grains contain screw dislocations, the grain growth rate increases parabolically with ΔG until ΔGc is reached, at which point grain growth becomes diffusion-limited again. According to the relative values of ΔGc and ΔGmax (where ΔGmax is the value of ΔG for the largest grain), different grain growth behaviors (pseudo-normal, abnormal, and stagnant) can be observed [54,56,67,68]. This grain growth theory, called the mixed control theory, was originally developed to describe liquid phase sintering, but similar behavior also takes place in single phase systems with faceted grain boundaries in which the formation and lateral spreading of steps governs grain boundary migration [54,66,67,69,70,71,72,73,74,75,76,77,78].
The critical driving force ΔGc is dependent on the step or edge free energy ε, which is the excess energy of the edge of the kink site [54,56,67,70,73]. The value of ε can vary depending on sintering atmosphere, sintering temperature, or dopant addition [59,60,79]. As ε decreases, ΔGc also decreases. Grain morphology is a qualitative indication of the value of ε [55,68,80]. The cubic morphology of the KNbO3 grains (Figure 3) with faceted faces, sharp edges, and corners (Figure 7) indicates a high value of ε. During sintering of KNbO3, evaporation of potassium can take place. However, the potassium vapor pressure over KNbO3 is much lower than that of lead oxide over PZT [81]. Oxygen vacancies will also form via the following defect reaction:
The formation of potassium and oxygen vacancies increases the configurational entropy of the system, which in turn reduces step free energy ε and critical driving force ΔGc [82,83,84]. The decreased orthorhombic distortion in the unit cell of the H2-sintered sample (Figure 8 and Figure 9) and the decrease in temperature of the orthorhombic to tetragonal and tetragonal to cubic phase transitions in the samples sintered in N2-5%H2 and H2 (Figure 10) are caused by the increased concentration of oxygen vacancies [45,85,86,87,88,89,90]. The appearance of secondary phases in the H2-sintered samples also indicates increased evaporation of potassium (Figure 4 and Figure 8). By considering the rate of formation of oxygen vacancies in different sintering atmospheres, the grain growth behavior of KNbO3 can be explained. For O2- and air-sintered samples, the number of oxygen vacancies is relatively low. The values of ε and hence ΔGc are high. The value of ΔGc is higher than ΔGmax, the driving force of the largest grain (Figure 11). No grains in the samples had ΔG ≥ ΔGc, and so, no grains could grow appreciably. This caused stagnant grain growth behavior. For the N2-sintered sample, the lower would push Equation (2) to the right and create more oxygen vacancies, increasing configurational entropy, lowering ε and ΔGc. A few grains now had ΔG ≈ ΔGc. These grains should be able to grow more rapidly than the surrounding matrix grains and become abnormal grains (Figure 6 and Figure 11). However, there was little size difference between the abnormal grains and matrix grains. For values of ΔG very close to ΔGc, the grain growth rate does not increase dramatically with small increases in ΔG (the region of the blue curve in Figure 11 which is beginning to curve upwards). With increasing sintering time, ΔG of the abnormal grains should slowly increase as they were slowly growing, while the matrix grains (which control the value of the critical radius r*) were barely growing [Equation (1)]. Once ΔG became large enough, the growth rate should then increase very rapidly (the steeply sloping region of the blue curve). However, this did not appear to happen as the grain size distributions of the N2-sintered samples did not change significantly as sintering time increased. A longer sintering time was possibly needed to allow the abnormal grains to grow large enough to reach the region of the growth rate vs. ΔG curve where the growth rate increases rapidly.
For samples sintered in N2-5% H2, the number of oxygen vacancies increased further. ε and ΔGc were further lowered (Figure 11). The number of grains with ΔG ≥ ΔGc increased, and their growth rate also increased compared to those in the N2-sintered samples. These grains underwent rapid growth and became abnormal grains (Figure 3 and Figure 6), causing a rapid increase in the mean grain size (Figure 5). Extensive abnormal grain growth took place by 1 h. After impingement of the abnormal grains, their value of ΔG decreased rapidly, and further grain growth was very limited. For the H2-sintered samples, ε and ΔGc were further lowered. The increased curvature at the corners and edges of the KNbO3 powder annealed in H2 is indicative of a reduced ε (Figure 7). The value of ΔGc became so low that many grains had ΔG ≥ ΔGc and could grow. Even grains with ΔG ≈ ΔGmax could not now grow rapidly to form abnormal grains as they had to compete for material with many other growing grains. A shift from abnormal to pseudo-normal grain growth took place, with the grain size distribution becoming narrow and unimodal [56,67,77,78].
For the O2-, air-, and N2-sintered samples, abnormal grain growth occurred at the edges of the samples. This was probably due to the increased evaporation of potassium at the sample edges, increasing the number of potassium vacancies. The concentration of oxygen vacancies at the sample edges was also likely to be larger than in the bulk. This caused ε and ΔGc to be lower at the sample edges than in the bulk. During prolonged sintering, some of the grains at the sample edges could grow sufficiently to have ΔG ≥ ΔGc and could then form abnormal grains. For the N2-5% H2-sintered samples, ε and ΔGc were also lower at the sample edges than in the bulk. The number of grains at the edges of the sample with ΔG ≥ ΔGc and therefore able to grow was larger than in the bulk, causing the grain growth behavior at the edges of the sample to transition towards pseudo-normal grain growth.
Comparing the SEM micrographs (Figure 3) with the mean grain size measurements (Figure 5), it can be seen that there are many large grains over 10 μm in radius in the samples sintered in N2-5% H2; however, the mean grain radius is only 6–8 μm. The measured mean grain radius will depend on the relative numbers of small matrix and large abnormal grains measured. Due to their large size, the abnormal grains were measured from micrographs taken at lower magnification, and their grain boundaries were not always clearly visible. It was easier to measure the size of the remaining small matrix grains, so the mean grain size and grain size distributions of the samples sintered in N2-5% H2 were likely skewed towards smaller values. Nonetheless, it is still clear that sintering in N2-5% H2 caused a large increase in mean grain size.
The appearance of secondary phases in the samples sintered in H2 indicates that KNbO3 is unstable when sintered in strongly reducing atmospheres (Figure 8b). Such instability was not noticed in (K0.5Na0.5)NbO3 samples sintered in H2 [45,46,47]. If one considers an Ellingham diagram, the Gibbs free energy vs. temperature line for the reaction 4K + O2 ⇆ 2K2O lies above the line for the reaction 4Na + O2 ⇆ 2Na2O, indicating that potassium oxide is more easily reduced than sodium oxide [91]. Shigemi and Wada calculated the formation energy of oxygen vacancies in strongly reducing atmospheres to be lower in KNbO3 (0.80 eV) than in NaNbO3 (0.84 eV) [92,93]. The vapor pressure of K over KNbO3 is also higher than that of Na over NaNbO3 [81,94]. Therefore, KNbO3 may be less stable than (K0.5Na0.5)NbO3 when sintered in reducing atmospheres. The appearance of the secondary phases may also explain the lower density of the H2-sintered samples. The density of K4Nb6O17 is 3.897 g.cm−3 [95] compared to 4.624 g.cm−3 for KNbO3 [48].
The present results show that KNbO3 samples sintered in N2-5% H2 underwent considerable abnormal grain growth. As abnormal grain growth is usually detrimental to the mechanical properties, KNbO3 may not be suitable for co-firing in reducing atmospheres with base metal electrodes. On the other hand, an increase in grain size is known to improve the piezoelectric properties of (K0.5Na0.5)NbO3-based ceramics due to reduced domain wall pinning (extrinsic contribution) [96,97,98]. Control of the orthorhombic-tetragonal phase transition temperature, which controls the relative amounts of orthorhombic and tetragonal phases, is also very important in improving the piezoelectric properties due to enhanced polarization extension and rotation (intrinsic contribution) [96,99,100,101], as well as enhanced extrinsic contributions [102]. By sintering KNbO3 in reducing atmospheres, it may be possible to control both grain size and orthorhombic-tetragonal phase transition temperature simultaneously, thereby enhancing the piezoelectric properties. The present study focused only on the effect of sintering atmosphere on the density, structure, and microstructure of KNbO3. The samples sintered in reducing atmospheres would have relatively high conductivity due to the free electrons formed by Equation (2). When sintering ferroelectric materials such as BaTiO3 or (K0.5Na0.5)NbO3 in reducing atmospheres, an acceptor dopant such as MnO2 or MnO is often added to trap these free electrons, enabling the materials to maintain high resistivity [103,104]. In the future, the effect of MnO2 doping on the grain growth behavior and electrical properties of KNbO3 sintered in reducing atmospheres needs to be studied.
5. Conclusions
KNbO3 was sintered in different atmospheres and the effect on densification, grain growth, and structure studied. The sintering atmosphere did not have much effect on sample density except for H2, which caused a reduction in density. Oxygen-, air-, and N2-sintered samples showed bulk stagnant grain growth behavior (with abnormal grain growth at the sample edges); samples sintered in N2-5% H2 showed bulk abnormal grain growth behavior (with less abnormal grain growth at the sample edges), and samples sintered in H2 showed pseudo-normal grain growth behavior. Sintering in reducing atmospheres caused a reduction in the unit cell orthorhombic distortion and reduced orthorhombic-tetragonal and tetragonal-cubic phase transition temperatures. Samples sintered in H2 were unstable, with secondary phases and weak mechanical properties. Grain growth behavior in different sintering atmospheres was explained by the mixed control theory of grain growth. Sintering in reducing atmospheres caused increased formation of oxygen vacancies and increased configurational entropy, which caused a decrease in step free energy and in critical driving force for grain growth. This increased the number of appreciably growing grains, causing grain growth behavior to transition from stagnant to abnormal and eventually to pseudo-normal.
Author Contributions
Conceptualization, J.G.F.; methodology, J.G.F.; formal analysis, D.T.T.; investigation, D.T.T.; resources, J.G.F.; data curation, D.T.T. and J.G.F.; writing, original draft preparation, J.G.F.; writing, review and editing, J.G.F.; visualization, D.T.T. and J.G.F.; supervision, J.G.F.; project administration, J.G.F.; funding acquisition, J.G.F. All authors read and agreed to the published version of the manuscript.
Funding
This study was financially supported by Chonnam National University (Grant Number 2016-2518).
Acknowledgments
The authors would like to thank Kyeong-Kap Jeong (Centre for Research Facilities, Chonnam National University) for operating the XRD and Hey-Jeong Kim (Centre for Development of Fine Chemicals, Chonnam National University) for operating the SEM. The authors would like to thank Prof. Jong-Sook Lee and Thuy Linh Pham for experimental assistance.
Conflicts of Interest
The authors declare no conflict of interest. The funders had no role in the design of the study; in the collection, analyses, or interpretation of data; in the writing of the manuscript; nor in the decision to publish the results.
References
- Jaffe, B.; Cook, W.R.; Jaffe, H. Perovskite niobates and tantalates. In Piezoelectric Ceramics; Academic Press: London, UK, 1971; pp. 185–212. [Google Scholar]
- Tennery, V.J.; Hang, K.W. Thermal and X-Ray diffraction studies of the NaNbO3–KNbO3 system. J. Appl. Phys. 1968, 39, 4749–4753. [Google Scholar] [CrossRef]
- Wood, E.A. Polymorphism in potassium niobate, sodium niobate, and other ABO3 compounds. Acta Crystallogr. 1951, 4, 353–362. [Google Scholar] [CrossRef]
- Hewat, A.W. Cubic-tetragonal-orthorhombic-rhombohedral ferroelectric transitions in perovskite potassium niobate: Neutron powder profile refinement of the structures. J. Phys. C Solid State Phys. 1973, 6, 2559–2572. [Google Scholar] [CrossRef]
- Kakimoto, K.-i.; Masuda, I.; Ohsato, H. Solid-solution structure and piezoelectric property of knbo3 ceramics doped with small amounts of elements. Jpn. J. Appl. Phys. 2004, 43, 6706–6710. [Google Scholar] [CrossRef]
- Baier-Saip, J.A.; Ramos-Moor, E.; Cabrera, A.L. Raman study of phase transitions in KNbO3. Solid State Commun. 2005, 135, 367–372. [Google Scholar] [CrossRef]
- Kim, Y.; Lee, K.J. Characterization of the electro-optic modulation properties of a yz-cut potassium niobate single crystal. J. Korean Phys. Soc. 2019, 75, 40–44. [Google Scholar] [CrossRef]
- Kim, I.; Lee, D.; Lee, K.J. Integrated electro-optic platform using ferroelectric crystals with the point symmetry of orthorhombic mm2. Curr. Appl. Phys. 2019, 19, 1046–1051. [Google Scholar] [CrossRef]
- Yu, D.; Liu, Z.; Zhang, J.; Li, S.; Zhao, Z.; Zhu, L.; Liu, W.; Lin, Y.; Liu, H.; Zhang, Z. Enhanced catalytic performance by multi-field coupling in KNbO3 nanostructures: Piezo-photocatalytic and ferro-photoelectrochemical effects. Nano Energy 2019, 58, 695–705. [Google Scholar] [CrossRef]
- Pascual-Gonzalez, C.; Schileo, G.; Murakami, S.; Khesro, A.; Wang, D.; Reaney, I.M.; Feteira, A. Continuously controllable optical band gap in orthorhombic ferroelectric KNbO3-BiFeO3 ceramics. Appl. Phys. Lett. 2017, 110, 172902. [Google Scholar] [CrossRef]
- Li, C.; Jiang, K.; Jiang, J.; Hu, Z.; Liu, A.; Hu, G.; Shi, W.; Chu, J. Enhanced photovoltaic response of lead-free ferroelectric solar cells based on (K,Bi)(Nb,Yb)O3 films. Phys. Chem. Chem. Phys. 2020, 22, 3691–3701. [Google Scholar] [CrossRef]
- Pascual-Gonzalez, C.; Schileo, G.; Khesro, A.; Sterianou, I.; Wang, D.; Reaney, I.M.; Feteira, A. Band gap evolution and a piezoelectric-to-electrostrictive crossover in (1−x)KNbO3–x(Ba0.5Bi0.5)(Nb0.5Zn0.5)O3 ceramics. J. Mater. Chem. C 2017, 5, 1990–1996. [Google Scholar] [CrossRef]
- Balakrishnaiah, R.; Kim, D.W.; Yi, S.S.; Kim, K.D.; Kim, S.H.; Jang, K.; Lee, H.S.; Jeong, J.H. Frequency upconversion fluorescence studies of Er3+/Yb3+-codoped KNbO3 phosphors. Thin Solid Films 2009, 517, 4138–4142. [Google Scholar] [CrossRef]
- Kim, T.-H.; Kim, D.-J.; Jang, W.-Y.; Moon, A.; Lim, K.-S.; Lee, M. Upconversion Emission in Er and Cr Co-Doped KNbO3 Phosphors. Jpn. J. Appl. Phys. 2011, 50, 06GH11. [Google Scholar] [CrossRef]
- Fang, T.-H.; Hsiao, Y.-J.; Chang, Y.-S.; Chang, Y.-H. Photoluminescent characterization of KNbO3:Eu3+. Mater. Chem. Phys. 2006, 100, 418–422. [Google Scholar] [CrossRef]
- Fisher, J.G.; Thuan, U.T.; Farooq, M.U.; Chandrasekaran, G.; Jung, Y.D.; Hwang, E.C.; Lee, J.J.; Lakshmanan, V.K. Prostate cancer cell-specific cytotoxicity of sub-micron potassium niobate powder. J. Nanosci. Nanotechnol. 2018, 18, 3141–3147. [Google Scholar] [CrossRef]
- Ladj, R.; Magouroux, T.; Eissa, M.; Dubled, M.; Mugnier, Y.; Dantec, R.L.; Galez, C.; Valour, J.-P.; Fessi, H.; Elaissari, A. Aminodextran-coated potassium niobate (KNbO3) nanocrystals for second harmonic bio-imaging. Coll. Surf. A Physicochem. Eng. Asp. 2013, 439, 131–137. [Google Scholar] [CrossRef]
- Nakayama, Y.; Pauzauskie, P.J.; Radenovic, A.; Onorato, R.M.; Saykally, R.J.; Liphardt, J.; Yang, P. Tunable nanowire nonlinear optical probe. Nature 2007, 447, 1098–1101. [Google Scholar] [CrossRef]
- Cai, F.H.; Yu, J.X.; Qian, J.; Wang, Y.; Chen, Z.; Huang, J.Y.; Ye, Z.Z.; He, S.L. Use of tunable second-harmonic signal from KNbO3 nanoneedles to find optimal wavelength for deep-tissue imaging. Laser Photon. Rev. 2014, 8, 865–874. [Google Scholar] [CrossRef]
- Wada, S.; Muraoka, K.; Kakemoto, H.; Tsurumi, T.; Kumagai, H. Enhanced piezoelectric properties of potassium niobate single crystals by domain engineering. Jpn. J. Appl. Phys. 2004, 43, 6692–6700. [Google Scholar] [CrossRef]
- Kakimoto, K.-I.; Masuda, I.; Ohsato, H. Lead-free KNbO3 piezoceramics synthesized by pressure-less sintering. J. Eur. Ceram. Soc. 2005, 25, 2719–2722. [Google Scholar] [CrossRef]
- Matsumoto, K.; Hiruma, Y.; Nagata, H.; Takenaka, T. Electric-field-induced strain in Mn-doped KNbO3 ferroelectric ceramics. Ceram. Int. 2008, 34, 787–791. [Google Scholar] [CrossRef]
- Kim, D.-H.; Joung, M.-R.; Seo, I.-T.; Hur, J.; Kim, J.-H.; Kim, B.-Y.; Lee, H.-J.; Nahm, S. Low-temperature sintering and piezoelectric properties of CuO-Added KNbO3 ceramics. J. Am. Ceram. Soc. 2014, 97, 3897–3903. [Google Scholar] [CrossRef]
- Kim, J.-H.; Kim, D.-H.; Seo, I.-T.; Hur, J.; Lee, J.-H.; Kim, B.-Y.; Nahm, S. Effect of CuO on the ferroelectric and piezoelectric properties of lead-free KNbO3 ceramics. Sens. Actuators A Phys. 2015, 234, 9–16. [Google Scholar] [CrossRef]
- Kim, D.-H.; Joung, M.-R.; Seo, I.-T.; Hur, J.; Kim, J.-H.; Kim, B.-Y.; Lee, H.-J.; Nahm, S. Influence of sintering conditions on piezoelectric properties of KNbO3 ceramics. J. Eur. Ceram. Soc. 2014, 34, 4193–4200. [Google Scholar] [CrossRef]
- Matsumoto, K.; Hiruma, Y.; Nagata, H.; Takenaka, T. Piezoelectric properties of pure and mn-doped potassium niobate ferroelectric ceramics. Jpn. J. Appl. Phys. 2006, 45, 4479–4483. [Google Scholar] [CrossRef]
- Kato, H.; Ishida, M.; Akiyama, Y. Effects of K4CuNb8O23 and GeO2 addition on microstructure and piezoelectric properties in KNbO3 ceramics. Jpn. J. Appl. Phys. 2019, 58, SLLD03. [Google Scholar] [CrossRef]
- Ullah, S.; Ullah, I.; Iqbal, Y.; Manan, A.; Ali, S.; Khan, A. Influence of P2O5 and SiO2 addition on the phase, microstructure, and electrical properties of KNbO3. Iran. J. Sci. Technol. Trans. A Sci. 2019, 43, 1981–1987. [Google Scholar] [CrossRef]
- Qiu, J.H.; Zhao, T.X.; Chen, Z.H.; Wang, X.Q.; Yuan, N.Y.; Ding, J.N. Piezoelectric and pyroelectric properties of (001) oriented KNbO3 film. Solid State Commun. 2018, 284–286, 1–4. [Google Scholar] [CrossRef]
- Swami, M.; Verma, O.N.; Tomar, V.; Kumar, M.; Srivastav, K.K.; Sathe, V.; Jha, P.A.; Singh, P. Correlation between piezoelectric and magnetic properties of Fe and Sm co-substituted potassium niobate piezoelectric ceramics. Phys. Chem. Chem. Phys. 2018, 20, 18800–18810. [Google Scholar] [CrossRef]
- Hikita, K.; Hiruma, Y.; Nagata, H.; Takenaka, T. Shear-Mode Piezoelectric Properties of KNbO3-Based Ferroelectric Ceramics. Jpn. J. Appl. Phys. 2009, 48, 07GA05. [Google Scholar] [CrossRef]
- Tan, Z.; Peng, Y.T.; An, J.; Zhang, Q.M.; Zhu, J.G. Intrinsic origin of enhanced piezoelectricity in alkali niobate-based lead-free ceramics. J. Am. Ceram. Soc. 2019, 102, 5262–5270. [Google Scholar] [CrossRef]
- Tashiro, S.; Nagamatsu, H.; Nagata, K. Sinterability and Piezoelectric Properties of KNbO3 Ceramics after Substituting Pb and Na for K. Jpn. J. Appl. Phys. 2002, 41, 7113–7118. [Google Scholar] [CrossRef]
- Nagata, H.; Matsumoto, K.; Hirosue, T.; Hiruma, Y.; Takenaka, T. Fabrication and Electrical Properties of Potassium Niobate Ferroelectric Ceramics. Jpn. J. Appl. Phys. 2007, 46, 7084–7088. [Google Scholar] [CrossRef]
- Nagata, H.; Sato, S.; Hiruma, Y.; Takenaka, T. Fabrication of Dense KNbO3 Ceramics Derived from KHCO3 as a Starting Material. Appl. Phys. Express 2012, 5, 011502. [Google Scholar] [CrossRef]
- Kobayashi, K.; Doshida, Y.; Mizuno, Y.; Randall, C.A. Piezoelectric and dielectric properties of Sn-doped (Na0.5K0.5)NbO3 ceramics processed under low oxygen partial pressure atmosphere. Jpn. J. Appl. Phys. 2014, 53, 011501. [Google Scholar] [CrossRef]
- Kobayashi, K.; Doshida, Y.; Mizuno, Y.; Randall, C.A. A route forwards to narrow the performance gap between pzt and lead-free piezoelectric ceramic with low oxygen partial pressure processed (Na0.5K0.5)NbO3. J. Am. Ceram. Soc. 2012, 95, 2928–2933. [Google Scholar] [CrossRef]
- Huan, Y.; Wang, X.; Wei, T.; Xie, J.; Ye, Z.; Zhao, P.; Li, L. Defect engineering of high-performance potassium sodium niobate piezoelectric ceramics sintered in reducing atmosphere. J. Am. Ceram. Soc. 2017, 100, 2024–2033. [Google Scholar] [CrossRef]
- Kawada, S.; Kimura, M.; Higuchi, Y.; Takagi, H. (K,Na)NbO3-based multilayer piezoelectric ceramics with nickel inner electrodes. Appl. Phys. Express 2009, 2, 111401. [Google Scholar] [CrossRef]
- Hayashi, H.; Kawada, S.; Kimura, M.; Nakai, Y.; Tabata, T.; Shiratsuyu, K.; Nada, K.; Takagi, H. Reliability of nickel inner electrode lead-free multilayer piezoelectric ceramics. Jpn. J. Appl. Phys. 2012, 51, 09LD01. [Google Scholar] [CrossRef]
- Liu, C.; Liu, P.; Kobayashi, K.; Randall, C. Base metal Co-fired (Na,K)NbO3 structures with enhanced piezoelectric performance. J. Electroceram. 2014, 32, 301–306. [Google Scholar] [CrossRef]
- Kobayashi, K.; Doshida, Y.; Mizuno, Y.; Randall, C.A. Possibility of cofiring a nickel inner electrode in a (na0.5k0.5)nbo3–lif piezoelectric actuator. Jpn. J. Appl. Phys. 2013, 52, 09KD07. [Google Scholar] [CrossRef]
- Vendrell, X.; García, J.E.; Rubio-Marcos, F.; Ochoa, D.A.; Mestres, L.; Fernández, J.F. Exploring different sintering atmospheres to reduce nonlinear response of modified KNN piezoceramics. J. Eur. Ceram. Soc. 2013, 33, 825–831. [Google Scholar] [CrossRef]
- Fisher, J.G.; Kang, S.J.L. Microstructural changes in (Na0.5K0.5)NbO3 ceramics sintered in various atmospheres. J. Eur. Ceram. Soc. 2009, 29, 2581–2588. [Google Scholar] [CrossRef]
- Fisher, J.G.; Rout, D.; Moon, K.S.; Kang, S.J.L. High-temperature X-ray diffraction and Raman spectroscopy study of (K0.5Na0.5)NbO3 ceramics sintered in oxidizing and reducing atmospheres. Mater. Chem. Phys. 2010, 120, 263–271. [Google Scholar] [CrossRef]
- Fisher, J.G.; Choi, S.Y.; Kang, S.J.L. Influence of sintering atmosphere on abnormal grain growth behaviour in potassium sodium niobate ceramics sintered at low temperature. J. Korean Ceram. Soc. 2011, 48, 641–647. [Google Scholar] [CrossRef]
- Fisher, J.G.; Rout, D.; Moon, K.S.; Kang, S.J.L. Structural changes in potassium sodium niobate ceramics sintered in different atmospheres. J. Alloys Compd. 2009, 479, 467–472. [Google Scholar] [CrossRef]
- International Centre for Diffraction Data Powder Diffraction File #71-0946. Available online: http://www.icdd.com/ (accessed on 20 March 2020).
- Samardzžija, Z.; Bernik, S.; Marinenko, R.B.; Malič, B.; Čeh, M. An EPMA study on KNbO3 and NaNbO3 single crystals–potential reference materials for quantitative microanalysis. Microchim. Acta 2004, 145, 203–208. [Google Scholar] [CrossRef]
- Moon, K.S.; Kang, S.J.L. Coarsening behaviour of round-edged cubic grains in the Na1/2Bi1/2TiO3-BaTiO3 System. J. Am. Ceram. Soc. 2008, 91, 3191–3196. [Google Scholar] [CrossRef]
- Malič, B.; Razpotnik, H.; Koruza, J.; Kokalj, S.; Cilenšek, J.; Kosec, M. Linear Thermal Expansion of Lead-Free Piezoelectric K0.5Na0.5NbO3 Ceramics in a Wide Temperature Range. J. Am. Ceram. Soc. 2011, 94, 2273–2275. [Google Scholar] [CrossRef]
- Kang, S.J.L. Normal grain growth and second-phase particles. In Sintering: Densification, Grain Growth & Microstructure; Elsevier Butterworth Heinemann: Oxford, UK, 2005; pp. 91–96. [Google Scholar]
- Chiang, Y.M.; Birnie, D.; Kingery, W.D. Chapter 5 Microstructure. In Physical Ceramics: Principles for Ceramic Science and Engineering; John Wiley & Sons: New York, NY, USA, 1997; pp. 351–513. [Google Scholar]
- Kang, S.J.L.; Jung, Y.I.; Jung, S.H.; Fisher, J.G. Interface structure-dependent grain growth behaviour in polycrystals. In Microstructural Design of Advanced Engineering Materials; Molodov, D.A., Ed.; Wiley-VCH Verlag GmbH & Co. KGaA: Weinheim, Germany, 2013; pp. 299–322. [Google Scholar]
- Jo, W.; Kim, D.Y.; Hwang, N.M. Effect of interface structure on the microstructural evolution of ceramics. J. Am. Ceram. Soc. 2006, 89, 2369–2380. [Google Scholar] [CrossRef]
- Jung, Y.I.; Yoon, D.Y.; Kang, S.J.L. Coarsening of polyhedral grains in a liquid matrix. J. Mater. Res. 2009, 24, 2949–2959. [Google Scholar] [CrossRef]
- Searcy, A.W.; Bullard, J.W. Thermodynamics and kinetics of surface area changes of faceted particles. J. Am. Ceram. Soc. 1994, 77, 2314–2318. [Google Scholar] [CrossRef]
- Kang, S.J.L. Grain shape and grain growth in a liquid matrix. In Sintering: Densification, Grain Growth & Microstructure; Elsevier Butterworth Heinemann: Oxford, UK, 2005; pp. 205–226. [Google Scholar]
- Choi, S.Y.; Kang, S.J.L. Sintering kinetics by structural transition at grain boundaries in barium titanate. Acta Mater. 2004, 52, 2937–2943. [Google Scholar] [CrossRef]
- Markov, I.V. Crystal-ambient phase equilibrium. In Crystal Growth for Beginners: Fundamentals of Nucleation, Crystal Growth and Epitaxy, 2nd ed.; World Scientific: Singapore, 2003; pp. 1–76. [Google Scholar]
- Burton, W.K.; Cabrera, N.; Frank, F.C. The growth of crystals and the equilibrium structure of their surfaces. Philos. Trans. R. Soc. A 1951, 243, 299–358. [Google Scholar]
- Hirth, J.P.; Pound, G.M. Growth and evaporation of liquids and dislocation-free crystals. In Condensation and Evaporation: Nucleation and Growth Kinetics; Pergamon Press: Oxford, UK, 1963; pp. 77–106. [Google Scholar]
- Markov, I.V. Nucleation. In Crystal Growth for Beginners: Fundamentals of Nucleation, Crystal Growth and Epitaxy, 2nd ed.; World Scientific: Singapore, 2003; pp. 77–180. [Google Scholar]
- Peteves, S.D.; Abbaschian, R. Growth kinetics of solid-liquid Ga interfaces: Part I. Experimental. Metall. Trans. A 1991, 22, 1259–1270. [Google Scholar] [CrossRef]
- Peteves, S.D.; Abbaschian, R. Growth kinetics of solid-liquid Ga interfaces: Part II. Theoretical. Metall. Trans. A 1991, 22, 1271–1286. [Google Scholar] [CrossRef]
- An, S.M.; Yoon, B.K.; Chung, S.Y.; Kang, S.J.L. Nonlinear driving force-velocity relationship for the migration of faceted boundaries. Acta Mater. 2012, 60, 4531–4539. [Google Scholar] [CrossRef]
- Kang, S.J.L.; Lee, M.G.; An, S.M. Microstructural evolution during sintering with control of the interface structure. J. Am. Ceram. Soc. 2009, 92, 1464–1471. [Google Scholar] [CrossRef]
- Fisher, J.G.; Kang, S.-J.L. Strategies and practices for suppressing abnormal grain growth during liquid phase sintering. J. Am. Ceram. Soc. 2019, 102, 717–735. [Google Scholar] [CrossRef]
- Kizuka, T. Atomic processes of grain-boundary migration and phase transformation in zinc oxide nanocrystallites. Philos. Mag. Lett. 1999, 79, 417–422. [Google Scholar] [CrossRef]
- Koo, J.B.; Yoon, D.Y. Abnormal grain growth in bulk Cu—The dependence on initial grain size and annealing temperature. Metall. Mater. Trans. A 2001, 32, 1911–1926. [Google Scholar] [CrossRef]
- Merkle, K.L.; Thompson, L.J. Atomic-scale observation of grain boundary motion. Mater. Lett. 2001, 48, 188–193. [Google Scholar] [CrossRef]
- Merkle, K.L.; Thompson, L.J.; Phillipp, F. Collective effects in grain boundary migration. Phys. Rev. Lett. 2002, 88, 225501. [Google Scholar] [CrossRef] [PubMed]
- Yoon, D.Y.; Park, C.W.; Koo, J.B. The step growth hypothesis for abnormal grain growth. In Ceramic Interfaces 2; Institute of Materials: London, UK, 2001; pp. 3–21. [Google Scholar]
- Lee, S.B.; Kim, Y.-M. Kinetic roughening of a Σ5 tilt grain boundary in SrTiO3. Acta Mater. 2009, 57, 5264–5269. [Google Scholar] [CrossRef]
- Jung, S.H.; Yoon, D.Y.; Kang, S.J.L. Mechanism of abnormal grain growth in ultrafine-grained nickel. Acta Mater. 2013, 61, 5685–5693. [Google Scholar] [CrossRef]
- Jung, S.H.; Kang, S.J.L. An explanation for the formation of polyhedral abnormal grains in single-phase systems. Scr. Mater. 2014, 82, 49–52. [Google Scholar] [CrossRef]
- Jung, S.H.; Kang, S.J.L. Repetitive grain growth behaviour with increasing temperature and grain boundary roughening in a model nickel system. Acta Mater. 2014, 69, 283–291. [Google Scholar] [CrossRef]
- Kang, S.J.L.; Ko, S.Y.; Moon, S.Y. Mixed control of boundary migration and the principle of microstructural evolution. J. Ceram. Soc. Jpn. 2016, 124, 259–267. [Google Scholar] [CrossRef]
- Farooq, M.U.; Fisher, J.G. Growth of (Na0.5K0.5)NbO3–SrTiO3 lead-free piezoelectric single crystals by the solid state crystal growth method and their characterization. Ceram. Int. 2014, 40, 3199–3207. [Google Scholar] [CrossRef]
- Jo, W.; Hwang, N.M.; Kim, D.Y. Effect of Crystal Shape on the Grain Growth during Liquid Phase Sintering of Ceramics. J. Korean Ceram. Soc. 2006, 43, 728–733. [Google Scholar]
- Popovič, A.; Bencze, L.; Koruza, J.; Malič, B. Vapour pressure and mixing thermodynamic properties of the KNbO3–NaNbO3 system. RSC Advances 2015, 5, 76249–76256. [Google Scholar] [CrossRef]
- Wortis, M. Equilibrium Crystal Shapes and Interfacial Phase Transitions. In Chemistry and Physics of Solid Surfaces VII; Vanselow, R., Howe, R., Eds.; Springer: Berlin/Heidelberg, Germany, 1988; pp. 367–405. [Google Scholar]
- Jeong, H.-C.; Williams, E.D. Steps on surfaces: Experiment and theory. Surf. Sci. Rep. 1999, 34, 171–294. [Google Scholar] [CrossRef]
- West, A.R. Solid State Chemistry and its Applications, 2nd ed.; John Wiley & Sons Ltd.: Chichester, UK, 2014; pp. 87–124. [Google Scholar]
- Panlener, R.J.; Blumenthal, R.N. Ti-Rich Nonstoichiometric BaTiO3: III, High-Temperature Thermodynamic and X-Ray Diffraction Measurements. J. Am. Ceram. Soc. 1971, 54, 610–613. [Google Scholar] [CrossRef]
- Härdtl, K.H.; Wernicke, R. Lowering the curie temperature in reduced BaTiO3. Solid State Commun. 1972, 10, 153–157. [Google Scholar] [CrossRef]
- Khattak, C.P.; Cox, D.E. Structural studies of the (La, Sr) CrO3 system. Mater. Res. Bull. 1977, 12, 463–471. [Google Scholar] [CrossRef]
- Salje, E.; Bismayer, U.; Wruck, B.; Hensler, J. Influence of lattice imperfections on the transition temperatures of structural phase transitions: The plateau effect. Phase Transitions 1991, 35, 61–74. [Google Scholar] [CrossRef]
- Lee, S.; Liu, Z.-K.; Kim, M.-H.; Randall, C.A. Influence of nonstoichiometry on ferroelectric phase transition in BaTiO3. J. Appl. Phys. 2007, 101, 054119. [Google Scholar] [CrossRef]
- Bhaumik, I.; Ganesamoorthy, S.; Bhatt, R.; Karnal, A.K.; Wadhawan, V.K.; Gupta, P.K.; Kitamura, K.; Takekawa, S.; Nakamura, M. The ferroelectric phase transition in lithium tantalate single crystals: A composition-dependence study. J. Appl. Phys. 2008, 103, 014108. [Google Scholar] [CrossRef]
- Ellingham Diagrams. Available online: http://web.mit.edu/2.813/www/readings/Ellingham_diagrams.pdf (accessed on 28 February 2020).
- Shigemi, A.; Wada, T. Enthalpy of formation of various phases and formation energy of point defects in perovskite-type NaNbO3 by first-principles calculation. Jpn. J. Appl. Phys. 2004, 43, 6793. [Google Scholar] [CrossRef]
- Shigemi, A.; Wada, T. Evaluations of phases and vacancy formation energies in KNbO3 by first-principles calculation. Jpn. J. Appl. Phys. 2005, 44, 8048. [Google Scholar] [CrossRef]
- Popovič, A.; Bencze, L.; Koruza, J.; Malič, B.; Kosec, M. Knudsen effusion mass spectrometric approach to the thermodynamics of Na2O–Nb2O5 system. Int. J. Mass Spectrom. 2012, 309, 70–78. [Google Scholar] [CrossRef]
- International Centre for Diffraction Data Powder Diffraction File #76-0977. Available online: http://www.icdd.com/ (accessed on 20 March 2020).
- Rubio-Marcos, F.; Fernandez, J.F.; Ochoa, D.A.; García, J.E.; Rojas-Hernandez, R.E.; Castro, M.; Ramajo, L. Understanding the piezoelectric properties in potassium-sodium niobate-based lead-free piezoceramics: Interrelationship between intrinsic and extrinsic factors. J. Eur. Ceram. Soc. 2017, 37, 3501–3509. [Google Scholar] [CrossRef]
- Song, H.-C.; Cho, K.-H.; Park, H.-Y.; Ahn, C.-W.; Nahm, S.; Uchino, K.; Park, S.-H.; Lee, H.-G. Microstructure and Piezoelectric Properties of (1−x)(Na0.5K0.5)NbO3–xLiNbO3 Ceramics. J. Am. Ceram. Soc. 2007, 90, 1812–1816. [Google Scholar] [CrossRef]
- Huo, S.; Yuan, S.; Tian, Z.; Wang, C.; Qiu, Y. Grain Size Effects on the Ferroelectric and Piezoelectric Properties of Na0.5K0.5NbO3 Ceramics Prepared by Pechini Method. J. Am. Ceram. Soc. 2012, 95, 1383–1387. [Google Scholar] [CrossRef]
- Shen, Z.-Y.; Zhen, Y.; Wang, K.; Li, J.-F. Influence of Sintering Temperature on Grain Growth and Phase Structure of Compositionally Optimized High-Performance Li/Ta-Modified (Na,K)NbO3 Ceramics. J. Am. Ceram. Soc. 2009, 92, 1748–1752. [Google Scholar] [CrossRef]
- Cheol Woo, A.; Chee Sung, P.; Dwight, V.; Sahn, N.; Dong Heon, K.; Kyoo Sik, B.; Shashank, P. Correlation between Phase Transitions and Piezoelectric Properties in Lead-Free (K,Na,Li)NbO3 –BaTiO3 Ceramics. Jpn. J. Appl. Phys. 2008, 47, 8880. [Google Scholar]
- Iamsasri, T.; Tutuncu, G.; Uthaisar, C.; Wongsaenmai, S.; Pojprapai, S.; Jones, J.L. Electric field-induced phase transitions in Li-modified Na0.5K0.5NbO3 at the polymorphic phase boundary. J. Appl. Phys. 2015, 117, 024101. [Google Scholar] [CrossRef]
- Ochoa, D.A.; Esteves, G.; Jones, J.L.; Rubio-Marcos, F.; Fernández, J.F.; García, J.E. Extrinsic response enhancement at the polymorphic phase boundary in piezoelectric materials. Appl. Phys. Lett. 2016, 108, 142901. [Google Scholar] [CrossRef]
- Moulson, A.J.; Herbert, J.M. Chapter 5 dielectrics and insulators. In Electroceramics: Materials, Properties, Applications, 2nd ed.; John Wiley & Sons: Chichester, UK, 2005; pp. 243–337. [Google Scholar]
- Wang, Z.; Huan, Y.; Feng, Y.; Qiu, Y.; Wei, T.; Zuo, R. Design of p-type NKN-based piezoelectric ceramics sintered in low oxygen partial pressure by defect engineering. J. Am. Ceram. Soc. 2020, in press. [Google Scholar] [CrossRef]
© 2020 by the authors. Licensee MDPI, Basel, Switzerland. This article is an open access article distributed under the terms and conditions of the Creative Commons Attribution (CC BY) license (http://creativecommons.org/licenses/by/4.0/).