The Physical and Optical Studies of Crystalline Silica Derived from the Green Synthesis of Coconut Husk Ash


 ,
,
Abstract
1. Introduction
2. Materials and Methods
3. Results
4. Conclusions
Author Contributions
Funding
Acknowledgments
Conflicts of Interest
References
- Ibrahim, H.M.M. Green synthesis and characterization of silver nanoparticles using banana peel extract and their antimicrobial activity against representative microorganisms. J. Radiat. Res. Appl. Sci. 2015, 8, 265–275. [Google Scholar] [CrossRef]
- Kumar, R.; Roopan, S.M.; Prabhakarn, A.; Khanna, V.G.; Chakroborty, S. Agricultural waste Annona squamosa peel extract: Biosynthesis of silver nanoparticles. Spectrochim. Acta Part A Mol. Biomol. Spectrosc. 2012, 90, 173–176. [Google Scholar] [CrossRef]
- Al-Kawaz, H.S.; Al-Mashhedy, L.A.M. Green synthesis of silver nanoparticles using Actinidia deliciosa extracts. Res. J. Pharm. Biol. Chem. Sci. 2016, 7, 2212–2223. [Google Scholar]
- Logeswari, P.; Silambarasan, S.; Abraham, J. Ecofriendly synthesis of silver nanoparticles from commercially available plant powders and their antibacterial properties. Sci. Iran. 2013, 20, 1049–1054. [Google Scholar]
- Dubey, S.P.; Lahtinen, M.; Sillanpää, M. Green synthesis and characterizations of silver and gold nanoparticles using leaf extract of Rosa rugosa. Colloids Surf. A Physicochem. Eng. Asp. 2010, 364, 34–41. [Google Scholar] [CrossRef]
- Kumar, V.; Yadav, S.K. Plant-mediated synthesis of silver and gold nanoparticles and their applications. J. Chem. Technol. Biotechnol. 2009, 84, 151–157. [Google Scholar] [CrossRef]
- Abdul, J.; Nuaman, R.; Aham, A. Biological synthesis of Titanium Dioxide nanoparticles by Curcuma longa plant extract and study its biological properties. World Sci. 2016, 49, 204–222. [Google Scholar]
- Okoronkwo, E.A.; Imoisili, P.E.; Olubayode, S.A.; Olusunle, S.O.O. Development of Silica Nanoparticle from Corn Cob Ash. Adv. Nanopart. 2016, 5, 135–139. [Google Scholar] [CrossRef]
- Anuar, M.F.; Fen, Y.W.; Zaid, M.H.M.; Matori, K.A.; Khaidir, R.E.M. Synthesis and structural properties of coconut husk as potential silica source. Results Phys. 2018, 11, 1–4. [Google Scholar] [CrossRef]
- Mupa, M.; Hungwe, C.B.; Witzleben, S.; Mahamadi, C.; Muchanyereyi, N. Extraction of silica gel from Sorghum bicolour (L.) moench bagasse ash. Afr. J. Pure Appl. Chem. 2015, 9, 12–17. [Google Scholar] [CrossRef]
- Mor, S.; Manchanda, C.K.; Kansal, S.K.; Ravindra, K. Nanosilica extraction from processed agricultural residue using green technology. J. Clean. Prod. 2017, 143, 1284–1290. [Google Scholar] [CrossRef]
- Vaibhav, V.; Vijayalakshmi, U.; Roopan, S.M. Agricultural waste as a source for the production of silica nanoparticles. Spectrochim. Acta Part A Mol. Biomol. Spectrosc. 2015, 139, 515–520. [Google Scholar] [CrossRef]
- Todkar, B.S.; Deorukhkar, O.A.; Deshmukh, S.M. Extraction of Silica from Rice Husk. Int. J. Eng. Res. Dev. 2016, 12, 69–74. [Google Scholar]
- Chakraverty, A.; Mishra, P.; Banerjee, H.D. Investigation of combustion of raw and acid-leached rice husk for production of pure amorphous white silica. J. Mater. Sci. 1988, 23, 21–24. [Google Scholar] [CrossRef]
- Zulfiqar, U.; Subhani, T.; Wilayat Husain, S. Towards tunable size of silica particles from rice husk. J. Non. Cryst. Solids 2015, 429, 61–69. [Google Scholar] [CrossRef]
- Della, V.P.; Kühn, I.; Hotza, D. Rice husk ash as an alternate source for active silica production. Mater. Lett. 2002, 57, 818–821. [Google Scholar] [CrossRef]
- Worathanakul, P.; Payubnop, W.; Muangpet, A. Characterization for Post-treatment Effect of Bagasse Ash for Silica Extraction. Int. J. Chem. Mol. Nucl. Mater. Metall. Eng. 2009, 3, 339–341. [Google Scholar]
- Vadery, V.; Narayanan, B.N.; Ramakrishnan, R.M.; Kochiyil, S.; Sugunan, S.; Narayanan, D.P. Room temperature production of jatropha biodiesel over coconut husk ash. Energy 2014, 70, 588–594. [Google Scholar] [CrossRef]
- Omar, N.A.S.; Fen, Y.W.; Matori, K.A.; Zaid, M.H.M.; Norhafizah, M.R.; Nurzilla, M.; Zamratul, M.I.M. Synthesis and optical properties of europium doped zinc silicate prepared using low cost solid state reaction method. J. Mater. Sci. Mater. Electron. 2016, 27, 1092–1099. [Google Scholar] [CrossRef]
- Omar, N.A.S.; Fen, Y.W.; Matori, K.A. Photoluminescence properties of Eu3+-doped low cost zinc silicate based glass ceramics. Optik 2016, 127, 3727–3729. [Google Scholar] [CrossRef]
- Pa, F.C.; Chik, A.; Bari, M.F. Palm Ash as an Alternative Source for Silica Production. MATEC Web Conf. 2016, 78, 01062. [Google Scholar] [CrossRef]
- Norsuraya, S.; Fazlena, H.; Norhasyimi, R. Sugarcane bagasse as a renewable source of silica to synthesize Santa Barbara Amorphous-15 (SBA-15). Procedia Eng. 2016, 148, 839–846. [Google Scholar] [CrossRef]
- Velmurugan, P.; Shim, J.; Lee, K.J.; Cho, M.; Lim, S.S.; Seo, S.K.; Cho, K.M.; Bang, K.S.; Oh, B.T. Extraction, characterization, and catalytic potential of amorphous silica from corn cobs by sol-gel method. J. Ind. Eng. Chem. 2015, 29, 298–303. [Google Scholar] [CrossRef]
- Matori, K.A.; Haslinawati, M.M.; Wahab, Z.A.; Ban, T.K. Producing Amorphous White Silica from Rice Husk. J. Basic Appl. Sci. 2009, 1, 512–515. [Google Scholar]
- Khaidir, R.E.M.; Fen, Y.W.; Zaid, M.H.M.; Matori, K.A.; Omar, N.A.S.; Anuar, M.F.; Wahab, S.A.A.; Azman, A.Z.K. Optical band gap and photoluminescence studies of Eu 3+ -doped zinc silicate derived from waste rice husks. Optik 2019, 182, 486–495. [Google Scholar] [CrossRef]
- Wahab, S.A.A.; Matori, K.A.; Aziz, S.H.A.; Zaid, M.H.M.; Kechik, M.M.A.; Azman, A.Z.K.; Khaidir, R.E.M.; Khiri, M.Z.A.; Effendy, N. Synthesis of cobalt oxide Co3O4 doped zinc silicate based glass-ceramic derived for LED applications. Optik 2019, 179, 919–926. [Google Scholar] [CrossRef]
- Agbagla-Dohnani, A.; Nozie, P.; Cle, G. In sacco degradability, chemical and morphological composition of 15 varieties of European rice straw. Anim. Feed Sci. Technol. 2001, 94, 15–27. [Google Scholar] [CrossRef]
- Hessien, M.M.; Rashad, M.M.; Zaky, R.R.; Abdel-aal, E.A.; El-barawy, K.A. Controlling the synthesis conditions for silica nanosphere from semi-burned rice straw. Mater. Sci. Eng. B 2009, 162, 14–21. [Google Scholar] [CrossRef]
- Alias, N.; Ibrahim, N.; Hamid, M.K.A.; Hasbullah, H.; Ali, R.R.; Sadikin, A.N.; Asli, U.A. Thermogravimetric Analysis of Rice Husk and Coconut Pulp for Potential Biofuel Production by Flash Pyrolysis. Malays. J. Anal. Sci. 2014, 18, 705–710. [Google Scholar]
- Kausar, A.; Bhatti, H.N.; MacKinnon, G. Equilibrium, kinetic and thermodynamic studies on the removal of U(VI) by low cost agricultural waste. Colloids Surf. B Biointerfaces 2013, 111, 124–133. [Google Scholar] [CrossRef]
- Khan, G.M.A.; Alam, S.; Arifuzzaman Khan, G.M.; Alam, M.S.; Terano, M. Thermal characterization of chemically treated coconut husk fibre. Indian J. Fibre Text. Res. 2012, 37, 20–26. [Google Scholar]
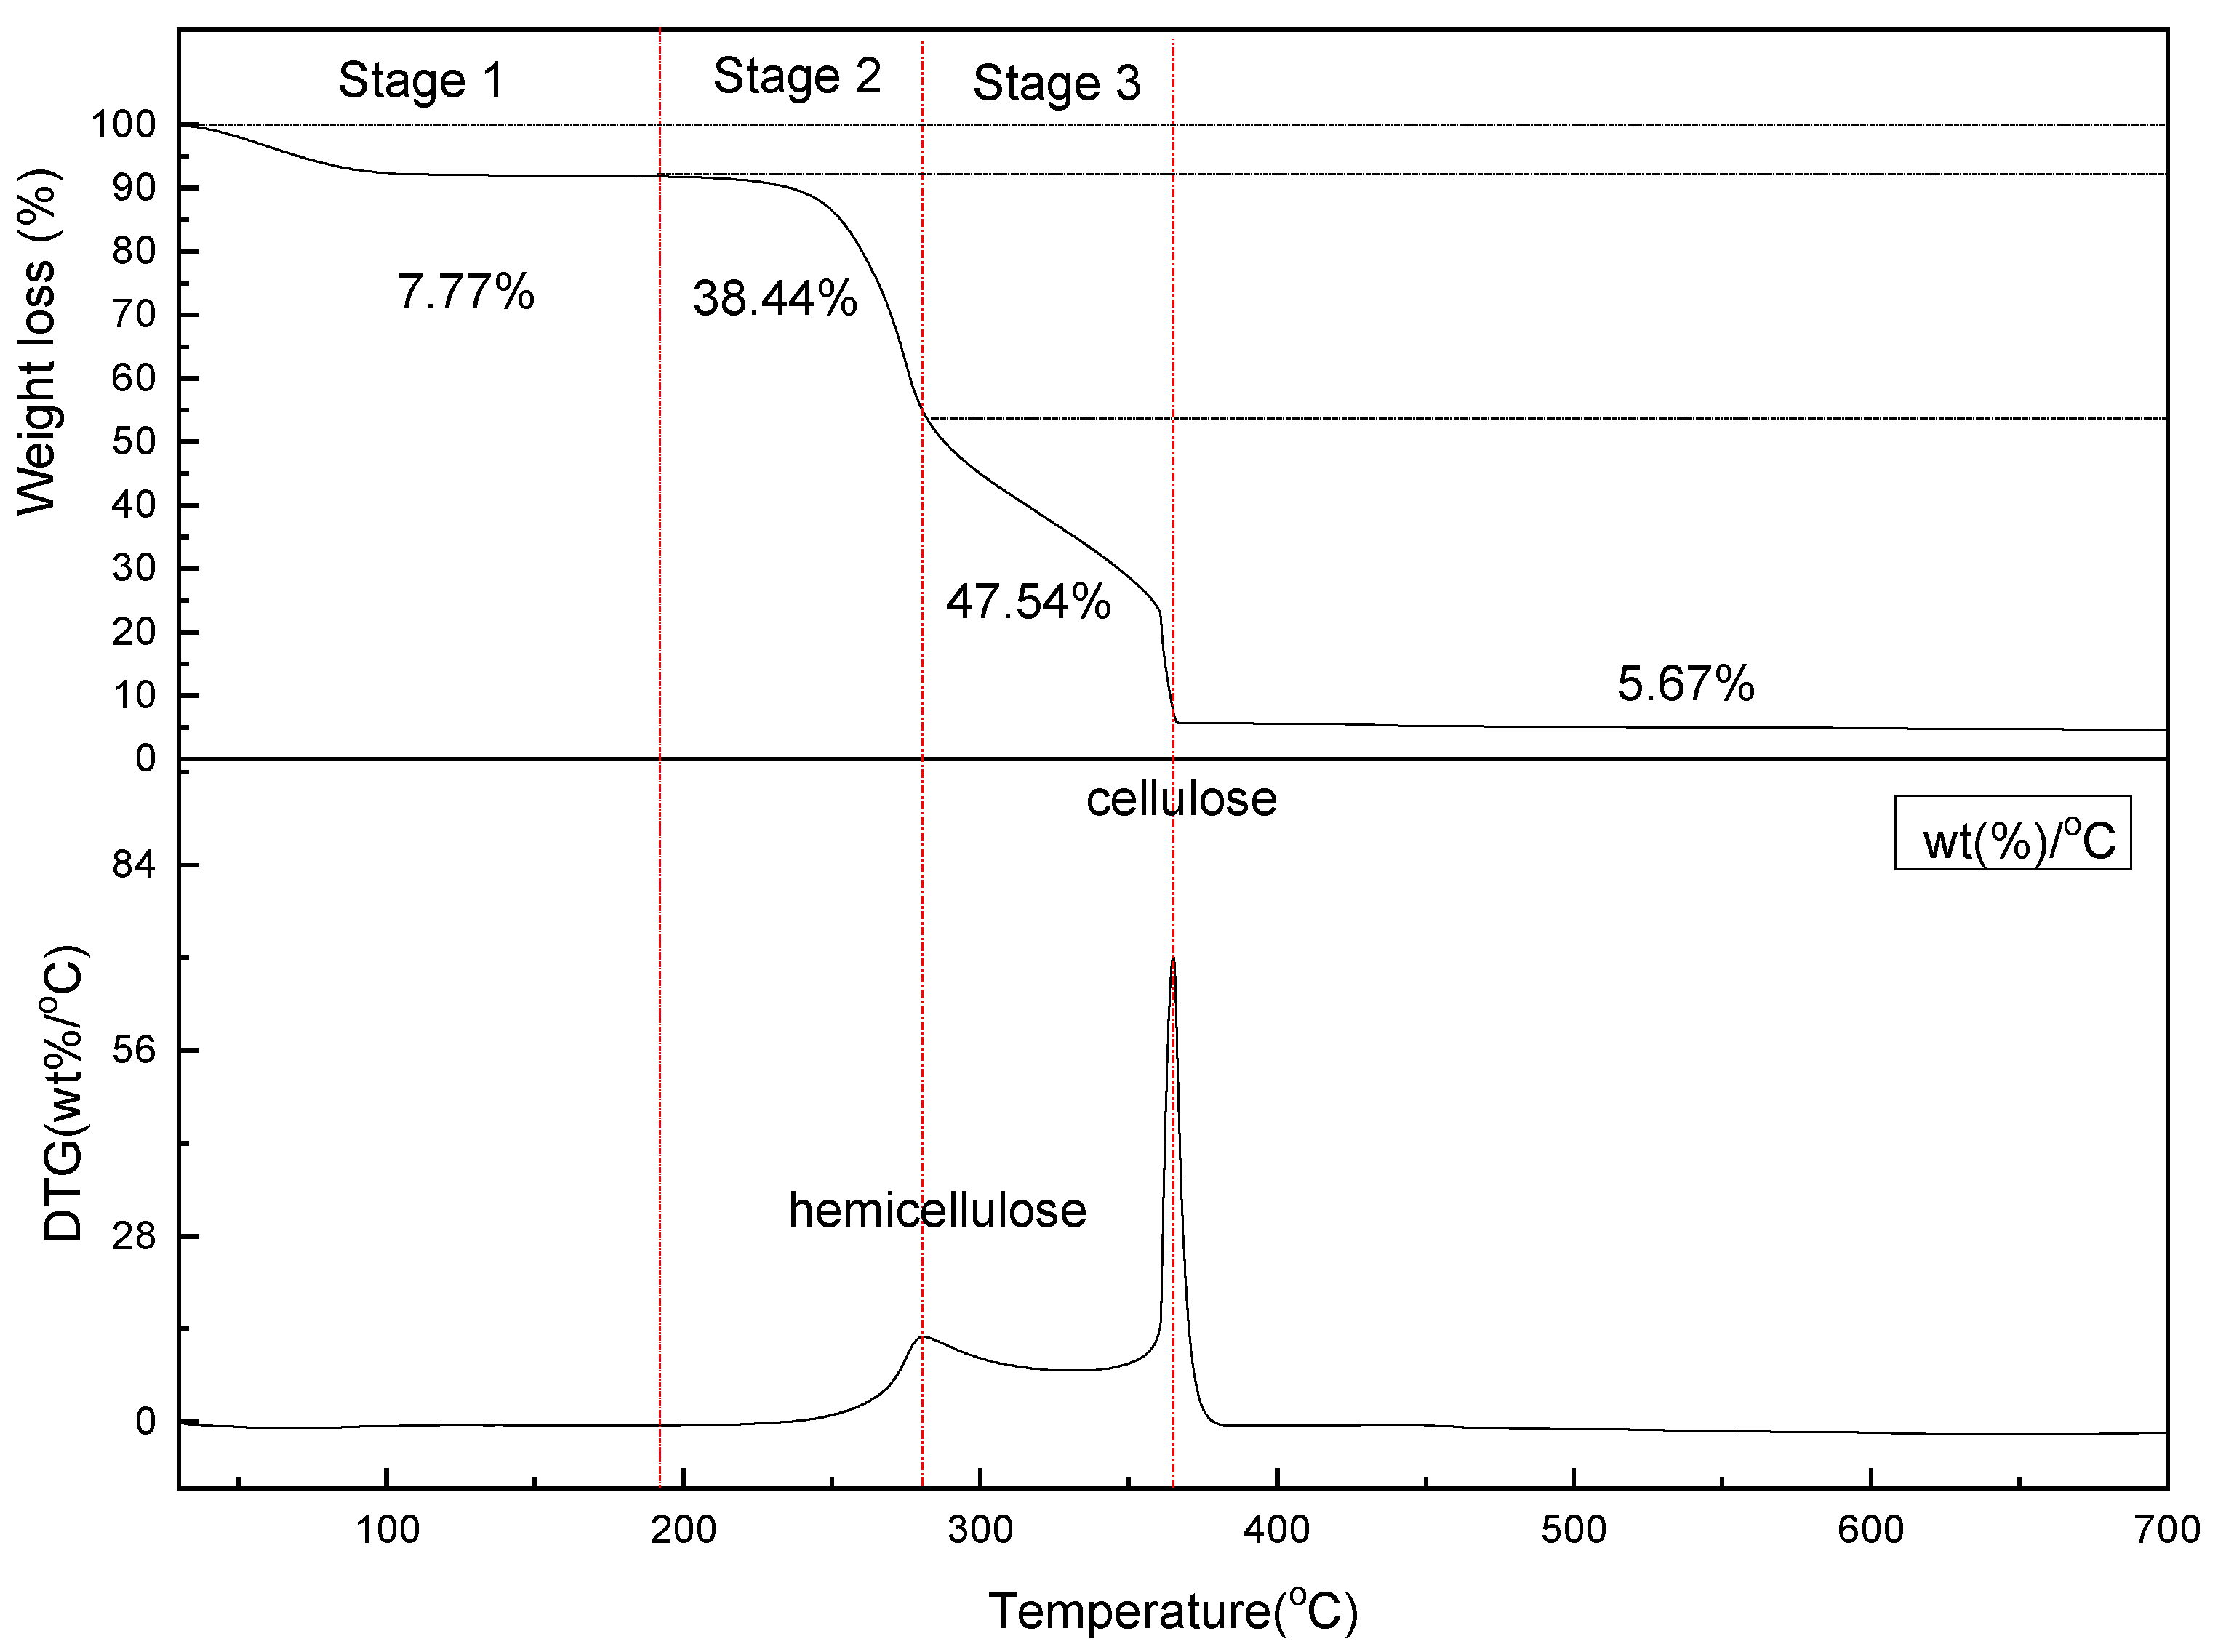
- Yang, H.; Yan, R.; Chen, H.; Lee, D.H.; Zheng, C. Characteristics of hemicellulose, cellulose and lignin pyrolysis. Fuel 2007, 86, 1781–1788. [Google Scholar] [CrossRef]
- Emdadi, Z.; Asim, N.; Yarmo, M.A.; Sopian, K. Effect of Chemical Treatments on Rice Husk (RH) Water Absorption Property. Int. J. Chem. Eng. Appl. 2015, 6, 273–276. [Google Scholar] [CrossRef]
- Chen, W.H.; Lu, K.M.; Tsai, C.M. An experimental analysis on property and structure variations of agricultural wastes undergoing torrefaction. Appl. Energy 2012, 100, 318–325. [Google Scholar] [CrossRef]
- Umeda, J.; Kondoh, K. High-purity amorphous silica originated in rice husks via carboxylic acid leaching process. J. Mater. Sci. 2008, 43, 7084–7090. [Google Scholar] [CrossRef]
- Chandrasekhar, S.; Pramada, P.N.; Praveen, L. Effect of organic acid treatment on the properties of rice husk silica. J. Mater. Sci. 2005, 40, 6535–6544. [Google Scholar] [CrossRef]
- Bansal, M.; Garg, U.; Singh, D.; Garg, V.K. Removal of Cr(VI) from aqueous solutions using pre-consumer processing agricultural waste: A case study of rice husk. J. Hazard. Mater. 2009, 162, 312–320. [Google Scholar] [CrossRef]
- Marin, D.C.; Vecchio, A.; Ludueña, L.N.; Fasce, D.; Alvarez, V.A.; Stefani, P.M. Revalorization of rice husk waste as a source of cellulose and silica. Fibers Polym. 2015, 16, 285–293. [Google Scholar] [CrossRef]
- Daffalla, S.B.; Mukhtar, H.; Shaharun, M.S. Characterization of adsorbent developed from rice husk: Effect of surface functional group on phenol adsorption. J. Appl. Sci. 2010, 10, 1060–1067. [Google Scholar] [CrossRef]
- Faizul, C.P.; Chik, A.; Bari, M.F.; Noorina, H.J. Extraction of Silica from Palm Ash Using Organic Acid Leaching Treatment. Key Eng. Mater. 2013, 594–595, 329–333. [Google Scholar] [CrossRef]
- Tauc, J.; Grigorovici, R.; Vancu, A. Optical Properties and Electronic Structure of Amorphous Germanium. Phys. Status Solidi 1966, 15, 627–636. [Google Scholar] [CrossRef]
- Calabrese, E.; Fowler, W.B. Electronic energy-band structure of a quartz. Phys. Rev. B 1978, 18, 2888–2896. [Google Scholar] [CrossRef]
- Chelikowsky, R.J.; Schluter, M. Electron states in a~quartz: A self-consistent pseufiopotential calculation. Phys. Rev. B 1977, 15, 4020–4029. [Google Scholar] [CrossRef]
- Ramos, L.E.; Furthmuller, J.; Bechstedt, F. Quasiparticle band structures and optical spectra of B-cristobalite SiO2. Phys. Rev. B 2004, 69, 1–8. [Google Scholar] [CrossRef]


| Elements (Oxides) | Percentage Composition (%) | |||
|---|---|---|---|---|
| 500 °C | 600 °C | 700 °C | After Acid Treatment | |
| SiO2 | 8.09 | 11.65 | 9.24 | 91.76 |
| CaO | 27.93 | 29.71 | 31.10 | 0.71 |
| K2O | 19.85 | 18.32 | 18.40 | 0.96 |
| Al2O3 | 0.76 | 0.36 | 0.84 | 4.68 |
| SO3 | 3.12 | 2.50 | 2.67 | 0.42 |
| Fe2O3 | 1.09 | 0.40 | 0.89 | 0.25 |
| P2O5 | 0.27 | 0.08 | 0.06 | 0.99 |
| Cl | 37.28 | 36.85 | 36.17 | 0.00 |
| Others | 1.61 | 0.13 | 0.63 | 0.23 |
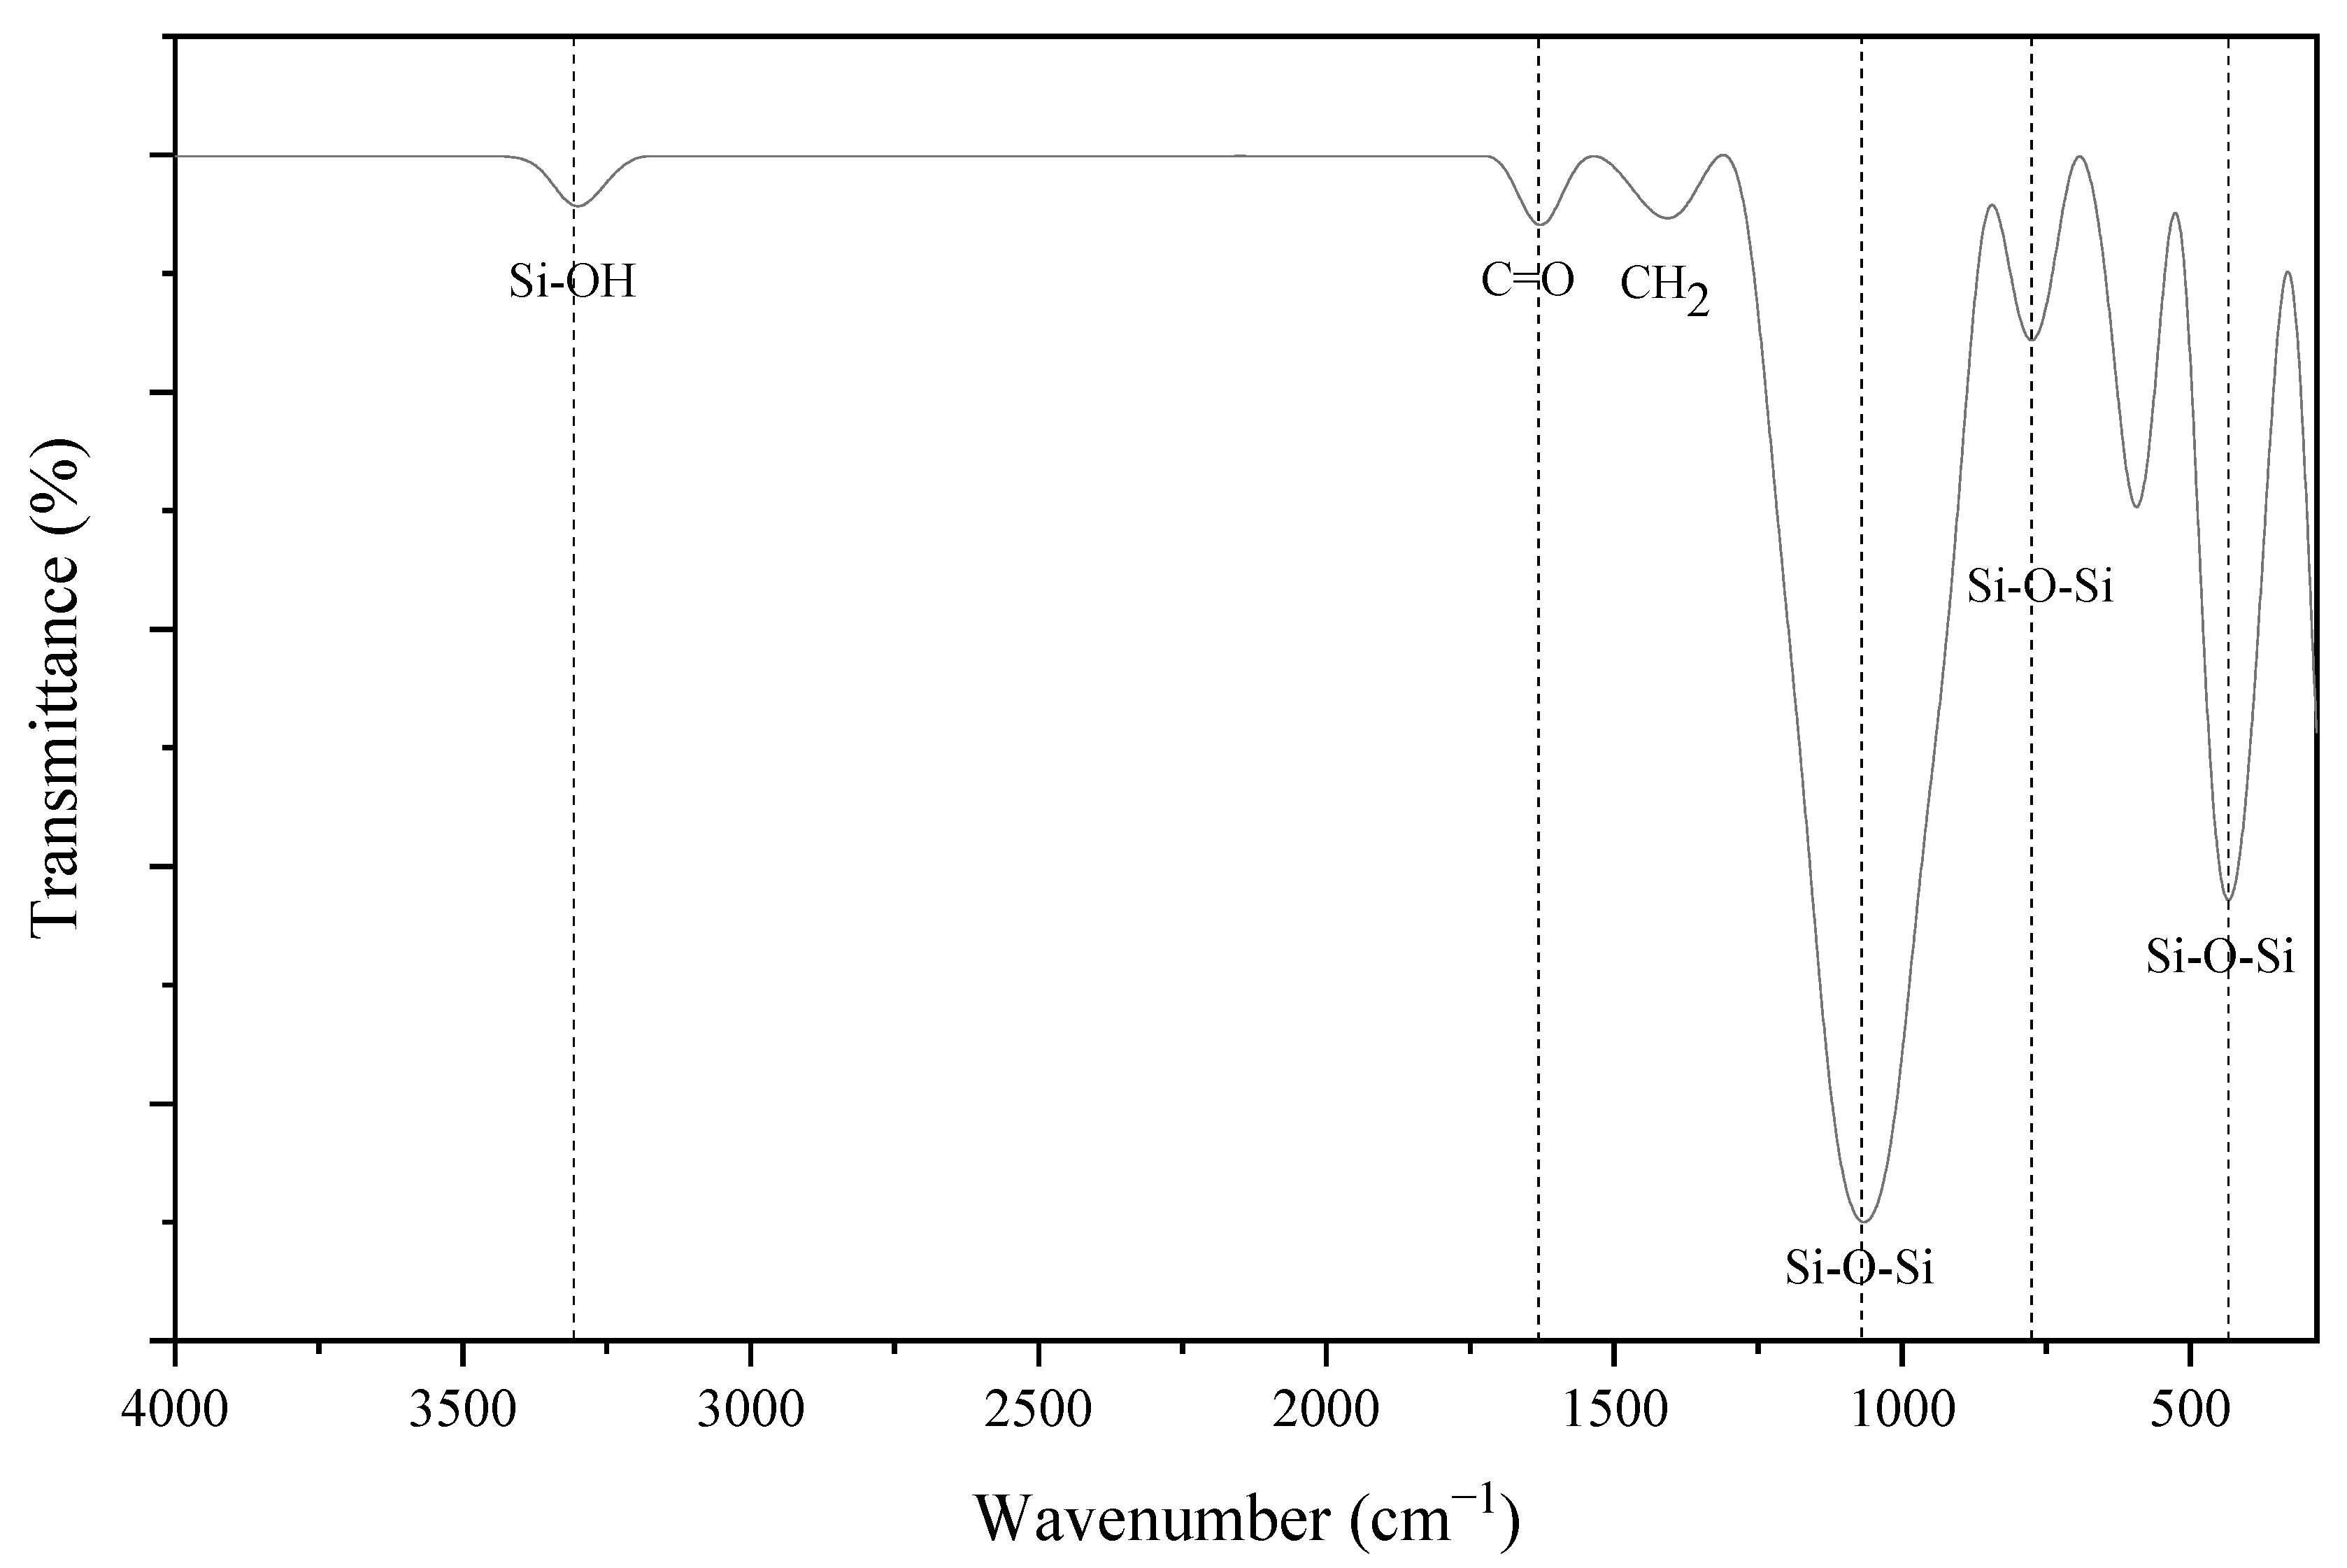
| Wavenumber (cm−1) | Functional Group |
|---|---|
| 432.98 | Si-O-Si bending vibration |
| 774.85 | Si-O-Si stretch vibration |
| 1066.15 | Si-O-Si stretching vibration |
| 1407.40 | CH2 strain |
| 1628.30 | C=O |
| 3300.23 | Si-OH |
© 2020 by the authors. Licensee MDPI, Basel, Switzerland. This article is an open access article distributed under the terms and conditions of the Creative Commons Attribution (CC BY) license (http://creativecommons.org/licenses/by/4.0/).
Share and Cite
Anuar, M.F.; Fen, Y.W.; Zaid, M.H.M.; Matori, K.A.; Khaidir, R.E.M. The Physical and Optical Studies of Crystalline Silica Derived from the Green Synthesis of Coconut Husk Ash. Appl. Sci. 2020, 10, 2128. https://doi.org/10.3390/app10062128
Anuar MF, Fen YW, Zaid MHM, Matori KA, Khaidir REM. The Physical and Optical Studies of Crystalline Silica Derived from the Green Synthesis of Coconut Husk Ash. Applied Sciences. 2020; 10(6):2128. https://doi.org/10.3390/app10062128
Chicago/Turabian StyleAnuar, Muhammad Fahmi, Yap Wing Fen, Mohd Hafiz Mohd Zaid, Khamirul Amin Matori, and Rahayu Emilia Mohamed Khaidir. 2020. "The Physical and Optical Studies of Crystalline Silica Derived from the Green Synthesis of Coconut Husk Ash" Applied Sciences 10, no. 6: 2128. https://doi.org/10.3390/app10062128
APA StyleAnuar, M. F., Fen, Y. W., Zaid, M. H. M., Matori, K. A., & Khaidir, R. E. M. (2020). The Physical and Optical Studies of Crystalline Silica Derived from the Green Synthesis of Coconut Husk Ash. Applied Sciences, 10(6), 2128. https://doi.org/10.3390/app10062128