Article

Experimental Evaluation of Distortion in Amplitude Modulation Techniques for Parametric Loudspeakers

1
Acoustics Group, Institute for Advanced Materials and Mathematics—INAMAT, Universidad Pública de Navarra, 31006 Pamplona, Spain
2
UpnaLab, Institute of Smart Cities—ISC, Universidad Pública de Navarra, 31006 Pamplona, Spain
*
Author to whom correspondence should be addressed.
Appl. Sci. 2020, 10(6), 2070; https://doi.org/10.3390/app10062070
Submission received: 19 February 2020 / Revised: 13 March 2020 / Accepted: 16 March 2020 / Published: 19 March 2020
(This article belongs to the Section Acoustics and Vibrations)

Abstract

:
Parametric loudspeakers can generate a highly directional beam of sound, having applications in targeted audio delivery. Audible sound modulated into an ultrasonic carrier will get self-demodulated along the highly directive beam due to the non-linearity of air. This non-linear demodularization should be compensated to reduce audio distortion, different amplitude modulation techniques have been developed during the last years. However, some studies are only theoretical whereas others do not analyze the audio distortion in depth. Here, we present a detailed experimental evaluation of the frequency response, harmonic distortion and intermodulation distortion for various amplitude modulation techniques applied with different indices of modulation. We used a simple method to measure the audible signal that prevents the saturation of the microphones when the high levels of the ultrasonic carrier are present. This work could be useful for selecting predistortion techniques and indices of modulation for regular parametric arrays.

1. Introduction

Parametric loudspeakers exploit the non-linear behavior of acoustic waves travelling through air to generate audible sound along a highly directive path due to the self-demodulation property of finite-amplitude ultrasonic waves [1]. The audible components are more directional than sounds produced by conventional loudspeakers, hence they can find application in contexts where audio must be targeted precisely in space. The directional nature of parametric speakers has been used for directing users towards specific objects [2], and a hand-held directional speaker was used to provide targeted information about the objects pointed by the user [3]. Additionally, sound landscapes in which the audience receives sound stimuli from specific locations can be created with directional speakers [4]. In general, directional speakers enable the targeted delivery of audio for applications in advertising, dual-language systems or notifications [5].
In 1963, Westervelt [6] theoretically described the generation of difference frequency waves from two high-frequency collimated beams referred to as primary waves. Berktay [7] extended this approach and evaluated some possible applications in underwater acoustic transmission. His analysis was not limited to two primary waves and could be applied to a single self-demodulated primary wave. If the primary wave p 1 is a generic carrier modulated in amplitude such that:
p 1 ( t ) = E ( t ) P 0 s i n ω c t ,
where P 0 and ω c are the amplitude and the angular frequency of the carrier, and E ( t ) is the envelope function, then Berktay’s farfield solution predicts a self-demodulated wave p 2 proportional to the second time derivative of the square of the modulation envelope:
p 2   ( t ) P 0 2 2 E 2 ( t ) / t 2 ,
This dependence implies that the self-demodulated wave ( p 2 ) is not linear to E ( t ) and that it will suffer from high levels of distortion due to the generated harmonics and a strong low-pass equalization.
Various preprocessing techniques have been developed to reduce distortion using different modulations of the envelope E ( t ) . Existing experimental measurements [8,9,10] are mostly based on the total harmonic distortion or at certain representative frequencies, which may not completely capture the non-linear response of the speakers. Here, we present an extensive comparison of the different amplitude modulation techniques under various modulation indices in terms of frequency response, harmonic distortion and intermodulation distortion. This study analyzes the intermodulation distortion and the harmonics distortions of the different amplitude modulation techniques for various modulation indices. Furthermore, the analysis is split by order. To avoid the presence of spurious signal in the measurements, our method previously selects a dynamic microphone with limited frequency response.
In the Section 2 we describe: the experimental setup, the measurement procedure, the method employed to measure audible sound in the presence of high-levels of ultrasonic carrier and the evaluated amplitude modulation techniques. In the Section 3, we report and analyze the response and distortion of the different modulation techniques and indices. We conclude by summarizing the results and their potential implications.

2. Materials and Methods

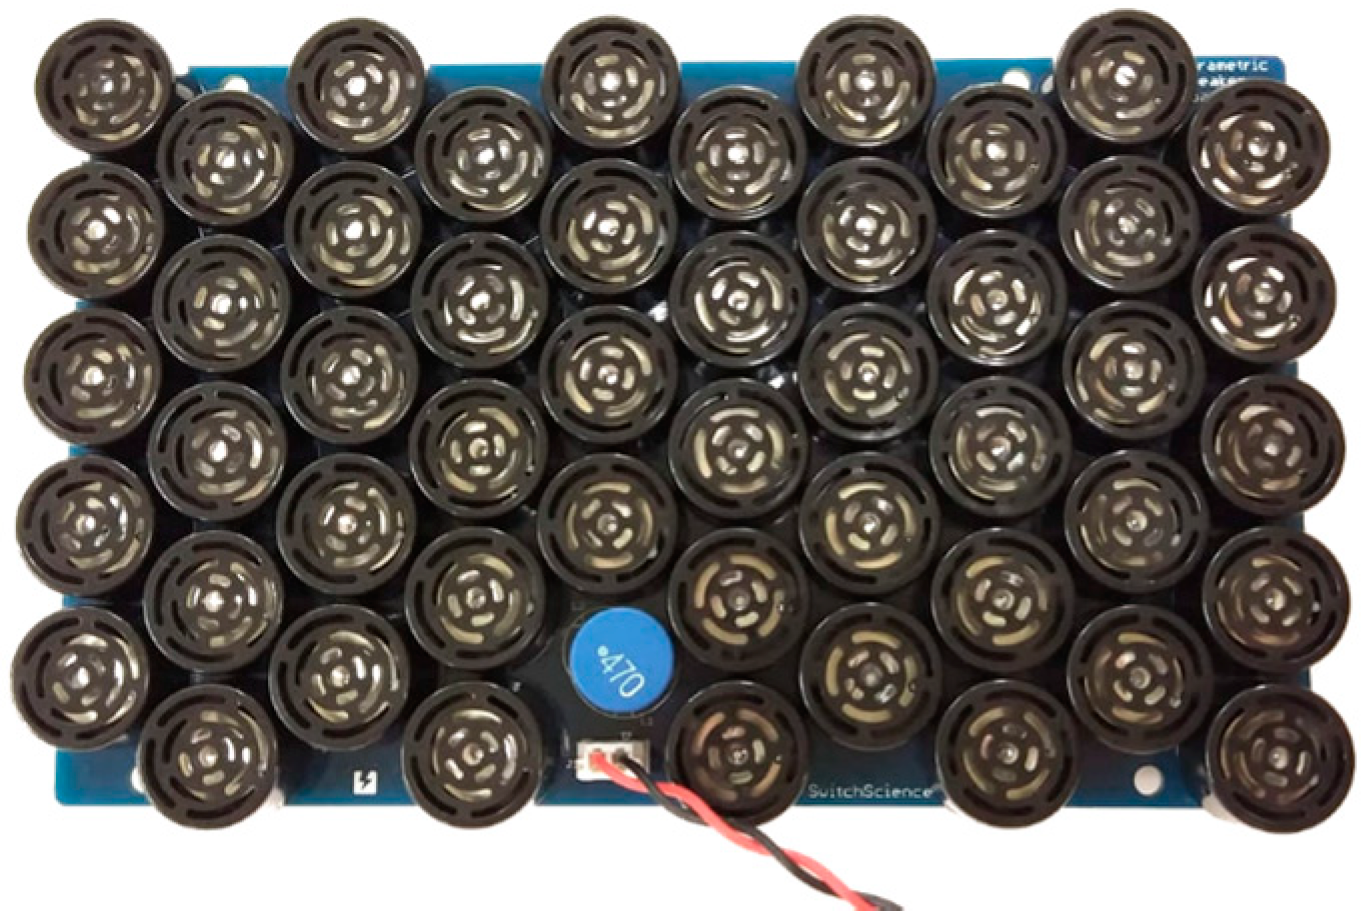
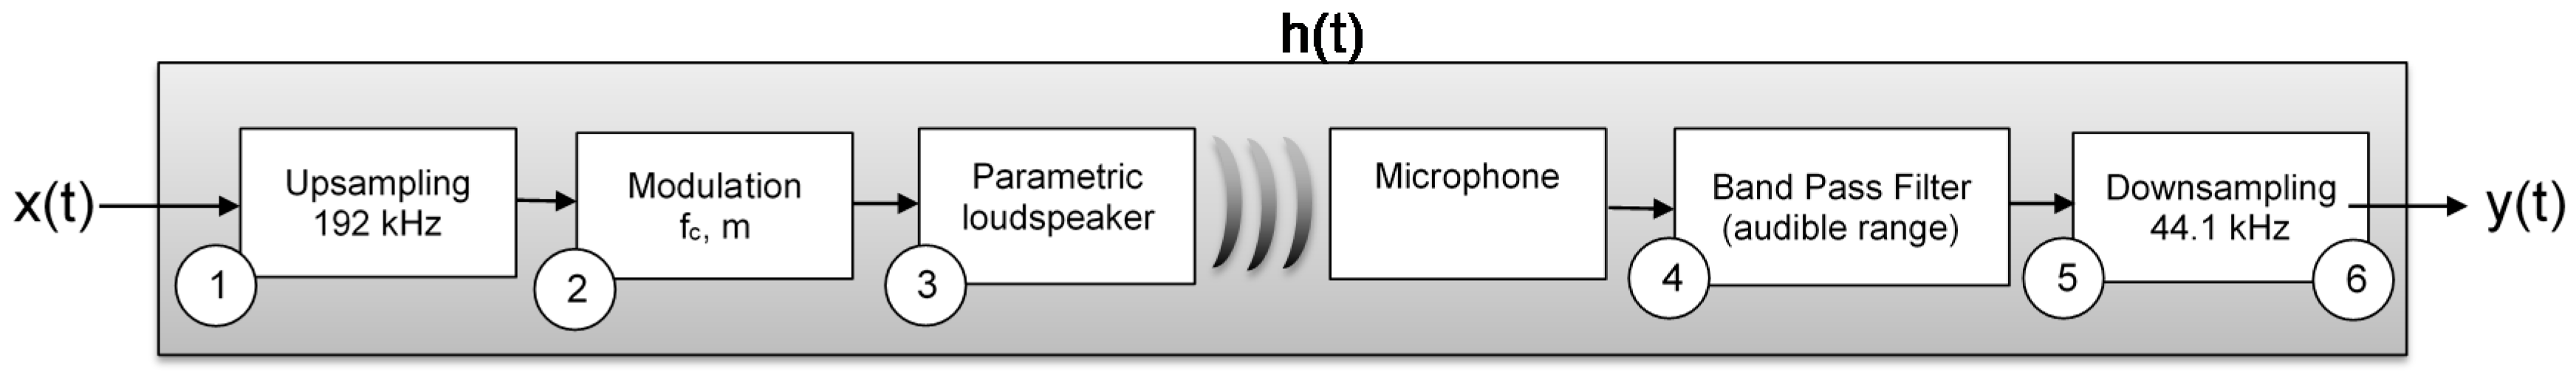
2.1. Experimental Setup

A PC (Intel Xeon with 16Gb of RAM, Intel Corporation, Santa Clara, California, USA) was connected to the audio output card (Focusrite Scarlett 18i20, Focusrite plc. High Wycombe, Buckinghamshire, England) for general audio input/output. For emitting audible sound, the card output was connected to an auto-amplified monitor (Neumann KH120A, Georg Neumann GmbH, Berlin, Germany). For the ultrasonic output, the card was connected into an amplifier (Akozon DC12-24V 2 × 100 W power amplifier, 14-100 KHz, Akozon, Shenzhen, Guangdong, China) and then into a parametric array shown in Figure 1 (array SSCI-018425 made of 49 transducers, Switch Science Inc., Tokyo, Japan). The largest output voltage amplitude of the amplifier was 24 Vpp, which was sufficient and within the normal operating voltage of the transducers forming the array.
For receiving audio, a microphone (different models were employed) was placed 2 meters away from the sound source. Except for the GRAS microphone, which needed the Norsonic type 335 front-end for signal conditioning, the microphones were directly connected to the input of the sound card. The measurements were taken in the listening room of an acoustics laboratory with different absorbent materials: foam, melamine foam and regenerated cotton bonded with thermosetting resin. The reverberation times were less than 0.25 s from the third octave band of 320 Hz.

2.2. Measurement Procedure

The frequency response of a loudspeaker describes the range of audible frequencies that it can reproduce. For conventional devices, it is usually measured in an anechoic chamber where the loudspeaker under test is excited by a sweep signal x ( t ) . This sweep typically ranges from 20 Hz to 20 kHz. The signal emitted by the speaker was then recorded with a flat response microphone to obtain the signal y ( t ) . By means of FFT techniques, the impulse response h ( t ) and its corresponding transfer function were obtained:
h ( t ) = i f f t ( f f t ( y ( t ) ) f f t ( x ( t ) ) ) .
For parametric loudspeakers, the process encompasses more stages. First, an upsampling of the excitation signal was performed to avoid aliasing when moving to the ultrasonic range. Then, the chosen predistortion technique was applied to the signal and emitted through the speaker. Afterwards, a microphone recorded the signal and a bandpass filter was applied. Subsequent downsampling was used to obtain the signal in the audible range. This signal was compared with the original excitation signal. This process is summarized in Figure 2. The spectral representation of the signal at each step of the process can be found in Supplementary Figure S2.
The International Standard IEC 60268-21 [11] was approved in 2018 and specifies measurement methods to evaluate the transfer behavior of a device under test (DUT). It can be applied to electroacoustic transducers, active and passive sound systems, amplified speakers, televisions, portable audio devices, car sound systems or professional equipment. Therefore, the DUT can contain components that perform signal processing before the transduction of the electrical signal into an acoustical output signal radiated by the passive actuators. This capability makes this standard suitable for evaluating parametric loudspeakers.
All transfer functions and distortion measurements described in the paper have been performed following this standard. Some of the measurements and post-processing has been carried out with the help of the ITA-Toolbox, an open source toolbox for Matlab [12].

2.3. Audio Measurements in the Presence of a High-Level Ultrasonic Carrier

The high level of the ultrasonic primary wave encumbers the measurement of the demodulated audible secondary signal. Carrier levels above 120 dB are common even at distances of 2 meters and generate spurious signals in the receiving system [13]. These spurious signals are not perceived by the human ear and thus it is desirable to filter them out.
Some methods proposed to avoid the appearance of the spurious signal are based on the use of acoustic filters [14,15,16,17,18,19,20,21] made of a thin plastic film or phononic crystals with a bandgap at the carrier frequency. These filters are mounted in front of the receiving transducer and reduce the amplitude of the primary wave. However, the audible frequencies may also be affected by this method, especially the high ones. The response in the audible range can be estimated without using filters by measuring in the secondary lobes, but the position of the lobes varies with the frequency. Recent methods to reduce the spurious signal based on phase-cancellation [22,23] are only suitable for axial measurements.
Other techniques use a condenser microphone orthogonal to the incident wave where its ultrasonic sensitivity is lower [24]. Thereby, the amplitude of the recorded ultrasonic waves is reduced while preserving the sound level in the audible range. This effectively prevents the generation of spurious signals.
Based on the previous principle, we explored the use of a microphone with reduced ultrasonic sensitivity but good audio performance. Two condenser (GRAS AC40 – GRO, G.R.A.S. Sound & Vibration, Holte, Denmark, Behringer ECM8000 - BHO, Behringer International GmbH, Willich, Germany) and three dynamic (Shure SM57 - SH7, Shure Inc. Niles, Illinois, USA, Behringer XM8500 - BHX and BCT MD1 – BCT, Behringer International GmbH, Willich, Germany) microphones were selected for the study. Detailed specification can be found in Supplementary Table SI. The frequency response of the microphones in the audible range was measured by emitting sweeps with a monitor (Neumann KH120A, Georg Neumann GmbH, Berlin, Germany) with flat response (±2 dB between 54 Hz and 20 kHz) and is shown in Figure 3a.
The same procedure was repeated in the ultrasonic range using the parametric speaker as an emitter. The responses are shown in Figure 3b. The response of the GRO microphone (i.e., upper curve) can be used as an approximation of the normalized frequency response of the ultrasonic emitter measured at 2 m since this microphone had the flattest ultrasonic response. The response of the parametric speaker peaked at 40.9 kHz, with a −3 dB bandwidth of 1.5 kHz and a −6 dB bandwidth of 3.9 kHz. This reduced bandwidth is the cause of a spurious signal being typically smaller at high frequencies. The progressive reduction of the levels at the sidebands, which are used to emit the modulated audio, leads to a partial reduction of the non-linearity acquired by the microphones.
The dynamic microphones (i.e., SH7, BHX and BCT) registered a carrier level reduction of 30 dB. This means that the recorded audio is less likely to be affected by distortion artifacts generated from the high levels of pressure. This effect is illustrated in Figure 4, which shows the frequency responses obtained with different microphones when the ultrasonic array is emitting with a conventional AM modulation (i.e., DSBAM, described in further sections). For the two condenser microphones, GRO and BHO, the spurious signal was affecting the recordings along most of the frequency range. This was not the case when using the dynamic microphones. Their experimental curves show good agreement with the theoretical curves of a parametric loudspeaker. These curves were proportional to f n , where f is the frequency and n is the ratio between diffraction length and absorption length [16]. Diffraction length is the area of the transmitter divided by the wavelength at the primary frequencies and absorption length is the inverse of the nominal absorption coefficient at the primary frequencies. n = 2 corresponds to the Westervelt solution [6] for a large ratio, n = 1 is a good approximation to the solution obtained by Berktay and Leahy [25] for a small ratio. In practice, the curves lie somewhere between n = 1 and n = 2 [26]. In our experiments, the response of the dynamic microphones was in good agreement with the curve f 1.6 from approximately 500 Hz–4 kHz.
The BHX microphone is considered suitable for evaluating predistortion techniques in view of the results shown in Figure 3 and Figure 4 as well as the usable range of frequencies of the ultrasonic speaker. The rest of the measurements detailed in this article are performed with this microphone.

2.4. Preprocessing Techniques

Amplitude modulation (AM) is the most common preprocessing technique in parametric loudspeakers. It consists of changing the amplitude of a relatively high-frequency carrier of angular frequency ω c according to the amplitude of a modulating signal. The envelope of the carrier wave is weighted with the desired audible sound signal s ( t ) .
Double side band amplitude modulation (DSBAM) was the original method used by Yoneyama [27] to produce wideband audio with parametric loudspeakers. The modulated ultrasonic wave p ( t ) is expressed as
p D S B A M ( t ) = [ 1 + m   s ( t ) ] s i n ( ω c t ) ,
where m is the modulation index and has values ranging from 0 to 1. DSBAM is simple to implement and requires low computational resources. In addition, it generates a louder audible signal since it uses both sidebands. However, due to the tone difference between the upper (USB) and lower band (LSB), the second harmonic is also louder.
A simple solution to reduce the second harmonic is to transfer the energy to a single band as in the single side band amplitude modulations (SSBAM) [28], which are named LSBAM for the lower or USBAM for the upper sideband. This modulation can be obtained by using high-pass, low-pass filter or adding a quadrature term to the conventional AM. For the latter, a Hilbert filter is needed to convert the modulating signal s ( t ) into its orthogonal counterpart s ^ ( t ) . The modulations are expressed as:
p L S B A M ( t ) = [ 1 + m s ( t ) ] s i n ( ω c t ) m s ^ ( t ) c o s ( ω c t ) ,
p U S B A M ( t ) = [ 1 + m s ( t ) ] s i n ( ω c t ) + m s ^ ( t ) c o s ( ω c t ) .
Inspired by Berktay’s solution, a square root operation was added to the AM modulation, leading to the so-called square root amplitude modulation (SRAM):
p S R A M ( t ) = [ 1 + m s ( t ) ] s i n ( ω c t ) .
This procedure theoretically removes distortion but introduces infinite harmonics of the original signal s ( t ) . Therefore, the resulting reduction in the distortion is limited by the bandwidth of the ultrasonic emitters [29].
A set of preprocessing techniques based on quadrature amplitude modulation has been proposed to deal with the bandwidth limitation of the emitters [30]. This class of preprocessing techniques referred to as modified amplitude modulation (MAM) can be adapted to the available bandwidth using different orders of the Taylor expansion for the distortion term modulated by the orthogonal carrier. The modulated ultrasonic waves for the first two orders are described as:
p M A M 1 ( t ) = [ 1 + m s ( t ) ] s i n ( ω c t ) + [ 1 1 2 m 2 s 2 ( t ) ] c o s ( ω c t ) ,
p M A M 2 ( t ) = [ 1 + m s ( t ) ] s i n ( ω c t ) + [ 1 1 2 m 2 s 2 ( t ) 1 8 m 4 s 4 ( t ) ] c o s ( ω c t ) .
Due to the low-cost of its implementation, FM-based methods have also been analyzed empirically [31]. However, demodulating FM waves causes higher harmonic distortions at conventional sound pressure levels. There are combined methods that achieve higher sound pressure levels at lower frequencies [32]. We kept the scope of the paper to amplitude modulation techniques, but frequency modulation is a promising technique that could be included in future studies.
Double side band amplitude modulation (DSBAM), lower side band amplitude modulation (LSBAM), upper side band amplitude modulation (USBAM), square root amplitude modulation (SRAM), modified amplitude modulation 1 (MAM1) and 2 (MAM2) can be found as block implementations in Supplementary Figure S1. These preprocessing techniques were implemented in Matlab.

3. Results

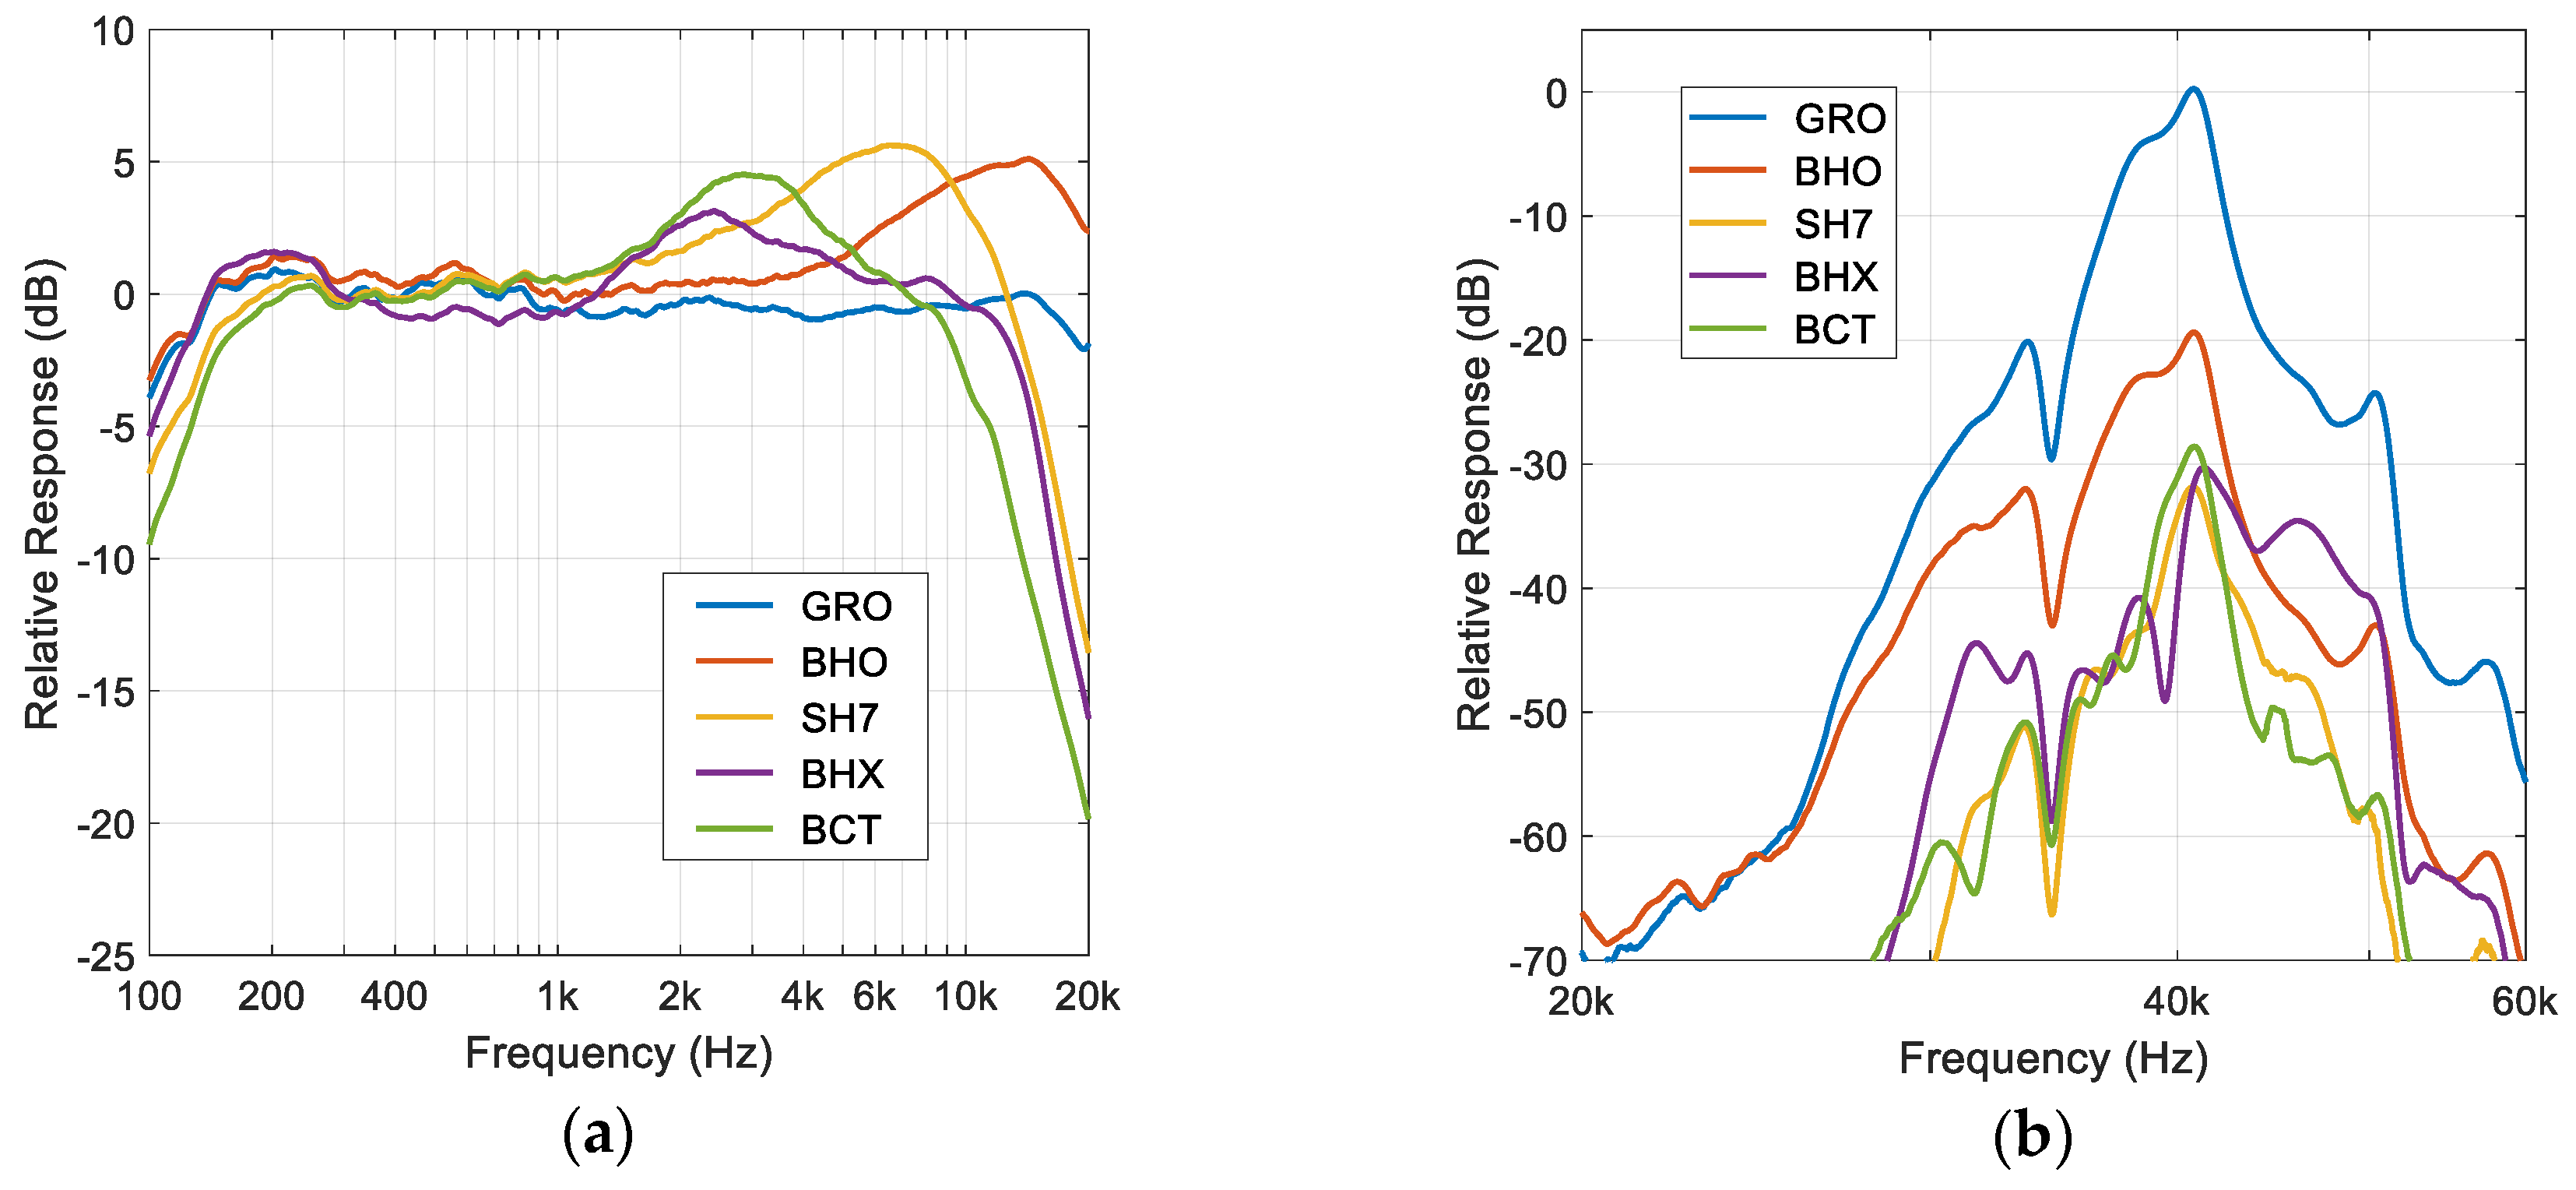
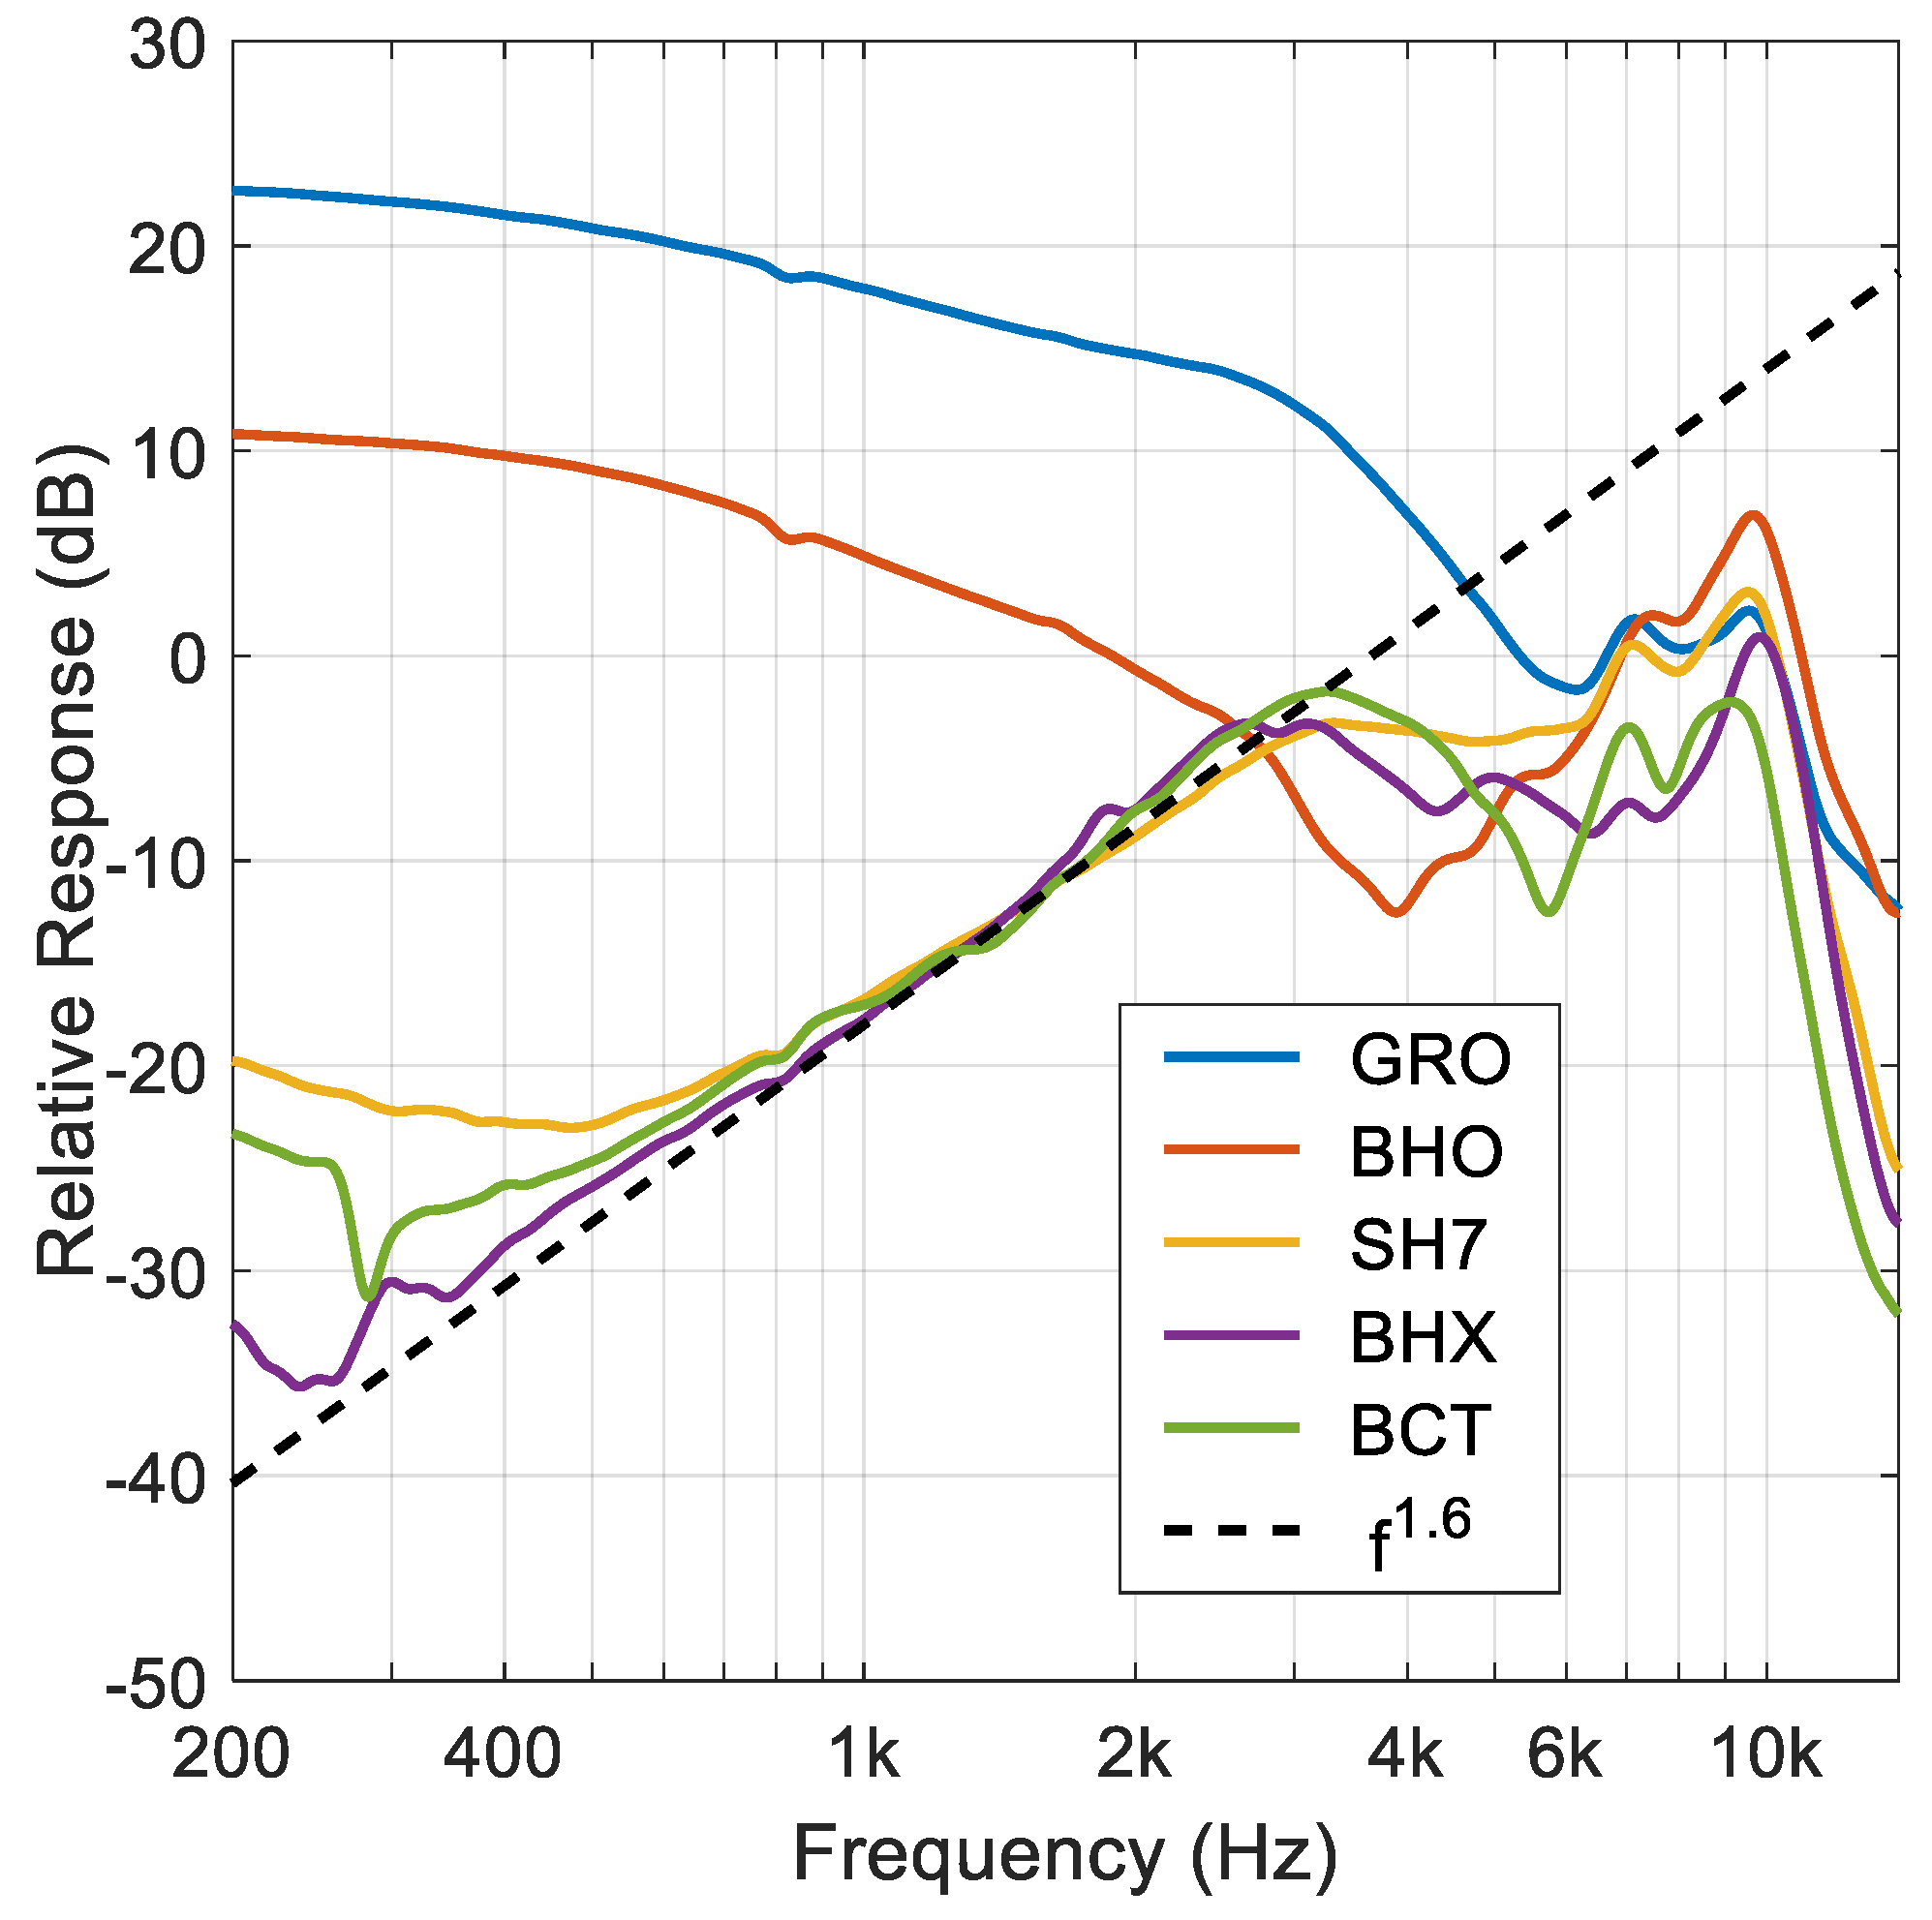
3.1. Frequency Response

We used an 11-second logarithmic sweep from 18 Hz to 22 kHz as excitation signal for each of the six modulations (using a modulation index of m = 1). Magnitude curves of the transfer functions are shown in Figure 5. The curves were smoothed by applying 1/12th bandwidth spectral averaging. The parametric speaker barely reproduced low frequencies and the response increased by about 12 dB/octave between 300 and 1500 Hz. After 1500 Hz, the transfer functions varied slightly for each modulation. LSBAM showed the largest difference with a marked decrease at 6.5 kHz. This is due to the asymmetric response of the loudspeaker array that also had a marked decrease at approximately 33.5 kHz (which is 6.5 kHz below the carrier frequency of 40 kHz; Figure 2b). This minimum was not present in the USBAM since this modulation only uses the upper sideband. Beyond 10 kHz, all responses dropped abruptly due to the limited frequency response of the recording microphone. Similar curves, with a lower relative level, were obtained for each modulation if the modulation index was reduced.

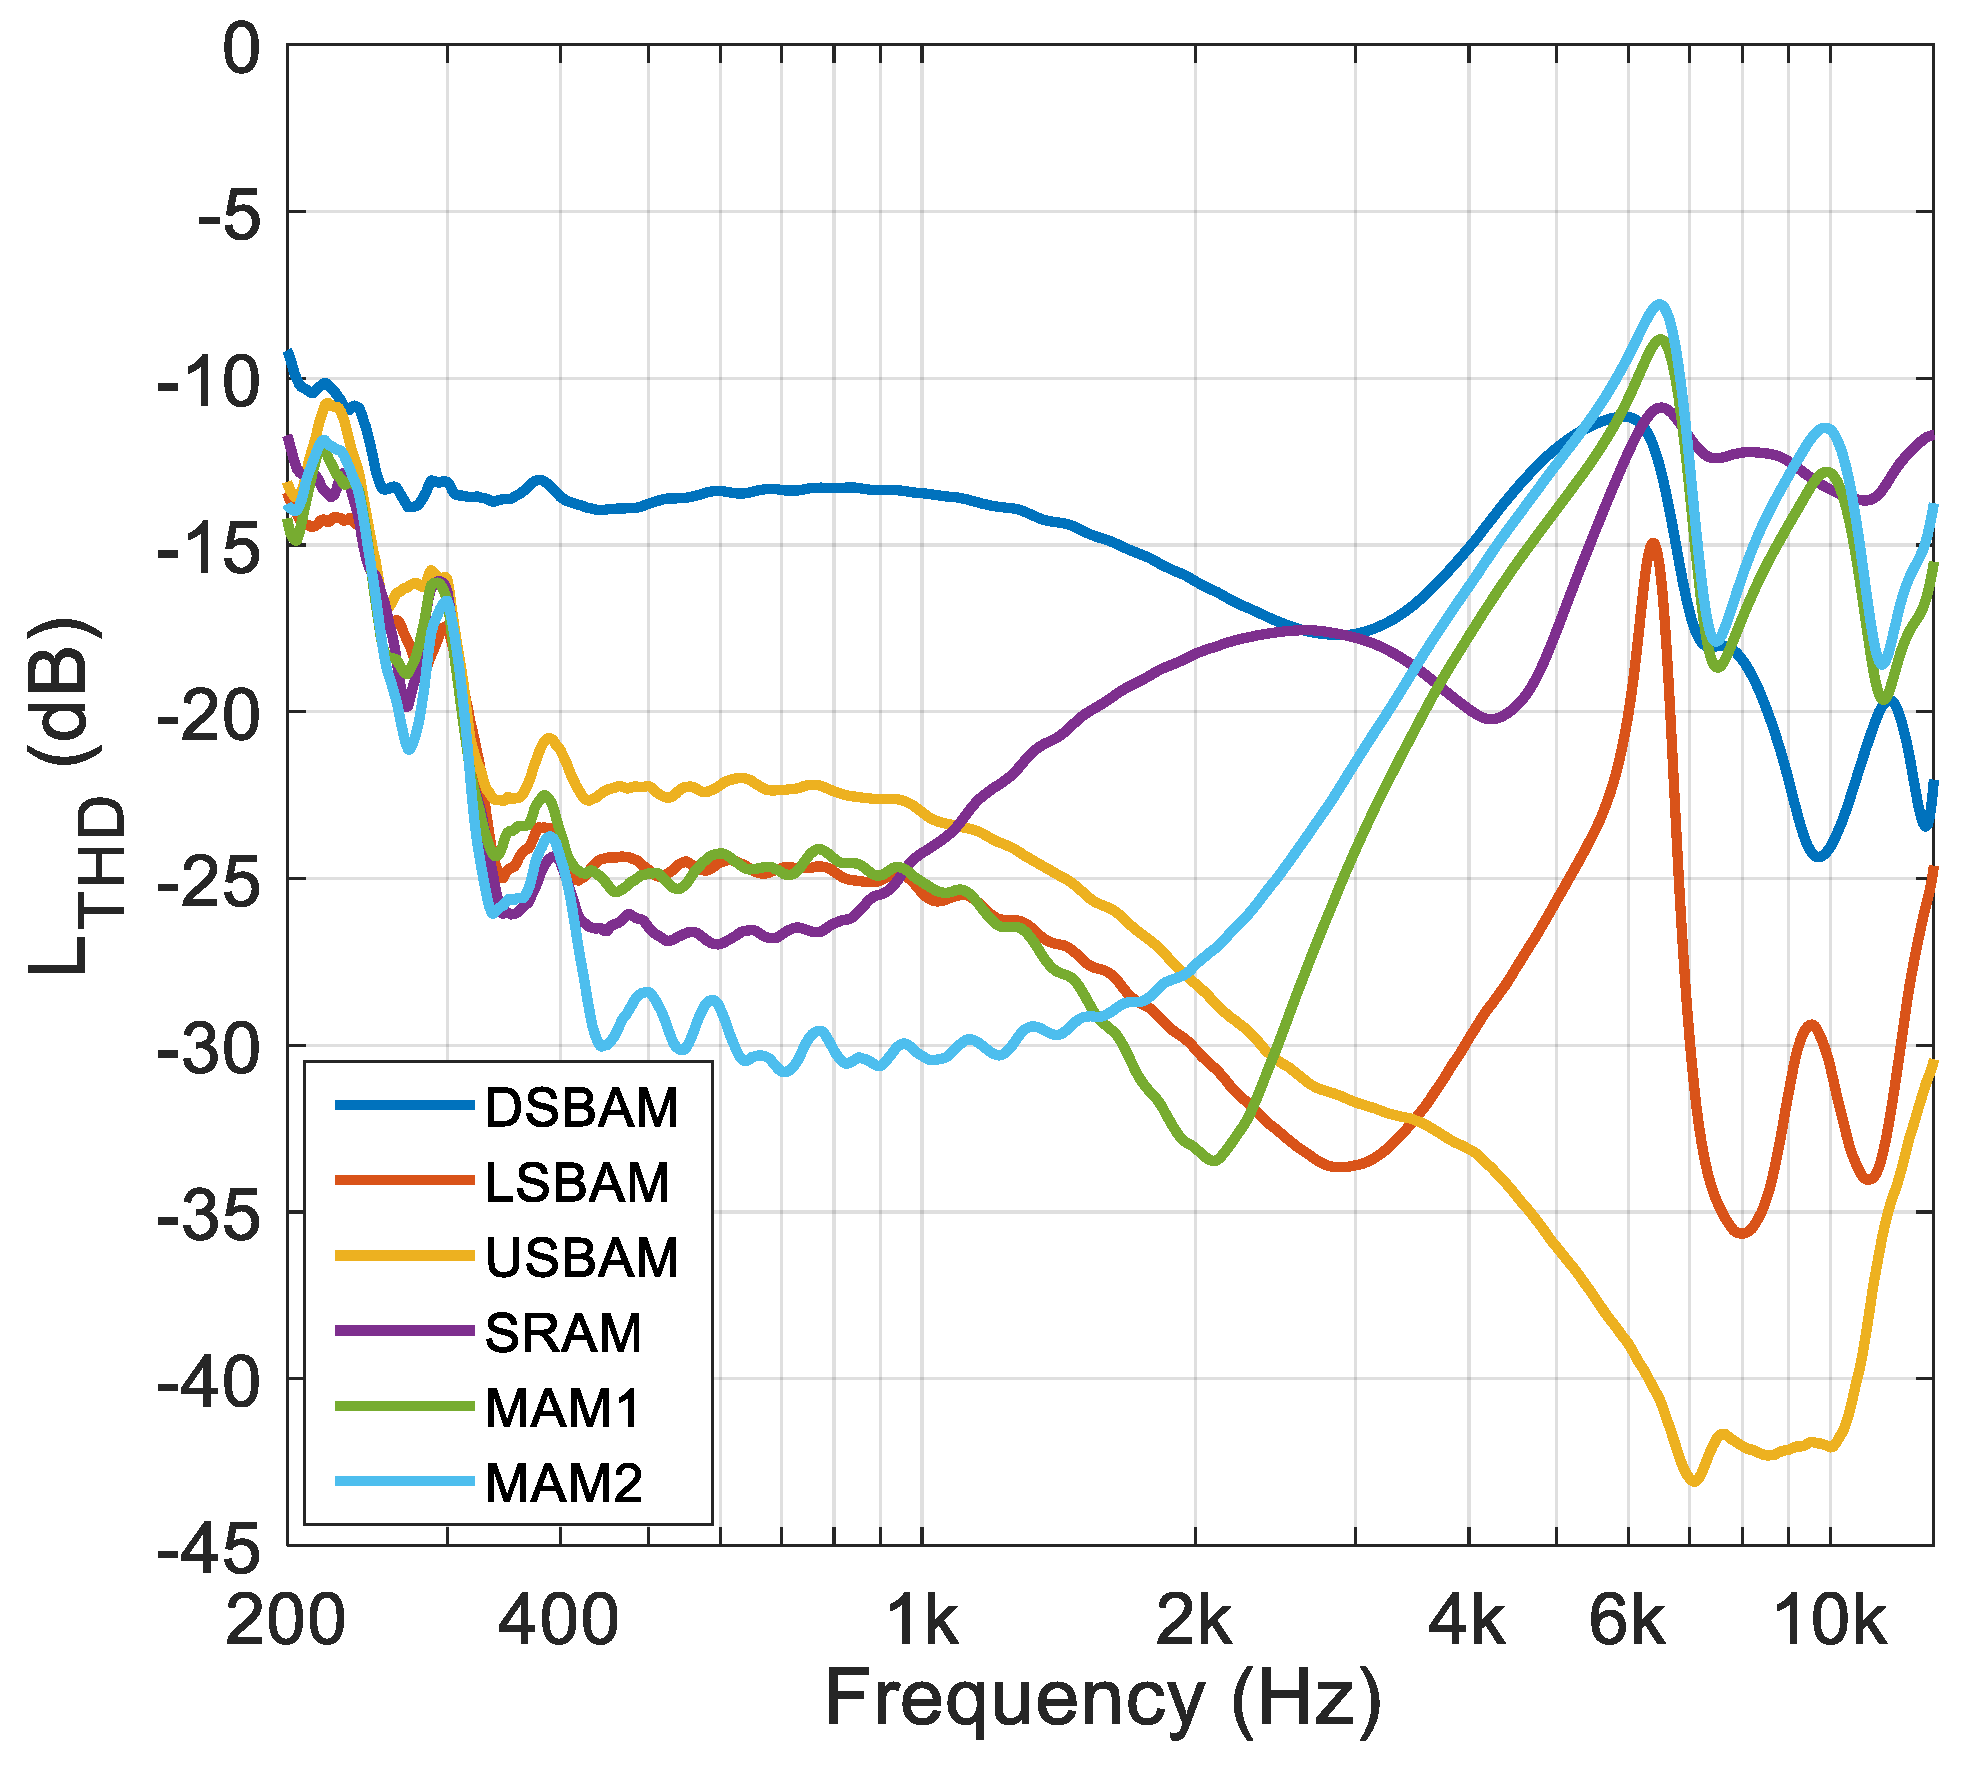
3.2. Harmonic Distortion

In the audio range, there are different parameters and methods to evaluate the non-linear response of a speaker. The most widespread measure for characterizing the non-linear response of a speaker is the total harmonic distortion (THD) obtained by sinusoidal signals of increasing frequency. Using consecutive increments of stationary tones (step-by-step method) is the most common procedure employed to measure distortion of parametric loudspeakers that can be found in the literature [33]. However, in the audio range it is preferable to use the technique based on sweeps proposed by Farina [34] that offers benefits in terms of ease of use, signal-to-noise ratio and immunity against the temporal variation of the DUT. We will use this method.
The advantage of measuring impulse responses using sweeps is that the artifacts generated by the harmonic distortion can be eliminated, since these appear at negative times in relation to direct sound, and can be separated from the desired h ( t ) [35]. In addition, when using a logarithmic sweep as excitation signal, the harmonics will have a constant group delay independent of the frequency when it is deconvoluted with the reference spectrum. They will therefore appear in predictable positions of h ( t ) and can be separated by windowing if the sweep is sufficiently slow. Hence, with a single excitation signal, both the linear transfer function of the system and the harmonic distortion decomposed into several orders can be obtained, eliminating the influence of non-linearities. We measured harmonics up to the 5th order.
In Supplementary Figure S3, we present the decomposed harmonic distortion for the different preprocessing techniques. It can be seen that beyond the 2nd order harmonic, the distortion was negligible. Most of the distortion resides in the second harmonic (see Supplementary Figure S3). It is worth noting that some techniques (e.g., MAM1) reduced the 2nd harmonic considerably at some frequencies, almost to the levels of the 3rd harmonic.
The level of total harmonic distortion ( L T H D ) in decibels was determined by the formula:
L T H D ( f ) = 20 lg ( n = 1 5 p ˜ n f 2 ( f ) p ˜ f ( f ) )   d B .
where p ˜ n f ( f ) is the RMS value of the nth-order harmonic component and p ˜ f ( f ) is the RMS value of the first harmonic of the fundamental component.
Figure 6 shows the L T H D obtained for all modulations with m = 1. L T H D smaller than 5% (i.e., −26 dB) were generally acceptable levels for domestic audio equipment. MAM techniques provided the best results up to 2.6 kHz, and single sidebands (i.e., LSBAM and USBAM) provided the best overall result, staying below the distortion threshold throughout the working frequency of the speaker. For DSBAM, the high level of the second harmonic caused L T H D greater than −20 dB in virtually the entire frequency range. MAM and SRAM modulations obtained good results up to 2 kHz but for higher frequencies. Its behavior was similar to the conventional DSBAM modulation. The smallest values for harmonic distortion were obtained with single sideband modulations. This is because these modulations used only one band, thus there was only one difference-signal. The other techniques used a double band and thus produced two difference-signals generating more harmonics and increasing the harmonic distortion.
In Supplementary Figure S4, we show the L T H D for each predistortion technique and modulation index ranging from 0.1 to 1 at 0.1 steps. In general, the larger the modulation index, the more distortion appeared. However, this increment was more pronounced for DSBAM along all frequencies, for SRAM from 1 to 6 kHz, for MAM1 beyond 1 kHz, and for MAM2 beyond 1.5 kHz. Both LSBAM and USBAM were less affected by an increase of total harmonic distortion as the modulation index increased.

3.3. Intermodulation Distortion

When a system is excited by a two-tone stimulus, intermodulation distortion may appear at the sum and difference of the two tones and their harmonics. If one of the tones ( f 1 ) is significantly lower than the other tone ( f 2 ) , the intermodulation components are concentrated around the highest frequency, at frequencies f 2 ± n f 1 (where n is a natural number). According to the IEC Standard 60268-21 [26], the total intermodulation distortion ( I M D T ), in percentage and considering only intermodulation components up to 3rd order, can be expressed as:
I M D T ( f 1 , f 2 ) = k = 1 2 p ˜ ( f 2 k f 1 ) + p ˜ ( f 2 + k f 1 ) p ˜ ( f 2 ) 100 % ,
where p ˜ ( f 2 ± ( n 1 ) f 1 ) is the RMS value of the nth-order intermodulation component at the sum and difference of the two tones, and p ˜ ( f 2 ) is the RMS value of the fundamental component at the excitation frequency f 2 .
To analyze this parameter along the entire frequency range, the calculation has been divided into two parts: variation of the low-frequency tone f 1 from 20 Hz to 1 kHz while keeping the high-frequency tone f 2 at a constant frequency of 7 kHz, and variation of the high-frequency tone f 2 from 500 Hz to 20 kHz while keeping the high-frequency tone f 1 at a constant frequency of 60 Hz.
The intermodulation distortion is shown in Figure 7. The graph shows that the lowest values of the intermodulation distortions were obtained with SRAM and MAM modulations. Single sideband modulations obtained the worst results. It is also observed how the I M D T measured with the lower single lateral band (LSBAM) had a peak around 6.5 kHz caused again by the minimum that the parametric array had in the ultrasonic response.
All measurements were repeated systematically for different modulation indices varying from 0.1 to 1 at steps of 0.1. The results are shown in Supplementary Figure S5. In this case, the MAM and SRAM techniques provide the lowest distortion even at large modulation indices. The rest of techniques are more sensitive to changes in the modulation index.

4. Conclusions

Parametric arrays have multiple applications in targeted audio delivery. However, the self-demodulation of the highly directive ultrasonic carrier is a non-linear process that introduces distortion of the audio signal. Multiple techniques have been proposed based on amplitude modulation. We have experimentally evaluated six different amplitude modulation techniques in terms of a frequency response as well as harmonic and intermodulation distortion. We analyzed the harmonic distortion at different frequencies and decomposed by orders. Additionally, the distortion of different modulation indices is evaluated for all the modulations techniques.
When selecting a modulation technique and modulation index there must be a balance between sound quality and audio level. A large modulation index will lead to louder audible sound but with more distortion. In general, we recommend MAM1 with a modulation index of 0.6. This configuration produces the lowest levels of harmonic and intermodulation distortion while only decreasing the audible signal by 2 dB. MAM1 technique makes a good use of the limited bandwidth of the transducers. We acknowledge that for transducers with wider band (e.g., electrostatic speakers), MAM2 could provide better results. In any case, the ultrasonic transducers that we evaluated are the most commonly used in this type of devices.
We hope that this study promotes more experimental measurements with parametric arrays that analyze the distortion of the speakers. The measurement technique that we used to avoid the appearance of spurious signal is based on selecting a microphone with an adequate frequency response, so it can be employed by most researchers. As future work, it would be desirable to measure psychoacoustical parameters and user-subjective measurements.

Supplementary Materials

The following are available online at https://www.mdpi.com/2076-3417/10/6/2070/s1, Table SI: Main characteristics of the evaluated microphones, Figure S1: Block diagrams of preprocessing amplitude modulation techniques, Figure S2: Spectrogram of the signals corresponding to each stage of the measurement procedure, Figure S3: Harmonics up to the 5th order measured with the predistortion techniques (m = 1), Figure S4: Level of total harmonic distortion (LTHD) for the predistortion techniques at different modulation indices, and Figure S5: Intermodulation distortion (IMDT) for the predistortion techniques applied with different levels of modulation index (m).

Author Contributions

Conceptualization, R.S.M. and A.M.; methodology, R.S.M. and A.V.; software, R.S.M.; validation, R.S.M., P.T. and A.V.; data curation, P.T. and R.S.M.; writing—original draft preparation, R.S.M.; writing—review and editing, R.S.M. and A.M. All authors have read and agreed to the published version of the manuscript.

Funding

This work has been funded by the Spanish Ministry of Economy and Competitiveness through the R+D+I research project with reference BIA2016-76957-C3-2-R, and by the Government of Navarre through the Technology Transfer project 0011-1365-2019-000086.

Conflicts of Interest

The authors declare no conflict of interest.

References

  1. Gan, W.S.; Yang, J.; Kamakura, T. A review of parametric acoustic array in air. Appl. Acoust. 2012, 73, 1211–1219. [Google Scholar] [CrossRef]
  2. Ishii, K.; Yamamoto, Y.; Imai, M.; Nakadai, K. A navigation system using ultrasonic directional speaker with rotating base. In Human Interface and the Management of Information. Interacting in Information Environments. Human Interface 2007. Lecture Notes in Computer Science; Smith, M.J., Salvendy, G., Eds.; Springer: Berlin/Heidelberg, Germany, 2007; Volume 4558, pp. 526–535. [Google Scholar] [CrossRef]
  3. Nakagaki, K.; Kakehi, Y. SonalShooter: A spatial augmented reality system using handheld directional speaker with camera. In Proceedings of the SIGGRAPH’11, ACM SIGGRAPH 2011 Posters, Vancouver, Canada, 2011; ACM Press: New York, NY, USA, 2011. [Google Scholar] [CrossRef]
  4. Misawa, D. Transparent sculpture: An embodied auditory interface for sound sculpture. In Proceedings of the 7th International Conference on Tangible, Embedded and Embodied Interaction. TEI ’13, Barcelona, Spain, 2013; ACM Press: New York, NY, USA, 2013. [Google Scholar] [CrossRef]
  5. Gan, W.S.; Tan, E.L.; Kuo, S. Audio Projection. IEEE Signal Process. Mag. 2011, 28, 43–57. [Google Scholar] [CrossRef]
  6. Westervelt, P.J. Parametric Acoustic Array. J. Acoust. Soc. Am. 1963, 35, 535–537. [Google Scholar] [CrossRef]
  7. Berktay, H.O. Possible exploitation of non-linear acoustics in underwater transmitting applications. J. Sound Vib. 1965, 2, 435–461. [Google Scholar] [CrossRef]
  8. Mikulka, J.; Hladký, D.; Sliž, J. Parametric array as a source of audible signal. In Proceedings of the Progress in Electromagnetic Research Symposium (PIERS), Shanghai, China, 8–11 August 2016. [Google Scholar]
  9. Farias, F.; Abdulla, W. A method for selecting a proper modulation technique for the parametric acoustic array. J. Phys. Conf. Ser. 2018, 1075, 012035. [Google Scholar] [CrossRef]
  10. Ji, W.; Gan, W.S.; Ji, P. Theoretical and experimental comparison of amplitude modulation techniques for parametric loudspeakers. In Proceedings of the 128th Audio Engineering Society Convention, London, UK, 22–25 May 2010. [Google Scholar]
  11. IEC 60268-21:2018 Sound system equipment—Part 21: Acoustical (output-based) measurements; International Electrotechnical Commission: Geneva, Switzerland, 2018.
  12. Berzborn, M.; Bomhardt, R.; Klein, J.; Richter, J.G.; Vorländer, M. The ITA-Toolbox: An Open Source MATLAB Toolbox for Acoustic Measurements and Signal Processing. In Proceedings of the 43th Annual German Congress on Acoustics, Kiel, Germany, 6–9 March 2017. [Google Scholar]
  13. Ji, P.; Yang, J. An experimental investigation about parameters’ effects on spurious sound in parametric loudspeaker. Appl. Acoust. 2019, 148, 67–74. [Google Scholar] [CrossRef]
  14. Bennett, M.B.; Blackstock, D.T. Experimental verification of the parametric array in air. J. Acoust. Soc. Am. 1973, 54, 297. [Google Scholar] [CrossRef]
  15. Lucas, B.G.; Tjötta, J.N.; Muir, T.G. Field of a parametric focusing source. J. Acoust. Soc. Am. 1983, 73, 1966–1971. [Google Scholar] [CrossRef]
  16. Kamakura, T.; Yoneyama, M.; Ikegaya, K. Developments of parametric loudspeaker for practical use. In Proceedings of the 10th International Symposium on Nonlinear Acoustics, Kobe, Japan, 24–28 July 1984; pp. 147–150. [Google Scholar]
  17. Havelock, D.; Brammer, A. Directional loudspeakers using sound beams. J. Audio Eng. Soc. 2000, 48, 908–916. [Google Scholar]
  18. Toda, M. New type of acoustic filter using periodic polymer layers for measuring audio signal components excited by amplitude-modulated high-intensity ultrasonic waves. J. Audio Eng. Soc. 2005, 53, 930–941. [Google Scholar]
  19. Wygant, I.O.; Kupnik, M.; Windsor, J.C.; Wright, W.M.; Wochner, M.S.; Yaralioglu, G.G.; Hamilton, M.; Khuri-Yakub, P. 50 kHz capacitive micromachined ultrasonic transducers for generation of highly directional sound with parametric arrays. IEEE Trans. Ultrason. Ferroelectr. Freq. Control 2009, 56, 193–203. [Google Scholar] [CrossRef] [PubMed]
  20. Ye, C.; Kuang, Z.; Wu, M.; Yang, J. Development of an acoustic filter for parametric loudspeaker in air. Jpn. J. Appl. Phys. 2011, 50, 07HE18. [Google Scholar] [CrossRef]
  21. Ji, P.; Hu, W.; Yang, J. Development of an acoustic filter for parametric loudspeaker using phononic crystals. Ultrasonics 2016, 67, 160–167. [Google Scholar] [CrossRef] [PubMed]
  22. Hedberg, C.M.; Haller, K.C.E.; Kamakura, T. A self-silenced sound beam. Acoust. Phys. 2010, 56, 637–639. [Google Scholar] [CrossRef]
  23. Ji, P.; Liu, W.; Wu, S.; Yang, J.; Gan, W.S. An alternative method to measure the on-axis difference-frequency sound in a parametric loudspeaker without using an acoustic filter. Appl. Acoust. 2012, 73, 1244–1250. [Google Scholar] [CrossRef]
  24. Ju, H.S.; Kim, Y.H. Near-field characteristics of the parametric loudspeaker using ultrasonic transducers. Appl. Acoust. 2010, 71, 793–800. [Google Scholar] [CrossRef]
  25. Berktay, H.O.; Leahy, D.J. Farfield performance of parametric transmitters. J. Acoust. Soc. Am. 1974, 55, 539–546. [Google Scholar] [CrossRef]
  26. Yang, J.; Tian, J.; Gan, W.S. Parametric loudspeaker: From theory to applications. In Proceedings of the 21st International Congress on Sound and Vibration, ICSV, Beijing, China, 13–17 July 2014. [Google Scholar]
  27. Yoneyama, M.; Fujimoto, J.; Kawamo, Y.; Sasabe, S. The audio spotlight: An application of nonlinear interaction of sound waves to a new type of loudspeaker design. J. Acoust. Soc. Am. 1983, 73, 1532–1536. [Google Scholar] [CrossRef]
  28. Aoki, K.; Kamakura, T.; Kumamoto, Y. Parametric loudspeaker—Characteristics of acoustic field and suitable modulation of carrier ultrasound. Electron. Commun. Jpn. (Part III: Fundam. Electron. Sci.) 1991, 74, 76–82. [Google Scholar] [CrossRef]
  29. Kite, T.D.; Postt, J.T.; Harnilton, M.F. Parametric array in air: Distortion reduction by preprocessing. J. Acoust. Soc. Am. 1998, 103, 2871. [Google Scholar] [CrossRef]
  30. Tan, E.L.; Gan, W.S.; Yang, J. Preprocessing techniques for parametric loudspeakers. In Proceedings of the International Conference on Audio, Language and Image Processing ICALIP, Shanghai, China, 7–9 July 2008. [Google Scholar]
  31. Hatano, Y.; Shi, C.; Kajikawa, J. Compensation for nonlinear distortion of the frequency modulation-based parametric array loudspeaker. IEEE/ACM Trans. Audio Speech Lang. Process. 2017, 25, 1709–1717. [Google Scholar] [CrossRef]
  32. Nakayama, M.; Nishiura, T. Synchronized amplitude-and-frequency modulation for a parametric loudspeaker. In Proceedings of the 9th Asia-Pacific Signal and Information Processing Association Annual Summit and Conference, APSIPA ASC, Kuala Lumpur, Malaysia, 12–15 December 2017. [Google Scholar]
  33. Pompei, F.J. The use of airborne ultrasonics for generating audible sound beams. J. Audio Eng. Soc. 1999, 47, 726–731. [Google Scholar]
  34. Farina, A. Simultaneous measurement of impulse response and distortion with a swept-sine technique. In Proceedings of the AES 108th Convention, Paris, France, 19–22 February 2000. [Google Scholar]
  35. Müller, S.; Massarani, P. Transfer-Function measurement with sweeps. J. Audio Eng. Soc. 2001, 49, 443–471. [Google Scholar]
Figure 1. Ultrasonic array employed for the parametric speaker made of 49 ultrasonic transducers of 16 mm diameter.
Applsci 10 02070 g001
Figure 2. Block diagram of the transfer function measurement method in an ultrasonic parametric array.
Applsci 10 02070 g002
Figure 3. Relative frequency response of the different microphones. (a) Response in the audible range with a calibrated monitor as an emitter. (b) Response in the ultrasonic range with the ultrasonic array used as the emitter. Response normalized at carrier level measured by a GRO microphone.
Applsci 10 02070 g003
Figure 4. Frequency responses of the difference-frequency signal obtained with the tested microphones. The ultrasonic array was used as an emitter with a conventional DSBAM modulation.
Applsci 10 02070 g004
Figure 5. Transfer functions measured with different preprocessing techniques (modulation index m = 1).
Applsci 10 02070 g005
Figure 6. Comparison of L T H D levels for each modulation technique (modulation index m = 1).
Applsci 10 02070 g006
Figure 7. Comparison of I M D T values for each modulation (m = 1).
Applsci 10 02070 g007

