Article

Encoding, Exchange and Manipulation of Captured Immersive VR Sessions for Learning Environments: the PRISMIN Framework

1
VHLab, CNR ISPC (Institute for Heritage Sciences)—Area della Ricerca Roma 1, Via Salaria Km. 29,300, 00015 Monterotondo, Italy
2
Department of Computer Science - Sapienza University, Via Salaria 113, 00185 Rome, Italy
*
Author to whom correspondence should be addressed.
Appl. Sci. 2020, 10(6), 2026; https://doi.org/10.3390/app10062026
Submission received: 3 January 2020 / Revised: 3 March 2020 / Accepted: 12 March 2020 / Published: 17 March 2020
(This article belongs to the Special Issue Emerging Artificial Intelligence (AI) Technologies for Learning)

Abstract

:
Capturing immersive VR sessions performed by remote learners using head-mounted displays (HMDs) may provide valuable insights on their interaction patterns, virtual scene saliency and spatial analysis. Large collected records can be exploited as transferable data for learning assessment, detect unexpected interactions or fine-tune immersive VR environments. Within the online learning segment, the exchange of such records among different peers over the network presents several challenges related to data transport and/or its decoding routines. In the presented work, we investigate applications of an image-based encoding model and its implemented architecture to capture users’ interactions performed during VR sessions. We present the PRISMIN framework and how the underneath image-based encoding can be exploited to exchange and manipulate captured VR sessions, comparing it to existing approaches. Qualitative and quantitative results are presented in order to assess the encoding model and the developed open-source framework.

1. Introduction

In recent years, consumer-level head-mounted displays (HMDs) are being adopted more to deploy engaging and educational immersive experiences, potentially offering a high sense of presence to final users. The demand for such technologies is growing, in particular, they are starting to have an impact within the education sector (see [1,2]), due to their costs becoming more affordable compared to two or three years ago. Recent findings prove consumers tend to see the opportunity in HMDs to explore virtual places and, in general, a positive attitude towards hedonic applications such as panoramic content and immersive VR games [3]. During a limited amount of time, users (such as visitors of an exhibit, virtual students, etc.) explore and perform interactions in a 3D virtual environment. Given an immersive virtual environment (IVE), an in-depth investigation of users’ sessions—including for instance spatial behaviors, visual attention and so on—can be really useful to understand users’ interaction patterns and discover unexpected attention toward specific scene elements. Capturing whole VR sessions and rich user states can in fact provide valuable insights to analysts regarding spatial analysis or specific assessments. Within the education sector, recording immersive VR sessions as students interact with the 3D scene can provide valid support for learning assessment [4]. Regarding distance learning technologies and education, when such records can be easily exchanged in networked contexts, they enable online teachers or instructors to remotely investigate learners’ interactions. In general, recording per-user fine-grained data (interaction states) is a strong requirement to understand an immersive VR session from both quantitative and qualitative perspectives. For analysts, having tools to directly map and playback captured records (such as locomotion data) can support their interpretation. Furthermore, within methodical processes such as assurance of learning (AoL) [5] remote teachers/instructors could be interested into inspecting learners’ sessions while the VR applications, such as desktop-based or immersive web-apps, are up and running. In networked scenarios (e.g., virtual classrooms) the exchange of such records between students and teachers endpoints, especially over the Internet, can be challenging or involve computationally-intensive routines (for instance, decoding compressed data). This is even more delicate if we take into account completely web-based tools—i.e., using a common web browser (desktop or mobile) without any additional software required by users to inspect the data. Furthermore, compressed interaction states transported between peers can not be manipulated (e.g., interactively edited) until the client (analyst) decompress the data into something that can be analyzed and inspected at runtime. A single student session may contain large amounts of interaction states and attributes captured over time, such as gaze, visual attention, locomotion or more complex data, thus posing serious challenges for exchanging these states in networked contexts.
In this paper, we investigate and present a few applications of a developed image-based encoding model and the implementation of a framework (called “PRISMIN”) that provides scalable, compact methods and accessories to capture, compare and manipulate user VR sessions and interaction states in networked contexts. Tracked learners attributes are encoded into special images and layouts offering:
  • lightweight transmission of captured data in networked environments and over Internet connections.
  • small computational load for encoding/decoding routines.
  • direct manipulation of complex records on GPU hardware and offline image processing.
  • basic image-based operations to compare or assess specific patterns.
We present a few results obtained using the framework, encoding previously recorded locomotion data during public VR installations and applying it to networked scenarios (virtual classrooms). We also discuss implications on spatial data accuracy (quantization error), temporal reduction and data exchange, also comparing to existing raw binary encoding and other lossless approaches.

2. Related Work

In order to perceive patterns and extract knowledge from large datasets and dynamic information streams, Visual Analytics [6] are often used by analysts, teachers or other professionals, to discover the unexpected and/or detect the expected. For instance, interactive installations deployed in public events or spaces, allow the ability to collect a large amount of data from casual visitors and then analyze them [7]. Data mining approaches are often employed for tourist activities discovering landmark preferences from photo mappings [8] while classical clustering methods [9] can be used offline to analyze spatial behaviors. Interaction with an immersive VR application is inherently 3D: in order to carry out consistent analysis on interactions performed in a virtual or physical 3D context, user sessions should be recorded using volumetric approaches [10]. Locomotion in particular [11] is largely investigated in literature for the exploration of IVEs using a HMD. Detecting spatial 3D patterns may support learning assessment, discover users’ patterns or assess the interaction model adopted for the VR application, including virtual classrooms, public/shared spaces, etc.
Immersive VR on the Web—In recent years we witnessed large advancements within the presentation and dissemination of interactive 3D scenes on desktop and mobile web browsers through HTML5/WebGL technologies [12] (see for instance the SketchFab platform - https://sketchfab.com/). Web browsers are available on virtually all computing devices, thus users can flexibly work from any device, anywhere, as long as the network connection is present and their data can be accessed remotely. Thanks to recent open specifications such as WebVR/WebXR (https://www.w3.org/TR/webxr/), immersive VR experiences (using consumer HMDs) are becoming easier to deploy through common web browsers [13], without requiring any additional plugin or software. This is becoming quite appealing also for specific massive open online courses (MOOCs) that offer interactive VR training [14] or immersive sections to remote students within online, educational IVEs.
There is a growing interest in discovering and visualizing interaction patterns in immersive VR sessions. Regarding IVE saliency, most of these works focus on panoramic/omnidirectional content from fixed viewpoints (360-degree applications). The research carried out in [15] analyzes, for instance, how people interact with panoramic content (fixed viewpoint) recording and visualizing gaze data. A model to obtain fixations from head direction is investigated in [16], providing good approximations when eye-tracking systems are not available on the HMD. The research in [17], presents a robust metric and visualization approach to measure similarities between users scan-paths and director’s cut using color-coded maps. Immersive analytics is also emerging as a research field to investigate how novel interaction models and display technologies can be employed to support analytical reasoning and decision making in 3D [18]. The main objective is to investigate advanced and usable user interfaces in order to support collaboration and offer VR analysts tools to immerse themselves in complex 3D datasets. A few recent works also focus their attention on immersive analytics for the Web using open-standards like WebVR/WebXR facing all the challenges related to online deployment. Research in [19,20] for instance discusses some of the problems faced by developers in crafting effective and informative immersive web-based 3D visualizations. The combination of immersive analytics with the new WebXR API is fueling research in the field of data visualization, as it allows the VR analyst to better perceive some data difficult to understand using traditional techniques [21].
In order to exchange large spatial records in a compact manner (e.g., coordinates, vectors, etc.), image-based encoding can be used by transferring common 2D images. The PNG format [22], offers a network-friendly, cross-platform and lossless compression scheme particularly suitable for the Web. For instance, previous works adopted such format as externalized mesh container [23,24] to efficiently stream geometry data over the network and to easily decode it by client web browsers. Previous encoding models in literature also investigated “geometry images” [25] as 2D arrays employed to quantize and store spatial information ( < x , y , z > ) as RGB values.

3. The Image-Based Model

Within previous research [26,27] we introduced an encoding model to capture user interaction states and store them in a compact manner, using images. We highlight in this section advantages within the context of the paper in terms of lightweight encoding/decoding routines and data exchange between learners and teachers in networked systems. We define user state s as a collection of state attributes ( s a , where a represents an attribute). For instance s p R 3 represents user 3D location in the IVE, s o represent HMD orientation, etc. A session operator S can be defined to query the user interaction state over time:
S a ( u , t ) s a
where u is the user and s a the state attribute returned at a given time t R . For immersive VR sessions performed by remote/online students, we are interested in particular state attributes like location ( s p ), view direction of HMD ( s d ), focus ( s f ) or more sophisticated data like physical space usage or ergonomics. A few examples are S p ( u , t ) to capture the whole locomotion for each student, or S f ( u , t ) to capture visual attention for all students over time.

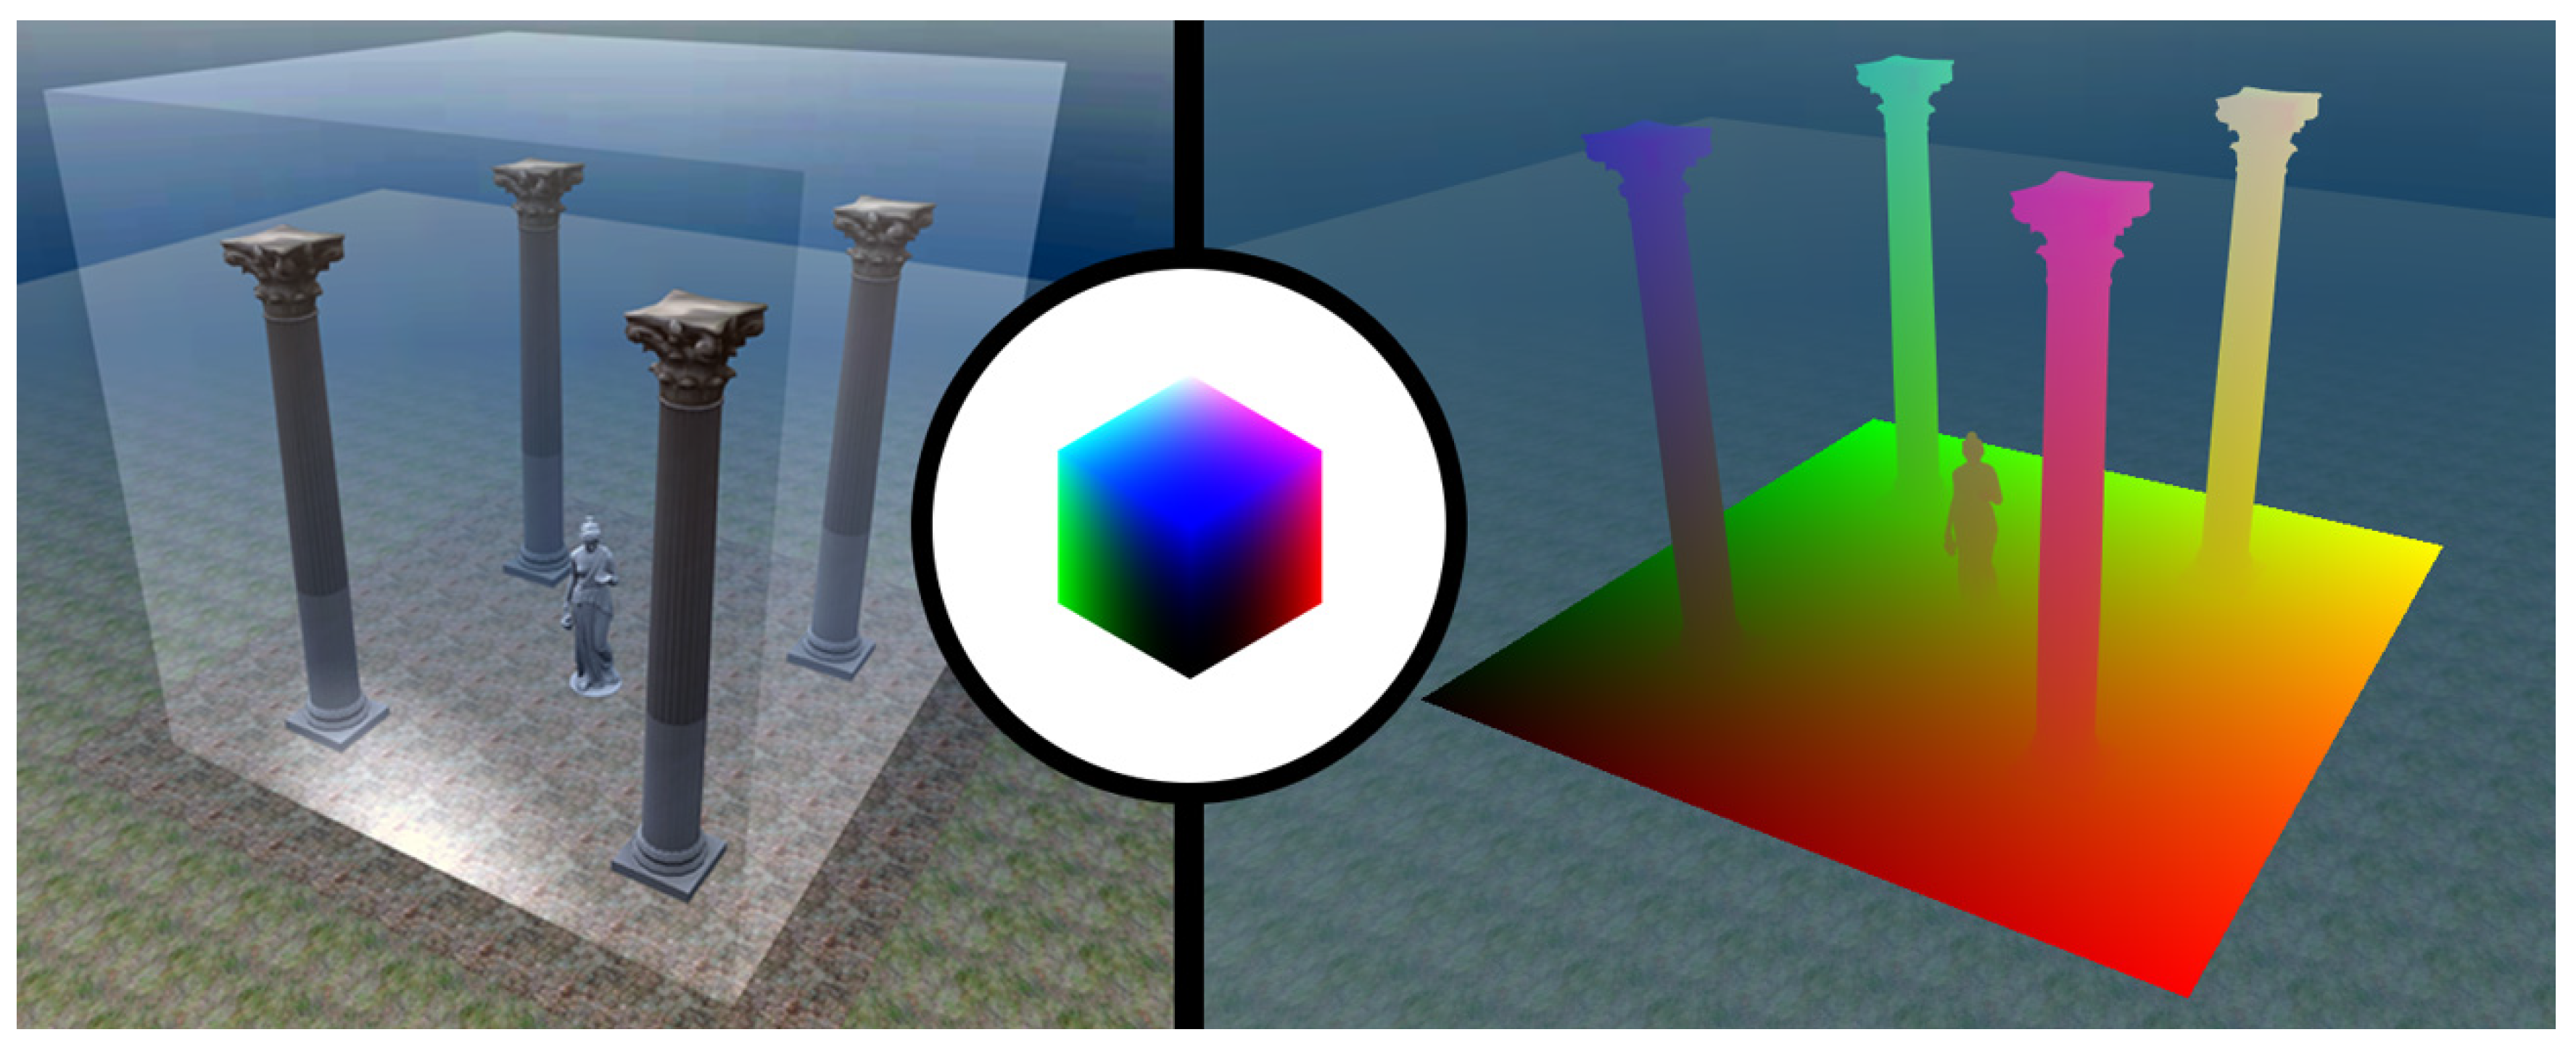
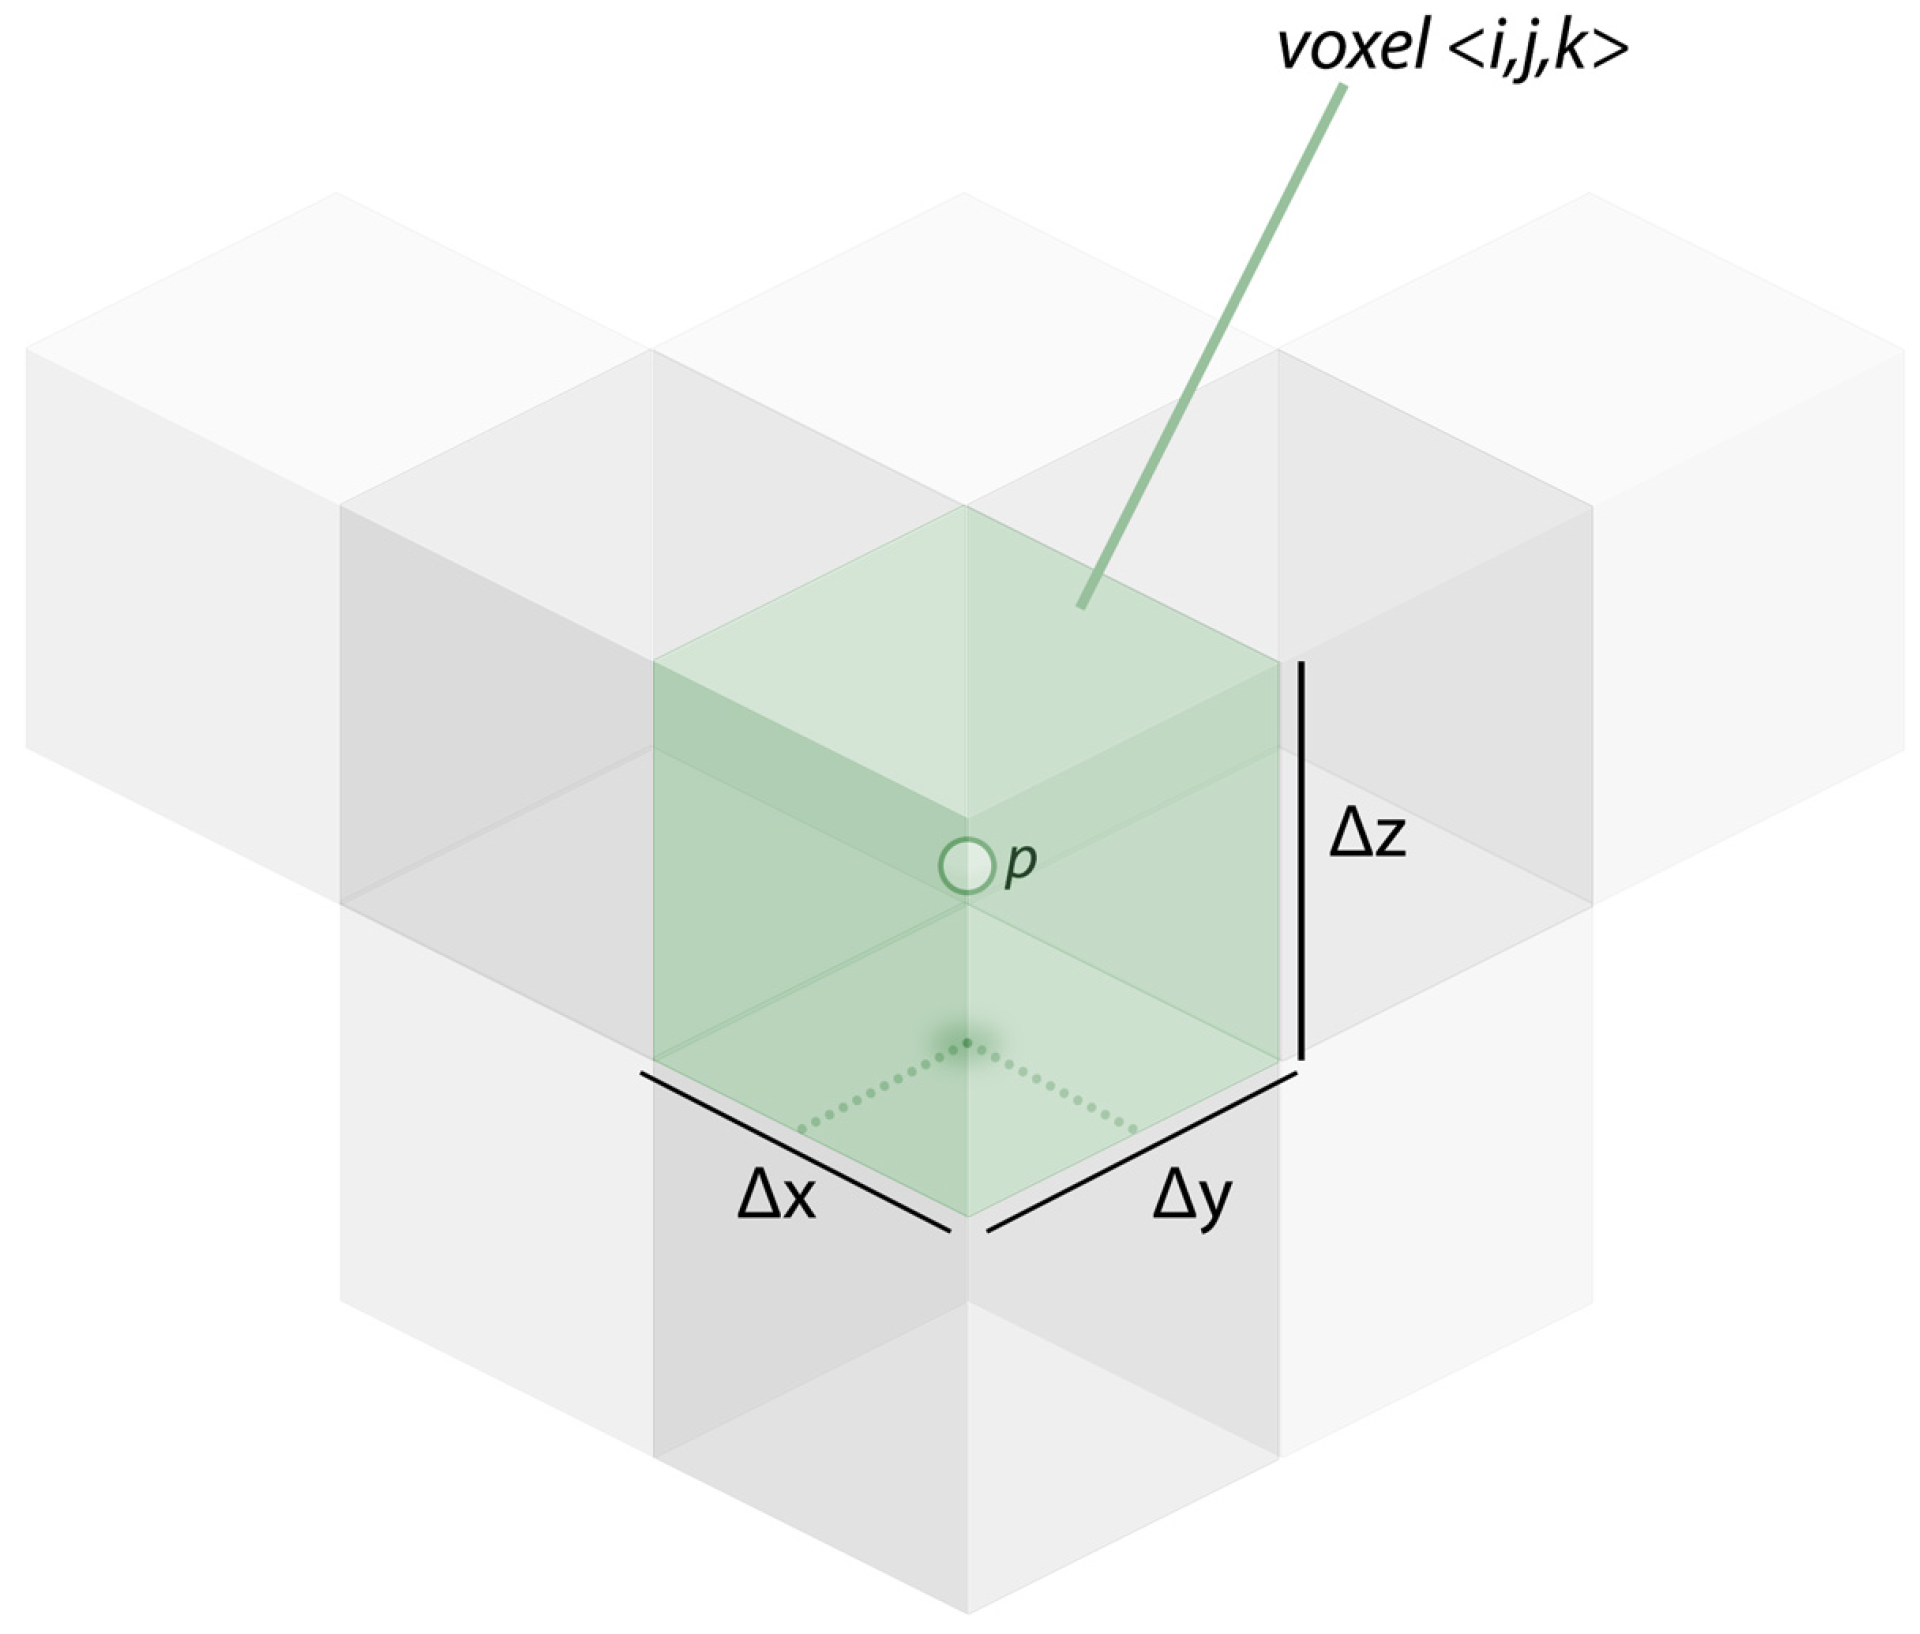
3.1. Session Volumes

Session Volumes are axis-aligned bounding boxes (AABBs) accessories deployed at runtime to observe a portion of the virtual 3D scene (IVE), capturing specific user interaction states within their boundaries. For a single session volume V the model allows to encode captured user states as stream of RGB(A) (red, green, blue and alpha channels) data that can be written in standard 2D images. Spatial attributes (e.g., s p , s f —or 3D locations) are quantized into voxels uniformly distributed within V. In other words, each location p R 3 inside V can be color-coded (see Figure 1) through the following quantizer, returning an RGB value:
Q V ( p ) = n o r m ( p ) · ( 2 b - 1 )
where n o r m ( p ) is the normalized location inside V and b N 0 represents color bit-depth. Considering for instance a normalized 3D location inside the volume and b = 8 , such mapping allows the ability to address 256 3 (16,777,216) different voxels in V.

3.1.1. Quantization Error

The extents of V and b have clearly a huge impact on voxels’ size, and thus on location quantization when encoded as RGB color. Given E x ( V ) , E y ( V ) and E z ( V ) as extents of the volume V along x, y and z axes respectively, we retrieve the single voxel extents ( Δ x , Δ y and Δ z ):
Δ x = E x ( V ) 2 b Δ y = E y ( V ) 2 b Δ z = E z ( V ) 2 b
Given a lossless RGB color c (corresponding to a voxel < i , j , k > ), we know the original 3D location was quantized somewhere inside the voxel extents ( Δ x , Δ y and Δ z ). The decoding routine approximates the returned location p R 3 to the voxel center (see Figure 2), introducing a quantization error. The maximum quantization error ϵ (worst case) for each axis can be defined by:
ϵ = < ± Δ x 2 , ± Δ y 2 , ± Δ z 2 >
Multiple session volumes { V 0 , V 1 , } can be deployed in the same 3D scene, each capturing state attributes in different portions of the IVE, each operating individually, providing great scalability for the encoding model.

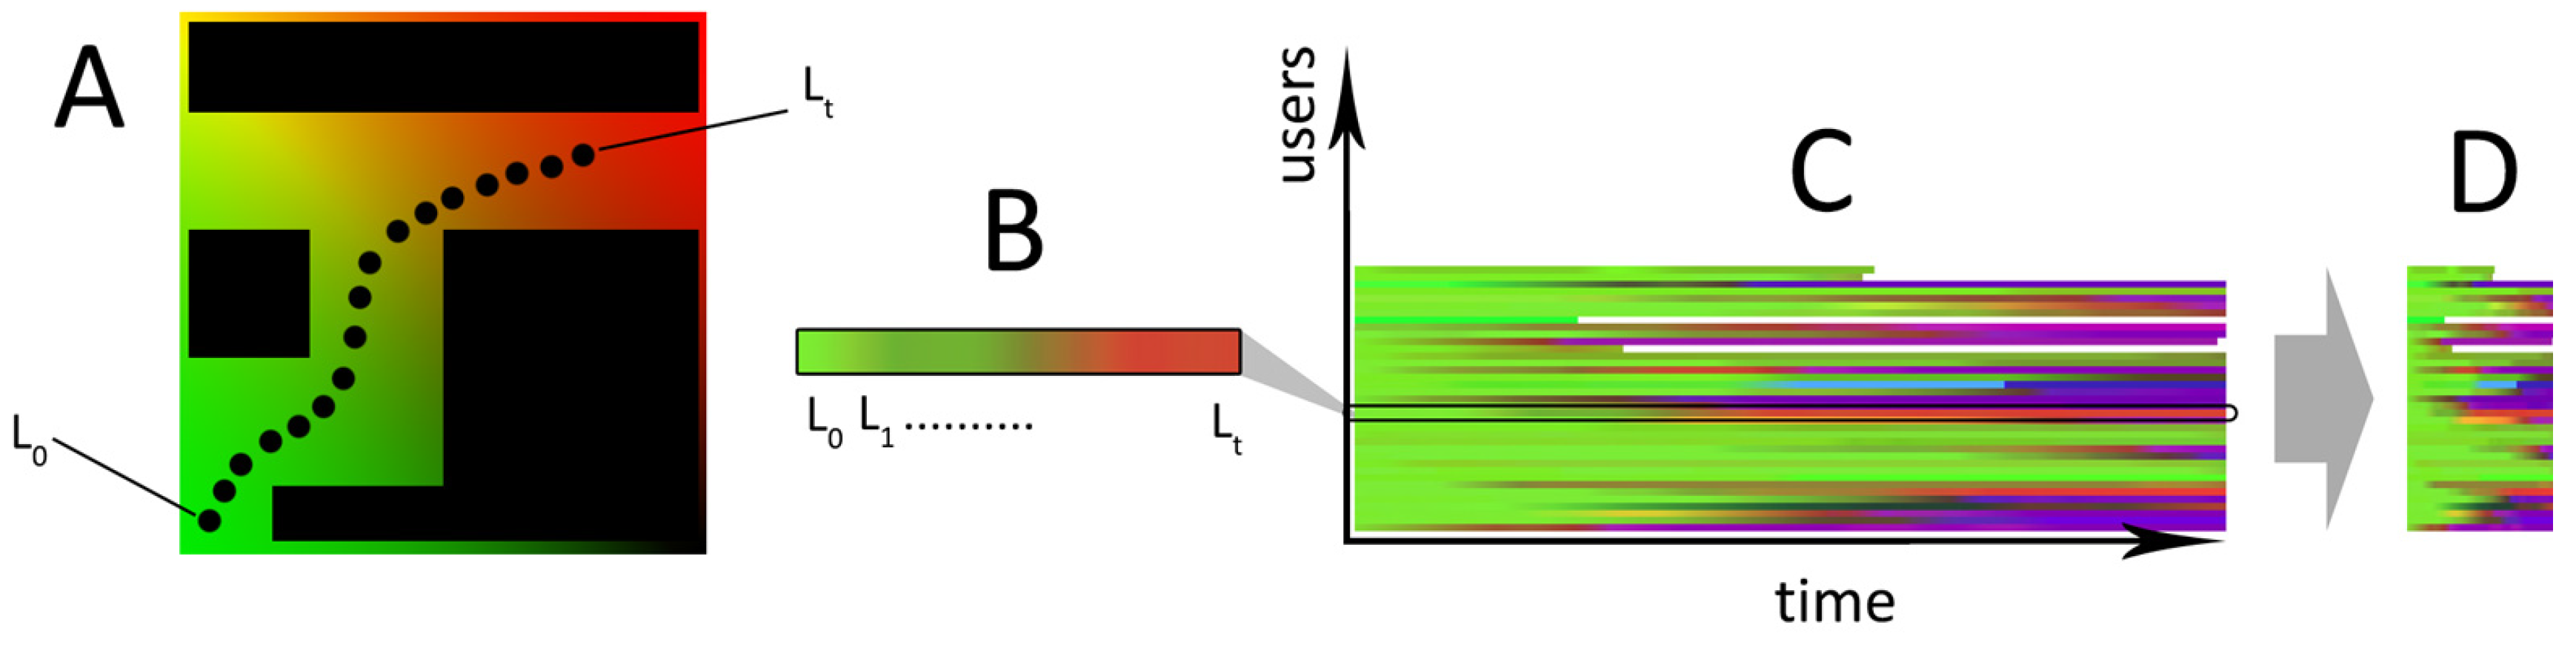
3.2. Time-Driven Layout

Given a single user u, we can encode a spatial attribute a as a stream of encoded colors over time. Figure 3A shows a sample locomotion ( { L 0 , L 1 , , L t } ) recorded over a specific amount of time inside a session volume. These locations can be progressively translated into colors, by applying Definition 2 to produce a signal. Each pixel of the stream refers to a well-defined 3D location in V (voxel) at a given time, provided the analyst (client tool) knows the position and extents of the session volume. Among several advantages including offline data manipulation and direct, lightweight GPU routines (see [27]), such layout offers optimal compression ratios when the PNG format is adopted to store the data. This result is obtained thanks to smooth variations of neighboring pixels, as they will be likely continuous RGB values [23] (for instance locomotion data—see experimental results Section 5).
Multiple streams (users) can be vertically arranged into t i m e × u s e r s image atlases called quantized session atlas (QSA) (see Figure 3B). For a given attribute a, a session volume V is thus capable of encoding S a ( u , t ) entirely in a single compact image and easily exchanged over the network. The QSA layout also allow interactive manipulation using 2D image operations, using offline processing or directly performed on GPU hardware. A QSA regarding a specific spatial attribute for instance, can be easily reduced by compressing the image along x-axis (time) using a nearest-neighbor resampling algorithm, to obtain a lossy but coherent data reduction, creating an approximation of the original record (see Figure 3C).

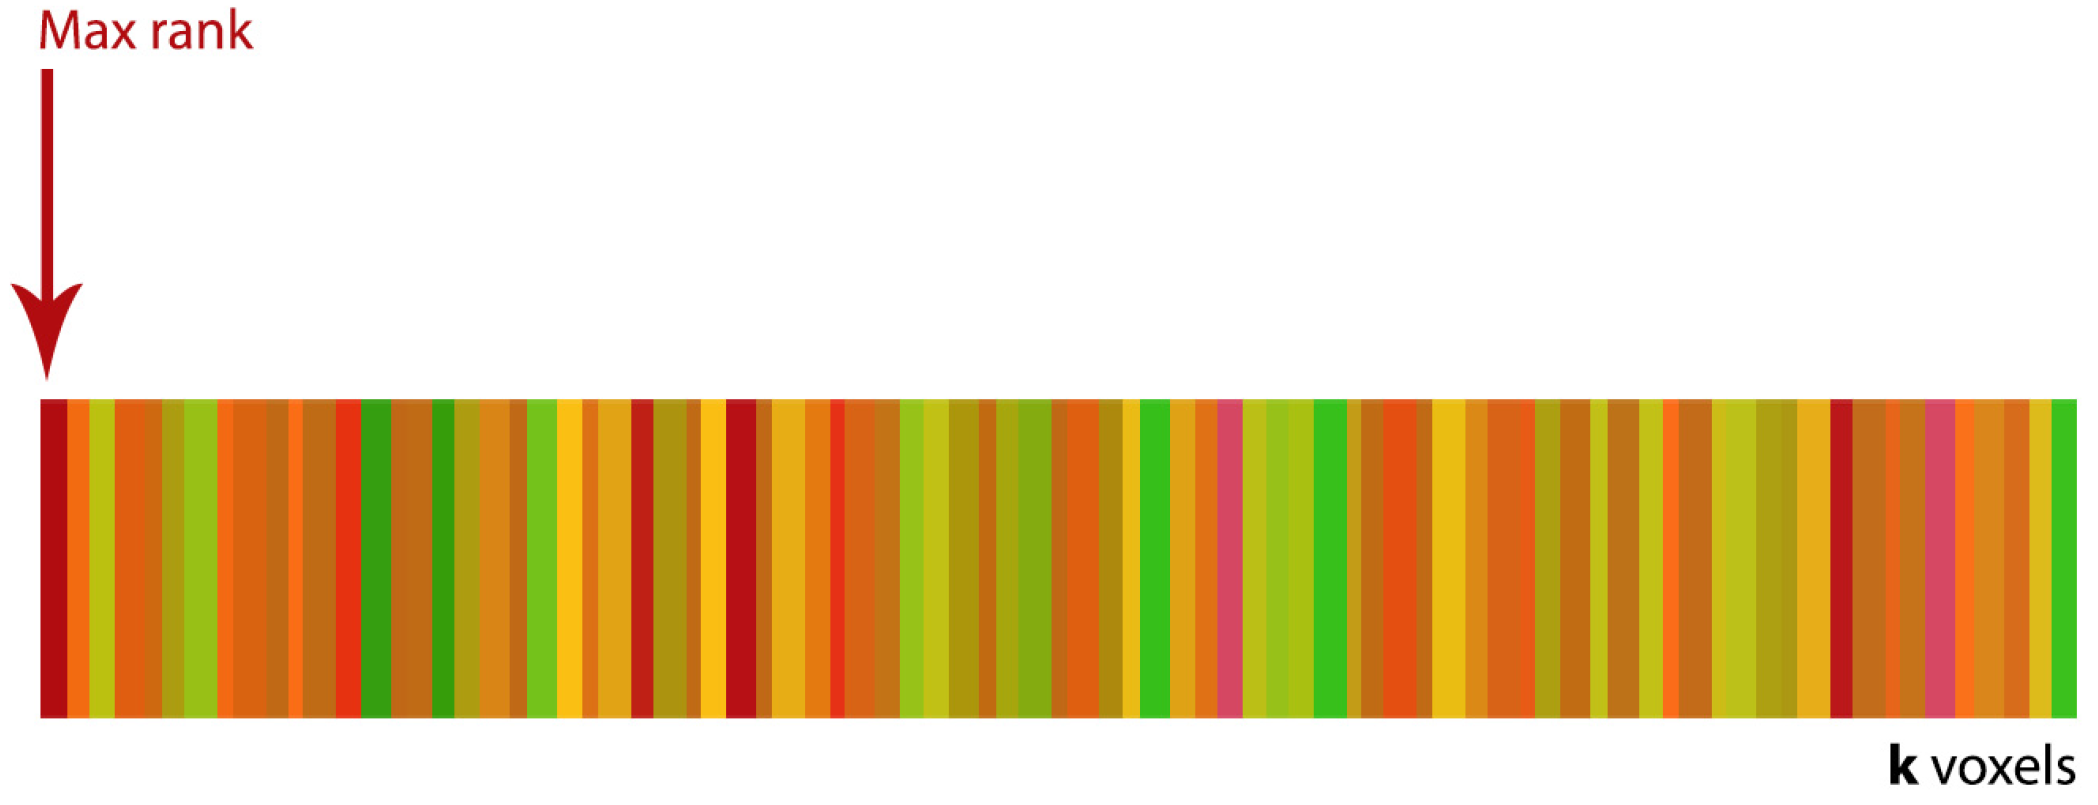
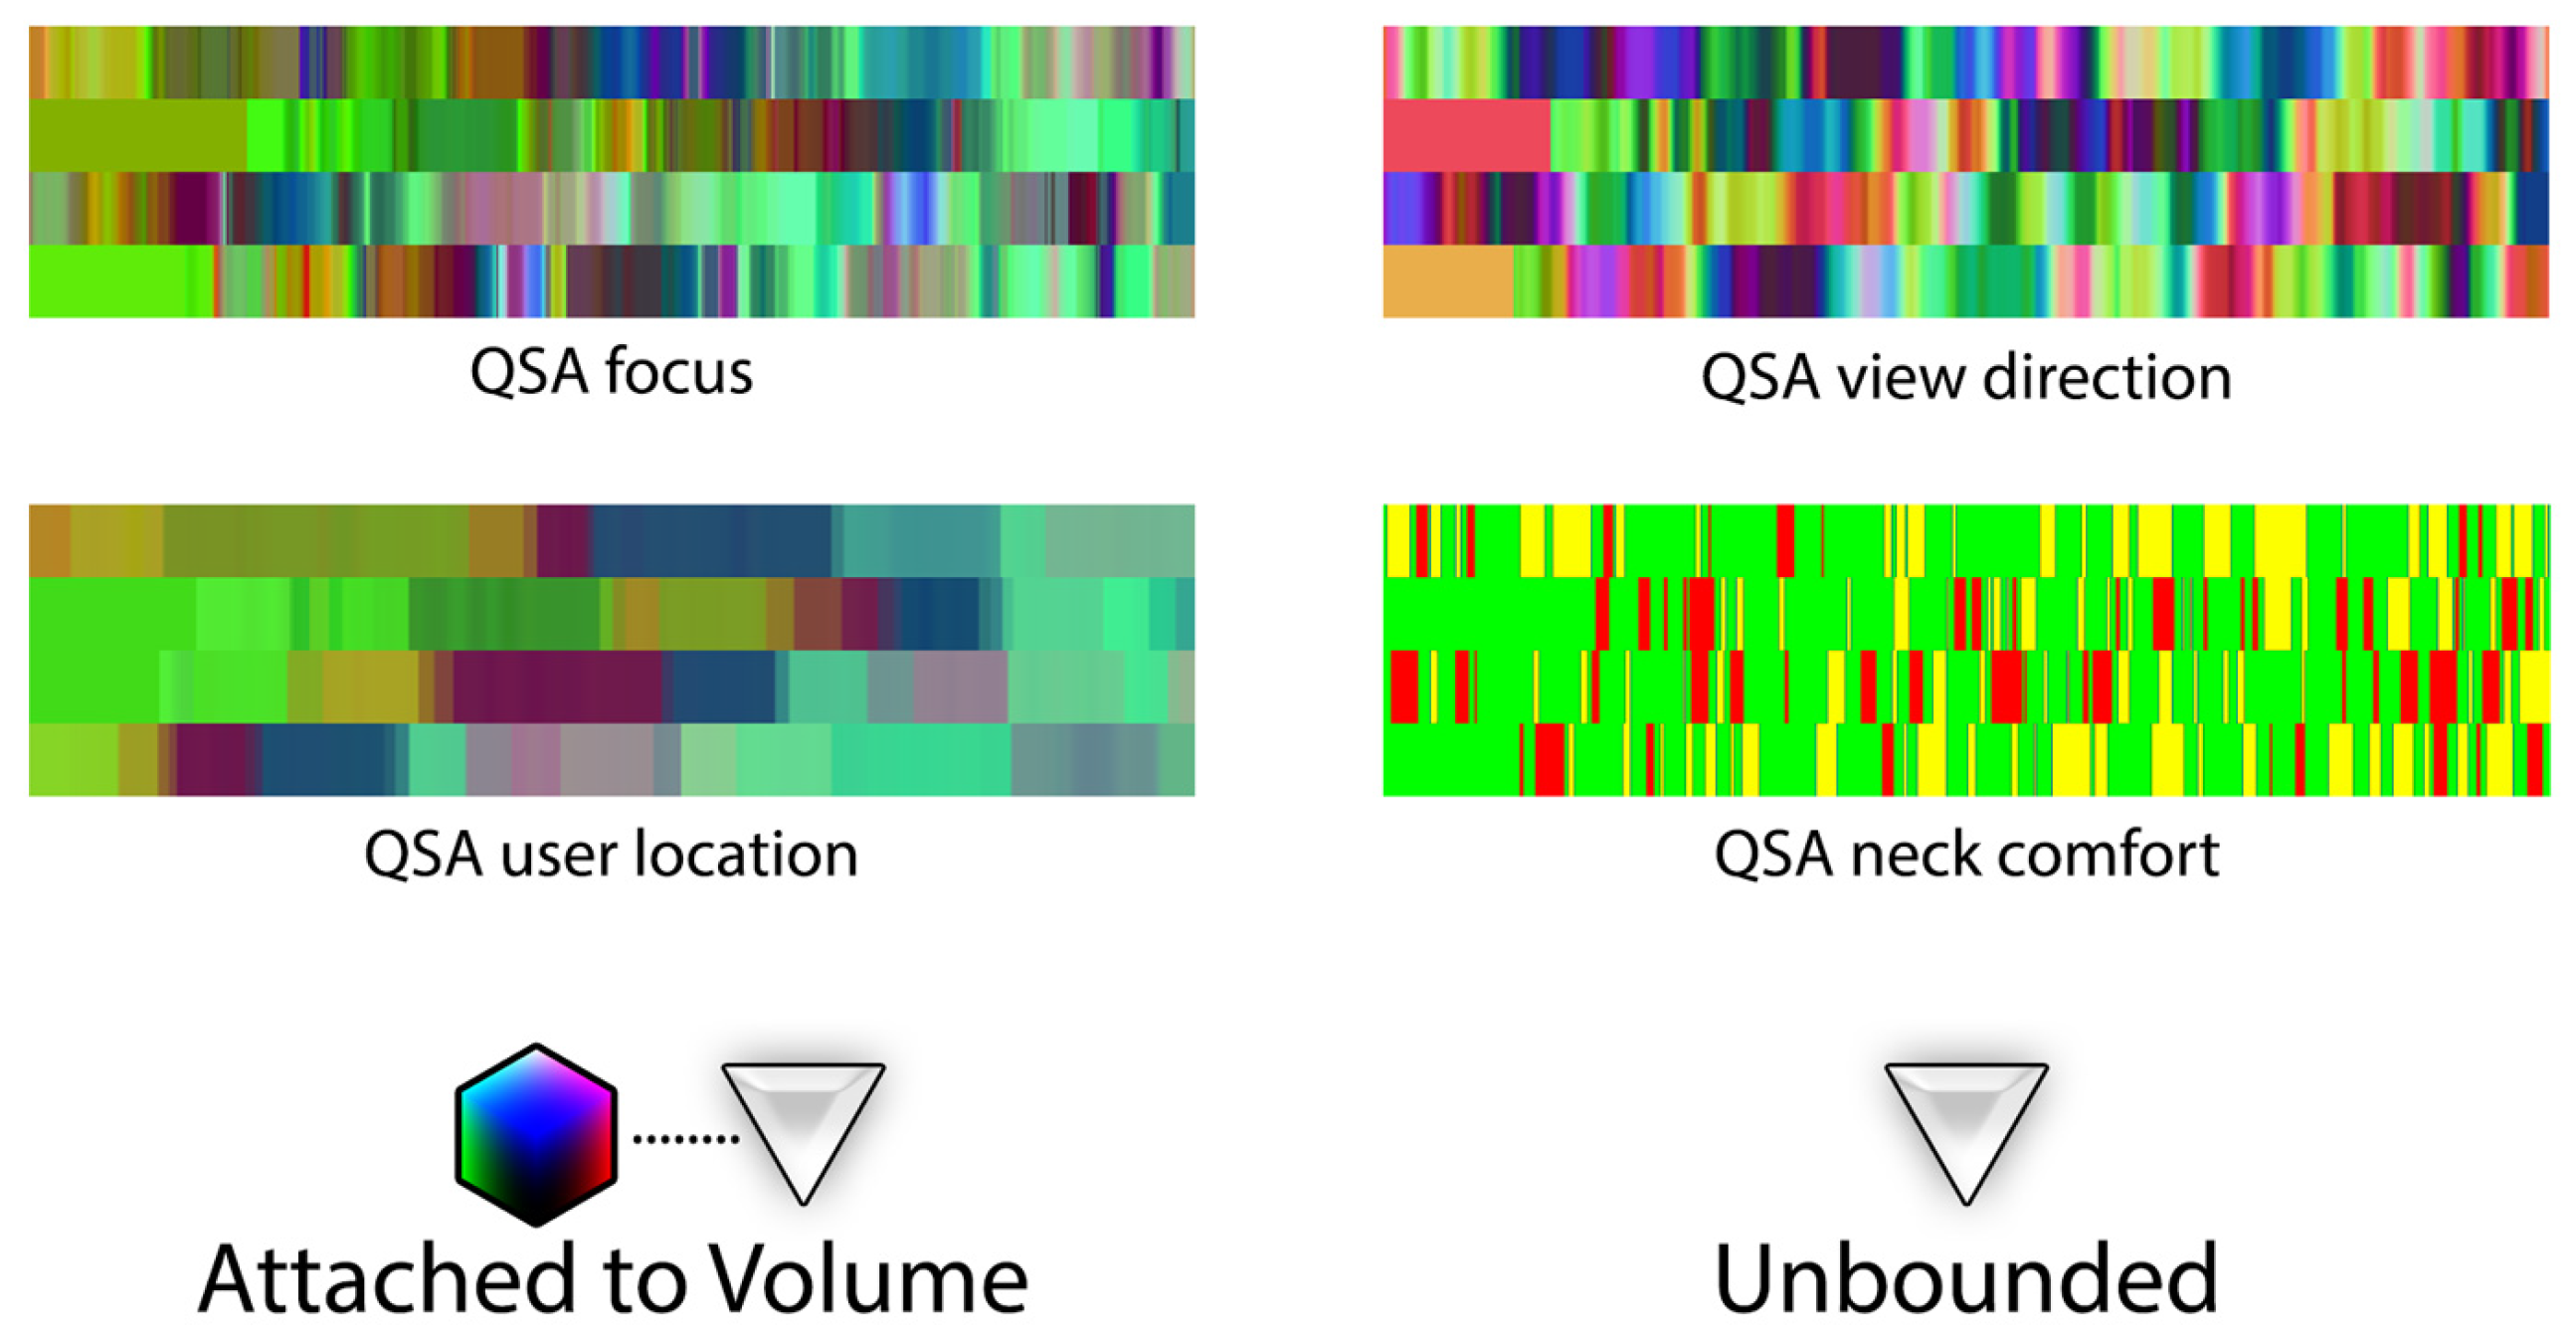
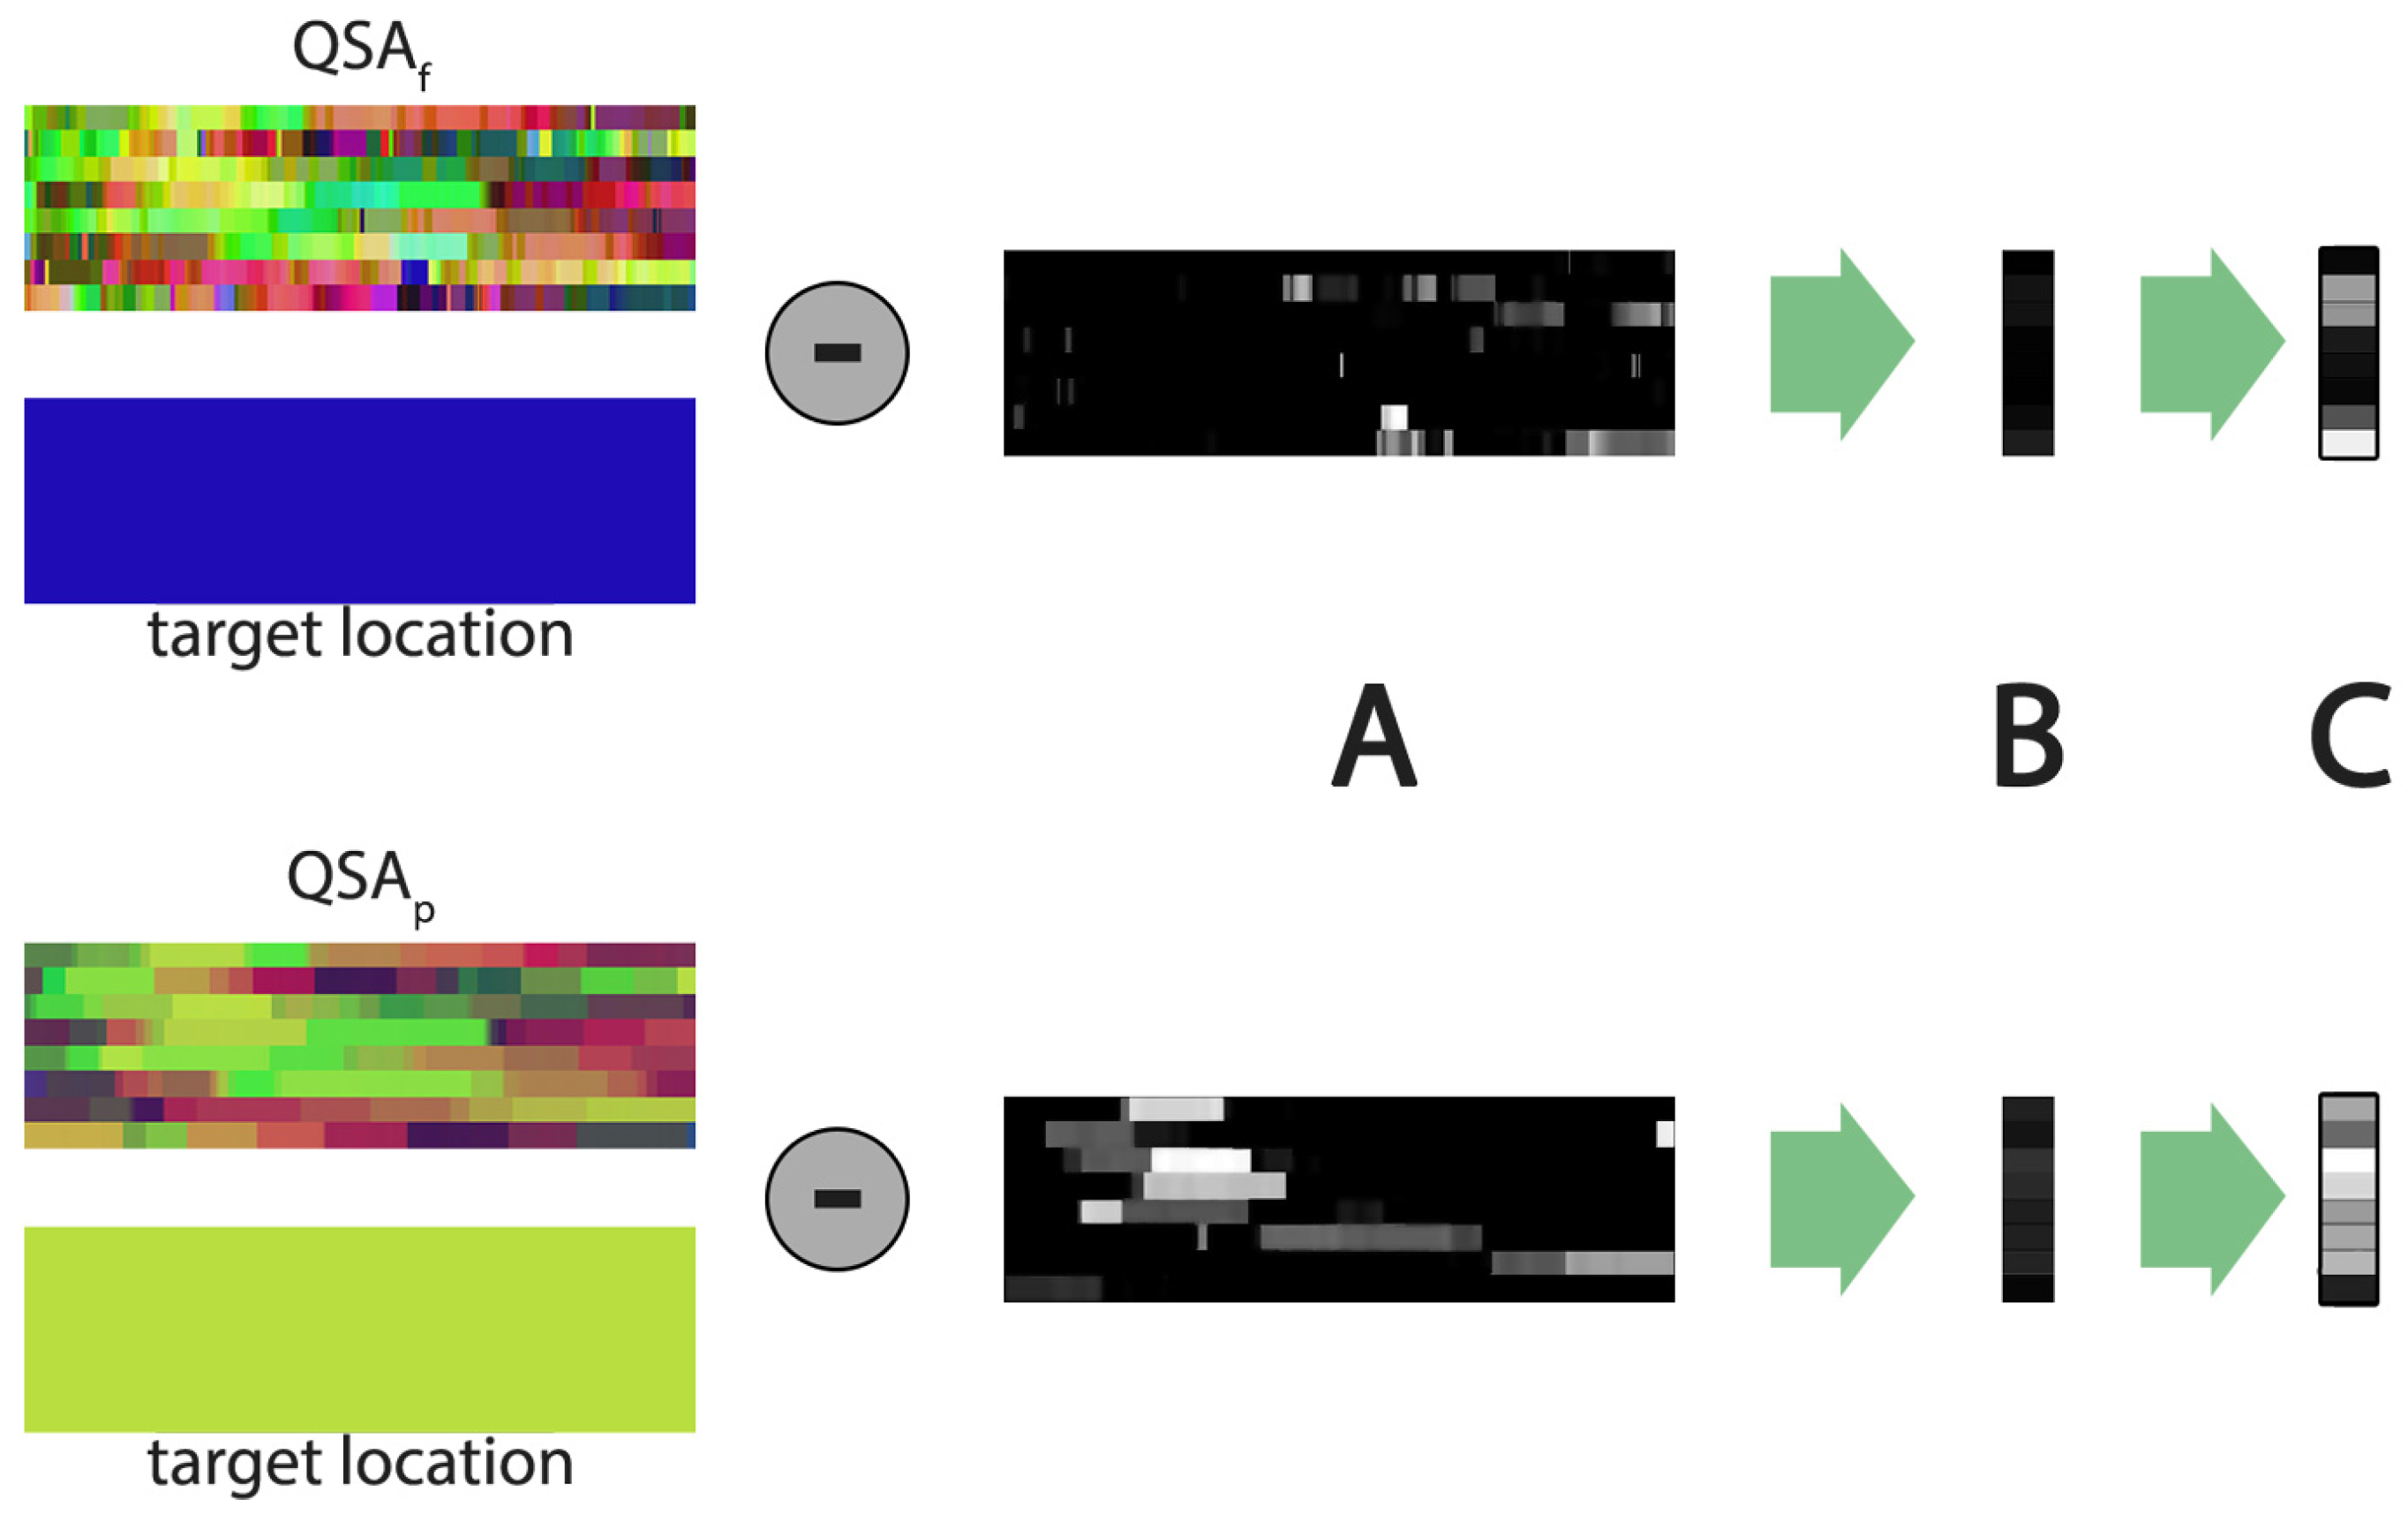
3.3. Saliency-Driven Layout

When a student is interacting with the virtual scene, specific spatial attributes of his/her state can be exploited to compute salient locations for that attribute in a given volume V. Such list of locations can be really useful for teachers/analysts as it provides volumetric data comprising spatial propensities, visual attention, locomotion fixations, etc. A policy can be employed to rank specific locations in V during the session, for instance, persistence over time and/or other contributing factors (see for instance [7] regarding focus). This offers analysts a more compact overview of single or multiple sessions to discover specific interaction patterns in selected portions of the scene, once again encoded as lightweight images.
The main goal of saliency tables ( σ ) is to keep a running record of salient locations inside V, sorted by rank (left to right, see Figure 4). We adopt the same color-coding approach described in Section 3.2 to produce a single image, using alpha channel to store rank. Such running list is maintained constant in size (k) using an algorithm based on [28] to keep frequency counts. Once exchanged as image data, such layout allows to easily perform routines on GPU or offline image processing to partially evaluate σ —for instance by discarding rightmost pixels (lower rank). It becomes also quite easy to compare different signatures produced by one or more students by using image-based manipulations. As an example, σ p (locomotion) can be useful for analysts and teachers to study exploration patterns, map location preferences in V or even support the creation or improvement of locomotion graphs [29] for the IVE. Furthermore, there are several advantages of encoded saliency tables:
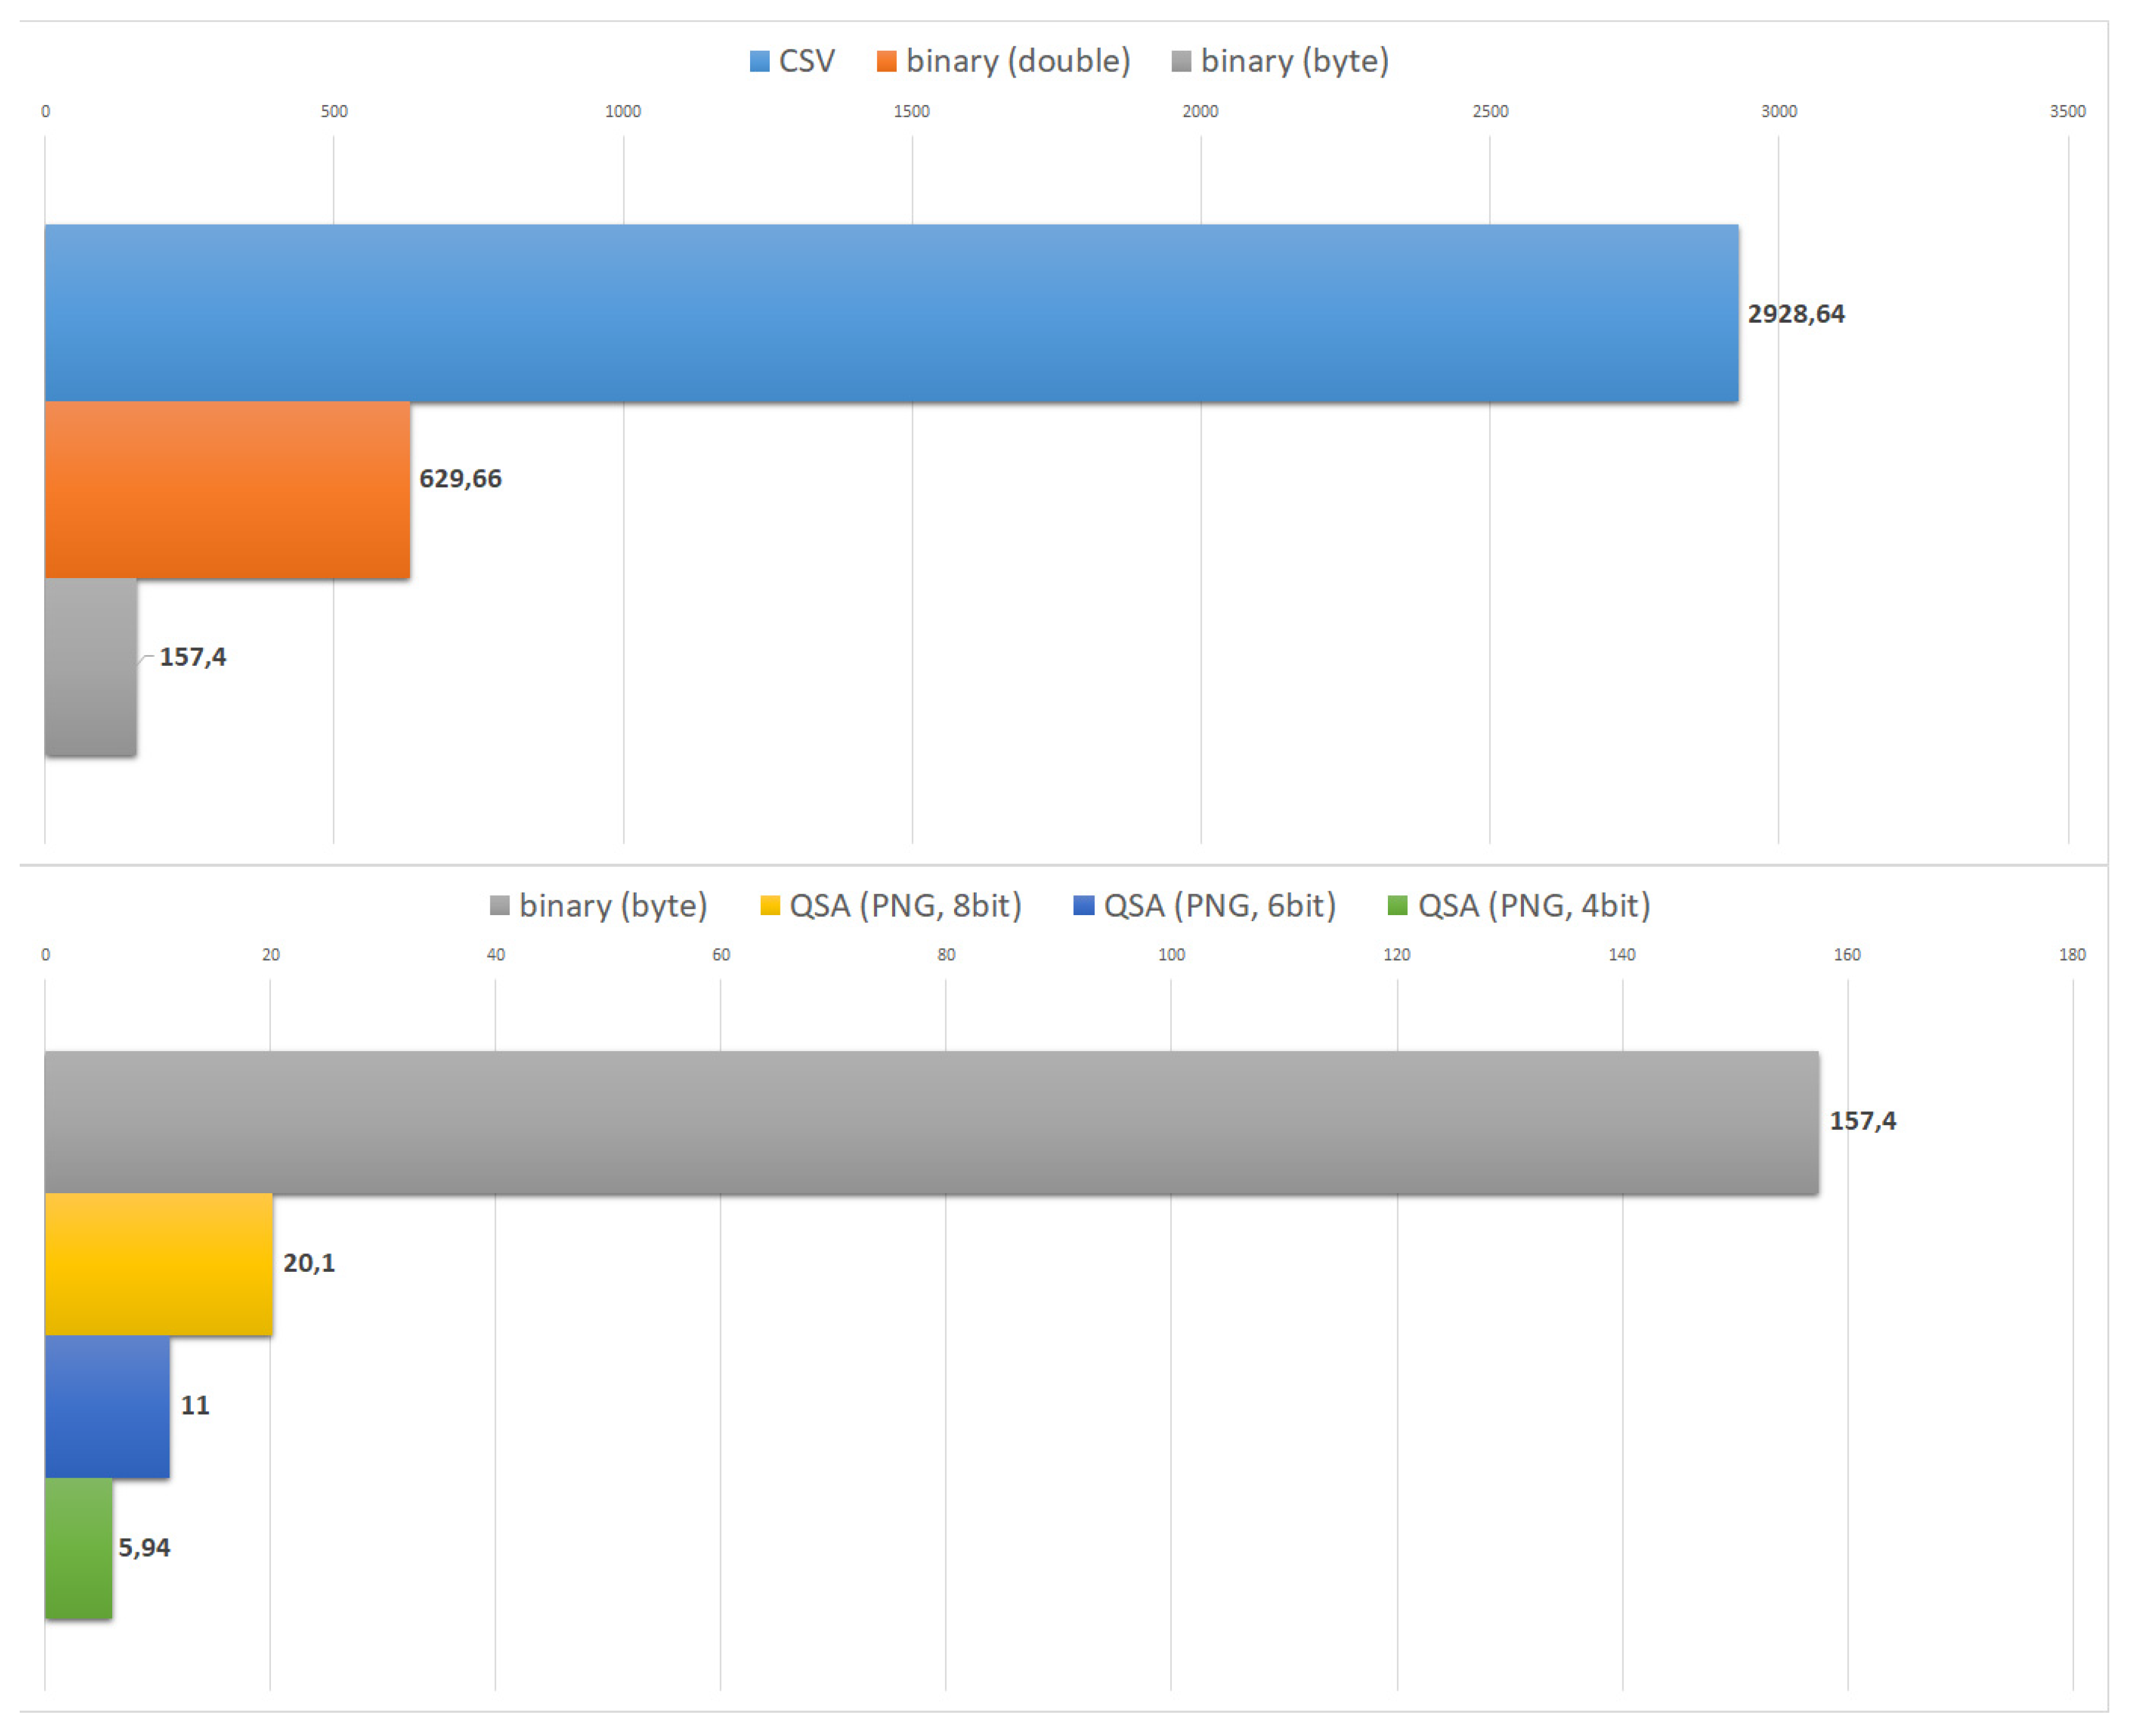
  • compactness: the layout suits very well networked scenarios and remote analytics (see results in Section 5).
  • partial evaluation: the sorted approach of σ allows the rightmost pixel to be discarded (less relevant voxels for chosen policy) maintaining overall approximation of the signature.
  • multiple attributes: different spatial attributes can be arranged in one atlas (like QSA layout in Section 3.2) to transport multiple σ 0 , σ 1 , σ h per volume, using a single lightweight image.

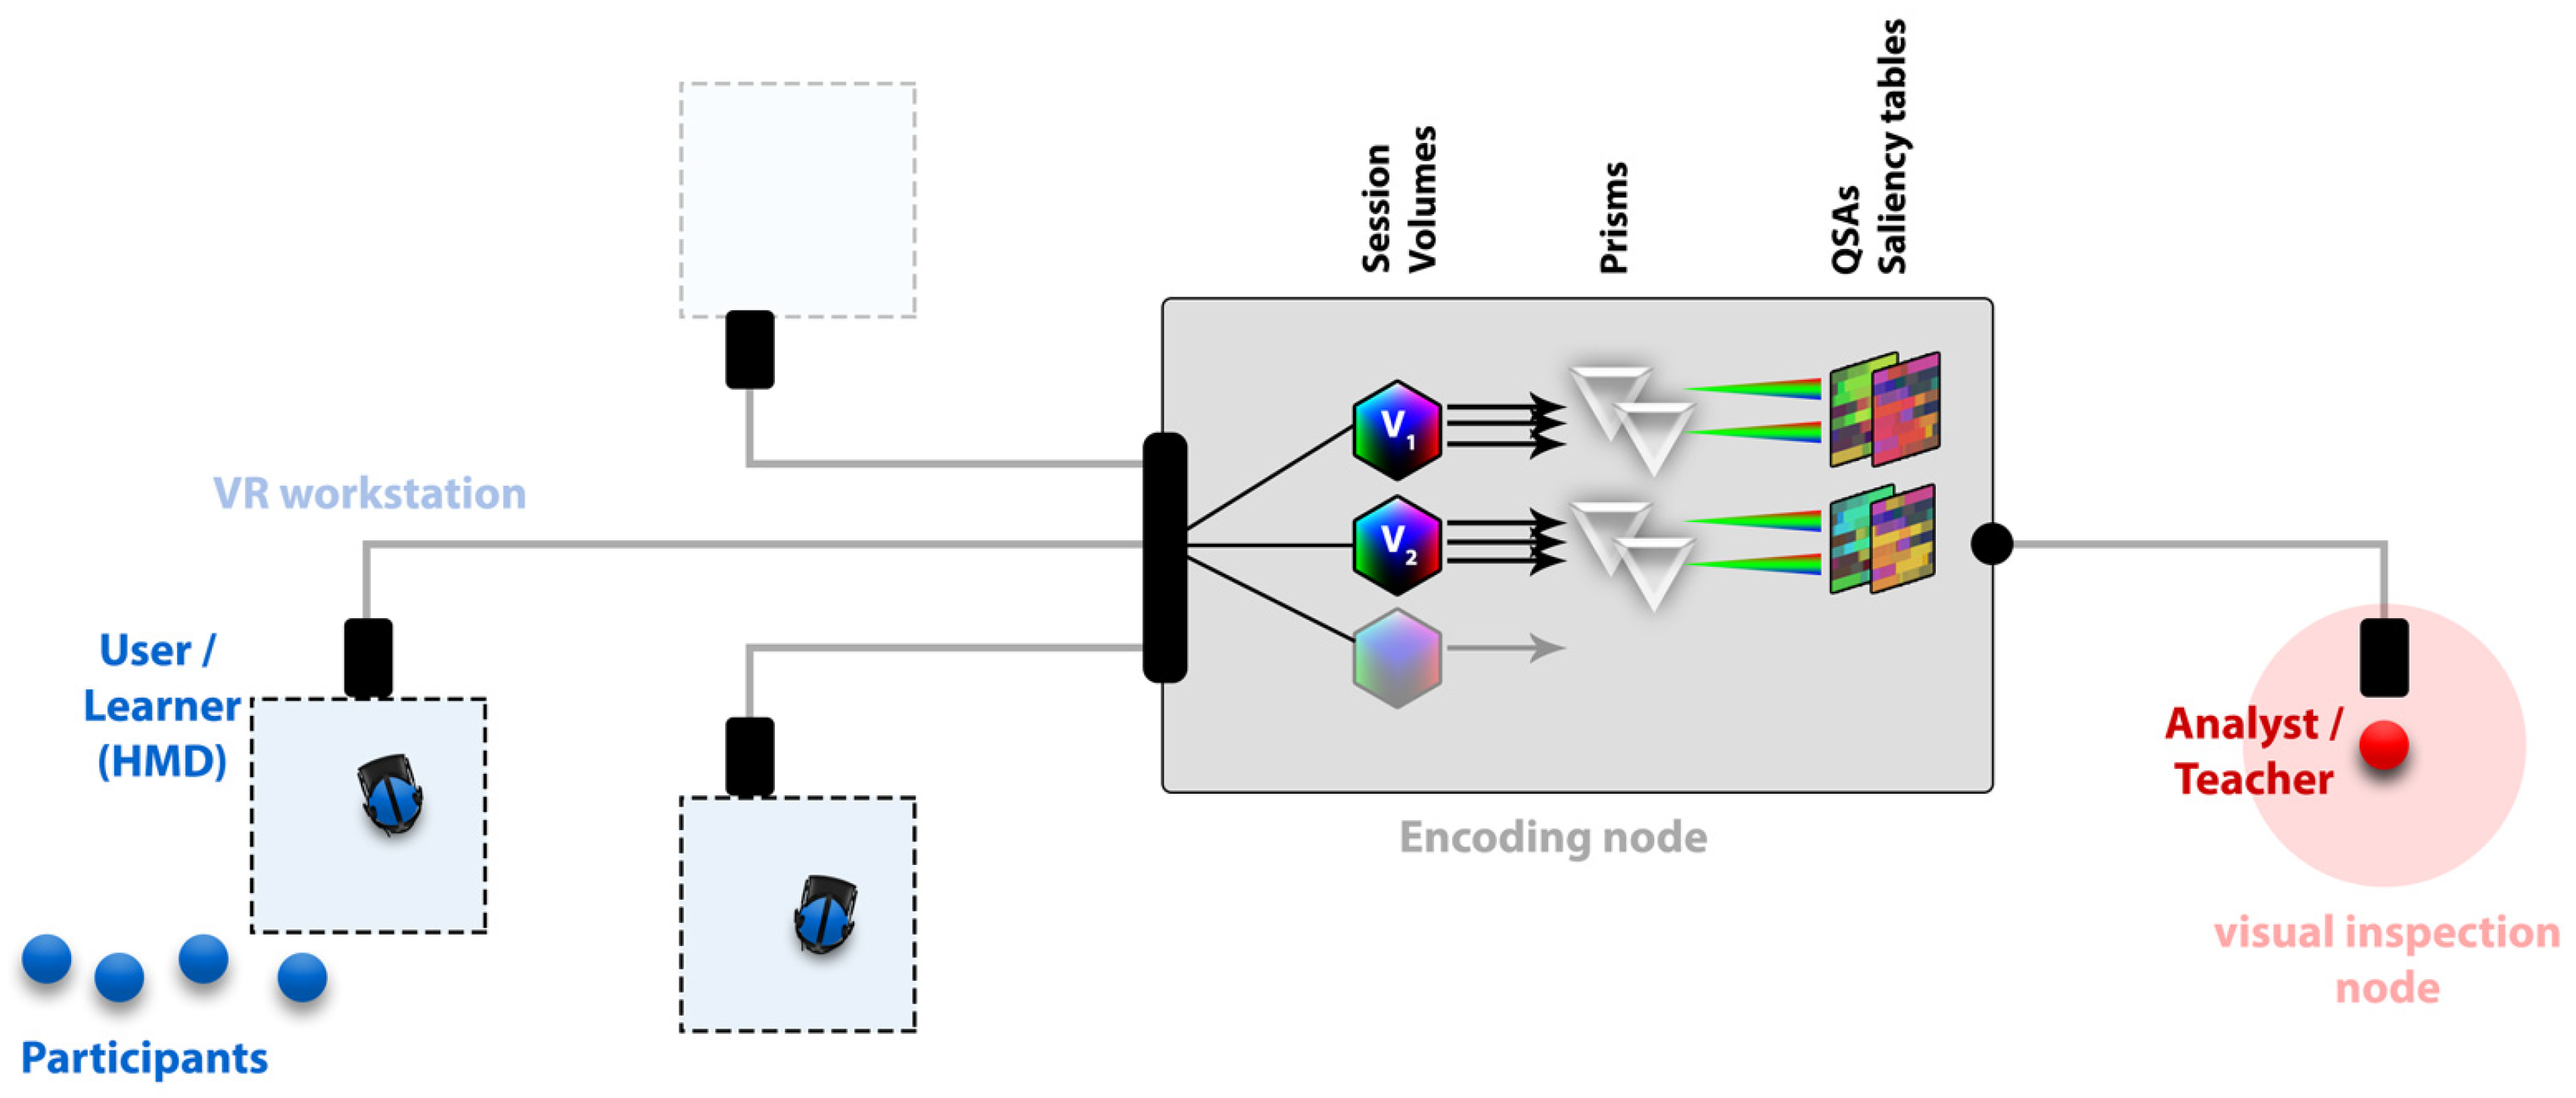
4. PRISMIN Framework Overview

An overview of the implemented architecture of the encoding model is described in this section—as part of the open-source PRISMIN framework (https://github.com/phoenixbf/prismin)—that can be employed or integrated in virtual classrooms, public exhibits or events potentially involving large amounts of users. The whole architecture is composed by three main components (see Figure 5):
1.
immersive VR workstation node (users).
2.
encoding node (server).
3.
visual inspection node (analysts).
Some of these components may physically rely on the same machine, for instance the VR installation and the encoding node, depending on specific conditions (e.g., absence of network connection, etc.).
Casual visitors (e.g., public exhibits) or online students (e.g., virtual classrooms) using multiple VR workstations to interact with a virtual 3D scene (IVE): a single session starts when the HMD is worn and user state is being recorded. The user state is sent to the encoding node comprising attributes to be captured like virtual location (3D scene coordinates), HMD orientation and view direction, focus (3D location), physical location (local 3D location inside the tracked area), etc.

4.1. Encoding Node

The PRISMIN framework and its application programming interface (API) offer all the basic functionalities to create and deploy the described encoding node of the architecture. We highlight here the main classes and methods available to encode students interactions:
  • Atlas: this represents the 2D image that is physically generated on disk and exchanged among peers (learners and teachers/analysts). Each atlas may have a specific layout (how data is accessed) and quantization mechanics (how state attribute is encoded into a color). QSA and saliency tables are examples of image atlas—see Section 3.2 and Section 3.3.
  • Prism: an interaction prism object allows the ability to define how incoming user states are projected into atlases. It must implement a refract method (how state attributes are mapped onto the atlas image or images) and a bake method (write the actual image or images on disk).
  • Volume: this represents a classic AABB structure (see Section 3.1) that operates in a well-defined portion of the scene. Several prisms can be attached to a single volume, providing maximum flexibility on which attributes a teacher is willing to track and how. Notice that each volume operates independently, thus they can be overlapped or nested within the virtual space of the IVE without any issues.
The role of a single prism object is basically to “refract” interaction states into image atlases (like QSA and saliency tables) and may live at runtime attached to a volume, in order to encode spatial attributes (location, focus, etc.) inside specific boundaries of the 3D scene. A prism can although be employed without a reference volume: a few examples are the encoding of HMD orientation, view direction vector or neck strain. Figure 6 shows a few examples of QSAs involving four different students (atlas rows): the encoding of spatial features such as focus and location within the virtual space requires indeed a volume (see Section 3.1) since each color maps a specific 3D location. Other attributes like HMD view direction and neck comfort levels (see [27]) do not require a voxelization of 3D location, thus the interaction prism can operate unbounded (i.e., everywhere in the scene, always running). Indeed, quantization errors still occur, but they highly depend on how the quantizer was defined—these errors will not be discussed in this paper. In the encoding node of the architecture, received user states are thus “refracted” into different QSAs (see Section 3.2) and saliency tables (see Section 3.3) as compact images. From a computational perspective, for each volume ( V 1 , V 2 ,... V k ) such operations present an overall complexity of O ( k · h ) , where k represents the number of session volumes deployed and h the number of different attributes to track ( a 1 , a 2 ,... a h ). Generally h is quite small, since the analyst/teacher is interested into the investigation of selected state attributes (e.g., location, focus, ergonomics, etc.). The number of volumes (k) on the other hand, depends on spatial requirements and complexity of 3D scene (a single volume can sometimes be sufficient to detect interaction patterns in a specific portion of the virtual environment).

4.2. Visual Inspection Node

The visual inspection node allows a remote visual analyst or teacher to inspect session data (lightweight images) as they are generated, through a desktop or web-application (including mobile web-apps). Regarding spatial attributes, the component is able to decode them since location and extents of each volume ( V 1 , V 2 , … V k ) are well known by all peers. Depending on specific teachers requirements, the developed Web3D user interface (UI) may offer different tools to highlight or visually identify interaction patterns. Describing in detail each available interface element is out of scope for this paper, although one common feature is for instance the visualization and playback of recorded locations using a timeline, by direct reading of QSAs and saliency tables. Thanks to the compactness of the encoding model (see experimental results presented in Section 5), the analyst/teacher is thus able to perform visual inspection with ease, even when the users are still performing their remote sessions.

4.3. Integration with Existing Projects

An implementation of the architecture has already been integrated as a component of the open-source project ATON (http://osiris.itabc.cnr.it/scenebaker/index.php/projects/aton/) [30,31,32,33] leveraging the node.js ecosystem [34,35], HTML5 websockets and open-source WebGL libraries for the responsive front-end. ATON offers built-in functionalities to craft and deploy interactive 3D web-apps online, scene-graph manipulation (hierarchies, node transformations, etc.), support for multi-touch and immersive VR devices (HMDs) and real-time collaborative features for communication of users’ states, messages and custom events in local networks or over Internet connections. The next section will present quantitative and qualitative results obtained using the implemented web-based architecture.

5. Experimental Results

5.1. Offline Encoding

This set of experiments highlights different results obtained by running the offline encoding tool provided by PRISMIN framework on ASCII datasets (Comma-separated values—CSV) recorded for a past public event (“TourismA” 2018 in Florence, Italy). The main goal of these experiments was to assess the compression ratios and accuracy of spatial attributes, in this case, locomotion of HMD users ( S p ( u , t ) ). We compared the data size and accuracy results to binary formats (using different precision) and existing lossless approaches. We also evaluated discrepancies and quantization effects by employing different bit-depths for QSAs. The original recording for the original CSV dataset used A timestep of 0.1 s to capture user states: in general this is a good temporal interval to capture spatial attributes (like location in the virtual environment) while the VR session is running. The 3D scene considered is an IVE already used by CNR ISPC in several past projects [36,37]. In order to consider only meaningful sessions, the original locomotion data were first filtered using a set of acceptance policies for sessions performed in this specific IVE: radius (R), variance ( s 2 ) and duration (D). The session radius (R) represents the bounding sphere of all locomotion data for a given user: we set a minimum of 5.0 m to accept the session. Regarding variance ( s 2 ) for locomotion data, a minimum of 5.0 for at least one the three dimensions was set. Finally, a minimum of 20 s for (D) was set to accept the session.
At this point, several tests on filtered VR sessions were performed to assess data size and accuracy, including raw binary and image-based encoding (Section 3). First, a session volume V 0 with extents (50.28 m × 76.46 m × 10.0 m) was deployed: due to voxel quantization (see Definition 4 in Section 3.1) the location maximum error for each dimension is ϵ = < ± 9 cm, ± 14.9 cm and ± 1.9 cm >. A second volume V 1 (25.27 m × 12.85 m × 8.28 m) was added to the 3D scene to encode finer users locomotion on a selected area (stairs) with maximum quantization error ϵ = < ± 4.9 cm, ± 2.5 cm and ± 1.6 cm >.
A size comparison of the original CSV locomotion dataset (2.86 Mb) with lossless binary (double precision and single byte) and QSA (PNG format, bit-depth 8, lossless) was performed. As expected, binary encoding (double and single byte precision) resulted in great compression ratios (21% and 5% respectively) compared to the original CSV (see Figure 7). We applied the image-based model to the same locomotion data using lossless PNG format (bit-depth 8), obtaining a very compact QSA (20.1 Kb) that encodes all locomotion sessions for all users. In order to assess image quantization effects, we performed multiple encoding tests using different bit-depths for QSA, decreasing data size but obviously increasing quantization errors for 3D location decoding. The locomotion data encoding using QSA with bit-depth = 8 led to the following compression ratios: 0.68% (CSV/QSA); 3.19% (binary double precision/QSA); 12.77% (binary byte precision/QSA). The latter employs the same quantization (each 3D location is represented by 3 bytes) and can be used for direct comparison between datasets using same accuracy. As a reference, a lossless encoding scheme for 3D points [38] reports compression ratios of 16.10% and 26.27%, furthermore the encoding/decoding routines in that case depend on previous point (distance-based predictors) and it is more computationally intensive. Such a result can be explained by the lexicographically sorted layout of QSA (see Section 3.2) that considerably improve the compression ratio of encoded location on the PNG image. This layout in fact can be particularly efficient for attributes which change smoothly in the neighborhood of current pixel location on the image atlas, exploiting PNG lossless compression (see [23]).
An assessment of saliency tables for locomotion data ( σ p ) was also performed: the ranking policy adopted for this context was persistence over time. Obtained signatures (lossless PNG format, bit-depth = 8) with 1024 voxels as size of the table, did result in an image size of 286 Kb, thus very comfortable to exchange over the network.
The sequence in Figure 8 shows progressive evaluation of the signature σ p on GPU through the analyst Web3D front-end using a common web browser. The interactive radius did also provide visual support to 3D modeling workflow for applied VR games production phases [39], highlighting which portions of the IVE might possibly require higher detail. Such data produced by casual visitors through a free locomotion model thus resulted in useful insights to prioritize improvements of 3D scene (geometry, texturing, etc.) for immersive VR exploration applications for this IVE.

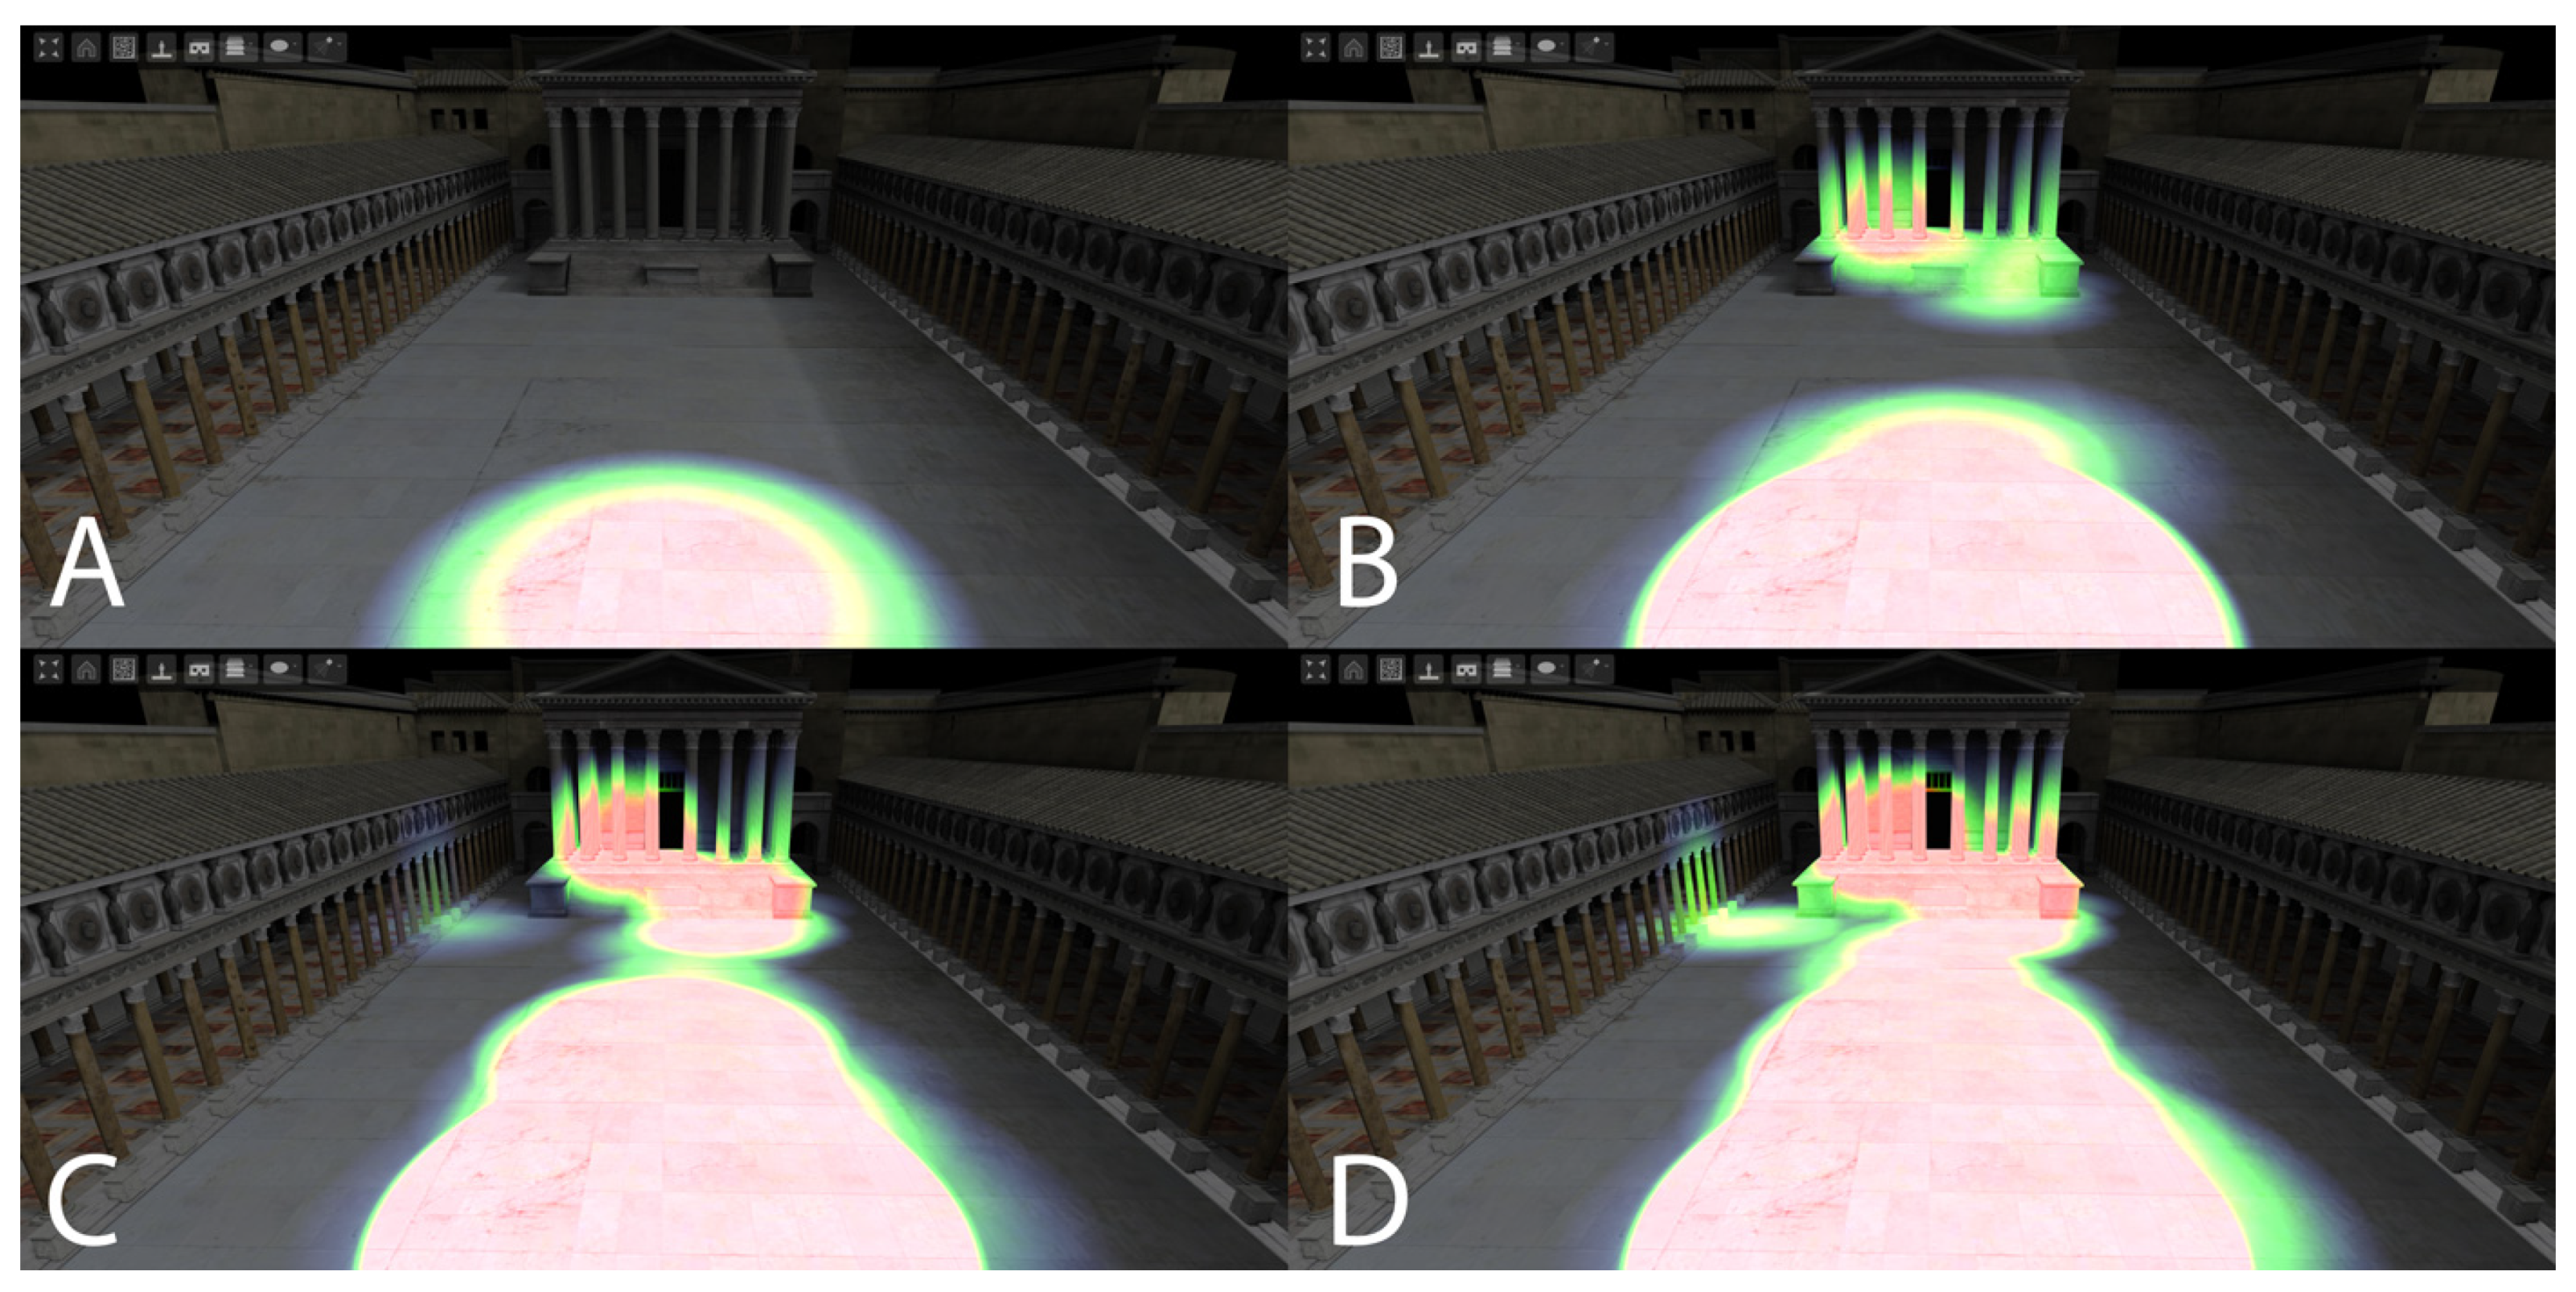
5.2. Direct Encoding and Manipulation
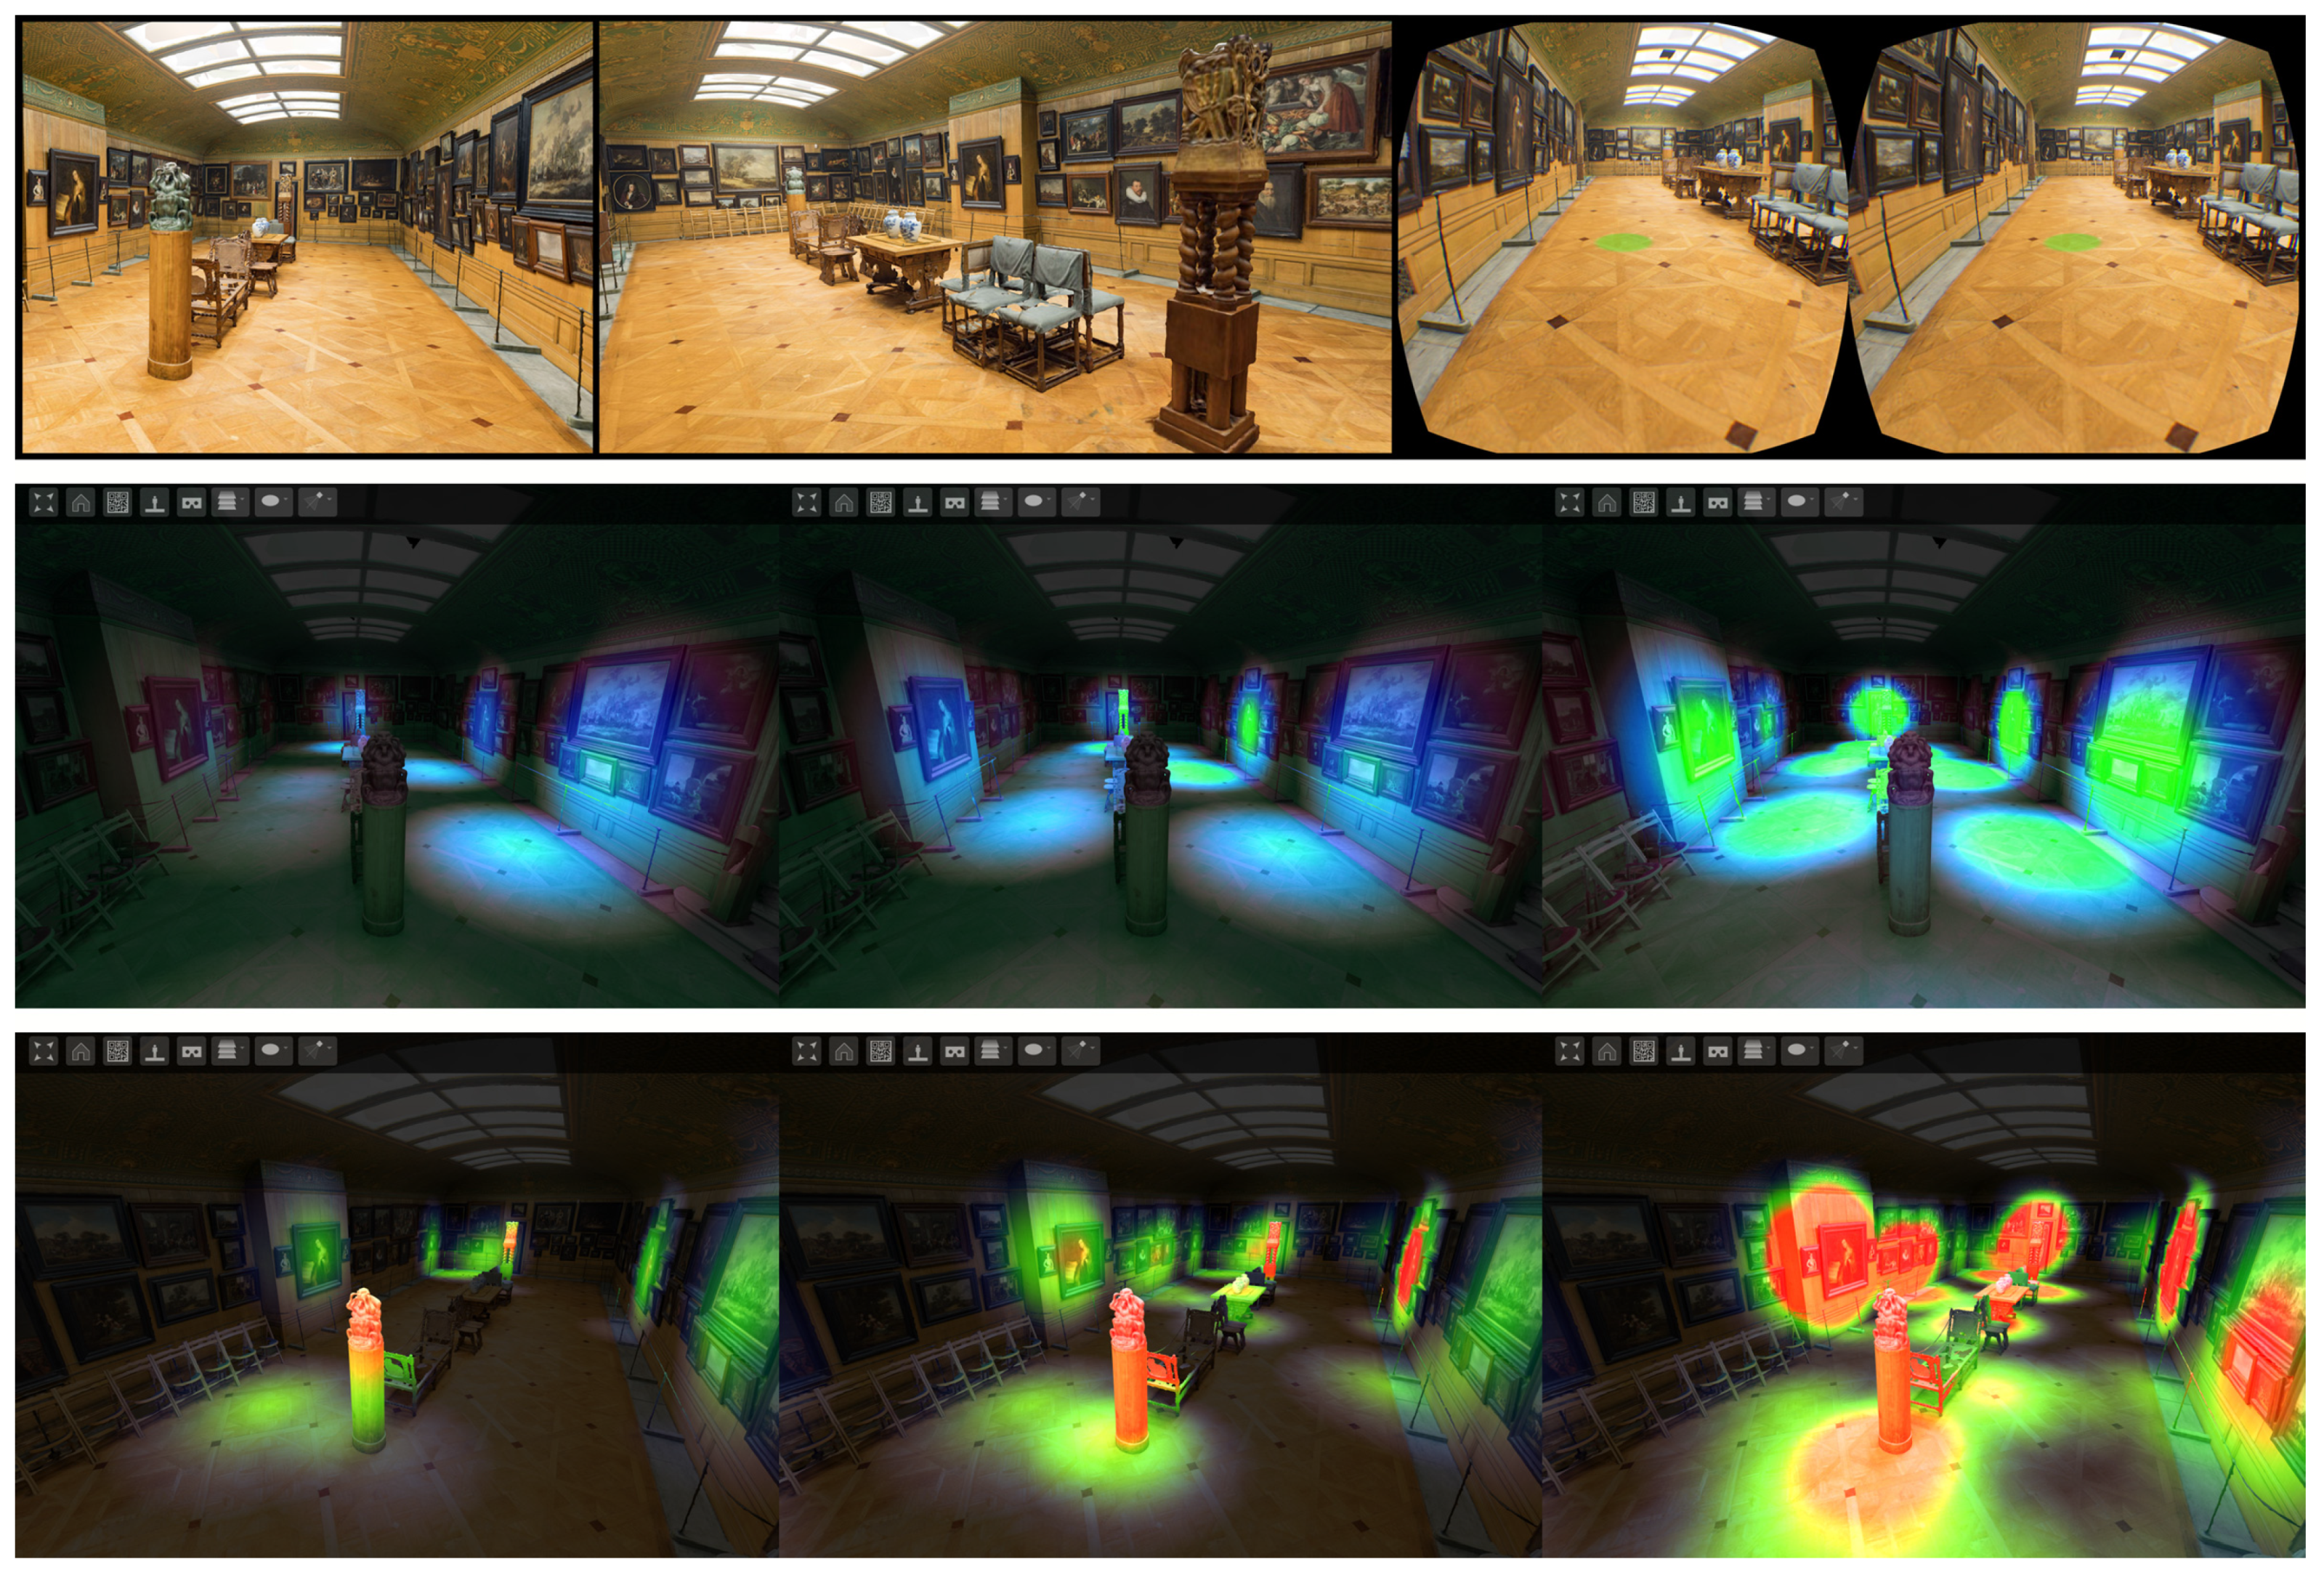
A different set of experiments was carried out to assess the framework in a networked environment using WebVR/XR technologies between a remote group of students having different backgrounds and one analyst, all using common web browsers to interact with the 3D scene. After the sessions we also performed basic 2D image operations to measure users’ performance with respect to specific target locations. The setup included:
(A)
one HMD workstation for eight students to explore a sample scene Picture Gallery, created by Hallwyl Museum (Stockholm, Sweden) and available online on SketchFab. using the WebVR/XR online front-end (using Firefox web browser—see Figure 9, top row).
(B)
one server node serving 3D content and encoding incoming user states.
(C)
one workstation where the remote analyst could inspect ongoing sessions, visualizing running QSAs and saliency tables generated by (A) in real-time.
We involved eight participants having different backgrounds, to differentiate spatial results and compare interaction patterns:
  • 4 archaeologists.
  • 2 art historians.
  • 1 architect.
  • 1 computer scientist.
Students had to carry out short explorative sessions using a HMD (Oculus Rift CV1) in the sample scene (see Figure 9, top) through a WebVR/XR-enabled workstation connected to the encoding node deployed on a server. A common teleport technique (see [40]) was adopted for HMD participants allowing them to move around the scene using a single button on the VR controllers. Due to the restricted number of users, the compression ratio of QSAs against binary format (single byte precision) in this case was less pronounced: 56% regarding focus ( Q S A f ) and 29% regarding locomotion ( Q S A p ). The higher compression for locomotion is explained by the teleport interface adopted, resulting in a “blocky” Q S A p (see Figure 10) compared to focus location Q S A f , that exhibits more frequent variations (HMD motions to observe different details of the scene).
During the sessions, a remote analyst was using a third workstation to visually inspect generated QSAs and saliency tables on the encoding node (see Figure 9, middle and bottom strips) using a common browser (Chrome). Specifically, evolving saliency tables for locomotion fixations σ p and focus σ f were useful to identify ongoing users’ attention and usage of the virtual space.
In order to assess proximity to specific target locations (selected pictures in the gallery scene), we performed basic 2D operations directly on focus and locomotion QSAs. Since each location (voxel) inside the volume can be represented by a color, we basically performed image subtraction (color distance) on both Q S A f and Q S A p (see Figure 10) to obtain proximity to target locations over time (A). A basic resampling filter along x-axis (time) can be applied to the image to obtain a weighted average (B) for proximity and image normalization (C) to rank overall performance for the eight students. Notice how these operations can be easily automated using offline 2D image processing algorithms or directly performed on GPUs.

6. Conclusions and Future Developments

We described applications of an image-based encoding model to capture immersive VR sessions for events in public or shared spaces, virtual classrooms or online experiences, producing compact and lightweight data (images) for interactive, remote visual inspection. The developed open-source PRISMIN framework did prove to be suitable for networked scenarios (online classrooms, distance learning VR, etc.) and could be particularly useful for remote analysts, teachers and other professionals to support learning assessment, spatial analysis and to easily detect interaction patterns emerging from large amounts of users consuming educational immersive VR environments (IVEs). Within IVEs targeting education (including online WebVR/XR scenes) the captured data can offer valid support for learning assessment as the students explore and interact with the immersive 3D environment. Session Volumes offer simple accessories to volumetrically capture interaction states and attributes at runtime. Once deployed in a 3D scene (IVE) they encode users’ states over time into lightweight and compact image atlases (QSA). Thanks to basic color-space mappings and layouts, small computational resources are used for encoding and decoding routines. Furthermore, the image-based approach allow direct manipulation of captured data on GPU hardware and by means of basic 2D image processing, including easier comparison between different datasets. Interaction Prisms offered by the PRISMIN framework allow to flexibly define and customize how incoming user states are consumed and refracted into image atlases. Advantages of the framework are highlighted storage-wise (QSA and saliency tables) and in terms of scalable approaches, including deployment of several session volumes in the IVE, tracking of custom attributes and expandable architectures for the Web. We also discuss how extents and bit-depth of such volumes may impact accuracy for spatial attributes (quantization).
The compactness of the image-based encoding allows for the integration of the PRISMIN framework with distance learning technologies and remote analytics, performed by a common web browser. Regarding locomotion data for instance, we obtained compression ratios of 12.77% using QSA (image-based encoding) implemented in PRISMIN, that outperforms other lossless encoding schemes like [38] reporting 16.10% as best scenario. Such a compression ratio is explained by the lexicographically sorted layout of QSA (see Section 3.2) that considerably reduce the size of encoded locations on the PNG image (see [23]). Furthermore, encoded 3D locations in our model do not introduce dependencies on previous values, thus can be accessed and decoded with ease. The image-based approach allows in fact offline or direct 2D image manipulation to extract, combine or compare user interactions (see Section 5.2). Such operations are indeed more complex to obtain when dealing with raw binary data, especially when such data is in a compressed form. The QSA layout also allows analysts, teachers and other professionals to observe patterns at first glance by just observing produced image atlases (human-readable).
Regarding limitations, the model presents quantization errors affecting accuracy of 3D locations (more in general spatial attributes in the volume) introducing a controlled error—see Section 3.1.1. As discussed, such quantization error depends on volume extents and color bit-depth adopted for QSA. The presented problem can be mitigated (or solved) by arranging multiple session volumes in the IVE, focusing on smaller areas to capture fine-grained and more accurate spatial data. The recording of prolonged students’ VR sessions using QSA layout could be limited by image size: we already addressed this issue employing paging techniques [27].
We previously used the encoding model also to capture ergonomics, like neck strain while wearing HMDs (see [27]) tracking comfort levels over time for multiple immersive sessions in a single QSA. Consumer 6 degrees of freedom (DOF) headsets allow to track areas of a few meters: session volumes could be also attached to physical spaces to capture and/or assess students’ spatial performances. For instance a 3 × 3 m physical tracked area matching a virtual session volume with the same extents, would result in small quantization errors (± 5 mm, using lossless PNG with bit-depth = 8) to capture spatial attributes. We foresee advantages in capturing physical motions inside the tracked area and its usage during the session, for instance local HMD motions (e.g., assessment of real walking techniques), positional VR controllers or tracked hands (see for instance Oculus Quest HMD).
Since the framework deals with images, QSAs and saliency tables can be also employed in machine learning (ML) approaches as training data to classify user performances or recognize interaction patterns for learning assessment. The QSA layout also offers a simple and coherent way to reduce original dataset resolution (see temporal compression in Section 3.2), creating progressive approximations of the record. The framework and the encoding model proven to be suitable for online WebVR/XR sessions: we foresee also fruitful integration with MOOCs providing VR training [14,41] offering online tools for teachers/instructors to assess students spatial learning and easily detect interaction patterns.

Author Contributions

Conceptualization, investigation, visualization and software, B.F.; Writing-review and editing, L.C. All authors have read and agreed to the published version of the manuscript.

Funding

This research received no external funding.

Acknowledgments

Authors would like to thank D. Ferdani (CNR ISPC) for providing portions of old 3D models used for Keys2Rome project (http://keys2rome.eu/); the Hallwyl Museum and their 3D models freely available (CC BY-SA 4.0) on SketchFab; all the volunteers involved in online WebVR/XR experiments and all CNR ISPC people involved in VR installation for “TourismA 2018” event.

Conflicts of Interest

The authors declare no conflict of interest.

Abbreviations

The following abbreviations are used in this manuscript:
IVEImmersive Virtual Environment
HMDHead-mounted Display
DOFDegrees of Freedom (3 or 6 for head-mounted displays)
QSAQuantized Session Atlas

References

  1. Maher, D. Altered Realities: How Virtual and Augmented Realities Are Supporting Learning. In Handbook of Research on Innovative Pedagogies and Best Practices in Teacher Education; IGI Global: Hershey, PA, USA, 2020; pp. 34–51. [Google Scholar]
  2. Mantovani, G. VR learning: Potential and challenges for the use of 3D. In Towards Cyberpsychology: Mind, Cognitions, and Society in the Internet Age; IOS Press: Amsterdam, The Netherlands, 2003; pp. 208–225. [Google Scholar]
  3. Herz, M.; Rauschnabel, P.A. Understanding the diffusion of virtual reality glasses: The role of media, fashion and technology. Technol. Forecast. Soc. Chang. 2019, 138, 228–242. [Google Scholar] [CrossRef]
  4. Shute, V.; Rahimi, S.; Emihovich, B. Assessment for Learning in Immersive Environments. In Virtual, Augmented, and Mixed Realities in Education; Springer: Cham, Switzerland, 2017; pp. 71–87. [Google Scholar]
  5. Airey, D.; Benckendorff, P. Standards, benchmarks and assurance of learning. In Handbook of Teaching and Learning in Tourism; Edward Elgar Publishing: Cheltenham, UK, 2017. [Google Scholar]
  6. Wong, P.C.; Thomas, J. Visual analytics. IEEE Comput. Graph. Appl. 2004, 24, 20–21. [Google Scholar] [CrossRef] [PubMed]
  7. Agus, M.; Marton, F.; Bettio, F.; Gobbetti, E. Interactive 3D exploration of a virtual sculpture collection: An analysis of user behavior in museum setting. In Proceedings of the 13th Eurographics Worhshop on Graphics and Cultural Heritage, Genoa, Italy, 5–7 October 2016. [Google Scholar]
  8. Jankowski, P.; Andrienko, N.; Andrienko, G.; Kisilevich, S. Discovering landmark preferences and movement patterns from photo postings. Trans. GIS 2010, 14, 833–852. [Google Scholar] [CrossRef]
  9. Jain, A.K. Data clustering: 50 years beyond K-means. Pattern Recognit. Lett. 2010, 31, 651–666. [Google Scholar] [CrossRef]
  10. Battersby, S.A.; Lavelle, M.; Healey, P.G.; McCabe, R. Analysing Interaction: A comparison of 2D and 3D techniques. In Proceedings of the Programme of the Workshop on Multimodal Corpora, Marrakech, Morocco, 27 May 2008; p. 73. [Google Scholar]
  11. Boletsis, C. The new era of virtual reality locomotion: A systematic literature review of techniques and a proposed typology. Multimodal Technol. Interact. 2017, 1, 24. [Google Scholar] [CrossRef] [Green Version]
  12. Scopigno, R.; Callieri, M.; Dellepiane, M.; Ponchio, F.; Potenziani, M. Delivering and using 3D models on the web: Are we ready? Virtual Archaeol. Rev. 2017, 8, 1–9. [Google Scholar] [CrossRef]
  13. Maclntyre, B.; Smith, T.F. Thoughts on the Future of WebXR and the Immersive Web. In Proceedings of the 2018 IEEE International Symposium on Mixed and Augmented Reality Adjunct (ISMAR-Adjunct), Munich, Germany, 16–20 October 2018; pp. 338–342. [Google Scholar]
  14. See, Z.S.; Lee, X.S.; Brimo, A.; Thwaites, H.; Goodman, L. MOOC for AR VR Training. In Proceedings of the IEEE Games, Entertainment, Media Conference (GEM), Galway, Ireland, 16–17 August 2018; pp. 1–9. [Google Scholar]
  15. Sitzmann, V.; Serrano, A.; Pavel, A.; Agrawala, M.; Gutierrez, D.; Masia, B.; Wetzstein, G. Saliency in VR: How do people explore virtual environments? IEEE Trans. Vis. Comput. Graph. 2018, 24, 1633–1642. [Google Scholar] [CrossRef] [PubMed] [Green Version]
  16. Upenik, E.; Ebrahimi, T. A simple method to obtain visual attention data in head mounted virtual reality. In Proceedings of the 2017 IEEE International Conference on Multimedia & Expo Workshops (ICMEW), Hong Kong, China, 10–14 July 2017; pp. 73–78. [Google Scholar]
  17. Knorr, S.; Ozcinar, C.; Fearghail, C.O.; Smolic, A. Director’s Cut-A Combined Dataset for Visual A ention Analysis in Cinematic VR Content. In Proceedings of the CVMP ’18 15th ACM SIGGRAPH European Conference on Visual Media Production, London, UK, 13–14 December 2018. [Google Scholar]
  18. Chandler, T.; Cordeil, M.; Czauderna, T.; Dwyer, T.; Glowacki, J.; Goncu, C.; Klapperstueck, M.; Klein, K.; Marriott, K.; Schreiber, F.; et al. Immersive analytics. In Proceedings of the Big Data Visual Analytics (BDVA), Hobart, Australia, 22–25 September 2015; pp. 1–8. [Google Scholar]
  19. Butcher, P.W.; Roberts, J.C.; Ritsos, P.D. Immersive Analytics with WebVR and Google Cardboard. In Proceedings of the Posters of IEEE VIS, Baltimaore, MD, USA, 23–28 October 2016. [Google Scholar]
  20. Butcher, P.W.; John, N.W.; Ritsos, P.D. Towards a Framework for Immersive Analytics on the Web. In Proceedings of the IEEE Conference on Visualization: InfoVis, Berlin, Germany, 21–26 October 2018. [Google Scholar]
  21. Hadjar, H.; Meziane, A.; Gherbi, R.; Setitra, I.; Aouaa, N. WebVR based interactive visualization of open health data. In Proceedings of the 2nd International Conference on Web Studies, Paris, France, 8–10 October 2018; pp. 56–63. [Google Scholar]
  22. Wiggins, R.H.; Davidson, H.C.; Harnsberger, H.R.; Lauman, J.R.; Goede, P.A. Image file formats: Past, present, and future. Radiographics 2001, 21, 789–798. [Google Scholar] [CrossRef] [PubMed]
  23. Limper, M.; Jung, Y.; Behr, J.; Sturm, T.; Franke, T.; Schwenk, K.; Kuijper, A. Fast, progressive loading of binary-encoded declarative-3d web content. IEEE Comput. Graph. Appl. 2013, 33, 26–36. [Google Scholar] [CrossRef] [PubMed]
  24. Dworak, D.; Pietruszka, M. Fast encoding of huge 3D data sets in lossless PNG format. In New Research in Multimedia and Internet Systems; Springer: Berlin, Germany, 2015; pp. 15–24. [Google Scholar]
  25. Gu, X.; Gortler, S.J.; Hoppe, H. Geometry images. ACM Trans. Graph. 2002, 21, 355–361. [Google Scholar] [CrossRef]
  26. Fanini, B.; Cinque, L. An Image-Based Encoding to Record and Track Immersive VR Sessions. In International Conference on Computational Science and Its Applications; Springer: Berlin/Heidelberg, Germany, 2019; pp. 299–310. [Google Scholar]
  27. Fanini, B.; Cinque, L. Encoding immersive sessions for online, interactive VR analytics. Virtual Real. 2019. [Google Scholar] [CrossRef]
  28. Manku, G.S.; Motwani, R. Approximate frequency counts over data streams. In Proceedings of the VLDB’02, 28th International Conference on Very Large Databases, HongKong, China, 20–23 August 2002; pp. 346–357. [Google Scholar]
  29. Habgood, M.J.; Moore, D.; Wilson, D.; Alapont, S. Rapid, continuous movement between nodes as an accessible virtual reality locomotion technique. In Proceedings of the 2018 IEEE Conference on Virtual Reality and 3D User Interfaces (VR), Reutlingen, Germany, 18–22 March 2018; pp. 371–378. [Google Scholar]
  30. Meghini, C.; Scopigno, R.; Richards, J.; Wright, H.; Geser, G.; Cuy, S.; Fihn, J.; Fanini, B.; Hollander, H.; Niccolucci, F.; et al. ARIADNE: A research infrastructure for archaeology. J. Comput. Cult. Herit. 2017, 10, 18. [Google Scholar] [CrossRef] [Green Version]
  31. Fanini, B.; Pescarin, S.; Palombini, A. A cloud-based architecture for processing and dissemination of 3D landscapes online. Digit. Appl. Archaeol. Cult. Herit. 2019, e00100. [Google Scholar] [CrossRef]
  32. Antal, A.; Bota, E.; Ciongradi, C.; D’Annibale, E.; Demetrescu, E.; Dima, C.; Fanini, B.; Ferdani, D. A complete workflow from the data collection on the field to the deployment of a Virtual Museum: The case of Virtual Sarmizegetusa. Digit. Appl. Archaeol. Cult. Herit. 2016. [Google Scholar] [CrossRef]
  33. Barsanti, S.G.; Malatesta, S.G.; Lella, F.; Fanini, B.; Sala, F.; Dodero, E.; Petacco, L. The winckelmann300 project: Dissemination of culture with virtual reality at the capitoline museum in rome. Int. Arch. Photogramm. Remote. Sens. Spat. Inf. Sci. 2018, 42. [Google Scholar] [CrossRef] [Green Version]
  34. Cantelon, M.; Harter, M.; Holowaychuk, T.; Rajlich, N. Node js in Action; Manning Greenwich: Shelter Island, NY, USA, 2014. [Google Scholar]
  35. Tilkov, S.; Vinoski, S. Node.js: Using JavaScript to build high-performance network programs. IEEE Internet Comput. 2010, 14, 80–83. [Google Scholar] [CrossRef]
  36. Fanini, B.; d’Annibale, E.; Demetrescu, E.; Ferdani, D.; Pagano, A. Engaging and shared gesture-based interaction for museums the case study of K2R international expo in Rome. In Proceedings of the 2015 Digital Heritage, Granada, Spain, 28 September–2 October 2015; Volume 1, pp. 263–270. [Google Scholar]
  37. Antonaci, A.; Pagano, A. Technology enhanced visit to museums. A case study: Keys to Rome. In Proceedings of the INTED2015, Madrid, Spain, 2–4 March 2015; pp. 2–4. [Google Scholar]
  38. Liu, X.; Wang, Y.; Hu, Q.; Yu, D. A scan-line-based data compression approach for point clouds: Lossless and effective. In Proceedings of the 2016 4th International Workshop on Earth Observation and Remote Sensing Applications (EORSA), Guangzhou, China, 4–6 July 2016; pp. 270–274. [Google Scholar]
  39. Ferdani, D.; Fanini, B.; Piccioli, M.C.; Carboni, F.; Vigliarolo, P. 3D reconstruction and validation of historical background for immersive VR applications and games: The case study of the Forum of Augustus in Rome. J. Cult. Herit. 2020. [Google Scholar] [CrossRef]
  40. Bozgeyikli, E.; Raij, A.; Katkoori, S.; Dubey, R. Point & teleport locomotion technique for virtual reality. In Proceedings of the 2016 Annual Symposium on Computer-Human Interaction in Play, Austin, TX, USA, 16–19 October 2016; pp. 205–216. [Google Scholar]
  41. Concannon, B.J.; Esmail, S.; Roduta Roberts, M. Head-Mounted Display Virtual Reality in Post-Secondary Education and Skill Training: A Systematic Review. Frontiers in Education. Frontiers 2019, 4, 80. [Google Scholar]
Figure 1. (Left) A single session volume arranged in a sample immersive virtual environment (IVE). (Right) A sample visualization of color-coded locations of the same IVE using the spatial quantizer (Definition 2). Each location inside the volume can thus be translated into a color and vice versa.
Applsci 10 02026 g001
Figure 2. Decoding 3D location (p) from a quantized RGB value (voxel < i , j , k > V ).
Applsci 10 02026 g002
Figure 3. Quantized session atlas (QSA) layout. A sample locomotion from L 0 to L t locations, involving only XY-plane for clarity (A); encoding motion into color-coded signal (B); QSA layout (C) and temporal compression (D).
Applsci 10 02026 g003
Figure 4. Example of a saliency table with size k, comprising most salient locations.
Applsci 10 02026 g004
Figure 5. Architecture components overview.
Applsci 10 02026 g005
Figure 6. Examples of QSAs generated by prisms attached to a volume to track spatial attributes over time (left) and standalone (right).
Applsci 10 02026 g006
Figure 7. Top: data size comparison (Kb) between original dataset (CSV) and binary (double and byte precision). Bottom: comparison between binary (byte) and QSA (lossless PNG with bit-depths 8, 6 and 4).
Applsci 10 02026 g007
Figure 8. Progressively decoding σ p (location persistence over time) from A to D on the GPU at runtime.
Applsci 10 02026 g008
Figure 9. The sample interactive scene with immersive WebVR/XR visualization for students (top); interactive inspection of scene saliency: σ p (locomotion, middle) and σ f (focus, bottom) by remote analyst using a web browser (Chrome) while students are remotely exploring the virtual environment using head-mounted displays (HMDs).
Applsci 10 02026 g009
Figure 10. Basic image operations to extract proximity to target locations and performance over the session (portions of QSAs are shown for the sake of clarity). Image subtraction (A); temporal resampling (B) and normalization (C).
Applsci 10 02026 g010

