Article

Optimal Cache Deployment for Video-On-Demand in Optical Metro Edge Nodes under Limited Storage Capacity †

1
Dipartimento di Elettronica, Informazione e Bioingegneria, Politecnico di Milano, 20133 Milano, Italy
2
Networking Laboratory, University of Applied Sciences of Southern Switzerland, 6928 Manno, Switzerland
*
Author to whom correspondence should be addressed.
This paper is an extended version of paper published in the IEEE Conference and Exhibition on Global Telecommunications, GLOBECOM held in Abu Dhabi, 9–13 December 2018.
Appl. Sci. 2020, 10(6), 1984; https://doi.org/10.3390/app10061984
Submission received: 18 December 2019 / Revised: 5 March 2020 / Accepted: 9 March 2020 / Published: 13 March 2020
(This article belongs to the Special Issue Optical Network Evolution Towards 5G)

Abstract

:
Network operators must continuously explore new network architectures to satisfy increasing traffic demand due to bandwidth-hungry services, such as video-on-demand (VoD). A promising solution which enables offloading traffic consists of terminating VoD requests locally through deploying caches at the network edge. However, deciding the number of caches to deploy, their locations in the network and their dimensions in terms of storage capacity is not trivial and must be jointly optimized, to reduce costs and utilize network resources efficiently. In this paper, we aim to find the optimal deployment of caches in a hierarchical metro network, which minimizes the overall network resource occupation for VoD services, in terms of number of caches deployed across the various network levels, their locations and their dimensions (i.e., storage capacity), under limited storage capacity. We first propose an analytical model which serves as a tool to find the optimal deployment as a function of various parameters, such as popularity distribution and location of metro cache. Then, we present a discrete-event simulator for dynamic VoD provisioning to verify the correctness of the analytical model and to measure the performance of different cache deployment strategies in terms of overall network resource occupation. We prove that, to minimize resource occupation given a fixed budget in terms of storage capacity, storage capacity must be distributed among caches at different layers of the metro network. Moreover, we provide guidelines for the optimal cache deployment strategy when the available storage capacity is limited. We further show how the optimal deployment of caches across the various metro network levels varies depending on the popularity distribution, the metro network topology and the amount of storage capacity available (i.e., the budget invested in terms of storage capacity).

1. Introduction

Online video streaming, especially video-on-demand (VoD), has been the main driving force for the recent escalation in the overall Internet traffic. To cope with traffic growth, operators are continuously exploring network architectural solutions which provide users with more capacity and improved quality of service (QoS) while keeping network-resource occupation low and avoiding excessive costs.
A promising solution consists of enhancing nodes at the edge of the network with storage and computing capabilities [1], allowing edge nodes to deliver services from locations close to end users. In particular, VoD content caching enables storing video content, preferably the most popular, in storage elements (i.e., caches) and delivering them from proximity to end-users, thereby offloading from the network, a substantial amount of traffic [2]. Caching also grants further benefits, such as improved quality of experience (QoE) for the end-users [3] and reduced overall network energy consumption [4]. However, a cache deployment consisting of a high number of large-capacity caches in edge nodes requires a very large economic investment. For instance, a content-centric router with a cache size of 10 TB using flash-based solid-state drives (SSDs) is estimated to cost around $300,000 and consume 500 Watts of power [5]. Thus, it is decisive that network operators, for a given investment, or in other words, under a limited storage capacity, choose the cache deployment strategy which significantly minimizes network resource occupation. With cache deployment strategy, we refer here to choosing the number of caches, their locations (where in the network) and their sizes (how much storage capacity). An effective deployment strategy must take into consideration network topology, users’ requirements and characteristics of the service (e.g., size and the popularity distribution of the video content catalog). In this work, we aim to find the optimal cache deployment that minimizes network resource-occupation; i.e., the amount of capacity occupied in the network to perform VoD content delivery, for a given investment in terms of storage capacity (i.e., under limited storage capacity available). Here, we note that recent debates about network-neutral-caching [6] have also addressed a similar problem: regulations of network neutrality force content providers to utilize a specific amount of storage capacity to perform caching [7,8]. In that case, however, network operators aim to minimize network resource occupation, subject to constraints given by network neutrality regulations, instead of by a limited monetary investment.
We focus our analysis on hierarchical optical metro-area networks. Current metro networks feature several hierarchical layers, and, when deploying caches, it is not a trivial task to decide the number of caches to be deployed; where they should be located; and how to distribute the available storage capacity among the caches of the different network layers, specifically if constrained by storage capacity. In our previous work [9], we addressed the problem through developing a discrete event-based simulator for dynamic VoD provisioning. The simulator generates VoD content requests according to VoD-content popularity model, and based on network status (e.g., available bandwidth on links) and cache deployment strategy, provisions the VoD content requests. As an output, the simulator provides the overall network resource (i.e., capacity) occupation and the blocking probability, allowing one to measure the efficiency of a cache deployment strategy. Results demonstrated that, given a budget in terms of storage capacity, the cache deployment that minimizes the overall network capacity occupation is not achieved by deploying all the available storage capacity in the nearest cache locations but by deploying part of the storage capacity in caches at higher network levels. As an extension, we analytically model the optimal cache deployment for a given network topology and a given distribution of popularity of a VoD-content catalog, and then derive a closed-form formula which serves as a tool to optimally distribute storage capacity among caches of the various levels of a hierarchical metro-area network. The analytical model takes as an input the number of caches deployed at each network level, the amount of storage capacity available, the number of VoD items in the content catalog and the average VoD content size, and provides as an output the number of items to be stored in caches of each hierarchical level; the overall amount of network resources occupied for VoD content request provisioning is minimized. We verify the correctness of the analytical model using the dynamic VoD provisioning simulator, and then, having validated the analytical model, we provide a framework to identify the most effective cache deployments along the various levels of the metro network by varying factors which are later proven decisive, such as the location of the metro cache, the popularity distribution and the available storage capacity.

Contributions and Organization

We summarize the contributions of this work as follows:
  • We propose an analytical model that, given the network topology, a budget in terms of storage capacity and characteristics of the video content catalog, identifies the optimal number of caches to deploy in the network and the optimal distribution of the storage capacity among caches at different network levels, with the aim of minimizing the overall amount of network resources (i.e., capacity) occupied due to VoD content request provisioning.
  • To verify the correctness of the analytical model, we perform extensive simulations using a discrete, event-based dynamic simulator for VoD-content caching and distribution (presented in our previous work [9]).
  • We perform a sensitivity analysis of the effects of the popularity distribution, the location of metro cache with respect to end-users and the total available storage capacity, on the optimal cache deployment strategy. We summarize the takeaways of the analysis and provide guidelines to identify the optimal cache deployment among the hierarchical levels of a metro network.
The rest of the paper is organized as follows. Section 2 discusses some relevant related works. Section 3 describes the network and VoD-content catalog models. Section 4 states the problem at hand and presents the analytical model proposed to solve it. In Section 5 we describe the event-based simulator developed to perform dynamic VoD-content caching and distribution. Section 6 reports analytical and simulation results. Section 7 concludes the paper.

2. Related Work

Several studies addressed the problem of cache deployment in telecommunication networks with the objective of maximizing the benefits of caching. For example, [10,11] address the problem focusing on offloading traffic to guarantee a more energy-efficient VoD-content distribution; and reference [12] presents an intelligent, content placement approach considering a trade-off between size of caches and network bandwidth. These works, however, consider static network scenarios. Moreover, they either assume the location or assume the dimensions of the cache are given and do not account for an investment budget to deploy caches. Other works, such as  [13,14], qualitatively evaluate the impact of content caching inside telecommunication networks in terms of cost and throughput improvement; however, no budget-constraint is considered in these studies. Recent works, such as  [15], investigated the content placement problem for resilience against link-cut attacks in a data center network.
Similarly to our work,  [16] solves the cache deployment optimization problem considering a trade-off between the cost of the cache deployment and that of bandwidth and energy resources in a static scenario while meeting end-user performance requirements. In our work, however, the problem is significantly different, as we aim to jointly find the locations and dimensions of the caches at the various hierarchical network levels that minimize the overall network resource consumption. Moreover, we consider a dynamic network scenario where both the number of VoD content requests (and the VoD content requested) are not known a priori. Furthermore, [17] presents an optimization model whose objective is to decide where to deploy caches, in order to minimize costs and maximize the bandwidth saved, but in a hierarchical tree network. In our work the problem is different, since we consider ring-based hierarchical metro networks.
Complementing our work, prior works have investigated real time operations of content-delivery networks via aspects such as load balancing [2]. While such works consider the cache deployment as a given, in our work we focus on the cache-deployment planning phase and then perform simulations under dynamic VoD traffic to capture network limitations, such as link bandwidth.

3. Network and VoD Content Modeling
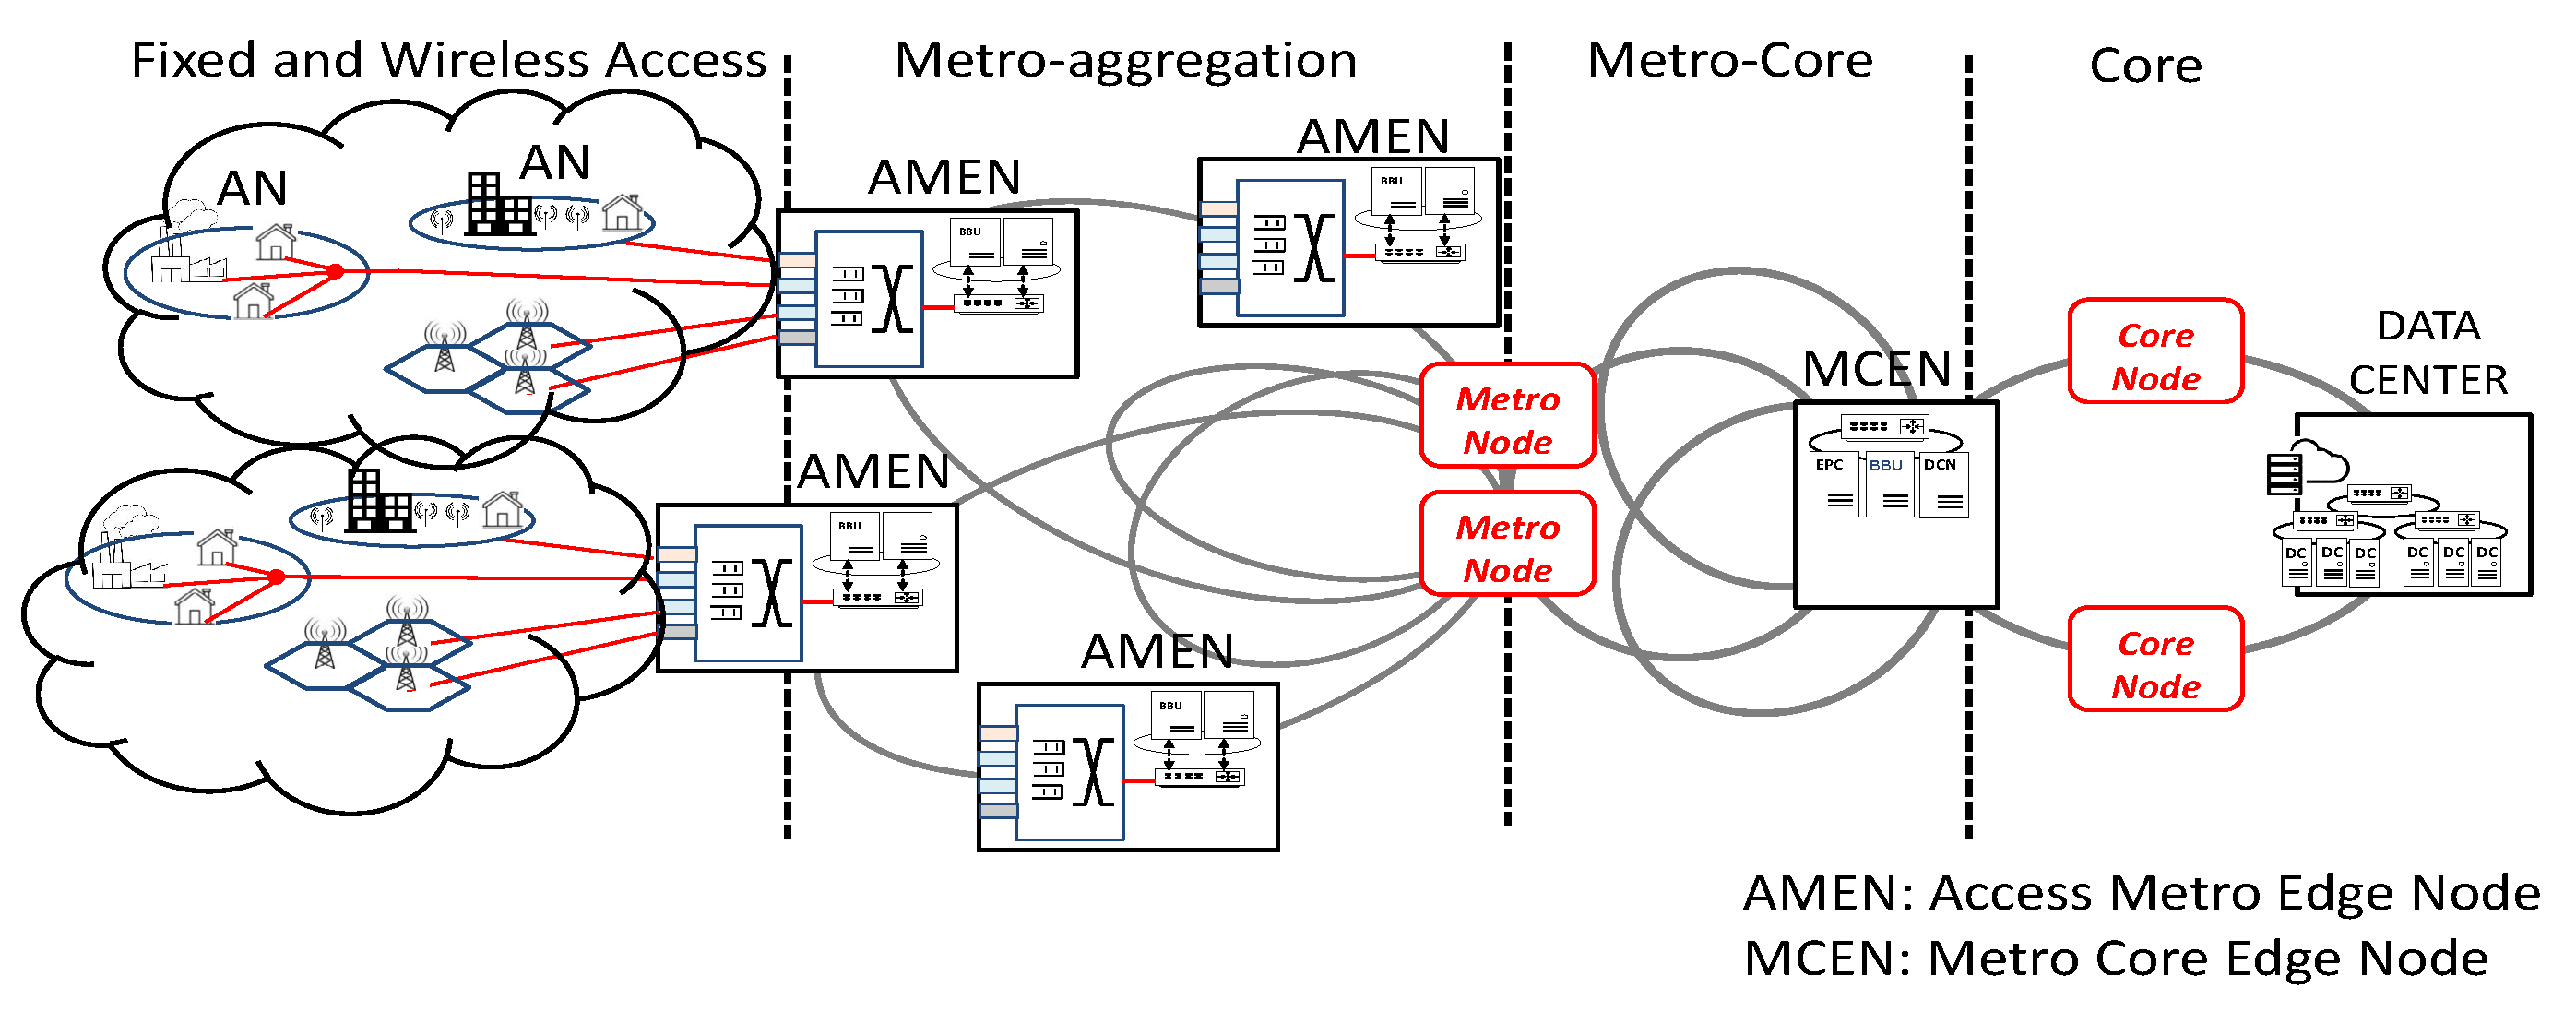
3.1. Network Model

We consider a hierarchical metro-area network spanning over four levels, the (i) core, (ii) metro-core, (iii) metro-access and (iv) access, as depicted in Figure 1, with three main categories of metro nodes: the access-metro edge nodes (AMENs), the metro-core edge nodes (MCENs) and the metro nodes (MNs). The AMENs and MCENs represent edge nodes equipped with storage and computing capabilities which are capable of storing and delivering VoD content. In between the mentioned nodes are the MNs that are nodes supporting pure metro transport (no cloud capabilities). Overall, the four hierarchical levels of the network are:

3.2. VoD Content Catalog Modeling

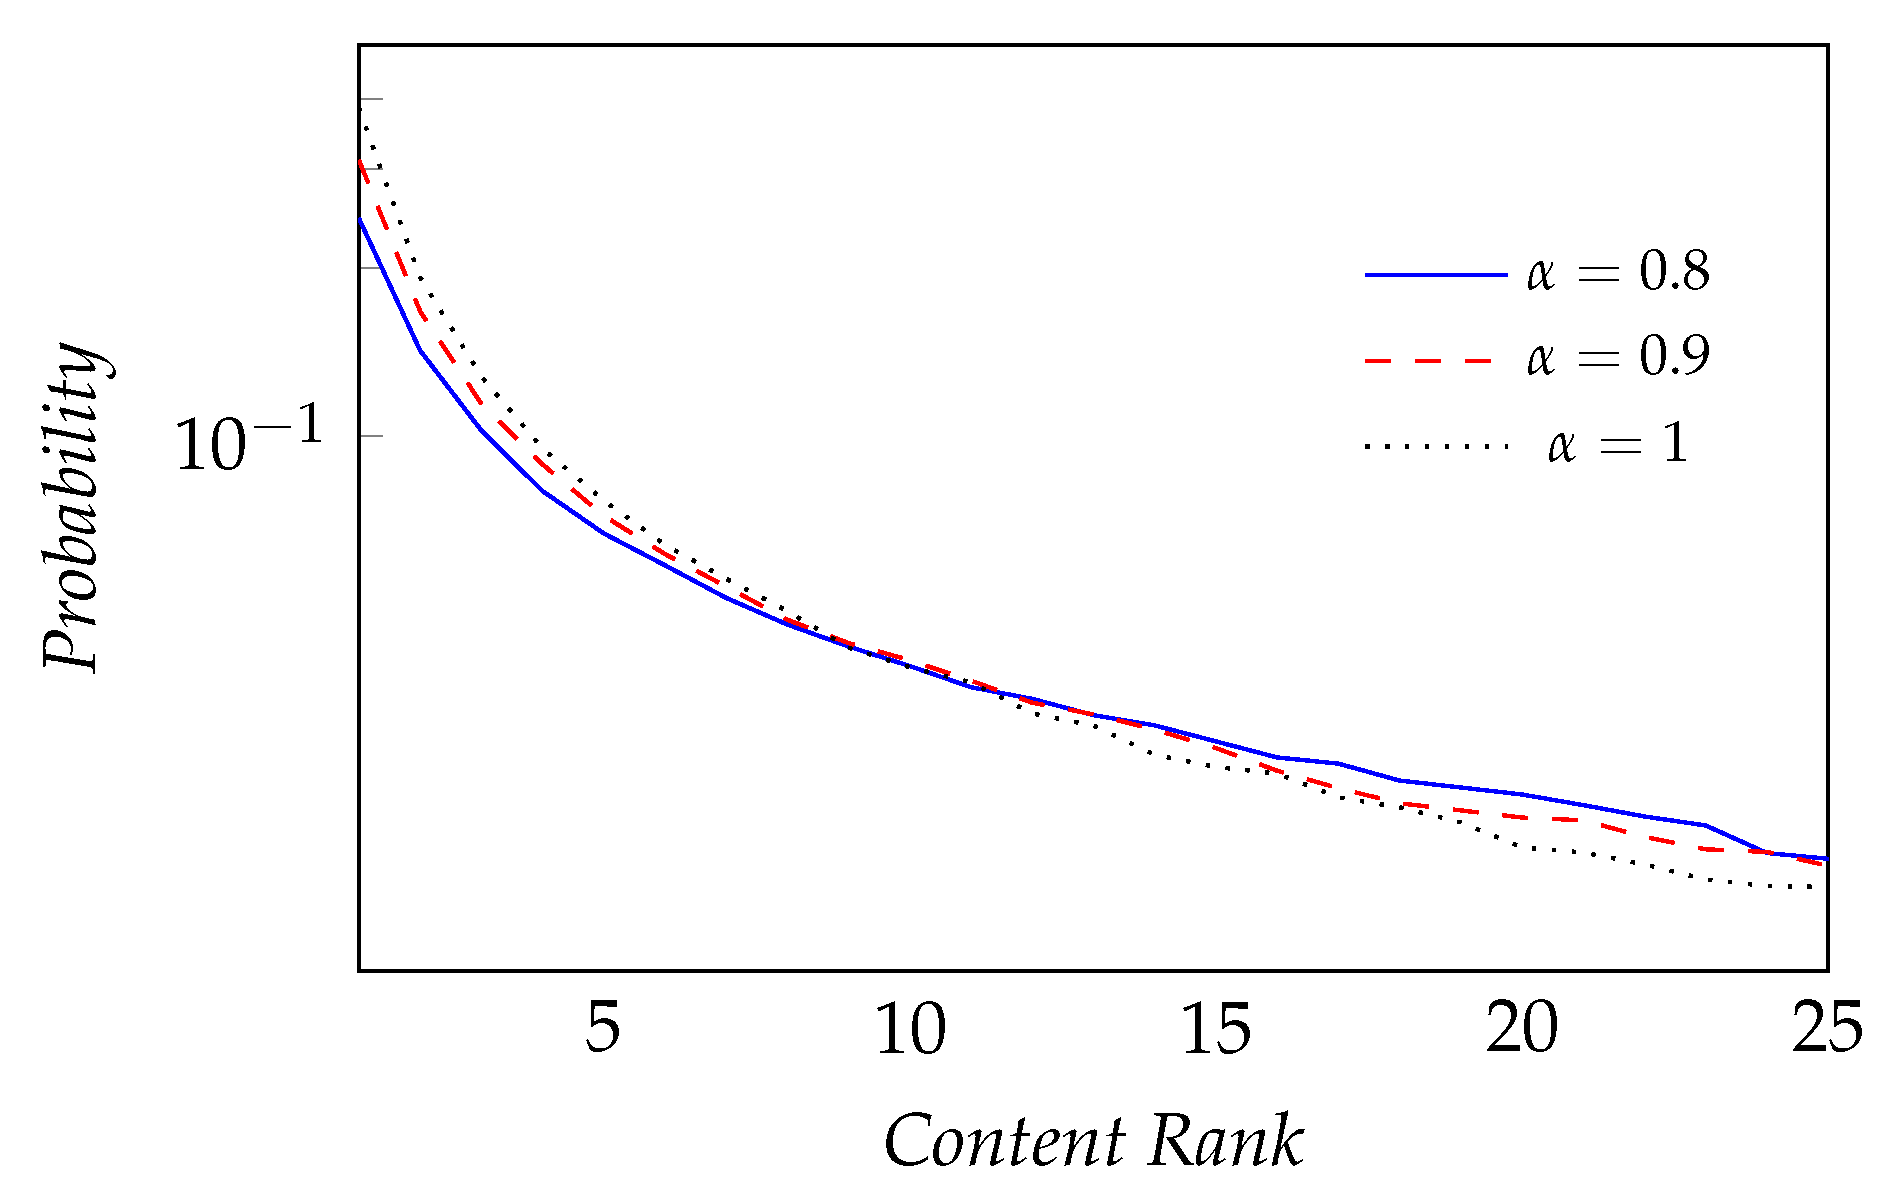
3.2.1. Catalog Size and Popularity

We consider a catalog size of 20.000 items assumed to follow a Zipf-like VoD-content popularity distribution, as in [16,18,19], meaning that a small percentage of the content accounts for a high portion of the total requests. The popularity of an item i is
P ( i ) = 1 i α j = 1 N 1 j α
and the cumulative probability of the most popular f items is
i = 1 f P ( i ) = i = 1 f 1 i α j = 1 N 1 j α
where N represents the total number of items and α is the popularity distribution skew parameter. Note that the quantity j = 1 N 1 j α represents the normalization constant of the Zipf distribution. As an example, we show a calculation of the cumulative probability utilizing Equation (2) with N = 20,000 and α = 0.8. For f = 2000 (the most popular 10% of the content catalog), Pr.(f = 2000) is 0.6, showing that most popular 10% of video content accounts for 60% of the requests, whereas the rest of the content (the remaining 90% of the content catalog) accounts for only 40% of the requests. In fact, the popularity distribution of VoD content is the main driving force behind caching popular content near end-users, as a small cache permits serving a significant number of the VoD-content requests. Note also that α defines the skewness of the curve, and thus the popularity distribution itself. As an example, Figure 2 plots the popularity distribution curves for a content catalog of 100 items for α = 0.8, 0.9 and 1, showing that for lower values of α , popular items become slightly less popular, whereas items belonging to the long tail have more popularity. It follows that α is a decisive parameter to be considered when finding the optimal storage-capacity distribution.

3.2.2. VoD Content Characteristics

A video item is described by (i) its popularity, (ii) its duration and (iii) its size. The popularity is defined as the rank of the video in the content catalog; i.e., item #1 is the most popular, while the last item, item #20000, is the least popular. The duration of VoD content follows a power-law distribution in which short videos are more common than large ones, and the duration ranges between 1200 and 8400 s. Moreover, we assume that each VoD item can be streamed at three different bit-rates, i.e., 3 Mbps, 6 Mbps and 12 Mbps, and that a VoD item is stored in its best format [20,21]. The size of a VoD content is simply the product of its duration and best bit-rate possible. In addition, we consider the chunk-nature of video content, where each item is made up of a number of small video-chunks [22]. Each chunk has a fixed duration of 1.5 s, and the number of video-chunks in a video item can be determined by dividing its duration by the chunk duration.

4. Analytical Model For Optimal Cache Deployment

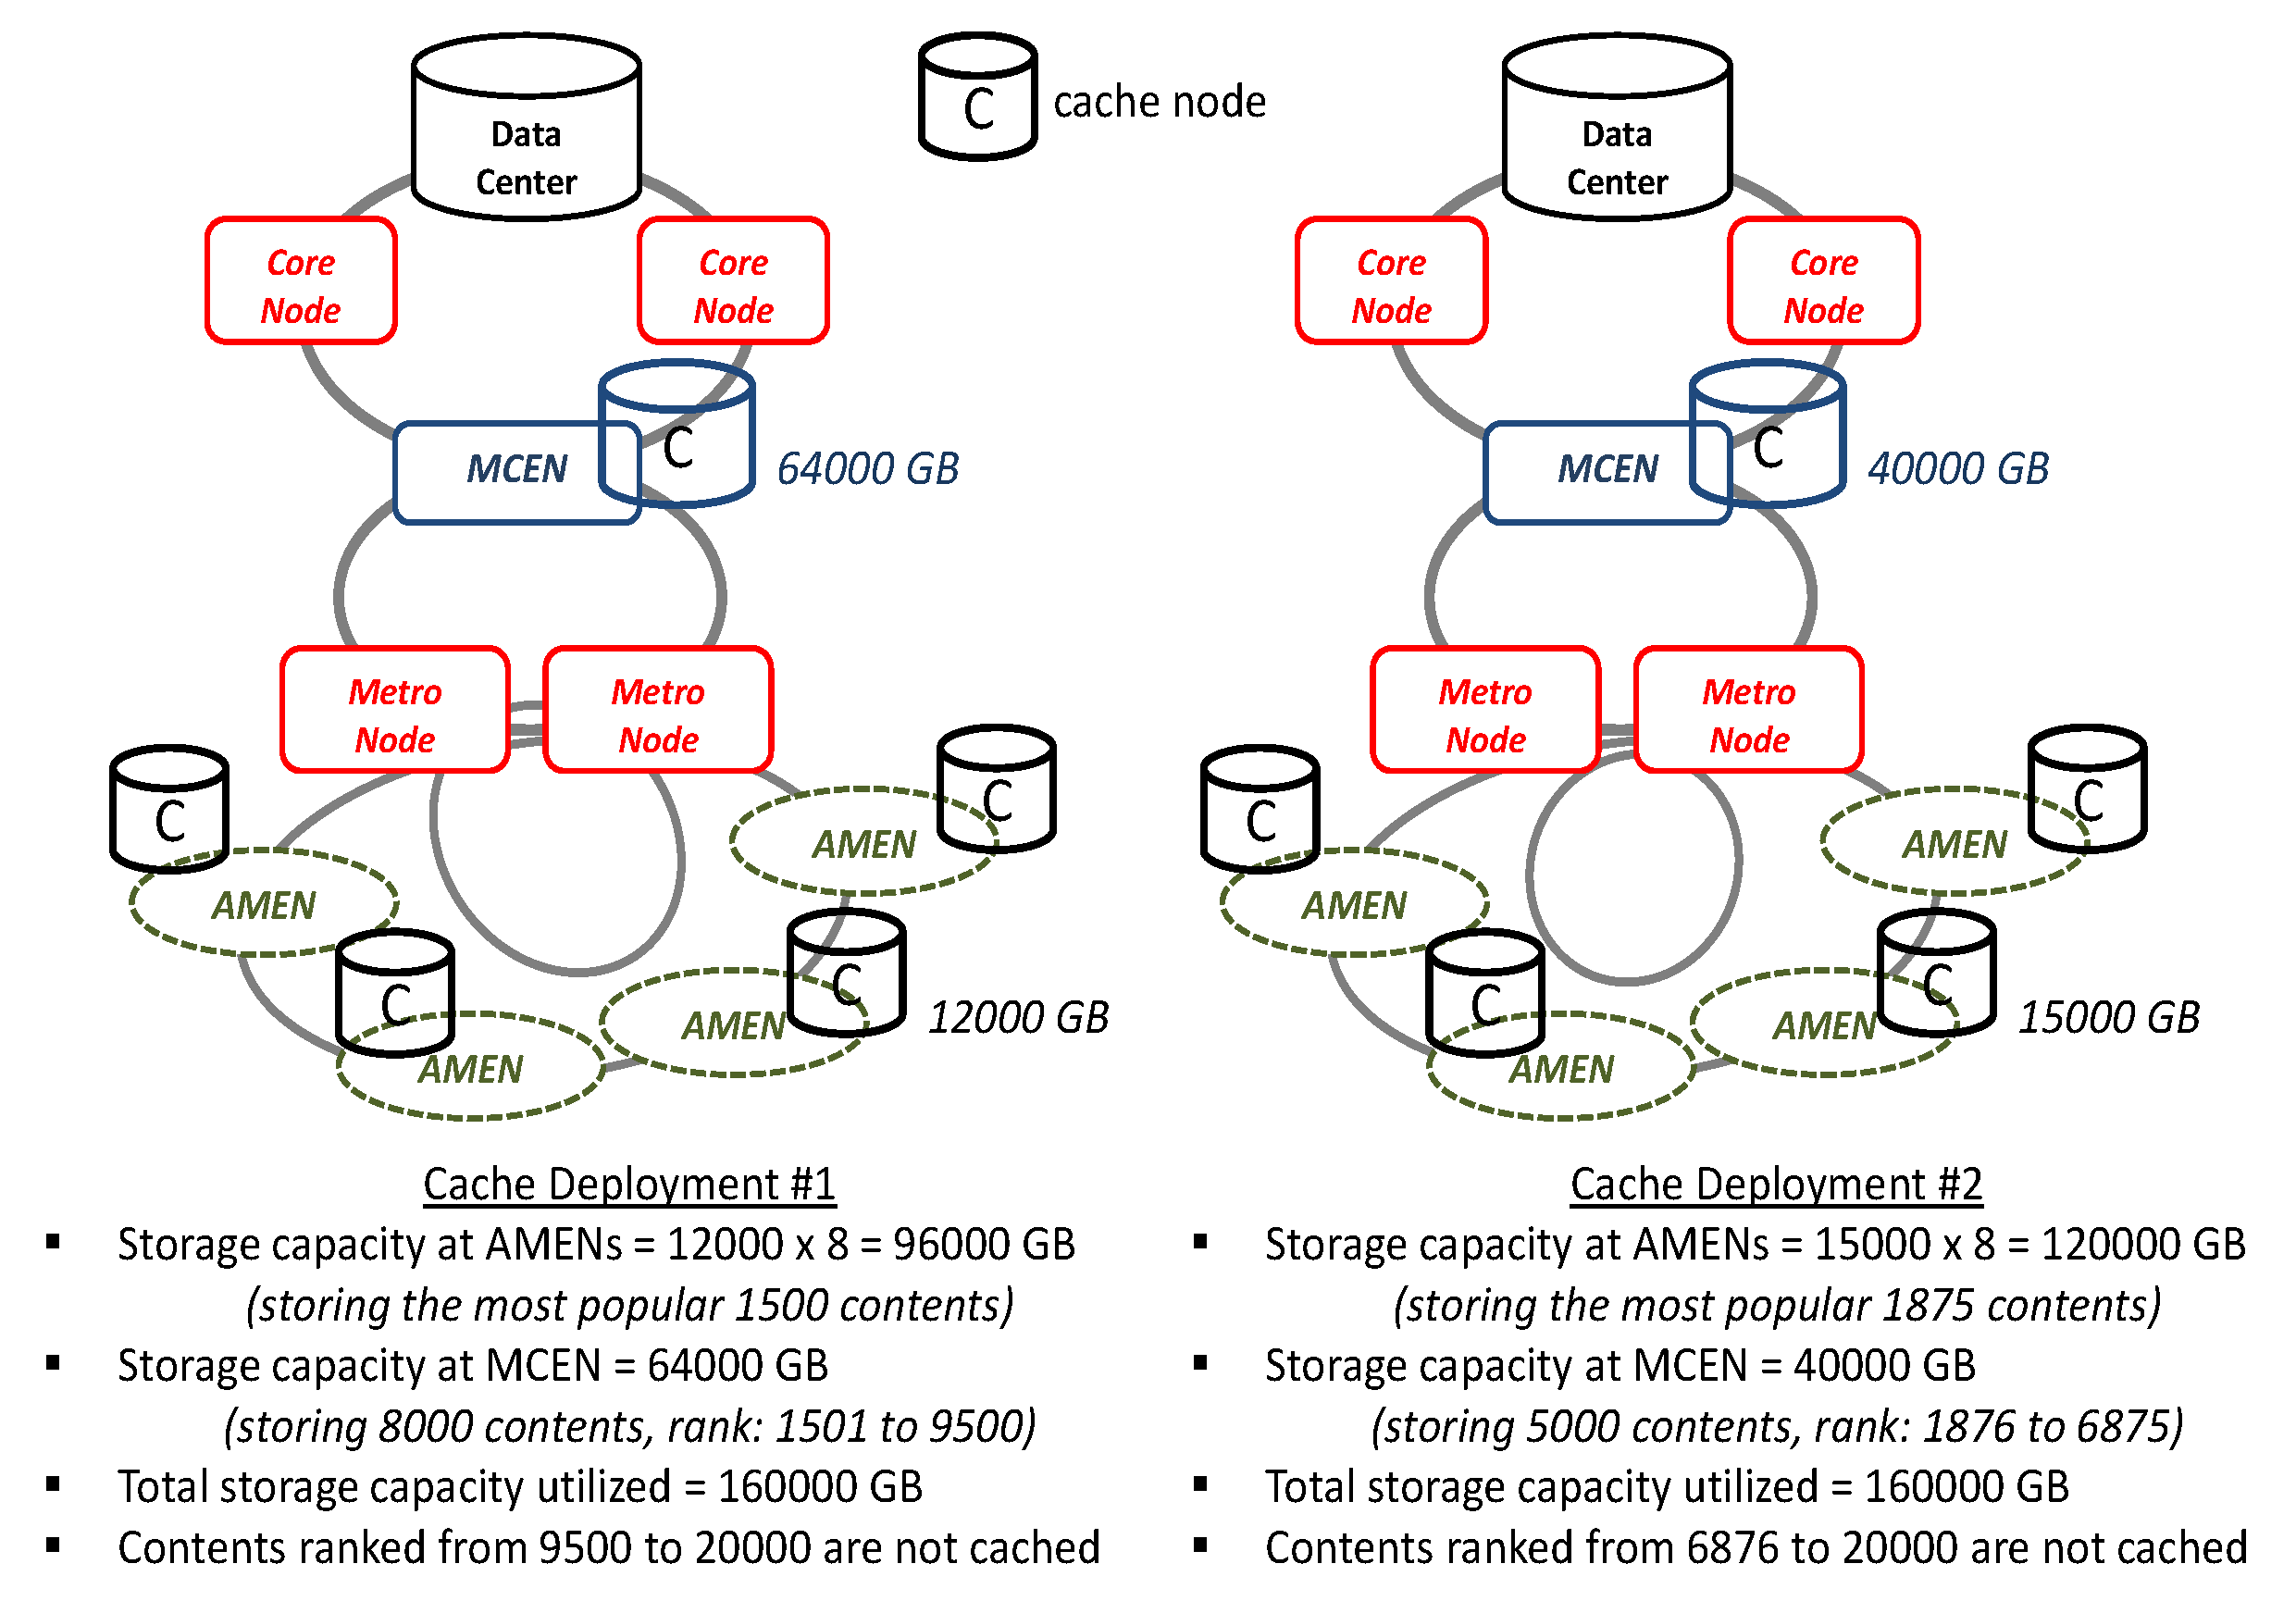
4.1. Problem Statement

The problem of optimal cache deployment in a hierarchical metro network can be stated as follows. Given a maximum overall amount of storage capacity, a certain metro network topology, the potential locations of caches and the characteristics of the content catalog (catalog size, popularity distribution), we must find the optimal storage capacity distribution such that the overall average resource occupation ( R O ) is minimized. To solve this problem, we derive an analytical model which returns the amount of storage to be utilized in the caches at various levels with the objective of minimizing the R O . Similar to previous works (e.g.,  [16]), we assume the average hop-count as a main metric to estimate the overall RO, where the RO is assumed to be the product of the average hop-count and the average bit-rate.
For sake of clarity, Figure 3 shows two possible cache deployments for a case in which 160,000 GB are available to be distributed among caches: deployed at AMENs, (i.e., at the access network level), and among the MCENs (i.e., at the metro network level). The example considers eight AMEN caches and one MCEN cache. The content catalog considered has 20,000 items. In the first example (cache deployment #1), AMEN caches are allocated 12,000 GB of storage capacity to store the most popular 1500 VoD items; meanwhile, the MCEN cache is allocated 64,000 GB of storage capacity to store the next most popular 8000 items. Consequently, items ranked from 9500 to 20,000 are not cached; i.e., they remain at the remote video server. In the second example (cache deployment #2), the AMEN caches are allocated more storage capacity than those in cache deployment #1: 15,000 GB to store the most popular 1875 items. Consequently, the MCEN cache is allocated 40,000 GB of storage capacity, less than the MCEN cache in cache deployment #1, and therefore, it stores fewer of items—only 5000. Each cache deployment results in different storing of items in caches at AMENs and at MCEN (or left at the distribution video server), and therefore, in a different network resource utilization; however, it is not obvious which cache deployment results in a lower network resource occupation. For a more detailed description of this example, we refer the reader to [9].

4.2. Analytical Model

4.2.1. Notation and an Example

We summarize the parameters and variables considered in our study in Table 1. N represents the total number of items in the catalog, whereas T is the total amount of storage capacity (GB) that can be deployed in caches at the various network levels. h a c c e s s , h m e t r o and h s e r v e r represent the average hop-distances from caches at AMENs, MCENs and the video server, respectively. Note that h m e t r o defines how distant the MCEN cache is from end-users, and thus it is a decisive when planning cache deployment. A low value of h m e t r o means the MCEN is close to the access edge nodes, whereas a high value signifies that a request needs to traverse the metro transport network to reach end-users. n a c c e s s represents the number of caches utilized at the metro-access level. Note that it is not necessary that all AMENs are equipped with storage capacities. For example, it is possible that 16 AMEN caches are utilized having n a c c e s s = 16 while the topology consists of 32 AMENs. In such a case, caches at AMENs are placed such that the maximum number of hops between an end-user and an AMEN cache is minimized. k is the index of the last item stored in the access caches. Equivalently, k also represents the number of items stored in the access caches, as the caching is popularity-based. Note that we assume the same item cannot be cached at caches of two network levels simultaneously while all caches of the same level are assumed to store the same items. For example, if the last item stored in the access caches has rank 100 (k = 100), it means that all items with rank less than 100 are stored in the access caches. Then, for a given value of k and according to the remaining storage capacity, the number of items to be stored in the cache located in metro level (i.e., at MCEN) is simply calculated given the average video size S a as follows:
T S a n a c c e s s · k
For example, given T = 160,000 GB and S a = 8, if k = 400 and n a c c e s s = 32 (400 items are stored in each of the 32 caches at AMENs), the number of items to be stored in the cache located at the MCEN is 7200 ( 160 , 000 8 32 · 400 ).

4.2.2. Formula Derivation

We denote by R O a v g / r e q the average resource occupation of a video request per second under a given storage capacity distribution. R O a v g / r e q is the product of the average number of hops and the average bit-rate of all video requests. Equation (4) represents R O a v g / r e q corresponding to storing k items in the AMEN caches, where the three terms represent the average RO to deliver the content stored at the AMEN caches, the MCEN cache and the data center, respectively. Note that the denominator of Equation (1) which represents the normalization factor of the Zipf distribution is omitted here, it being a constant value. Moreover, we note that the number of items which could be stored in the metro cache (given that k items are stored in n a c c e s s access caches) is T S a n a c c e s s · k , where T S a is the maximum number of items which could be stored and n a c c e s s · k is the total storage capacity (represented by number of items) in the n a c c e s s access caches. Therefore, the rank of the last item stored in the metro cache is k + T S a n a c c e s s k .
R O a v g / r e q ( k ) = h a c c e s s j = 1 k 1 j + h m e t r o j = k + 1 k + T S a ( n a c c e s s ) k 1 j + h s e r v e r j = T S a ( n a c c e s s 1 ) k + 1 N 1 j
We now focus on the objective of the analytical model, which is to find the value of k which minimizes the R O a v g / r e q of all VoD requests. As seen in our previous work through simulative results, the value of R O a v g / r e q initially decreases as k increases until a certain value of k, at which R O a v g / r e q increases again. Mathematically, the “optimal” k value (i.e., the value of k guaranteeing the optimal storage capacity utilization, and thus the minimal R O ) is the value of k that, if stored in the caches of the access segment, leads to R O a v g / r e q lower than that if k + 1 items are stored in the caches of the access segment. Hence, we represent the equation for R O a v g / r e q if k + 1 items are stored in the caches of the access segment in Equation (5). Note that by storing k + 1 items in the caches of the access segment instead of k items, the amount of storage remaining for the cache of the metro segment decreases by S a · n a c c e s s . For this reason, the indexes of the sum at the second and third terms change accordingly.
R O a v g / r e q ( k + 1 ) = h a c c e s s i = 1 k + 1 1 i + h m e t r o j = k + 2 k + 2 + T S a ( n a c c e s s ) ( k + 1 ) 1 j + h s e r v e r j = k + 2 + T S a ( n a c c e s s ) ( k + 1 ) + 1 N 1 j
Thus, we need to find the lowest value of k which satisfies the Equation (6).
R O a v g ( k ) < R O a v g ( k + 1 )
Solving for k, we obtain Equation (7) where p = T S a ( n a c c e s s 1 ) k ( n a c c e s s 2 ) . By approximating the value of the summation we get Equation (8).
( h m e t r o h a c c e s s ) 1 k + 1 ( h s e r v e r h m e t r o ) j = p p + ( n a c c e s s 2 ) 1 j 0
( h m e t r o h a c c e s s ) 1 k + 1 ( h s e r v e r h m e t r o ) ( n a c c e s s 1 ) 1 p 0
By substituting the value of p and solving for k, we obtain the Equation (9) where k * is the index of the last item to be stored in AMEN caches. Note that once the value of k * is obtained, we can simply find the amount of storage capacity to deploy in the AMEN caches and the MCEN cache such that the overall R O is minimized.
k * = ( h m e t r o h a c c e s s ) T S a ( h m e t r o h a c c e s s ) ( n a c c e s s 2 ) ( h s e r v e r h m e t r o ) ( n a c c e s s 1 ) ( n a c c e s s 1 ) ( h s e r v e r h a c c e s s )
As previously mentioned, this derivation to Equation (9) is performed for the specific case for α = 1. However, for values of α ≠ 1, further steps are required to obtain the desired value of k. For this aim, we first derive Equation 10, which is Equation (8) but for α ≠ 1, and then, in order to solve it, i.e., to find the value of k, we derive its first derivative, Equation (11). We further apply Newton’s iterative method through approximating the value of k n + 1 , the root of Equation (10), where k n + 1 = k n f ( k ) f ( k ) and k n is an initial first guess of the root of Equation (10). Note that for all the case studies tested, the process to approximate the root of Equation (10) always converged in two or three iterations.
f ( k ) = ( h m e t r o h a c c e s s ) ( k + 1 ) α ( h s e r v e r h m e t r o ) ( n a c c e s s 2 ) p α
f ( k ) = ( h m e t r o h a c c e s s ) α ( k + 1 ) α + 1 ( h s e r v e r h m e t r o ) ( n a c c e s s 2 ) ( n a c c e s s 1 ) ( T S a + ( n a c c e s s 1 ) k ( n a c c e s s 2 ) ) α + 1

4.2.3. Example of the Analytical Model

This section provides an example for calculating the value of k * using the closed-form formula for a case study with 16 AMEN caches ( n a c c e s s = 16) out of 32 AMEN nodes (meaning that h a c c e s s = 1.5), and a content catalog of N = 20,000 VoD items with an average VoD item size of S a = 6 Gb and a popularity-skew parameter α = 1. We consider the available amount of storage capacity to be T = 120,000 GB; h m e t r o , i.e., the average hop-distance from the MCEN cache, to be 4.5; and h s e r v e r , i.e., the average hop-distance from the remote server, to be 8. Substituting these values in Equation (9) we get a value of k * = 614, meaning that the most-popular 614 items will be stored in AMEN caches. This also means that the AMEN caches will be allocated a storage capacity = 3684 GB (614 items / t i m e s 6 Gb) and that the MCEN cache will be allocated a storage capacity = 61,056 GB. By repeating the calculation for T = 160,000 GB, we get a value of k * = 818, and therefore, the amounts of storage to be allocated for AMEN and MCEN caches are 4917 GB and 81,323 GB, respectively.

5. Discrete Event-Based Simulator for Dynamic VoD Content Distribution

The overall functionality of the simulator is as follows. Given as input, the network topology; the content catalog characteristics (number of VoD items, their sizes and the popularity distribution); and the locations and capacities of the caches (note that given the capacity of a cache also means the list of VoD items cached, as we consider a popularity-based caching strategy), the simulator provisions the dynamically-arriving VoD requests, based on current network status, and gives as an output the overall amount of network resources occupied to provision VoD content requests, requests served by each cache and blocking probability. We describe a VoD-content request by the tuple r = ( t s , D r , m, b r , d r ), where t s is its arriving time, D r defines the user requesting the content, m is the content requested with bit-rate b r and a chunk duration d r . Moreover, as each item consists of a number of chunks and the chunks are provisioned one by one, the simulator allows one to deliver different chunks of the same VoD request from different caches. In addition, adopting the chunk-nature of the VoD request also allows one to degrade or upgrade, depending on the status of the network—the bit-rate assigned to a VoD request.
The provisioning and deprovisioning process of a VoD chunk is described in Algorithm 1. First, when a request is generated for an item m from a user D r , a list of all the caches storing item m (including the video server) is identified. We assume that access nodes (ANs) act as HTTP proxies for users so that a TCP connection request is originated from them towards the caches every time a VoD content chunk is download through, e.g., an HTTP stream. The nearest cache storing item m, assuming a path with available bandwidth at least equal to the b r , is identified, and it delivers the content to user D r , allocating a bandwidth equal to b r along the shortest path from the cache to the access node A N aggregating user D r . Note that in a realistic network scenario, the choice of path is not necessary based on the shortest path, as a network operator/content provider may optimize content delivery based on other metrics; e.g., congestion avoidance, network/cache load balancing or desired user quality. If no path with bandwidth greater than or equal to b r can be found, the provisioning process degrades the quality of the video delivery, i.e., setting the value of b r to that corresponding to a lower video definition (described in Section 3.2.2), and then tries to provision the request. If no path can be found in this case, the VoD request is blocked. If a path is found, request r is provisioned for the duration of the chunk of content, and then it is deprovisioned at time t s + d r , deallocating the assigned bandwidth from the utilized path. Simultaneously, a request for the successive chunk of the content request is initiated. Note that since the provisioning/deprovisioning process is performed for every chunk of a VoD request, different chunks can be delivered at different provisioning bit-rates, thereby imitating the functionality of the adaptive bit-rate streaming technique. For example, if a chunk is delivered with a bit-rate lower than b r , due to unavailable network resources, the successive chunk shall be allocated bit-rate b r if network resources become available. Note that the in-network bit-rate adaptation approximates a realistic scenario in which the low-quality adaptation is performed at the user-side. The computational time of the algorithm considering the system used is around 10 ms per VoD chunk request.
Algorithm 1 Video-on-demand (VoD)-chunk provisioning
   Input: Network status: cache locations, stored content per cache and available bandwidth on links; VoD content request r( t s , D r ,m, b r , d r ): arriving time t s , user D r , requested content m, requested bit-rate b r , chunk duration d r .
   Output: VoD provisioning (per chunk)
                                    
   path = f a l s e ;
   bandwidth = 0;
   Allocate list of caches C storing content m;
   path = shortest path between D r and nearest cache with available bandwidth ≥ b r ;
   If path = t r u e then
       bw = b r ;
   else
       path = shortest path between D r and nearest cache with available bandwidth ≥ m i n . b a n d w i d t h ;
       if path = t r u e then
     bw = m i n . b a n d w i d t h ;
      end if
   end if
   if ( p a t h = t r u e ) then
       provisionn r over p a t h with bandwidth bw;
       schedule next video-chunk event at t s + d r ;
       schedule deprovisioning event at time t s + d r ;
   else
       Block r;
   end if
   End;

6. Numerical Results

In this section, we first verify the analytical model by comparing it with simulated results. Then, utilizing both the analytical model and the dynamic simulator, we analyze the impacts of different network and content catalog characteristics on the optimal storage distribution among caches of different network levels.

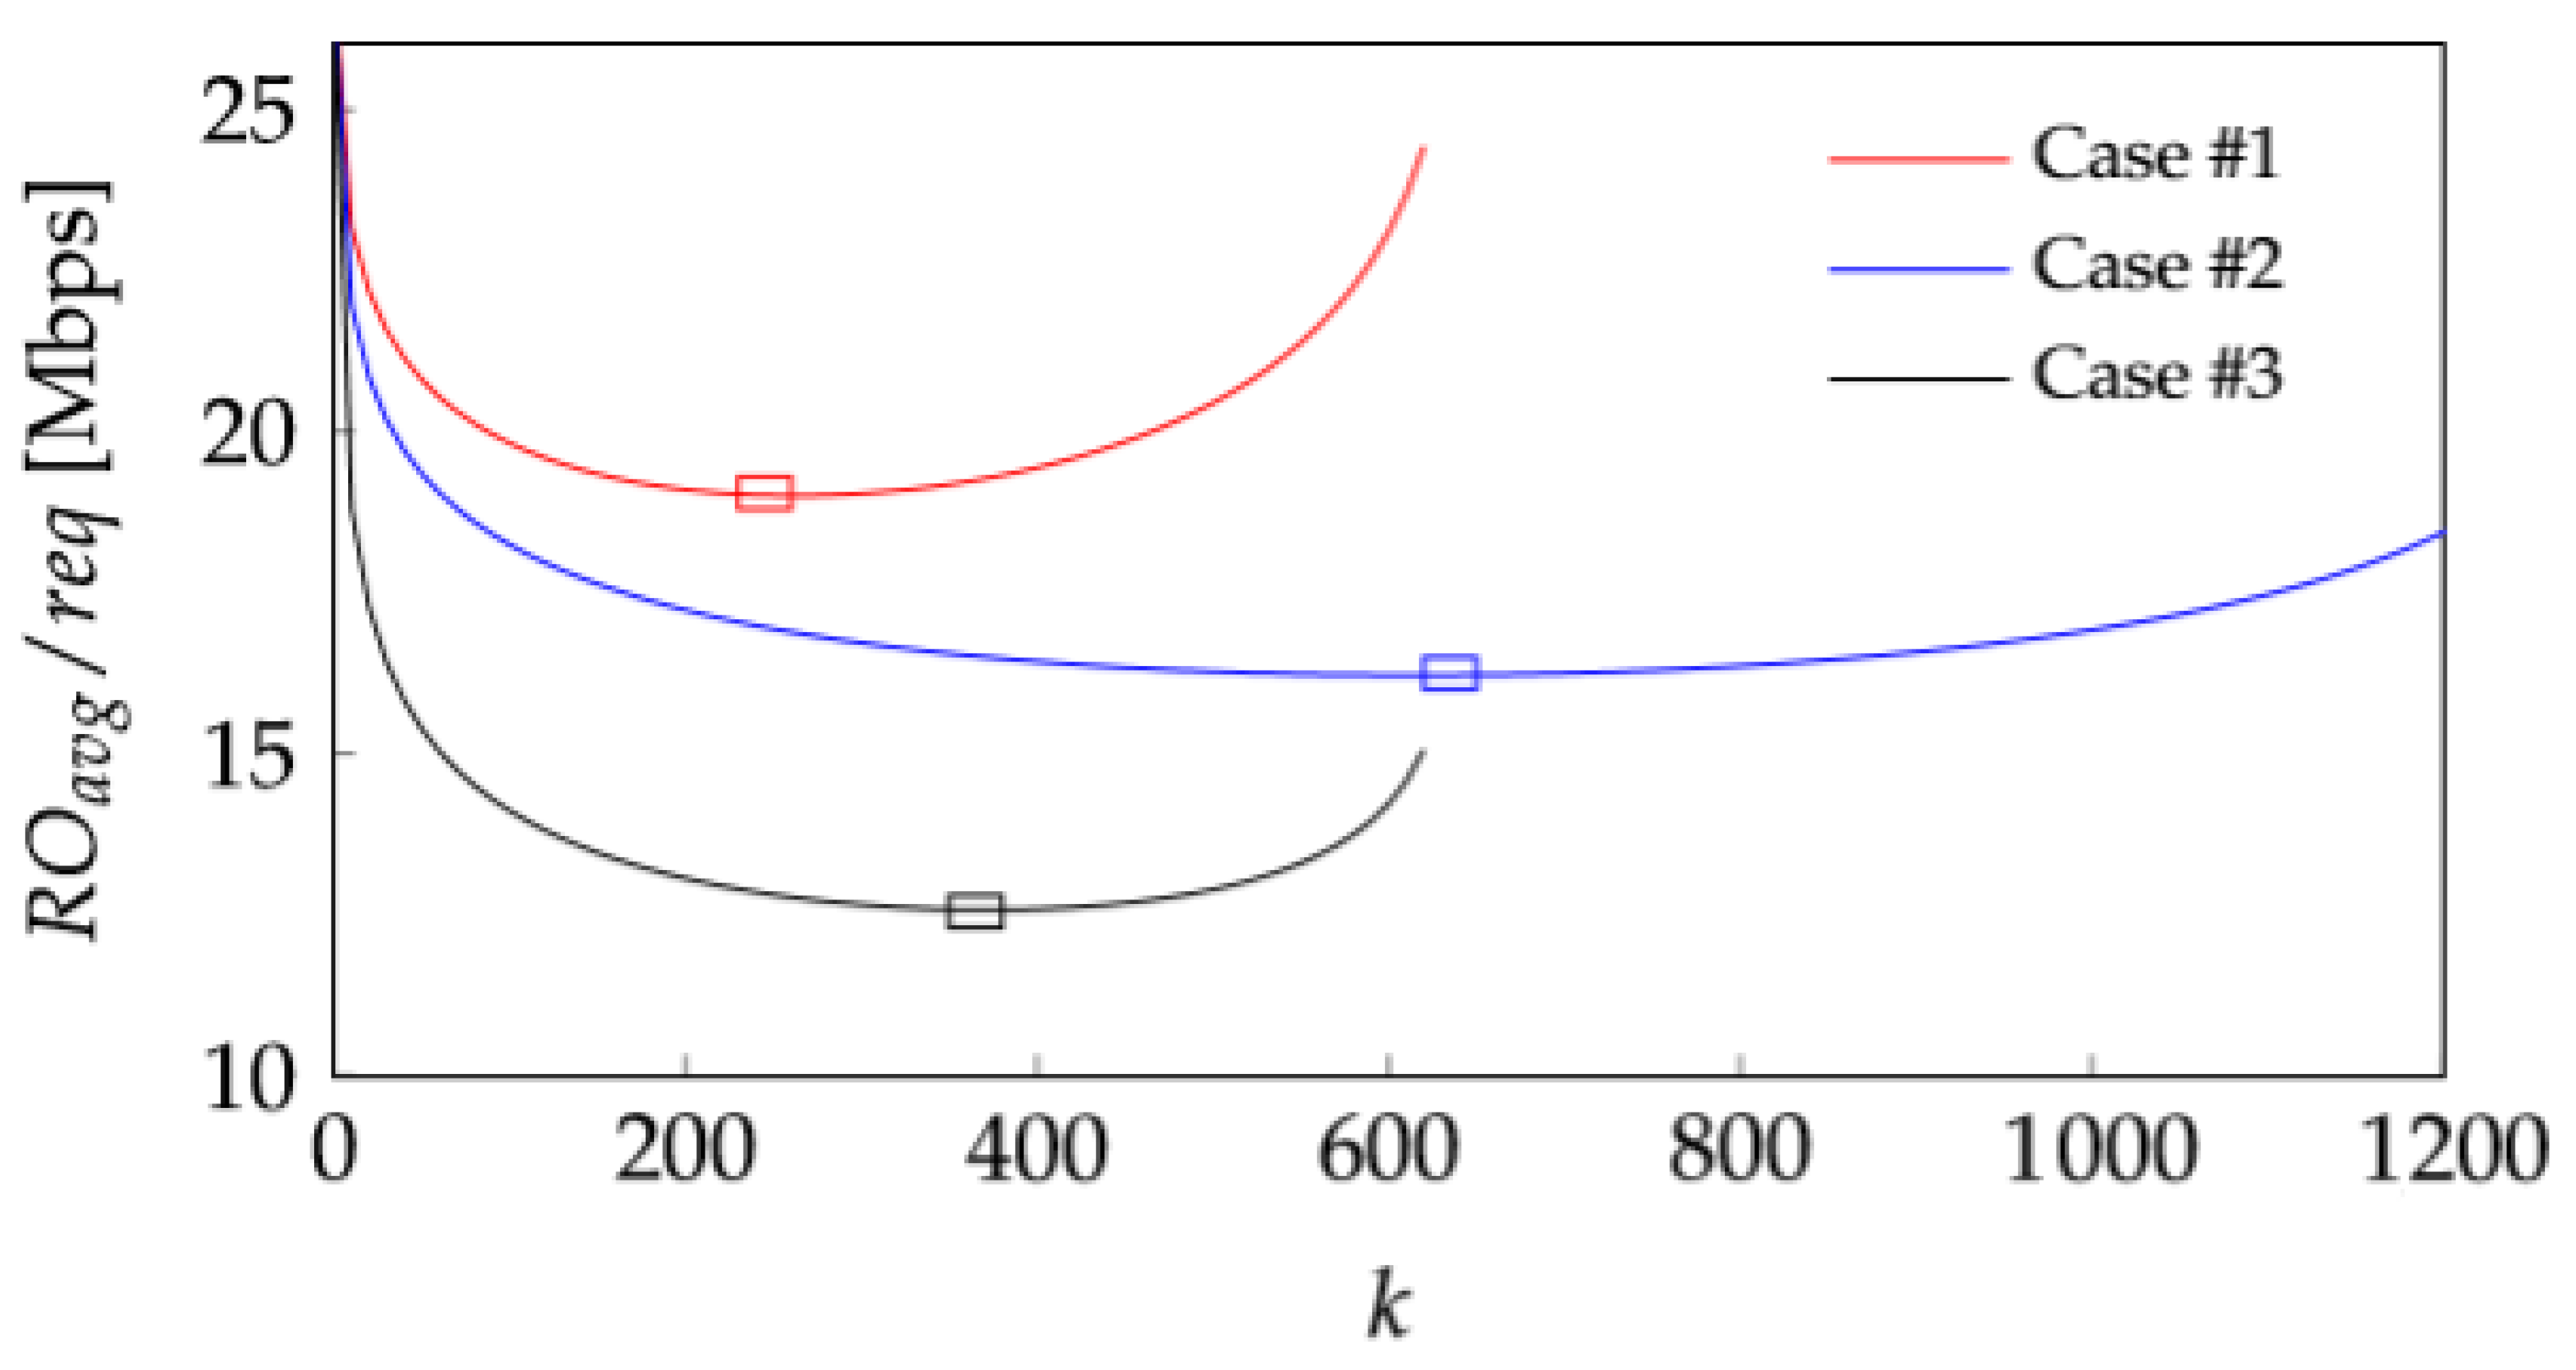
6.1. Verification of the Analytical Model

We verify the analytical model by comparing it with simulation results over the case studies whose parameters are reported in Table 2. We consider a network topology (similar to the one depicted in Figure 1) consisting of one MCEN, four metro nodes, 32 AMENs and 96 ANs distributed over four different access rings. VoD content requests originate uniformly from all 96 ANs with probabilities 0.5, 0.25 and 0.25 of choosing bit-rates of 3 Mbps, 6 Mbps or 12 Mbps, respectively. Consequently, the average bit-rate of all requests is 6 Mbps. We consider that all 32 AMENs, 16 AMENs or 8 AMENs host caches. Note that the number of AMENs which host caches differs from one case study to another. Moreover, note that if all AMENs are equipped with caches ( n a c c e s s = 32), the average hop-distance from the AMEN caches h a c c e s s is equal to 1, whereas if half of the AMENs are equipped with caches, ( n a c c e s s = 16), meaning that not all ANs are directly connected to an AMEN which hosts a cache, the average hop-distance h a c c e s s becomes equal to 1.5. Moreover, the average hop-distance from users to the MCEN, h m e t r o , in this case is 4.5, whereas h s e r v e r , the average hop-distance from users to the remote data center, is 8.
To find the optimal storage distribution for each case study, we perform an extensive set of simulations considering all possible storage distributions for a given cache deployment. Specifically, in each simulation, we vary the number of items stored in caches deployed at AMENs, k. k ranges from 0 (the case where all the storage capacity is utilized in the cache located at the MCEN), to the maximum possible number of items to be stored in each of the AMEN caches T n a c c e s s · S a . We refer to these cache deployments as Only MCEN and Only AMENs, respectively. Note that when a certain amount of storage capacity is deployed in caches of AMENs, only the remaining amount of the available storage capacity can be deployed in the cache located at the MCEN. We simulate the arrival of 500,000 VoD requests for each case; i.e., for each value of k considered. The VoD requests are Poisson-distributed. Specifically, we set an arrival rate guaranteeing negligible blocking probability to provide a fair comparative analysis between the different cache deployment strategies.
Figure 4 shows R O a v g / r e q (i.e., the average resource occupation per VoD request) as a function of k, for all the three case studies considered. Results show that R O a v g / r e q initially decreases as k increases (as more items being stored in the caches located at AMENs enables serving more requests from locations near end-users) until a certain value of k, at which R O increases again (as it becomes less-advantageous to deploy more storage capacity in the caches of the AMENs and more-advantageous to deploy the storage capacity in the MCEN cache). One might argue: why is the optimal solution not deploying all available storage capacity at AMENs? This is due to the fact that, when the storage capacity is limited, it becomes more-advantageous not to store duplicates of a number of popular items at AMENs, but rather store one copy of a larger set of items, thereby pulling more items from the origin server into the network. Certainly, in a scenario when the storage capacity is not limited, deploying more caches in proximity to end users and/or increasing their capacity allows one to significantly decrease the amount of network resources occupied to perform VoD content caching. However, in the scenario under consideration, the case is different, as storing (and duplicating) one additional item in the n a c c e s s AMEN caches means removing n a c c e s s VoD items from the MCEN cache and having them consequently delivered, when requested, from the origin server. Moreover, we highlight that the value of k, i.e., the number of items stored in AMEN caches, which guarantees the minimum amount of network resource occupation, significantly differs from one case to another. This is to be expected, as it strictly depends on the available amount of storage capacity, the number of caches deployed, the content catalog size and the popularity distribution. In particular, we focus our comparison on cases 1 and 3 that only differ in the skew parameter of the popularity distribution (for Case #1, α = 0.9, while for Case #3 α = 1.1). The value of k which guarantees minimum resource occupation is 267 for Case #1, whereas it is 377 for Case #3. This shows the significant impact the popularity distribution has on the optimal cache deployment. We further investigate the impact of α on the optimal cache deployment in Section 6.3. In Table 3 we compare the simulative and analytical results with those of the analytical model. We denote by k s i m the value of k that guarantees the optimal storage distribution found through simulations, and by k m o d e l the value calculated utilizing the closed-form formula. With a negligible percentage error, the results prove the correctness of the closed-form formula.

6.2. Optimized Cache Deployment vs. Baseline Strategies

After having cross-validated our analytical and simulative approaches, we evaluate the advantage of having an optimized cache deployment, referred to as k-optimized, through comparing it to two baseline strategies (Only MCEN and Only AMENs) in terms of percentage of requests served from each network level and overall RO.
Table 4 shows the percentage of requests served from the AMEN caches, the MCEN cache and the data center (DC) for the three cases in Table 2 under the three cache deployments; namely, the Only MCEN, Only AMENs and k-optimized. In all cases, for Only MCEN cache deployment, all the content is pulled from the DC and stored in the MCEN, as the available storage capacity enables storing and serving all of the content from the MCEN cache. This cache deployment, however, results in the highest overall network R O . This shows that not utilizing the AMEN caches has a drastic effect on the overall network R O . For the Only AMENs, all the storage capacity is distributed uniformly among the AMEN caches, storing the most popular items. This cache deployment enables serving a high percentage of the requests (ranging between 58% and 78%) from locations in proximity to end-users; however, it does not utilize the MCEN cache, leaving a significant percentage of VoD content, and therefore, a significant percentage of requests (ranging between 22% and 42%), to be served from the DC, consequently increasing the overall network R O . This confirms that deploying all storage capacity in cache locations near end-users is not an optimal way to perform VoD content caching, especially when the amount of storage capacity is limited. Conversely, for the k-optimized cache deployment, we see that it reveals a lower percentage of requests served from the AMEN caches with respect to that of the Only AMENs cache deployment, but a much higher percentage of requests served from the MCEN cache than for Case #1. Consequently, only a low percentage of requests are served from the DC, resulting in the minimal overall network R O .

6.3. Analysis of Optimal Cache Deployments

Utilizing the analytical model, in this section we investigate how the optimal distribution of the available storage capacity changes while varying:
  • The location of the MCEN cache, i.e., hop-distance of users from MCEN, h m e t r o ;
  • The content catalog popularity skew parameter α ;
  • The total allowed storage capacity T.

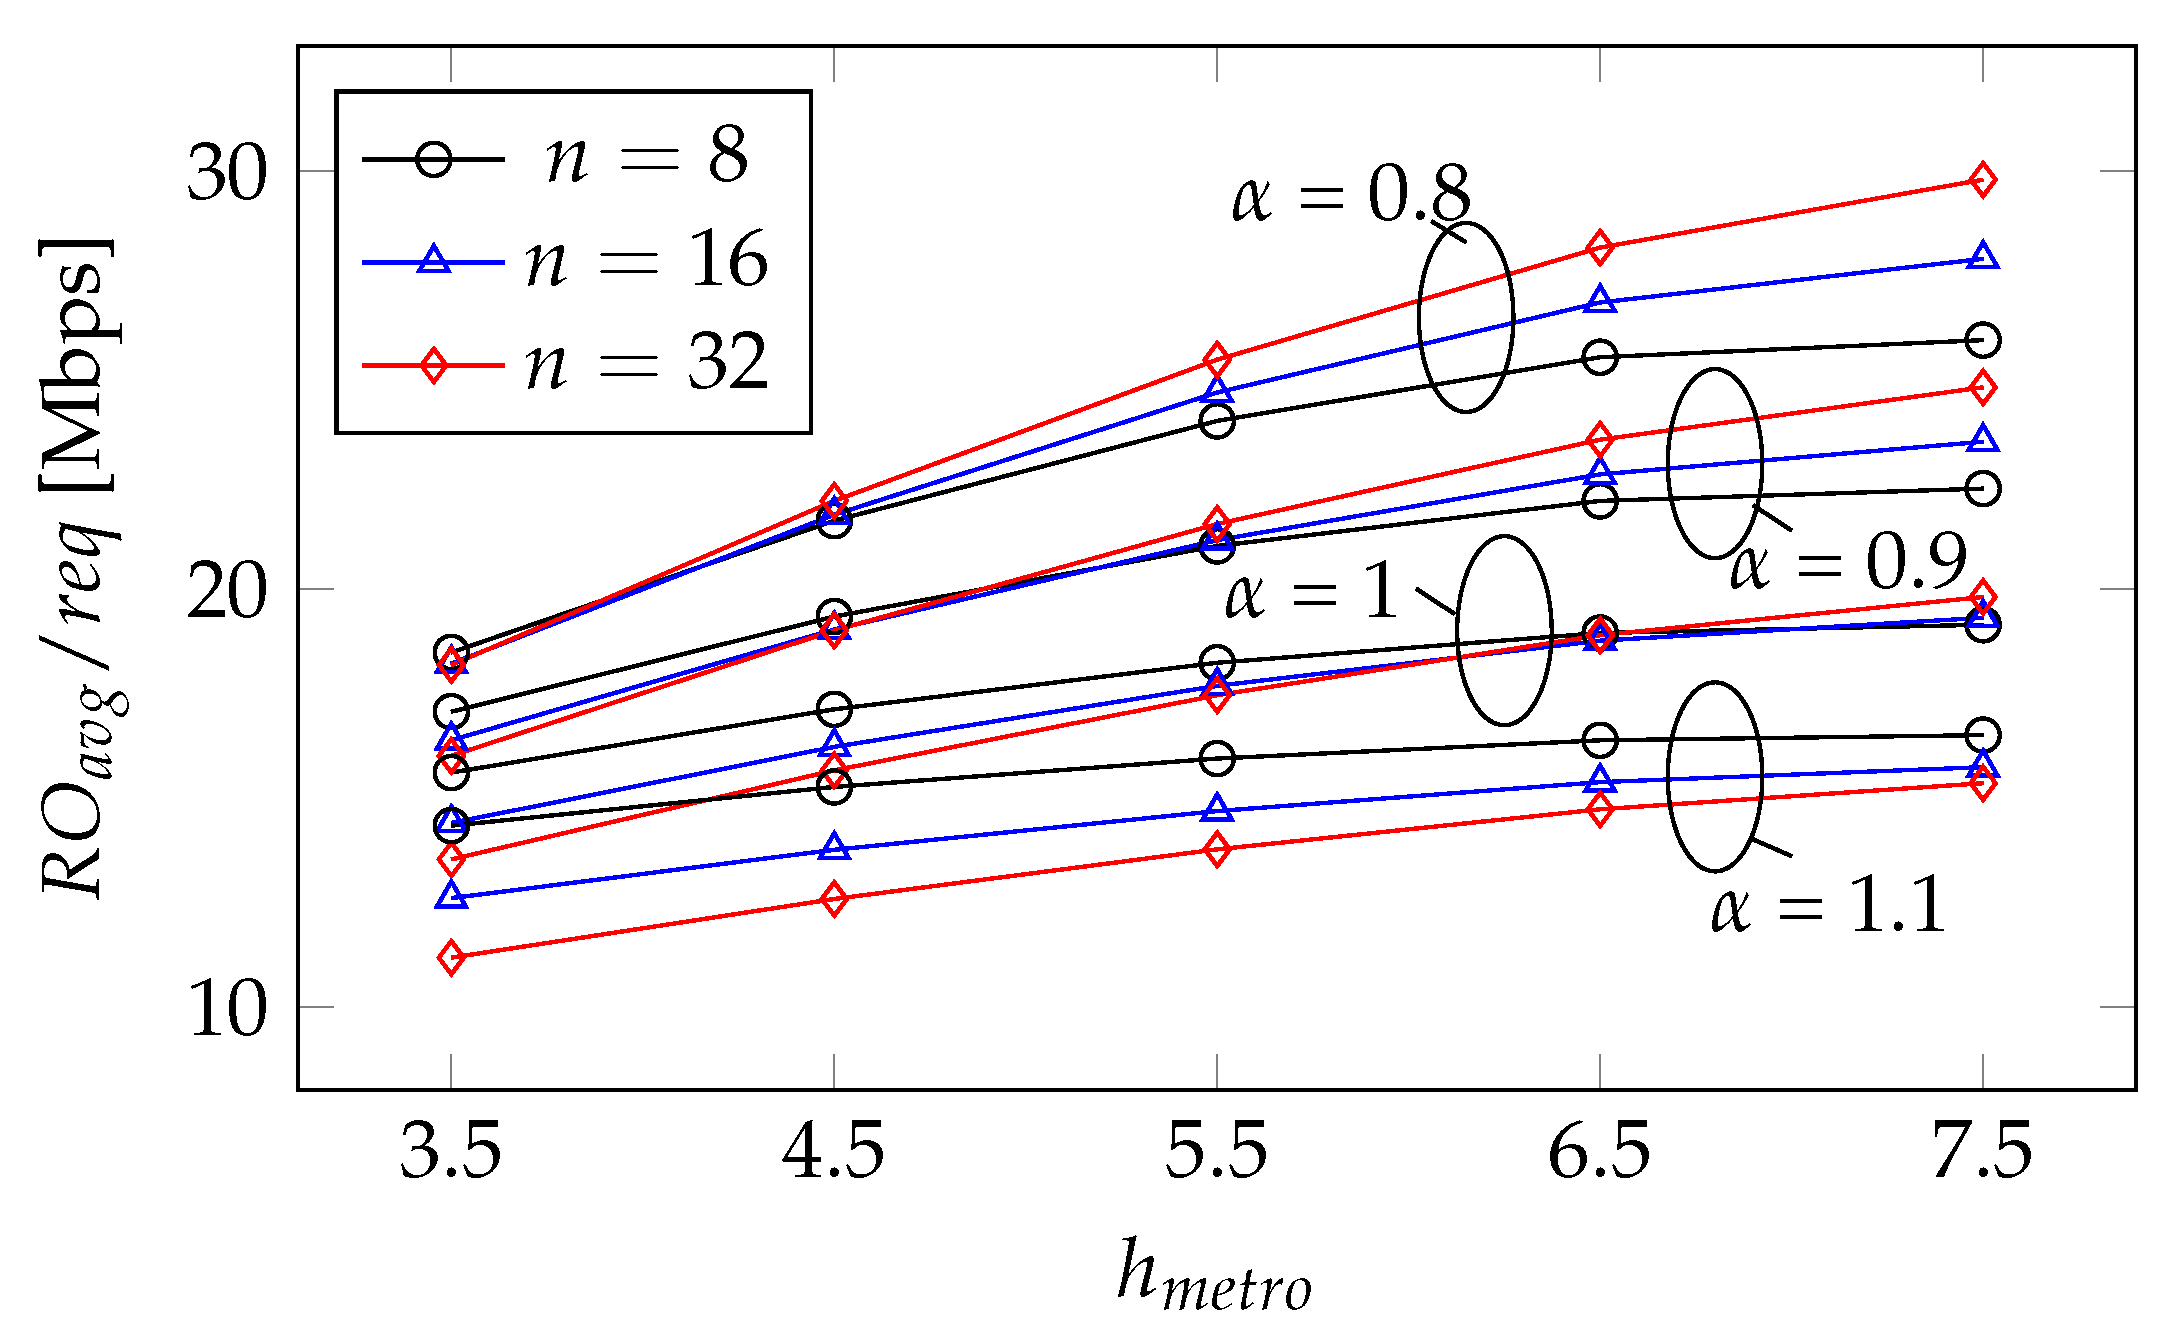
6.3.1. The Effects of the Location of Metro Edge Cache ( h m e t r o ) and the Popularity Skew Parameter ( α )

We now focus on the impact of the location of the MCEN, represented by h m e t r o and the skew parameter α . In Figure 5 we show the R O a v g / r e q utilized with n a c c e s s = 8, 16 or 32, while changing hop-distance of the MCEN cache h m e t r o in the topology and using four different values of α . In this evaluation we fix T at 160,000 GB. First, we notice that, for all values of α (except for α = 1.1), when the MCEN cache is near to end-users ( h m e t r o ≤ 4.5), the minimum R O a v g / r e q is achieved when all the 32 AMEN caches are utilized. However, when the MCEN cache is relatively farther ( h m e t r o ≥ 5.5), the cache deployment which yields the minimum R O a v g / r e q is when only eight AMEN caches are utilized. This demonstrates that utilizing all caches locations in access is not always the optimal cache deployment. For the case where α = 1.1, the minimal R O a v g / r e q is achieved when utilizing 32 AMEN caches. This is because for such a value of α , a very small number of items become extremely popular while moderately-popular items lose their popularity, making it more useful to store the popular items in nearest cache locations and to avoid storing less popular content. On the contrary, for lower values of α , the curve representing the popularity distribution is more skewed (see Figure 2), meaning that a significant number of VoD items have similar popularity, and therefore, it becomes more advantageous to pull more of these VoD items from the server into the MCEN cache.
We now focus on the size of AMEN caches obtained for the optimal cache deployment for different values of h m e t r o and α . Figure 6 shows the storage capacity in each AMEN cache returned by our formula for n a c c e s s = 8, 16 and 32, and for h m e t r o = 3.5, 5.5 and 7.5. When a high number of AMEN caches is utilized ( n a c c e s s = 32), the optimal solution consists of deploying relatively small capacity caches, while when a low number of caches is utilized ( n a c c e s s = 8), larger caches are preferred. Furthermore, we see that for the case where h m e t r o ≤ 4.5, the cache deployment that yields the minimum R O a v g / r e q is the one with higher n a c c e s s (i.e., 32) and relatively small caches (between 1000 and 5000 GB), whereas when h m e t r o is distant from end-users, the preferred cache deployment is the one with eight caches of relatively high storage capacity (ranging between 3500 and 20,000 GB). This is due to the fact that, when the location of the MCEN cache is near to end-users, it becomes more advantageous to deploy more storage capacity at the MCEN cache, thereby pulling many items from the DC, whereas when the MCEN location is farther, it is preferable to deploy the storage capacity at AMEN caches while utilizing a low number of caches ( n a c c e s s = 8), thereby pulling a high number of items from the DC into the AMEN caches. In conclusion, the dimensions of the metro network impact the optimal cache deployment strategy.
Furthermore, we notice that for a given value of h m e t r o , the cache deployment for lower values of α reveals AMEN caches of smaller size with respect to when the value of α is higher. For example, for h m e t r o = 3.5, the sizes of the AMEN caches in the case when 8 and 32 AMEN caches are utilized for α = 0.8 are 3000 GB and 900 GB, respectively. For α = 1, the caches are of greater size—7000 GB and 2000 GB, respectively. This is because for higher values of α , the popularity distribution is characterized by a shorter head (as shown in Figure 2), meaning that popular items are more popular with respect to the case where the value of α is lower, and thus it becomes more significant to deploy larger caches close to end-users so as to deliver the most popular items from a close location. This shows that the optimal cache deployment (number of caches and their storage capacity) which guarantees the minimal utilization of the network resource occupation hugely depends on the existence and the location of a centralized cache in the metro segment of the network, and on the content catalog characteristics (size and popularity distribution) of the content provider. In Table 5 we summarize the important takeaways on the deployment of caches in different network levels.

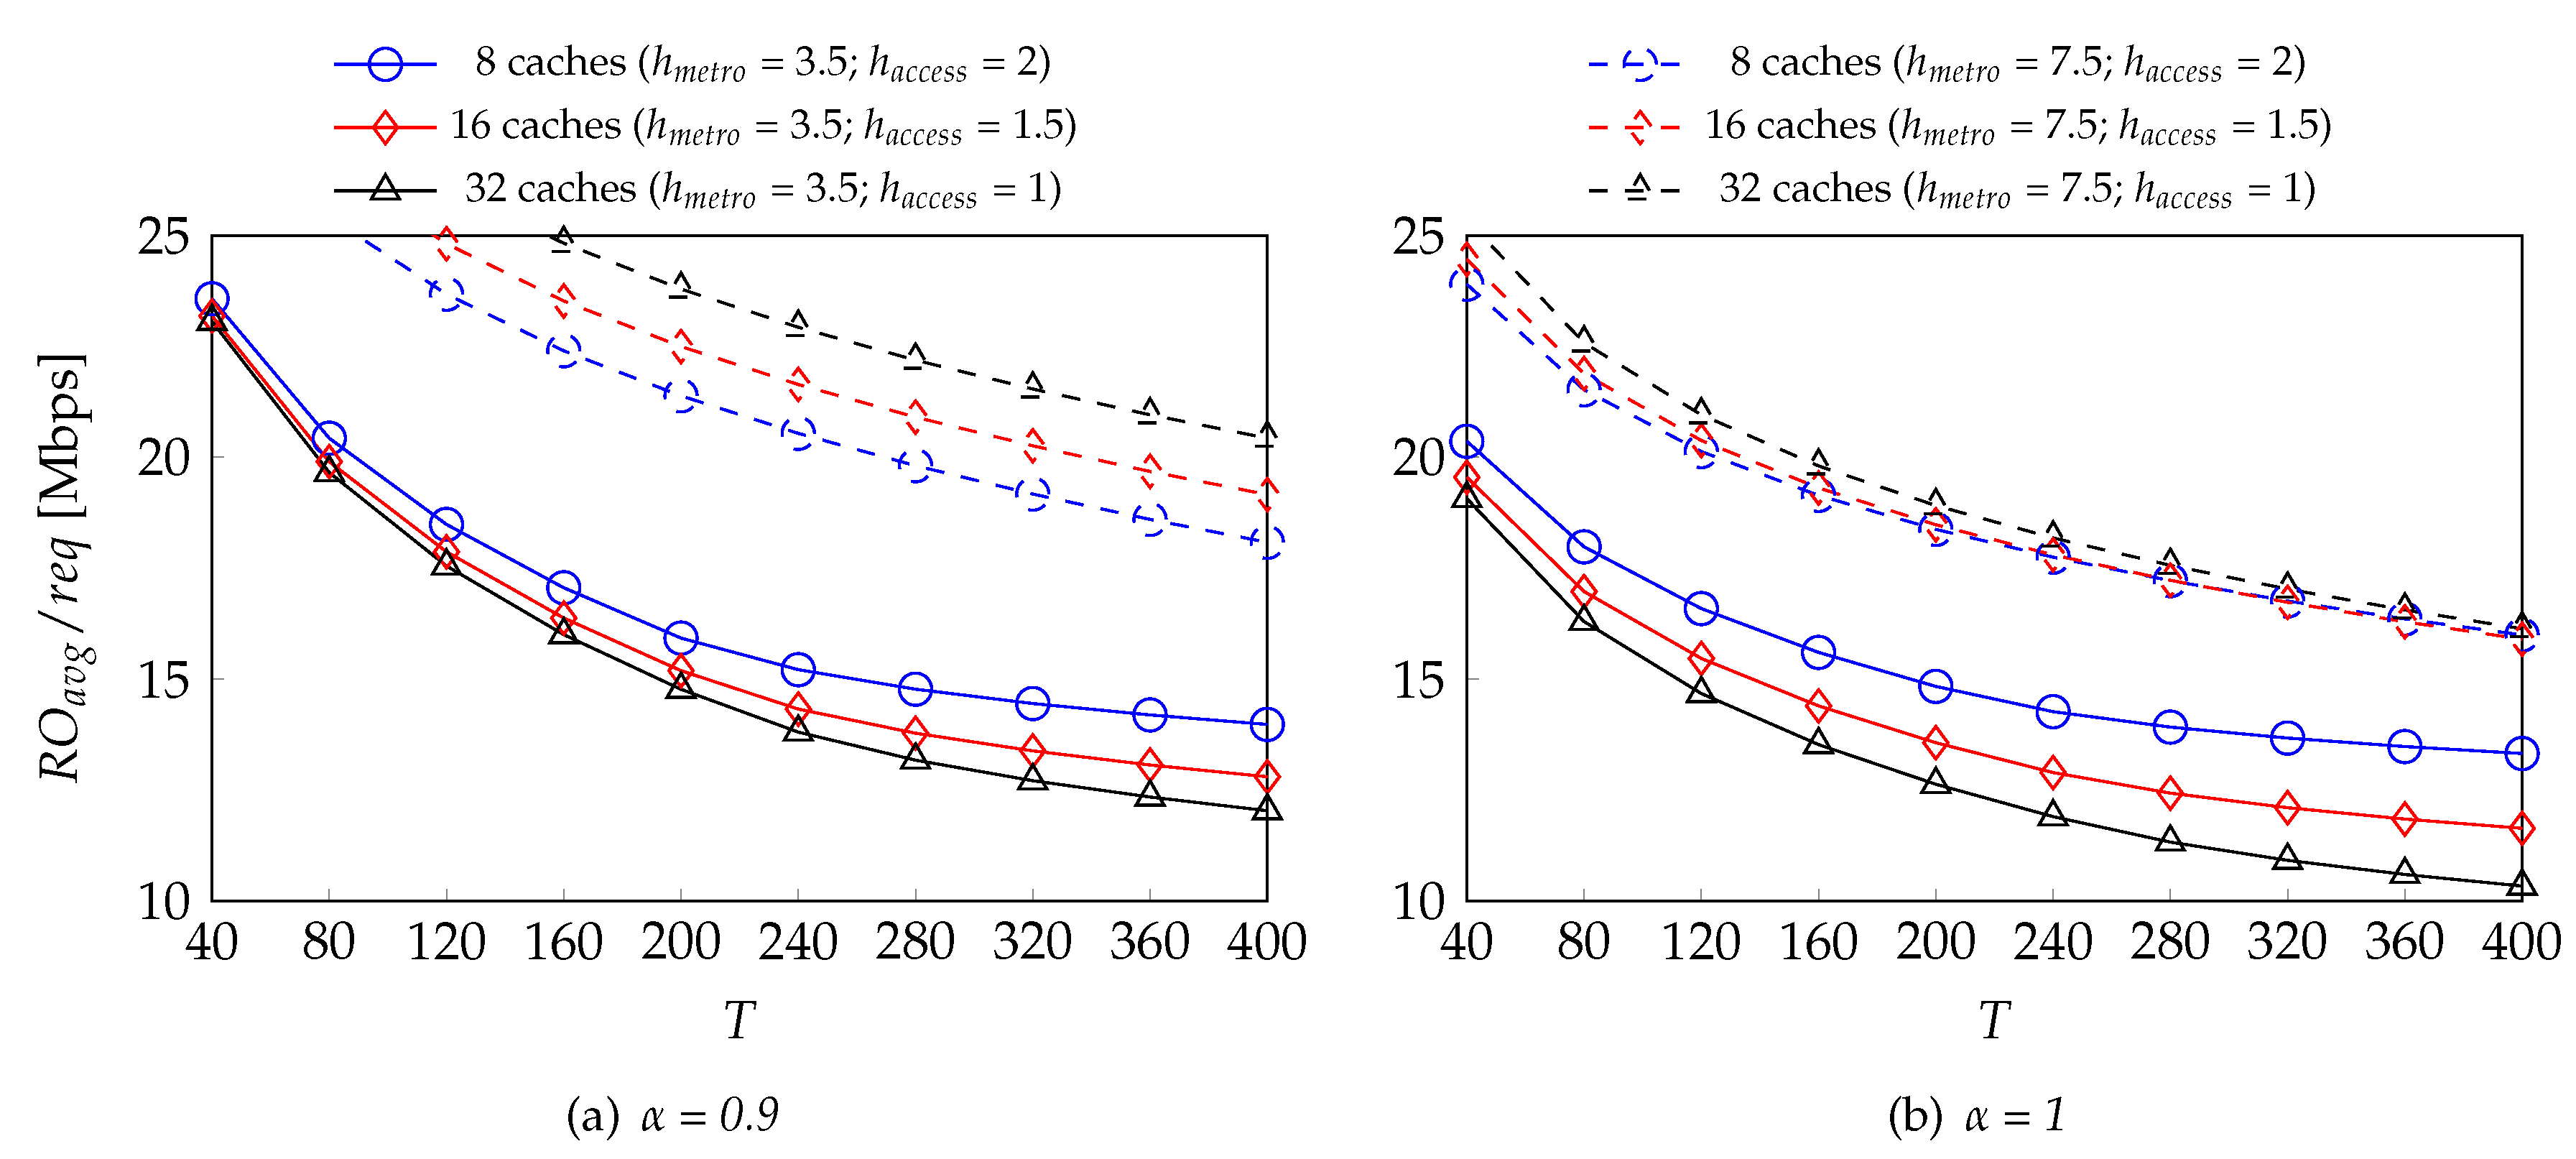
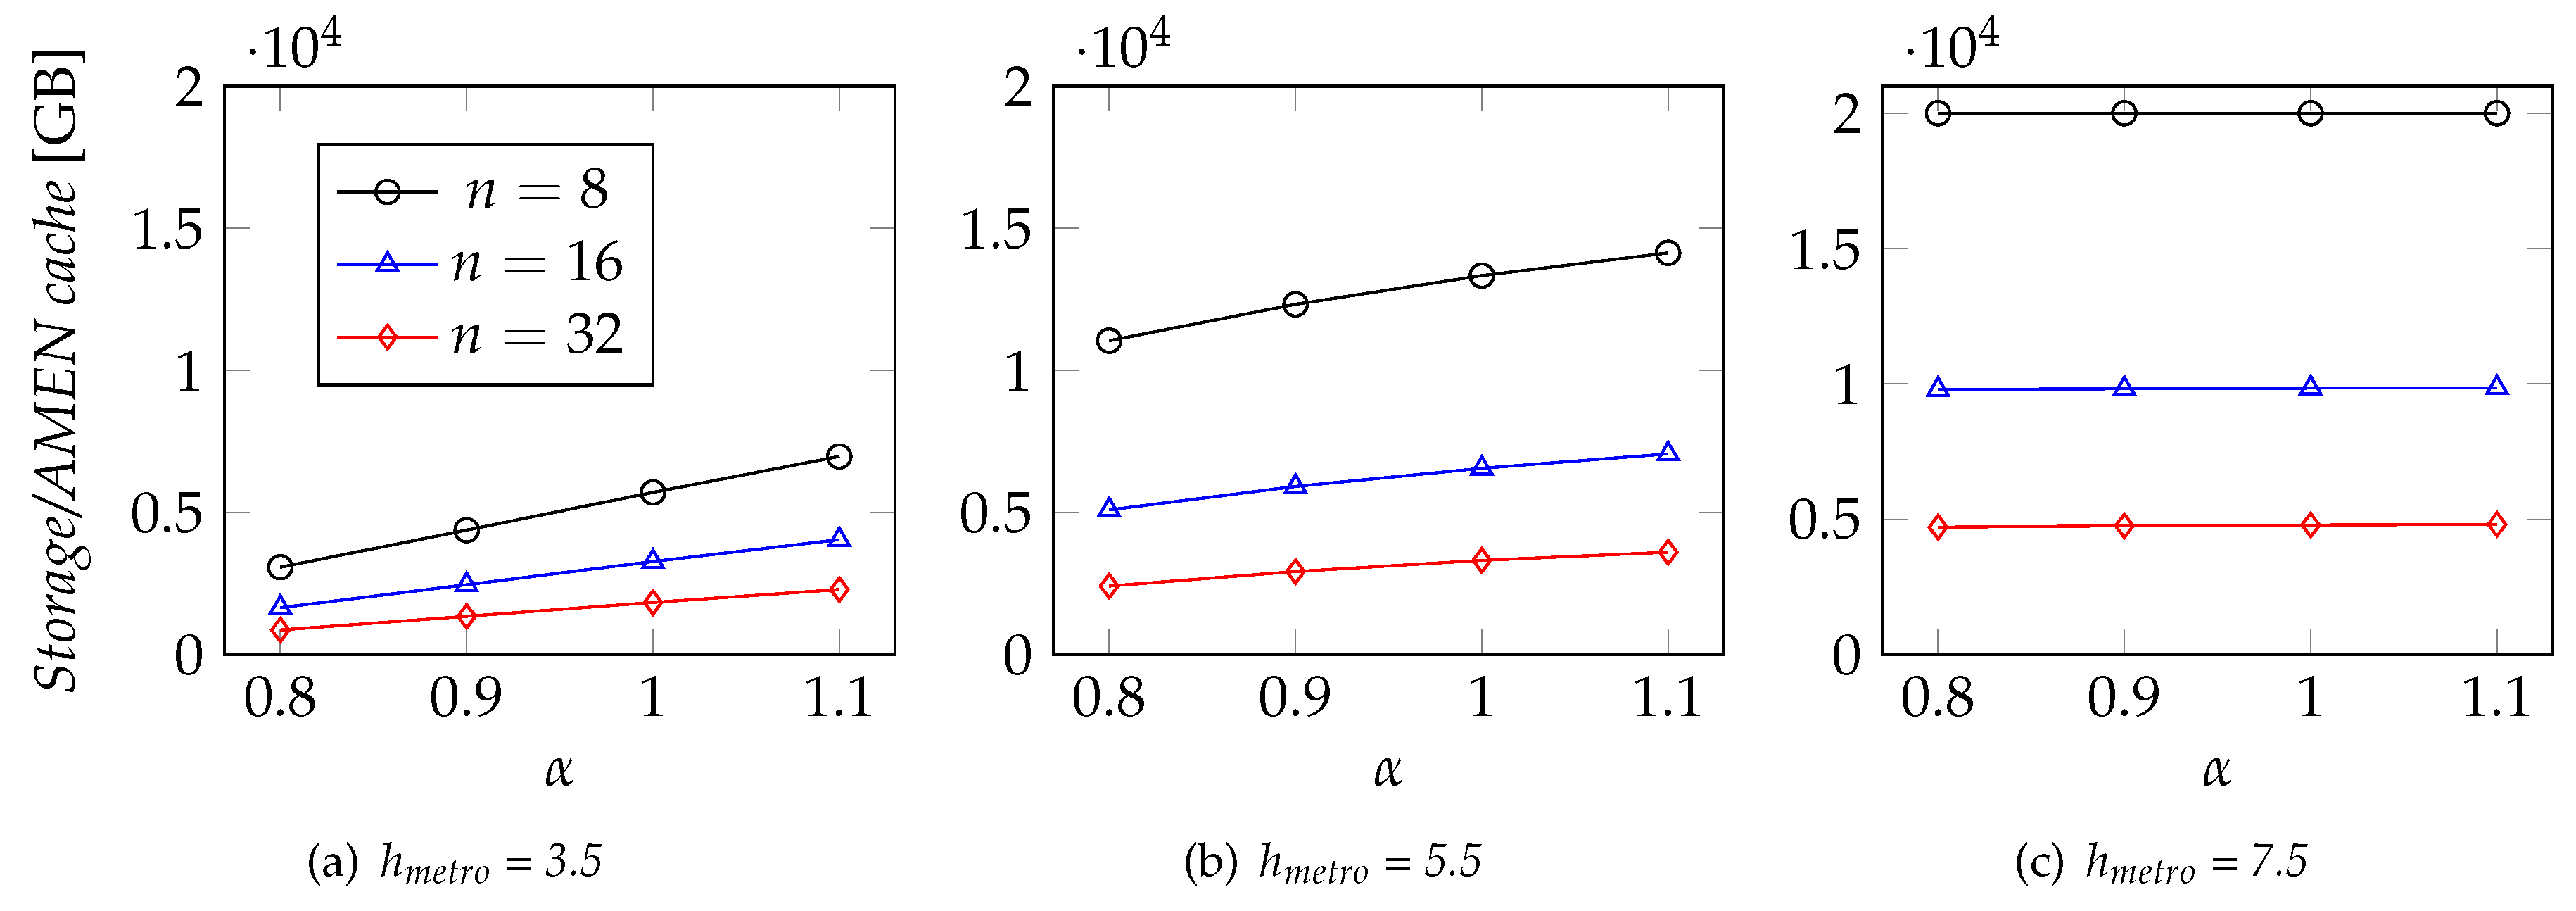
6.3.2. Effects of the Location of the Metro Edge Cache ( h m e t r o ) and the Available Storage Capacity (T)

Finally, we investigate how useful it is to increase the total amount of storage capacity T in the network. We study the variation of the R O a v g / r e q as a function of T and for different values of α and h m e t r o , as shown in Figure 7.
We observe that when T increases and becomes much higher than the size of the content catalog (in this case 160,000 GB), the curve asymptotically saturates, revealing only a slight improvement in R O a v g / r e q . In other words, once popular items are already stored in network caches, it becomes very costly to further improve the R O a v g / r e q , as it requires allocating huge amounts of storage capacity in order to store many unpopular items. However, when the MCEN cache is not utilized (due to its location being far from end-users), increasing T leads to a significant decrease in the R O a v g / r e q per VoD request, as it allows AMEN caches to store more popular items.
More specifically, for h m e t r o = 3.5 and for all values of α , the results show and confirm that utilizing 32 AMEN caches has the best performance (i.e., leads to the lowest R O a v g / r e q ), independently of the amount of storage capacity granted. On the contrary, for h m e t r o = 7.5, the results confirm that for a relatively lower value of α (Figure 7a,b), the utilization of small number of large-capacity caches yields the minimum R O a v g / r e q per VoD request. For a larger value of α (Figure 7b), it becomes more beneficial to utilize many small-capacity caches, since in such a popularity distribution, the popular items gain more popularity, making it decisive to deliver them from the nearest locations possible. In conclusion, the ideal amount of storage capacity to deploy in the network heavily depends on both the dimensions of the metro network and the popularity distribution.

7. Conclusions

In this paper we addressed the problem of finding the optimal cache deployment in terms of number of caches, their location and their size (in terms of storage capacity) in a hierarchical, optical metro network, which minimizes the overall network resource occupation under limited storage capacity. We provide an analytical model that serves as a tool to calculate the optimal storage distribution according to several features, such as the dimension of the metro network and the size and the Zipf popularity distribution of the VoD-content catalog. The model, given a fixed budget in terms of storage capacity, finds the number of caches to deploy at each network level and distributes the storage capacity available to minimize the overall network resources used for VoD-content delivery. To cross-validate our analytical model and to evaluate VoD-content delivery under dynamic traffic, we use a discrete-event simulator for dynamic VoD-content caching and distribution. Numerical results show that in a case where the storage capacity is limited, the optimal cache deployment requires an intelligent distribution of the the available storage capacity among caches of various network segments. Moreover, we also show that the optimal cache deployment depends on the location of the metro cache (how far it is from end-users and how wide is the metro network) and the skewness of the popularity distribution. Our model also helps with identifying when deploying an excessive amount of storage capacity in the network does not further improve network resource utilization.

Author Contributions

conceptualization, O.A. and F.M.; methodology, O.A., F.M. and M.T.; software, O.A. and D.A.; validation, O.A., F.M. and M.T.; formal analysis, O.A. and D.A.; investigation, O.A.; resources, D.A.; data curation, D.A.; writing–original draft preparation, O.A.; writing–review and editing, F.M.; visualization, D.A.; supervision, M.T.; project administration, M.T. and A.P.; All authors have read and agreed to the published version of the manuscript.

Funding

This research was funded by the European Community grant number 761727, Metro-Haul project.

Conflicts of Interest

The authors declare no conflict of interest. The funders had no role in the design of the study; in the collection, analyses, or interpretation of data; in the writing of the manuscript, or in the decision to publish the results.

References

  1. Peterson, L.; Al-Shabibi, A.; Anshutz, T.; Baker, S.; Bavier, A.; Das, S.; Hart, J.; Palukar, G.; Snow, W. Central office re-architected as a data center. IEEE Commun. Mag. 2016, 54, 96–101. [Google Scholar] [CrossRef]
  2. Sourlas, V.; Gkatzikis, L.; Flegkas, P.; Tassiulas, L. Distributed cache management in information-centric networks. IEEE Trans. Netw. Serv. Manag. 2013, 10, 286–299. [Google Scholar] [CrossRef]
  3. Yang, C.; Li, H.; Wang, L.; Xu, Z. A game theoretical framework for improving the quality of service in cooperative radio access network caching. In Proceedings of the IEEE International Conference on Communications (ICC), Paris, France, 21–25 May 2017; pp. 1–7. [Google Scholar]
  4. Savi, M.; Ayoub, O.; Musumeci, F.; Zhe Li, N.; Verticale, G.; Tornatore, M. Energy-efficient caching for video-on-demand in fixed-mobile convergent networks. In Proceedings of the IEEE Online Conference on Green Communications (OnlineGreenComm), Piscataway, NJ, USA, 10–12 November 2015; pp. 17–22. [Google Scholar]
  5. Kutscher, D.; Eum, S.; Pentikousis, K.; Psaras, I.; Corujo, D.; Saucez, D.; Schmidt, T.; Waehlisch, M. Information-centric Networking (ICN) Research Challenges; Internet Research Task Force (IRTF): Fremont, CA, USA, 2016; pp. 1–38. [Google Scholar]
  6. Andreoletti, D.; Rottondi, C.; Giordano, S.; Verticale, G.; Tornatore, M. An open privacy-preserving and scalable protocol for a Network-Neutrality compliant caching. In Proceedings of the ICC 2019-2019 IEEE International Conference on Communications (ICC), Shanghai, China, 20–24 May 2019; pp. 1–6. [Google Scholar]
  7. Andreoletti, D.; Giordano, S.; Rottondi, C.; Tornatore, M.; Verticale, G. To be neutral or not neutral? The in-network caching dilemma. IEEE Internet Comput. 2018, 22, 18–26. [Google Scholar] [CrossRef]
  8. Andreoletti, D.; Ayoub, O.; Rottondi, C.; Giordano, S.; Verticale, G.; Tornatore, M. A Privacy-Preserving Protocol for Network-Neutral Caching in ISP Networks. IEEE Access 2019. [Google Scholar] [CrossRef]
  9. Ayoub, O.; Musumeci, F.; Andreoletti, D.; Mussini, M.; Tornatore, M.; Pattavina, A. Optimal Cache Deployment for Video-an-Demand Delivery in Optical Metro-Area Networks. In Proceedings of the 2018 IEEE Global Communications Conference (GLOBECOM), Abu Dhabi, UAE, 9–13 December 2018; pp. 1–6. [Google Scholar]
  10. Ayoub, O.; Musumeci, F.; Tornatore, M.; Pattavina, A. Energy-Efficient Video-On-Demand Content Caching and Distribution in Metro Area Networks. IEEE Trans. Green Commun. Netw. 2018, 3, 159–169. [Google Scholar] [CrossRef]
  11. Llorca, J.; Tulino, A.M.; Guan, K.; Esteban, J.; Varvello, M.; Choi, N.; Kilper, D.C. Dynamic in-network caching for energy efficient content delivery. In Proceedings of the IEEE INFOCOM, Turin, Italy, 14–19 April 2013; pp. 245–249. [Google Scholar]
  12. Applegate, D.; Archer, A.; Gopalakrishnan, V.; Lee, S.; Ramakrishnan, K. Optimal content placement for a large-scale VoD system. IEEE/ACM Trans. Netw. 2016, 24, 2114–2127. [Google Scholar] [CrossRef]
  13. Ciccarella, G.; Roffinella, D.; Vari, M.; Vatalaro, F. Performance improvement and network TCO reduction by optimal deployment of caching. In Proceedings of the Euro Med Telco Conference (EMTC), Naples, Italy, 12–15 November 2014; pp. 1–6. [Google Scholar]
  14. Ayoub, O.; Musumeci, F.; Tornatore, M.; Pattavina, A. Techno-Economic Evaluation of CDN Deployments in Metropolitan Area Networks. In Proceedings of the International Conference on Networking and Network Applications (NaNA), Hokkaido, Japan, 16–19 October 2017; pp. 314–319. [Google Scholar]
  15. Natalino, C.; de Sousa, A.; Wosinska, L.; Furdek, M. Content placement in 5G-enabled edge/core datacenter networks resilient to link cut attacks. Networks 2020. [Google Scholar] [CrossRef]
  16. Hasan, S.; Gorinsky, S.; Dovrolis, C.; Sitaraman, R.K. Trade-offs in optimizing the cache deployments of CDNs. In Proceedings of the INFOCOM, Toronto, ON, Canada, 27 April–2 May 2014; pp. 460–468. [Google Scholar]
  17. Gourdin, E.; Bauguion, P. Optimal hierarchical deployment of caches for video streaming. In Proceedings of the 6th International Conference on the Network of the Future (NOF), Montreal, QC, Canada, 30 September–2 October 2015; pp. 1–5. [Google Scholar]
  18. Li, H.; Wang, H.; Liu, J.; Xu, K. Video requests from online social networks: Characterization, analysis and generation. In Proceedings of the INFOCOM, Turin, Italy, 14–19 April 2013; pp. 50–54. [Google Scholar]
  19. Kim, D.; Ko, Y.B.; Lim, S.H. Comprehensive analysis of caching performance under probabilistic traffic patterns for content centric networking. China Commun. 2016, 13, 127–136. [Google Scholar] [CrossRef]
  20. Adhikari, V.K.; Guo, Y.; Hao, F.; Hilt, V.; Zhang, Z.L.; Varvello, M.; Steiner, M. Measurement study of Netflix, Hulu, and a tale of three CDNs. IEEE/ACM Trans. Netw. 2015, 23, 1984–1997. [Google Scholar] [CrossRef]
  21. Casas, P.; D’Alconzo, A.; Fiadino, P.; Bär, A.; Finamore, A.; Zseby, T. When YouTube does not work - Analysis of QoE-relevant degradation in Google CDN traffic. IEEE Trans. Netw. Serv. Manag. 2014, 11, 441–457. [Google Scholar] [CrossRef]
  22. Salahuddin, M.A.; Sahoo, J.; Glitho, R.; Elbiaze, H.; Ajib, W. A survey on content placement algorithms for cloud-based content delivery networks. IEEE Access 2018, 6, 91–114. [Google Scholar] [CrossRef]
Figure 1. Network topology considered in our study.
Applsci 10 01984 g001
Figure 2. Effect of the popularity skew parameter α on the popularity distribution of a content catalog of 100 items for α = 0.8, 0.9 and 1 for the most popular 25 items.
Applsci 10 01984 g002
Figure 3. Example of two random storage capacity distribution approaches, each leading to a cache deployment.
Applsci 10 01984 g003
Figure 4. R O a v g / r e q with respect to k, the number of items stored in the access-metro edge node (AMEN) caches for each of the three case studies.
Applsci 10 01984 g004
Figure 5. R O a v g / r e q for cache deployments with different numbers of AMEN caches utilized in the network for different values of α with respect to h m e t r o , the average hop-distance between the MCEN cache and end-users.
Applsci 10 01984 g005
Figure 6. The amounts of storage capacity for the AMEN caches corresponding to the best cache deployment when utilizing 8, 16 or 32 caches for different values of α and h m e t r o .
Applsci 10 01984 g006
Figure 7. Average resource occupation R O a v g / r e q for increasing value of total allowed storage capacity for α = 0.9 and 1.
Applsci 10 01984 g007
Table 1. Notation considered in the analytical model.
Parameter/VariableDescription
NNumber of items in catalog
TTotal allowed storage capacity (GB)
R O a v g / r e q Average RO per second per VoD request
S a Average content size
h a c c e s s Average hop-distance from AMEN caches
h m e t r o Average hop-distance from MCEN cache
h s e r v e r Average hop-distance from video server
n a c c e s s Number of AMEN caches utilized
kIndex of last content stored in AMEN caches
b r Average bit-rate of all VoD requests
Table 2. Simulation settings for the considered case studies.
Case Study # α S a (GB)TAMENs n access h access
10.98160,00032321
216120,00032161.5
31.18160,00032321
Table 3. Values of k m o d e l and k s i m for each case study.
Case Study # k model k sim Error
1266.475267 1.9 · 10 3
2614.415615 9.5 · 10 4
3376.228377 2.05 · 10 3
Table 4. Percentage of requests served from the video server, the metro-core edge node (MCEN) cache and the AMEN caches, and the average resource occupation (RO) for each cache deployment in the three case studies.
Case Study #1
Cache DeploymentDCMCEN CacheAMENs CachesRO
Only MCEN0100%027
k o p t i m i z e d 9%46%45%19
Only AMENs42%058%24.43
Case Study #2
Cache DeploymentDCMCEN CacheAMENs CachesRO
Only MCEN0100%027
k o p t i m i z e d 4%27%69%16.21
Only AMENs27%073%19.32
Case Study #3
Cache DeploymentDCMCEN CacheAMENs CachesRO
Only MCEN0100%027
k o p t i m i z e d 5%22%73%12.57
Only AMENs22%078%15.06
Table 5. Best cache deployment (number of caches and their storage capacities) among different network levels based on location of MCEN cache ( h m e t r o ) and value of the popularity distribution skew parameter α .
h m e t r o ≤ 4.54.5 < h m e t r o < 6.5 h m e t r o ≥ 6.5
α < 1AMENs: High number, small capacity
MCEN: Large capacity
AMENs: Low number, medium capacity
MCEN: Medium capacity
AMENs: Low number, large capacity
MCEN: no cache
α = 1
α > 1AMENs: High number, large capacity
MCEN: Small capacity
AMENs: High number, small capacity
MCEN: no cache

