Article

Multi-Objective Optimization of Spatially Truss Structures Based on Node Movement

1
College of Water Conservancy Shenyang Agricultural University, Shenyang 110866, China
2
School of Civil Engineering, Harbin Institute of Technology, Harbin 150090, China
*
Authors to whom correspondence should be addressed.
Appl. Sci. 2020, 10(6), 1964; https://doi.org/10.3390/app10061964
Submission received: 5 February 2020 / Revised: 2 March 2020 / Accepted: 9 March 2020 / Published: 13 March 2020
(This article belongs to the Special Issue Spatial Modeling in Environmental Analysis and Civil Engineering)

Abstract

:
This paper discusses the solutions for topology optimization of spatially discrete structures. The optimization objects are the structural weight and the maximum displacement. The optimization variables include structural node coordinates, and the improved MOEA (Multi-objective Evolutionary Algorithm) method is used to optimize the structure. The innovation of this study is that it breaks through the shortage of constant node position in the optimization thought of traditionally discrete structure in the “Ground Structure Approach” and uses the coordinate of the node as the optimization variable for the optimization calculation. The result is not a single one but a set of optimal solutions through the evolution (i.e., Pareto optimal solutions); on this basis, the most suitable solution can be found according to the boundary conditions or other related requirements. Using the C# language to compile the calculation program, ANSYS finite element software is used to analyze the structure, and the Pareto front surface was automatically drawn to determine the optimal layout form of the discrete structure. The analysis results show that the improved MOEA method can provide an effective method to solve such optimization problems.

1. Introduction

Optimizing a discrete structure is a multi-objective optimization problem with some constraining conditions that include not only strength issues but also weight and rigidity factors. As early as 1904, Michell [1] researched the structural design of stress constraint under a single load using an analytic method and proposed a theory of truss optimization design that was called Michell theory. In a subsequent study, Prager [2] found that the Michell structure was a more flexible structure than others. In the single loading case, the bar direction is distributed along the main stress. In 1964, Dorn et al. [3] proposed a “Ground Structure Approach”, which introduced the numerical method into the optimization region for the first time. The “Ground Structure” was connected by many components, which included all loading points and supporting points. The principle of this method was that: on the basis of the ground structure model, some optimization algorithm (mathematical programming approach or criterion method) can be used to omit needless bars from the ground structure according to regulations and constraints. For example, the sectional area of a bar attaches to the zero or floor level, which is unnecessary, and ultimately, the remaining bars form the optimization topology of the structure. Then, there are the other numerical algorithms, such as the weight method, constraint method [4], simplex method [5] and gradient method [6].
In recent years, the artificial intelligence algorithm has been widely used for solving the truss optimization problem. Sun et al. [7] listed all connection types of truss structure first and then set a bound of threshold value for a section surface on the truss member. Subsequently, the section surface of the truss member was used as a design variable, which was optimized by the GA (Genetic Algorithm), and in this method, some trusses with section area that was less than the floor threshold level were omitted to achieve topological optimization. Ioannis et al. [8] used the PSO (Particle Swarm Optimization) algorithm for topological optimization of a truss structure, and this theory translated the structure optimization problem constraint with stress and displacement into an unconstrained optimization issue by the penalty function. Under this condition, the optimization problem of truss structure constraint with stress and displacement was finally solved. In recent years, Free Gradient Methods for short (FGMs ) have been applied to many industrial applications in aerospace and civil engineering [9].
However, regardless of using the traditional numerical optimization method or a new artificial intelligence optimization method, there is no fundamental change in the optimization variables. Thus, most of the topological optimization of the truss structure is based on the ground structure, and the result of the optimal solution is actually a subset of given layouts. Thus, the range of the ground structure adoption is defined from the beginning of the optimization, which leads to an approximate optimal solution and loss of the optimal solution because the true value is not included. Therefore, the real topological optimization is supposed to search optimization in any given region, which means that researchers should consider the effect of the ultimate topological form on node movement of the structure.
For optimization goals, one of the biggest features of the evolutionary algorithm search solution is that it is a group search algorithm that can deal with the parallel solving of the problem of multi-objective optimization with two or more goals. In 1967, Rosenberg proposed a solution to a multi-objective optimization problem using a genetic search algorithm in his doctoral thesis, while VEGA (Vector Evaluated Genetic Algorithm) did not appear until 1985, which was the first multi-objective evolutionary algorithm (MOEA) [10]. Then, many researchers improved this method later. Fonseca and Fleming [11] proposed multi-objective optimization GAs, Srivivas and Deb [12] put forward a non-dominated sorting GA, and these methods were called MOEA based on Pareto. San et al. [13] employed NURBS (Non-Uniform Rational B-Splines) functions to represent the geometrical shape and then optimized a class of structures under mass constraints and self-weight. Mroginski et al. [14] proposed a selective GA for the multi-objective design of trusses, and their approach involved sensitivity analysis of each variable to reduce the search space and to improve the convergence rate.
A multi-objective optimization problem is different from single objective optimization; it is not a single answer but a group of solutions, called the Pareto frontier. When there are multiple targets, there are usually solutions that cannot be easily compared. This solution is referred to as the Pareto optimal solution. In this paper, to solve the problem of discrete optimization, node movement in the structure was considered. Using a C# language self-programming optimization program, ANSYS finite element software analysis and calculations were used to draw the current Pareto optimal frontier in real time for structural optimization. Subsequently, the weight and maximum displacement of the discrete structure were used as the optimization goal, and the space truss and coordinates of the tower nodes were used as optimization variables to determine the optimal topological mode for this kind of discrete structure.

2. MOEA Algorithm and Improvement

2.1. Basic Concept of MOEA

A multi-objective optimization problem is different from single objective optimization, which is not a single answer but a group of solutions, called the Pareto frontier [15]. The conception of Pareto was suggested by French economist V. Pareto. First, the Pareto frontier is defined as one or some individuals in an optimization region that had no absolute good individual that was better than any other one. “Absolutely good” means that at least one goal is good, and the other goals are not bad. Then, the multi-objective problem requests a group of equilibrium solutions, not a single optimal solution.
For a given issue, the Pareto optimal solution and frontier is definite, and an MOEA is used to solve the multi-objective optimization problem with the view of obtaining the Pareto optimal set and then confirming the final solution according to other information about the problem (such as boundary conditions, etc.). In many test functions, the Pareto frontier of the problem is known, and it can be used to test the algorithm. Nevertheless, the Pareto frontier in practical problems is unknown. (Figure 1 shows hollow circles that indicate a set of solutions, and solid square spots indicate the Pareto frontier as the optimal solution set with the boundary conditions of 0.6 < f1 < 1.0 and 0.6 < f2 < 1.0; the blue circle region shows the selected optimal solutions.)

2.2. Improvement to MOEA

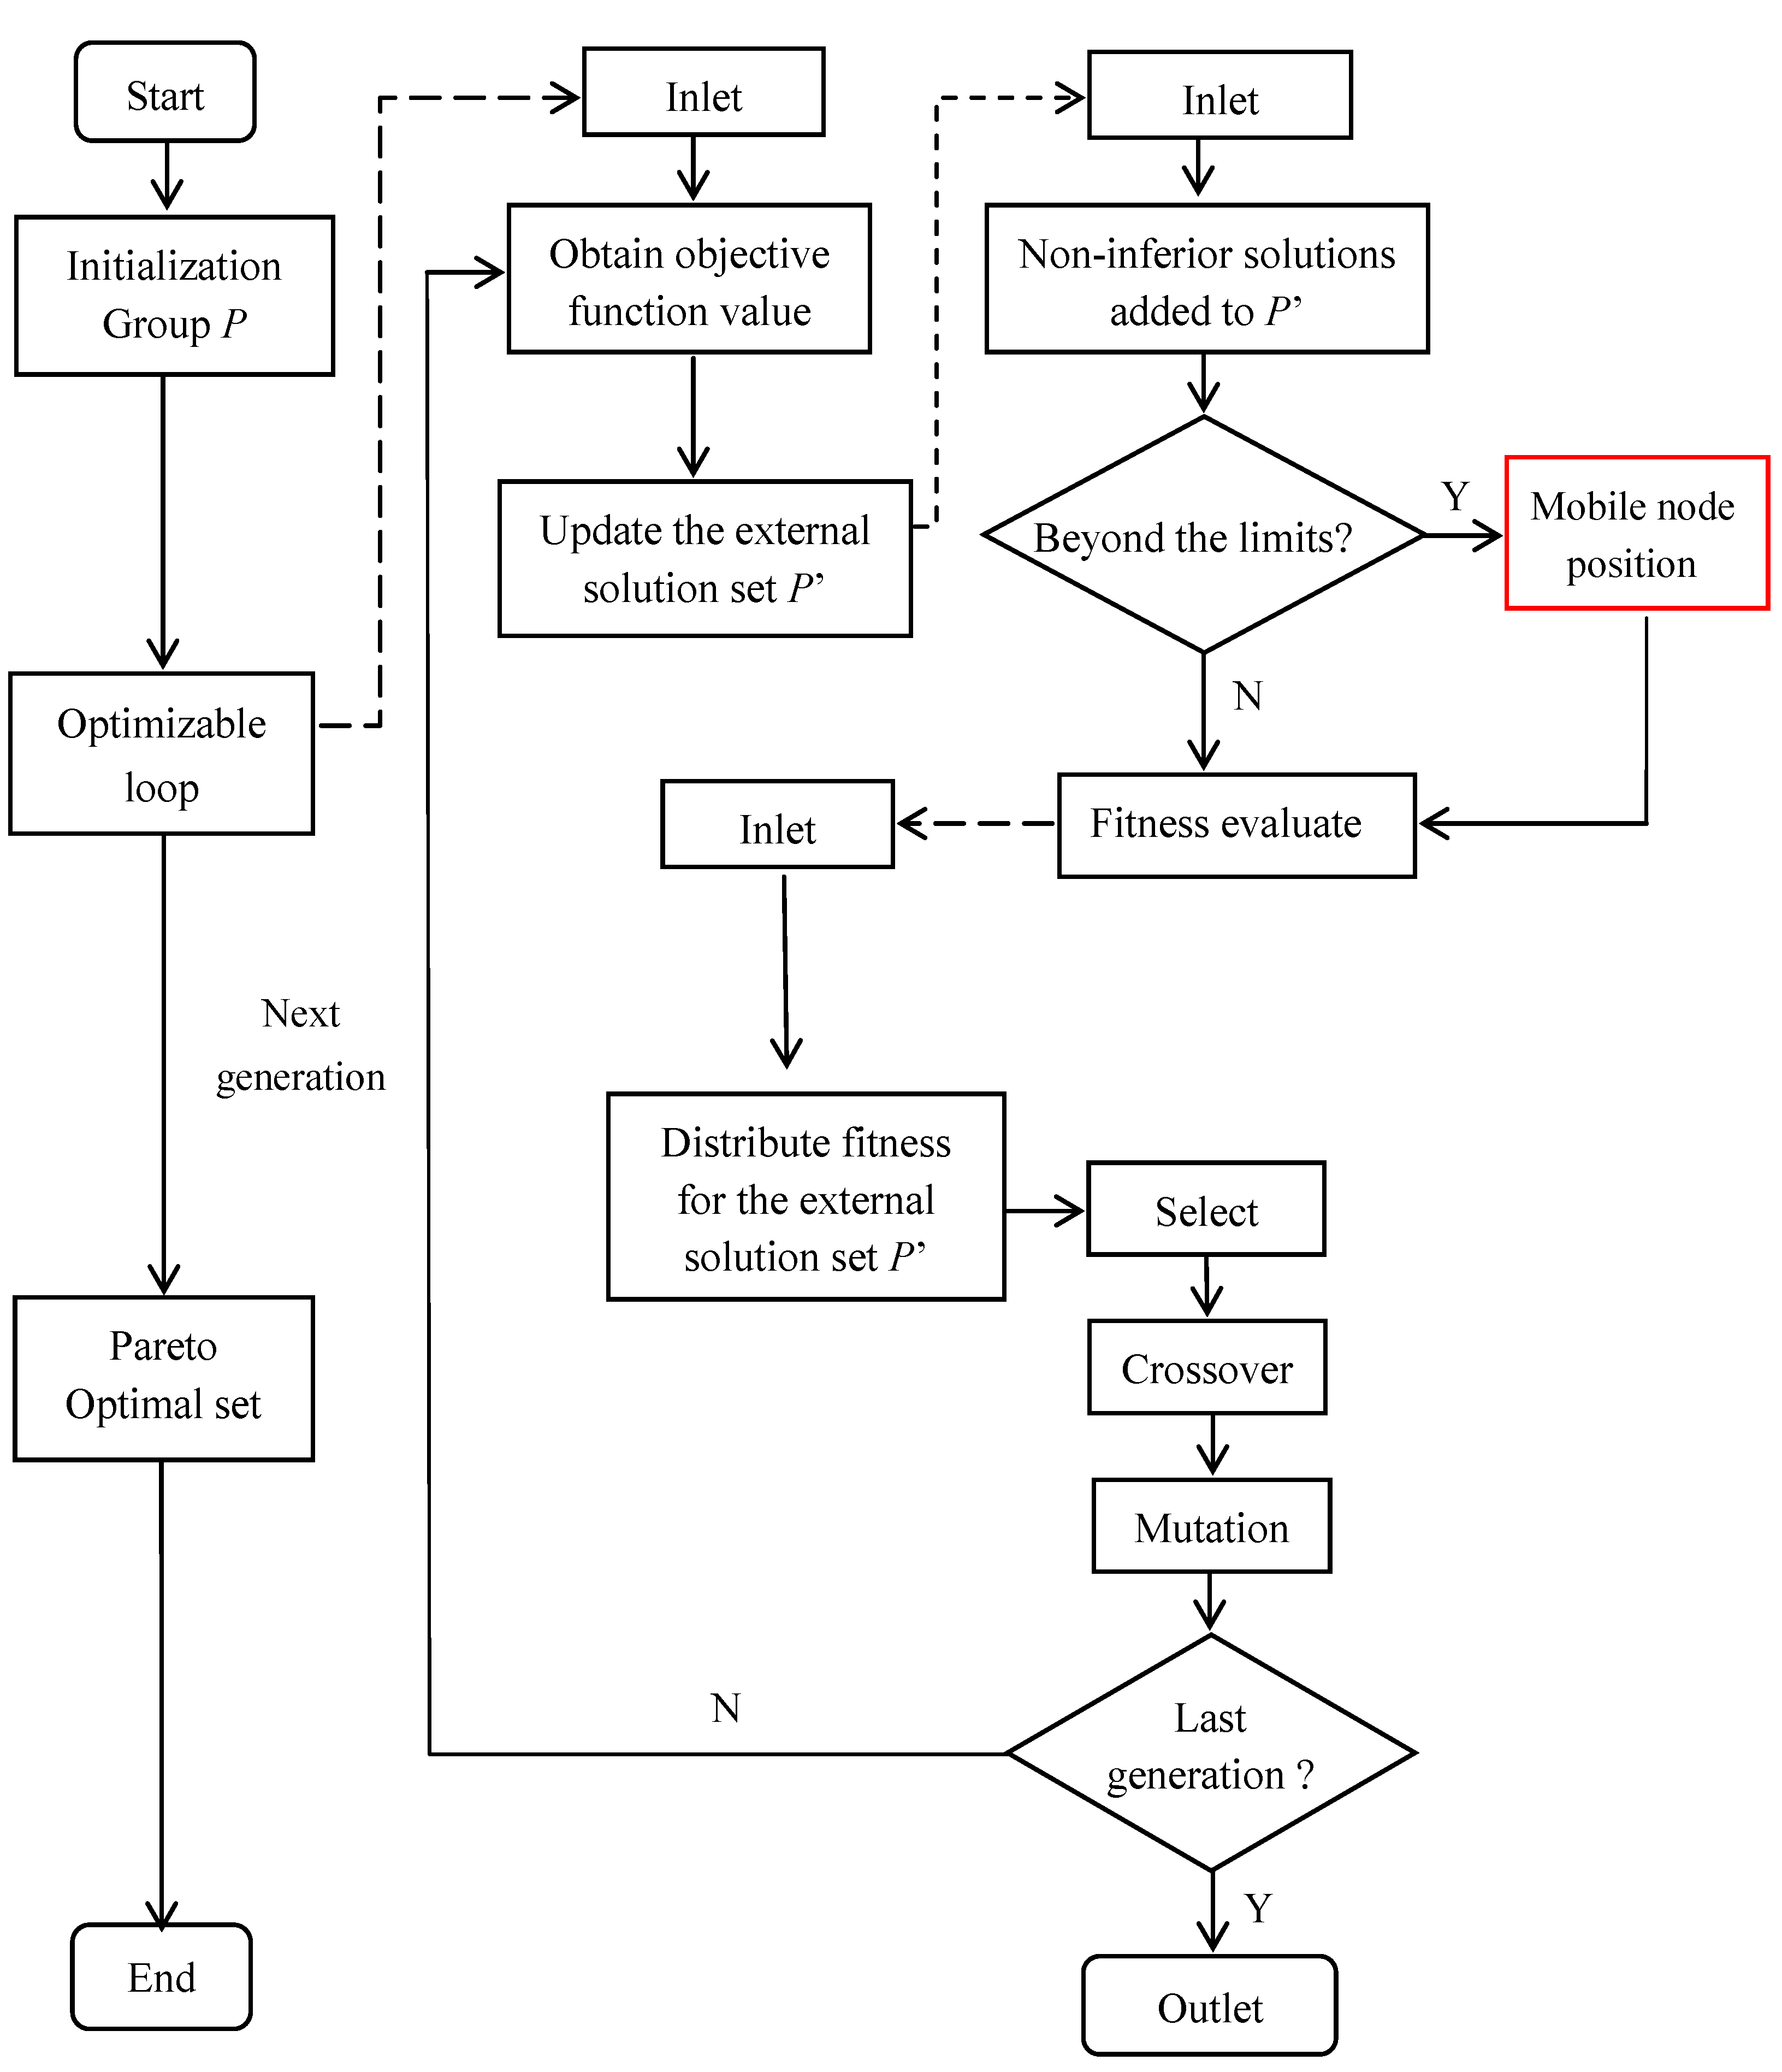
There are two main points in the improved MOEA approach of this paper: 1. It abandons the traditional optimization algorithm, which only considers a single target of structure weight in the optimization process, and adopts two optimization targets of weight and maximum displacement for control. 2. The optimization variable is not the traditional bar section, but instead uses the truss node coordinates as the variable. 3. The fitness function is not calculated by the objective function directly, but by indirect connection of the Pareto strength and the objective function value. The Pareto strength increases during the evolutionary process (shown in Figure 2); this is the individual solution with low density, and then the total disaggregation advances to the Pareto optimal frontier through an evolutionary process to finally obtain the representative optimal solution set. Because of the direct relevance of the fitness function and Pareto strength, the improved algorithm ensures the convergent solution set as a group of optimal solutions [16,17]; moreover, the density degree of the unit in the solution space is considered so that this method can maintain population diversity and uniform distribution of disaggregation and prevent the disaggregation from converging in a certain part of the Pareto optimal frontier [18,19].

2.2.1. Mathematical Model

Multi-objective optimization is different from single-objective optimization; multi-objective optimization usually has multiple optimal solutions that meet the conditions. In order to explain how to deal with multiple optimal solutions, the mathematical model of multi-objective optimization problem is given.
x = ( x 1 , x 2 , , x n ) T satisfies the constraints in Equations (1) and (2):
g i ( x ) 0 i = 1 , 2 , , k ,
h j ( x ) = 0 j = 1 , 2 , , l .
Assuming there are m optimization objectives, they are minimized as shown in Equation (3):
min f ( x ) = ( f 1 ( x ) , f 2 ( x ) , , f m ( x ) ) T

2.2.2. Pareto Dominate Relations

When there are multiple targets, there are usually solutions that cannot be easily compared. This solution is usually the Pareto optimal solution. The definition of decision space and target space are given here.
Definition (1): definition of decision space:
Ω = { x R n | g i 0 , h j ( x ) = 0 ; ( i = 1 , 2 , , k ; j = 1 , 2 , , k ) } ,
Definition (2): definition of target space:
Π = { f ( x ) | x Ω } ,  
The objective function f(x) maps Ω to the set Π.
Definition (3): definition of dominate relations:
Let xa and xb be two different solutions. If xa dominates xb, the two conditions of Equations (6) and (7) must be satisfied.
For all subgoals, xa is no worse than xb:
i { 1 , 2 , , m } f i ( x a ) f i ( x b ) .
At least there are subgoals that make xa better than xb:
j { 1 , 2 , , m } f j ( x a ) < f j ( x b ) ,
where m is the number of subgoals; then xa ⊱ xb “⊱”represents dominate relations.
The distribution of each individual in the population is shown by a Pareto strength value, indicating the number of individual i in the evolutionary population P. The calculation formula is shown as Equation (8):
S ( i ) = | { j | j P , i j } | .
Based on the Pareto strength value, the fitness value of an individual represents the sum of the strength values of the dominant individual in the evolutionary population. The calculation formula is shown as Equation (9):
R ( i ) = j P , j i S ( j ) .
If there is the same original fitness value between individuals, the density information of individuals is combined into the final fitness. The density information here refers to the application of the adjacent individual strategy, that is, the distance between individual i and other individuals in the evolutionary population P, then calculated and arranged in increasing order. The calculation formula is shown as Equation (10):
D ( i ) = 1 / ( δ i k + 2 ) ,
where δ i k where is the distance between individual i and the kth adjacent individual.
When the distance between individual i and the kth adjacent individual is larger, the individual distribution is better; the smaller the fitness value, the more likely the individual is to be selected for the next evolution.
Considering these factors, the C# language was adopted to compile the MOEA optimization program based on the Pareto strength value order, that each individual in the population is distributed with a strength value, representing the number of individuals dominated by individual in the evolutionary population. The fitness value of an individual represents the sum of the strength values of the dominant individual in the evolutionary population. The smaller the fitness value, the more likely the individual is to be selected for the next evolution.
The ANSYS scripting language APDL was used to write the analytical procedure for the truss finite element in this study. During the counting process, two objective functions (weight and maximum displacement of the structure) were calculated by the finite element method, and this method adopted an alternative pattern to update in real time by way of transferring the value to the optimization module through the connector.

3. Numerical Method Verification

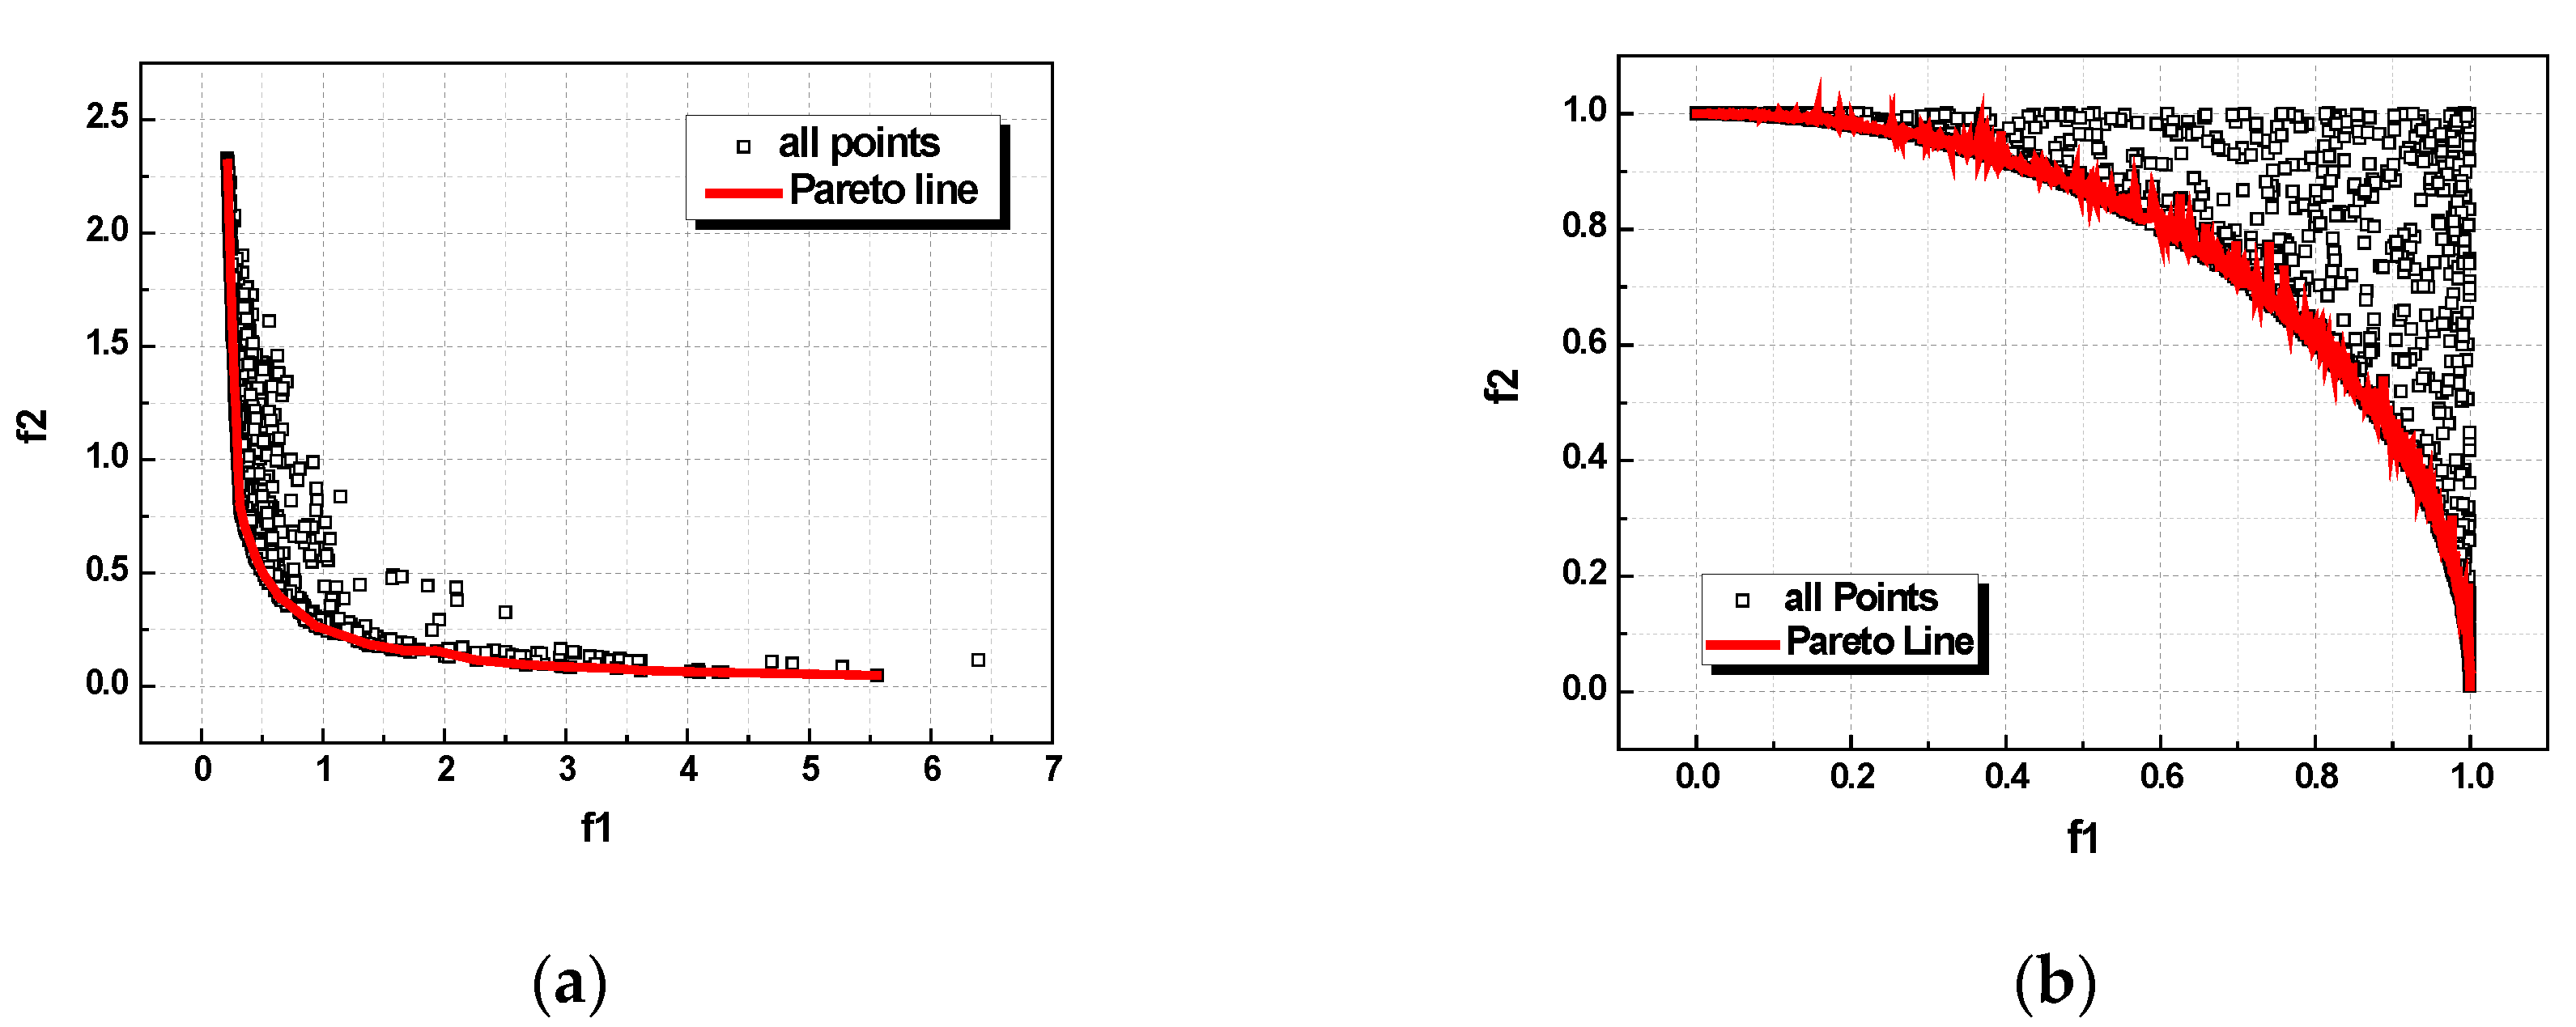
Deb, K. [20] indicated that there are two difficult key problems in multi-objective optimization: 1. how to achieve optimal population converging to the Pareto frontier and 2. how to ensure specimen diversity in the population. Thus, there are various optimal solutions that can be found, such as convex or concave (shown in Figure 3) or discrete or heterogeneous distributions. For this Pareto optimal solution with such characteristics, many researchers have designed a corresponding test function, which is confined to two objectives for each one.
To test the veracity of the algorithm in this study, there is an article that lists the two normative testing functions that are able to reflect the essential feature of multi-objective problems [21]. MOP1 and MOP2 test functions can examine the algorithm and procedure, which represent two familiar conditions in the structure optimization as convex (MOP1) and concave (MOP2) of the Pareto frontier, respectively.

3.1. Function Test

3.1.1. Test Function MOP1

MOP1 is shown as Equation (11), which has one optimization variable x, and two optimization objectives, ƒ1 and ƒ2, and this optimal problem has a convex Pareto frontier:
MOP 1 : M i n F = ( f 1 ( x ) , f 2 ( x ) ) f 1 ( x ) = 1 / ( x + 2 y ) f 2 ( x ) = x + 0.5 y s t . 2.0 x 2.0 ; 2.0 y 2.0
The operating parameters of MOP1 are shown in Table 1.

3.1.2. Test Function MOP2

Unlike MOP1, MOP2 (Equation (12)) has a concave Pareto frontier:
MOP 2 : M i n F = ( f 1 ( x ) , f 2 ( x ) ) f 1 ( x ) = sin ( x + y ) f 2 ( x ) = cos ( x y ) s t . x ( 0 , π 2 ) ; y ( 0 , π 2 )
The operating parameters of MOP2 are shown in Table 2.

3.2. Test Results

The numerical experiment for the improved MOEA was completed in the organizational procedure above, and the evolutionary process and final optimal consequence are shown in Figure 3. The results showed that two types of test functions (convex and concave) obtained the Pareto solution set with symmetrical distributions and good results.

4. Analysis of Typical Discrete Structure Optimization

4.1. Space Truss Optimization

The initial model of the truss was 3m long and was divided into 6 sections, and the physical dimensions of each component of the truss are shown in Figure 4. Moreover, the truss section is in the form of an equilateral triangle, as shown in Figure 5. According to the requirements of the truss structure, the angle between the two bars should be controlled from 30° to 50°. This structure adopts the same section form bar, which does not cross, and they are divided into two forms: a left oblique and a right oblique form. The boundary condition is fixed at one end and free at the other end, and the free end is subjected to a downward concentrated force and the force size is 1000 N. The truss material is steel structure, and beam189 of ANSYS software is used for analysis and calculation.
In the process of truss optimization calculation, since the Beam element is adopted in the truss, each member is divided into three elements. In the whole optimization process, it takes 10 seconds to calculate each optimization step and about 5 minutes to calculate 50 steps.
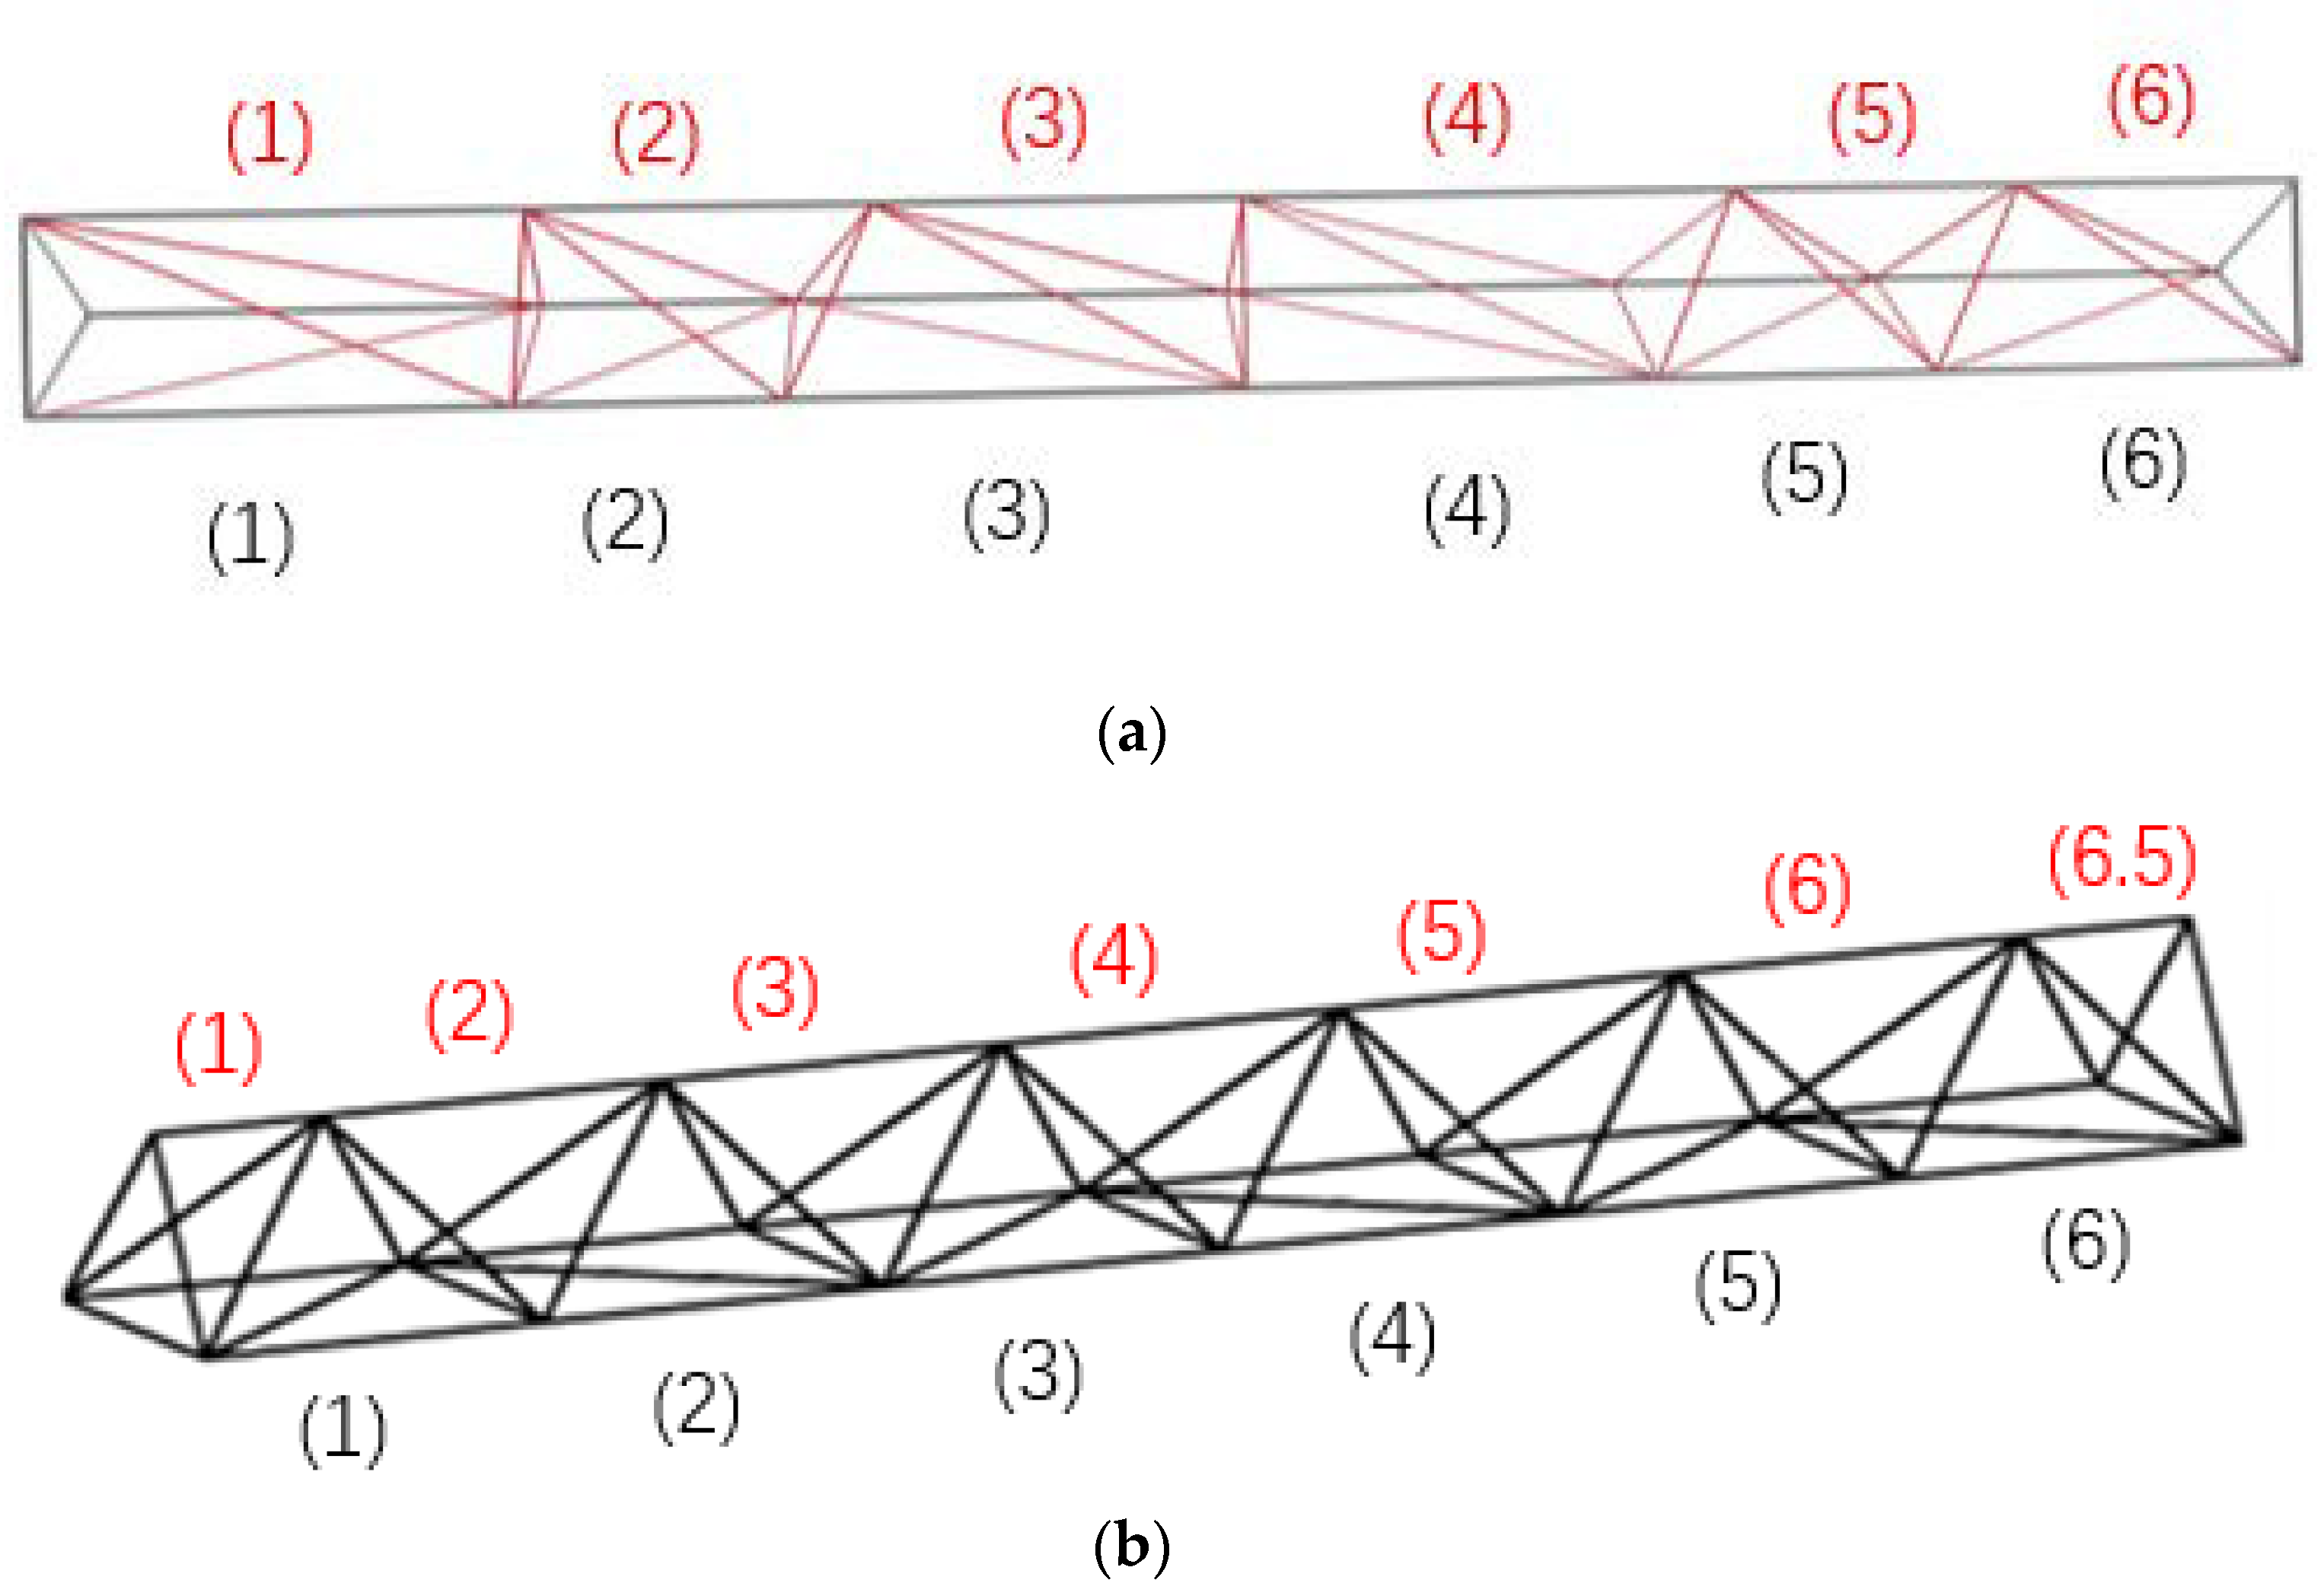
The truss nodes are considered to move along the horizontal chord (z-direction: color number direction as shown in Figure 6). The specific process is as follows: 1. We made the chord node move to the optimal location first, and then connected the diagonal bar. 2. In the optimization procedure, the truss forms were classified into two types (Figure 7): the first type: with a pitch number equal to the upper and lower chords, and the second type: unequal type: the top and bottom strings are the same length, but the top string is more knotted than the bottom string, which is staggered. 3. An “on-off” pattern was used, i.e., nodes were dispersed into four independent dots with a continuous moving range around the half-section, i.e., eight equal diversion points of the truss node (Figure 6.) so that it was moving the down cord node. This not only avoids the connection of cross-node number, but also improves the calculation efficiency and makes the optimized result modular.
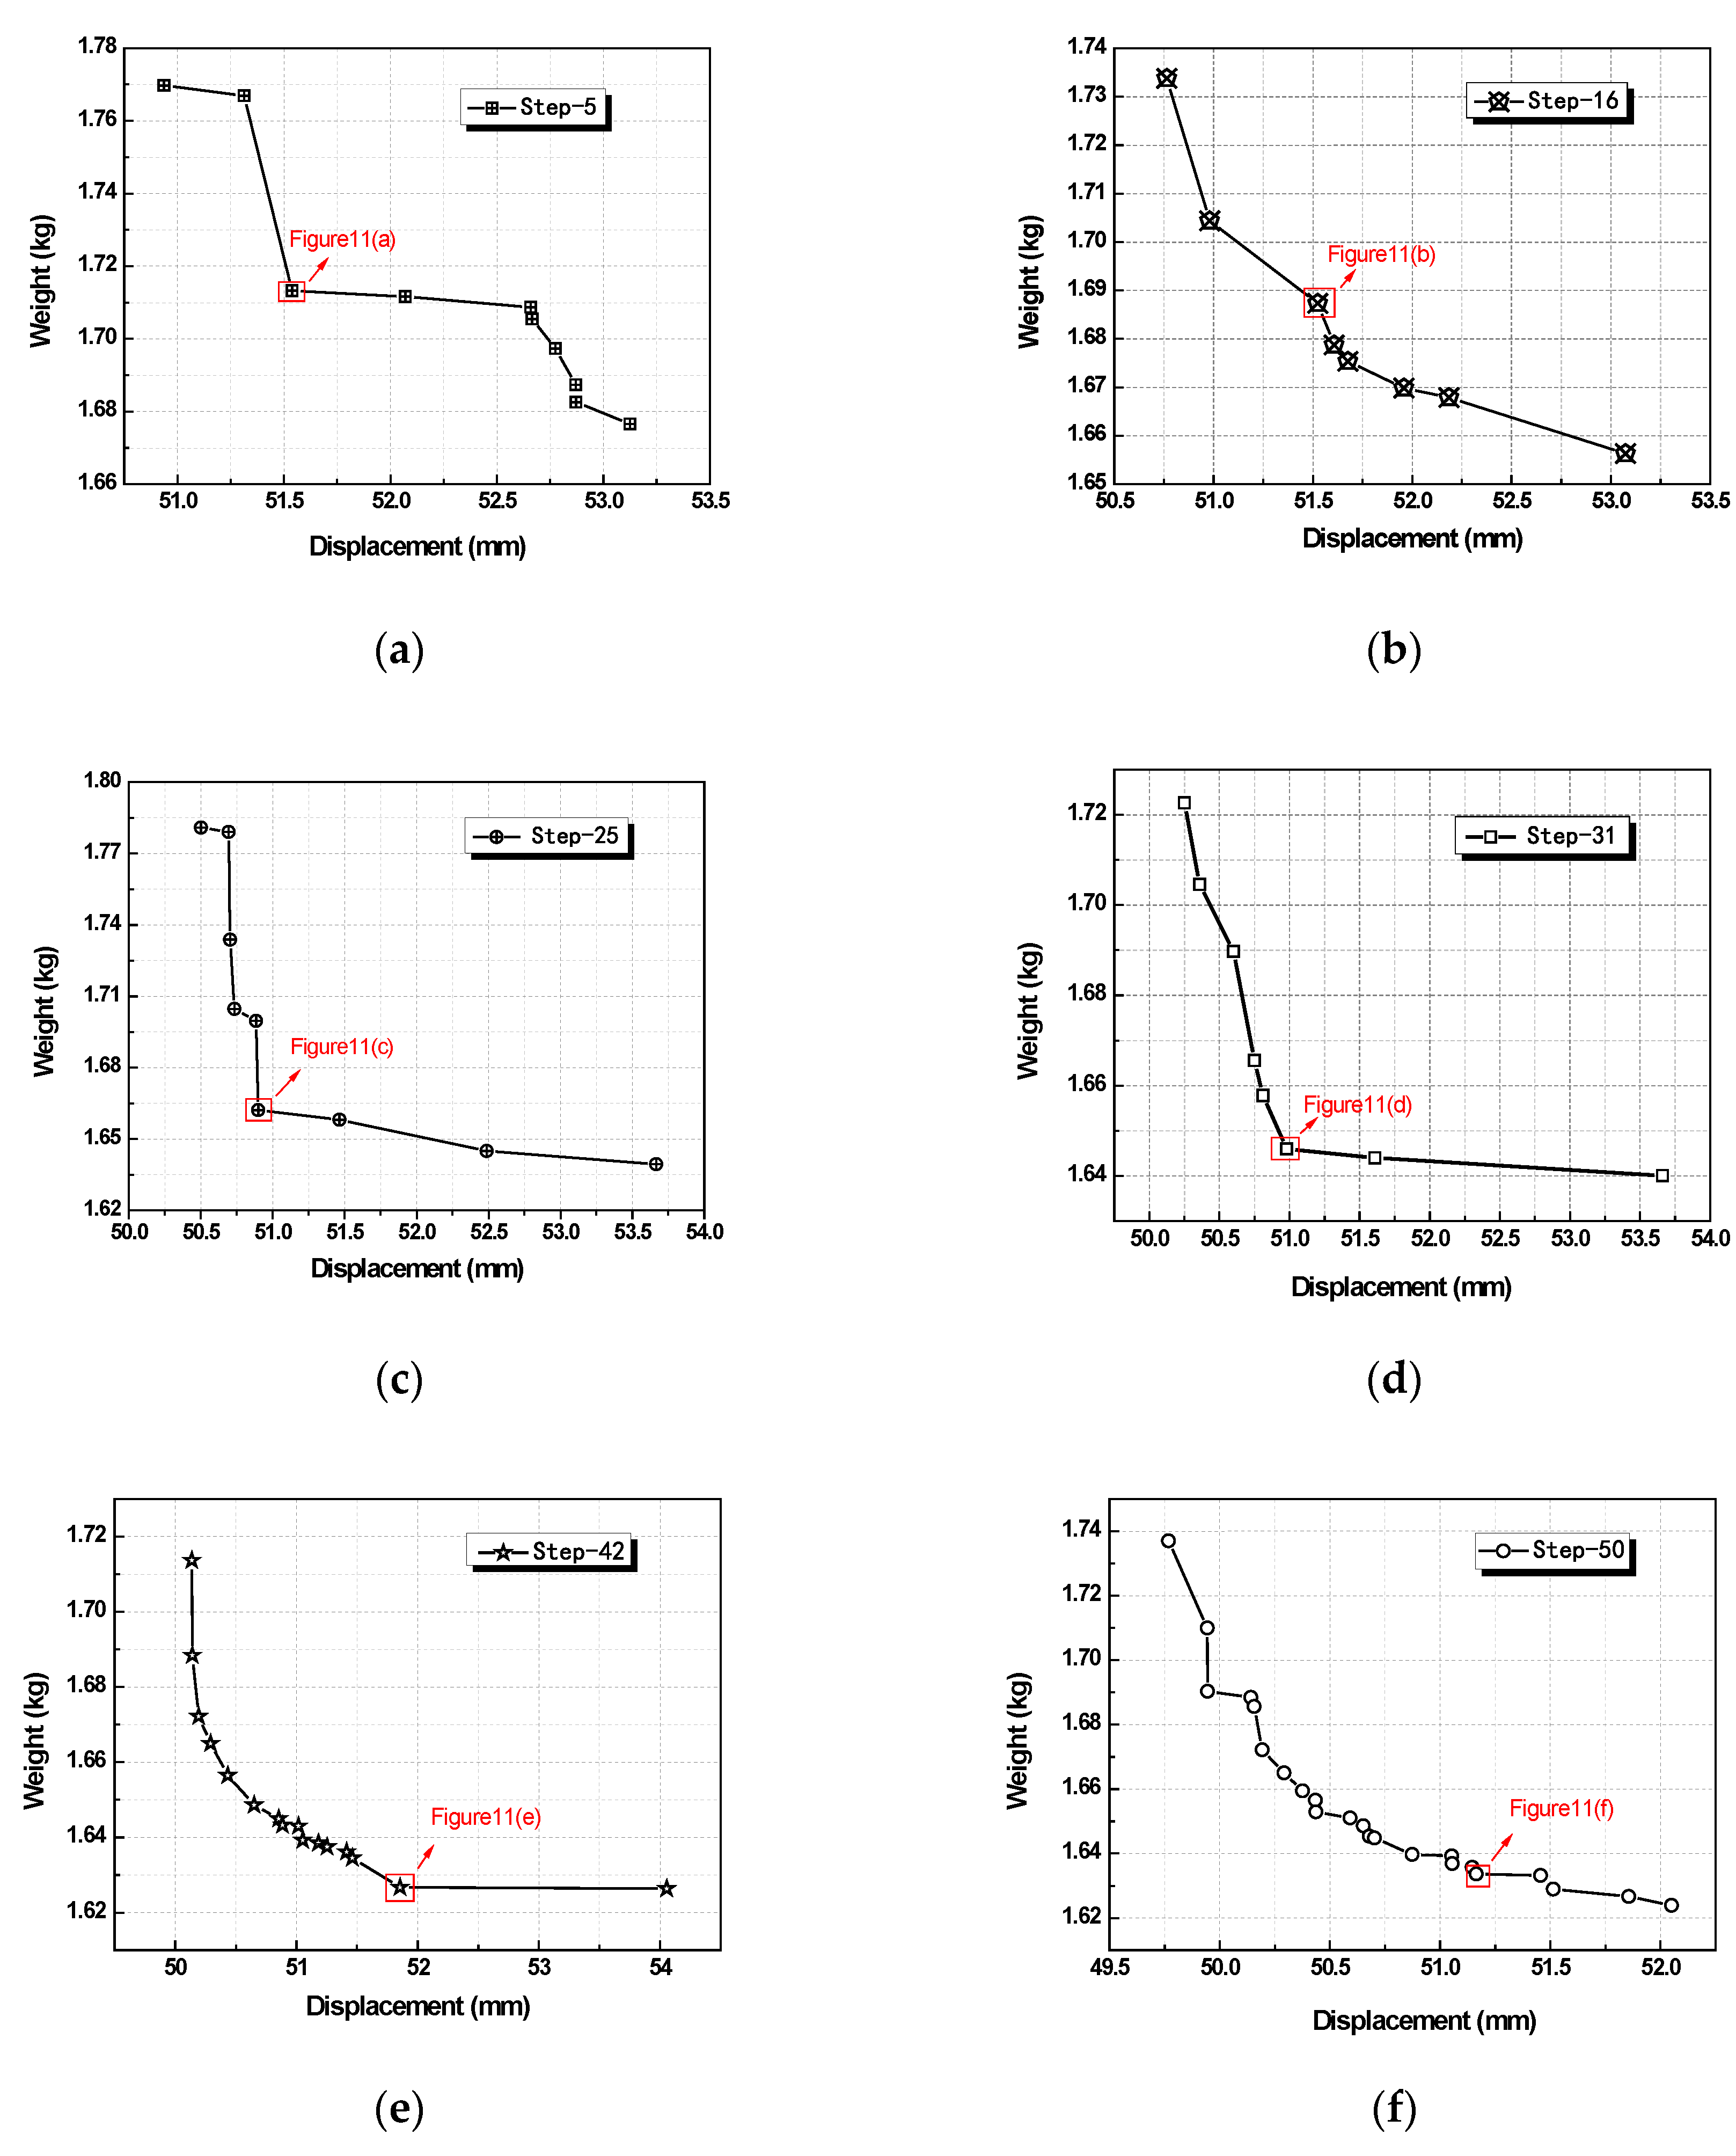
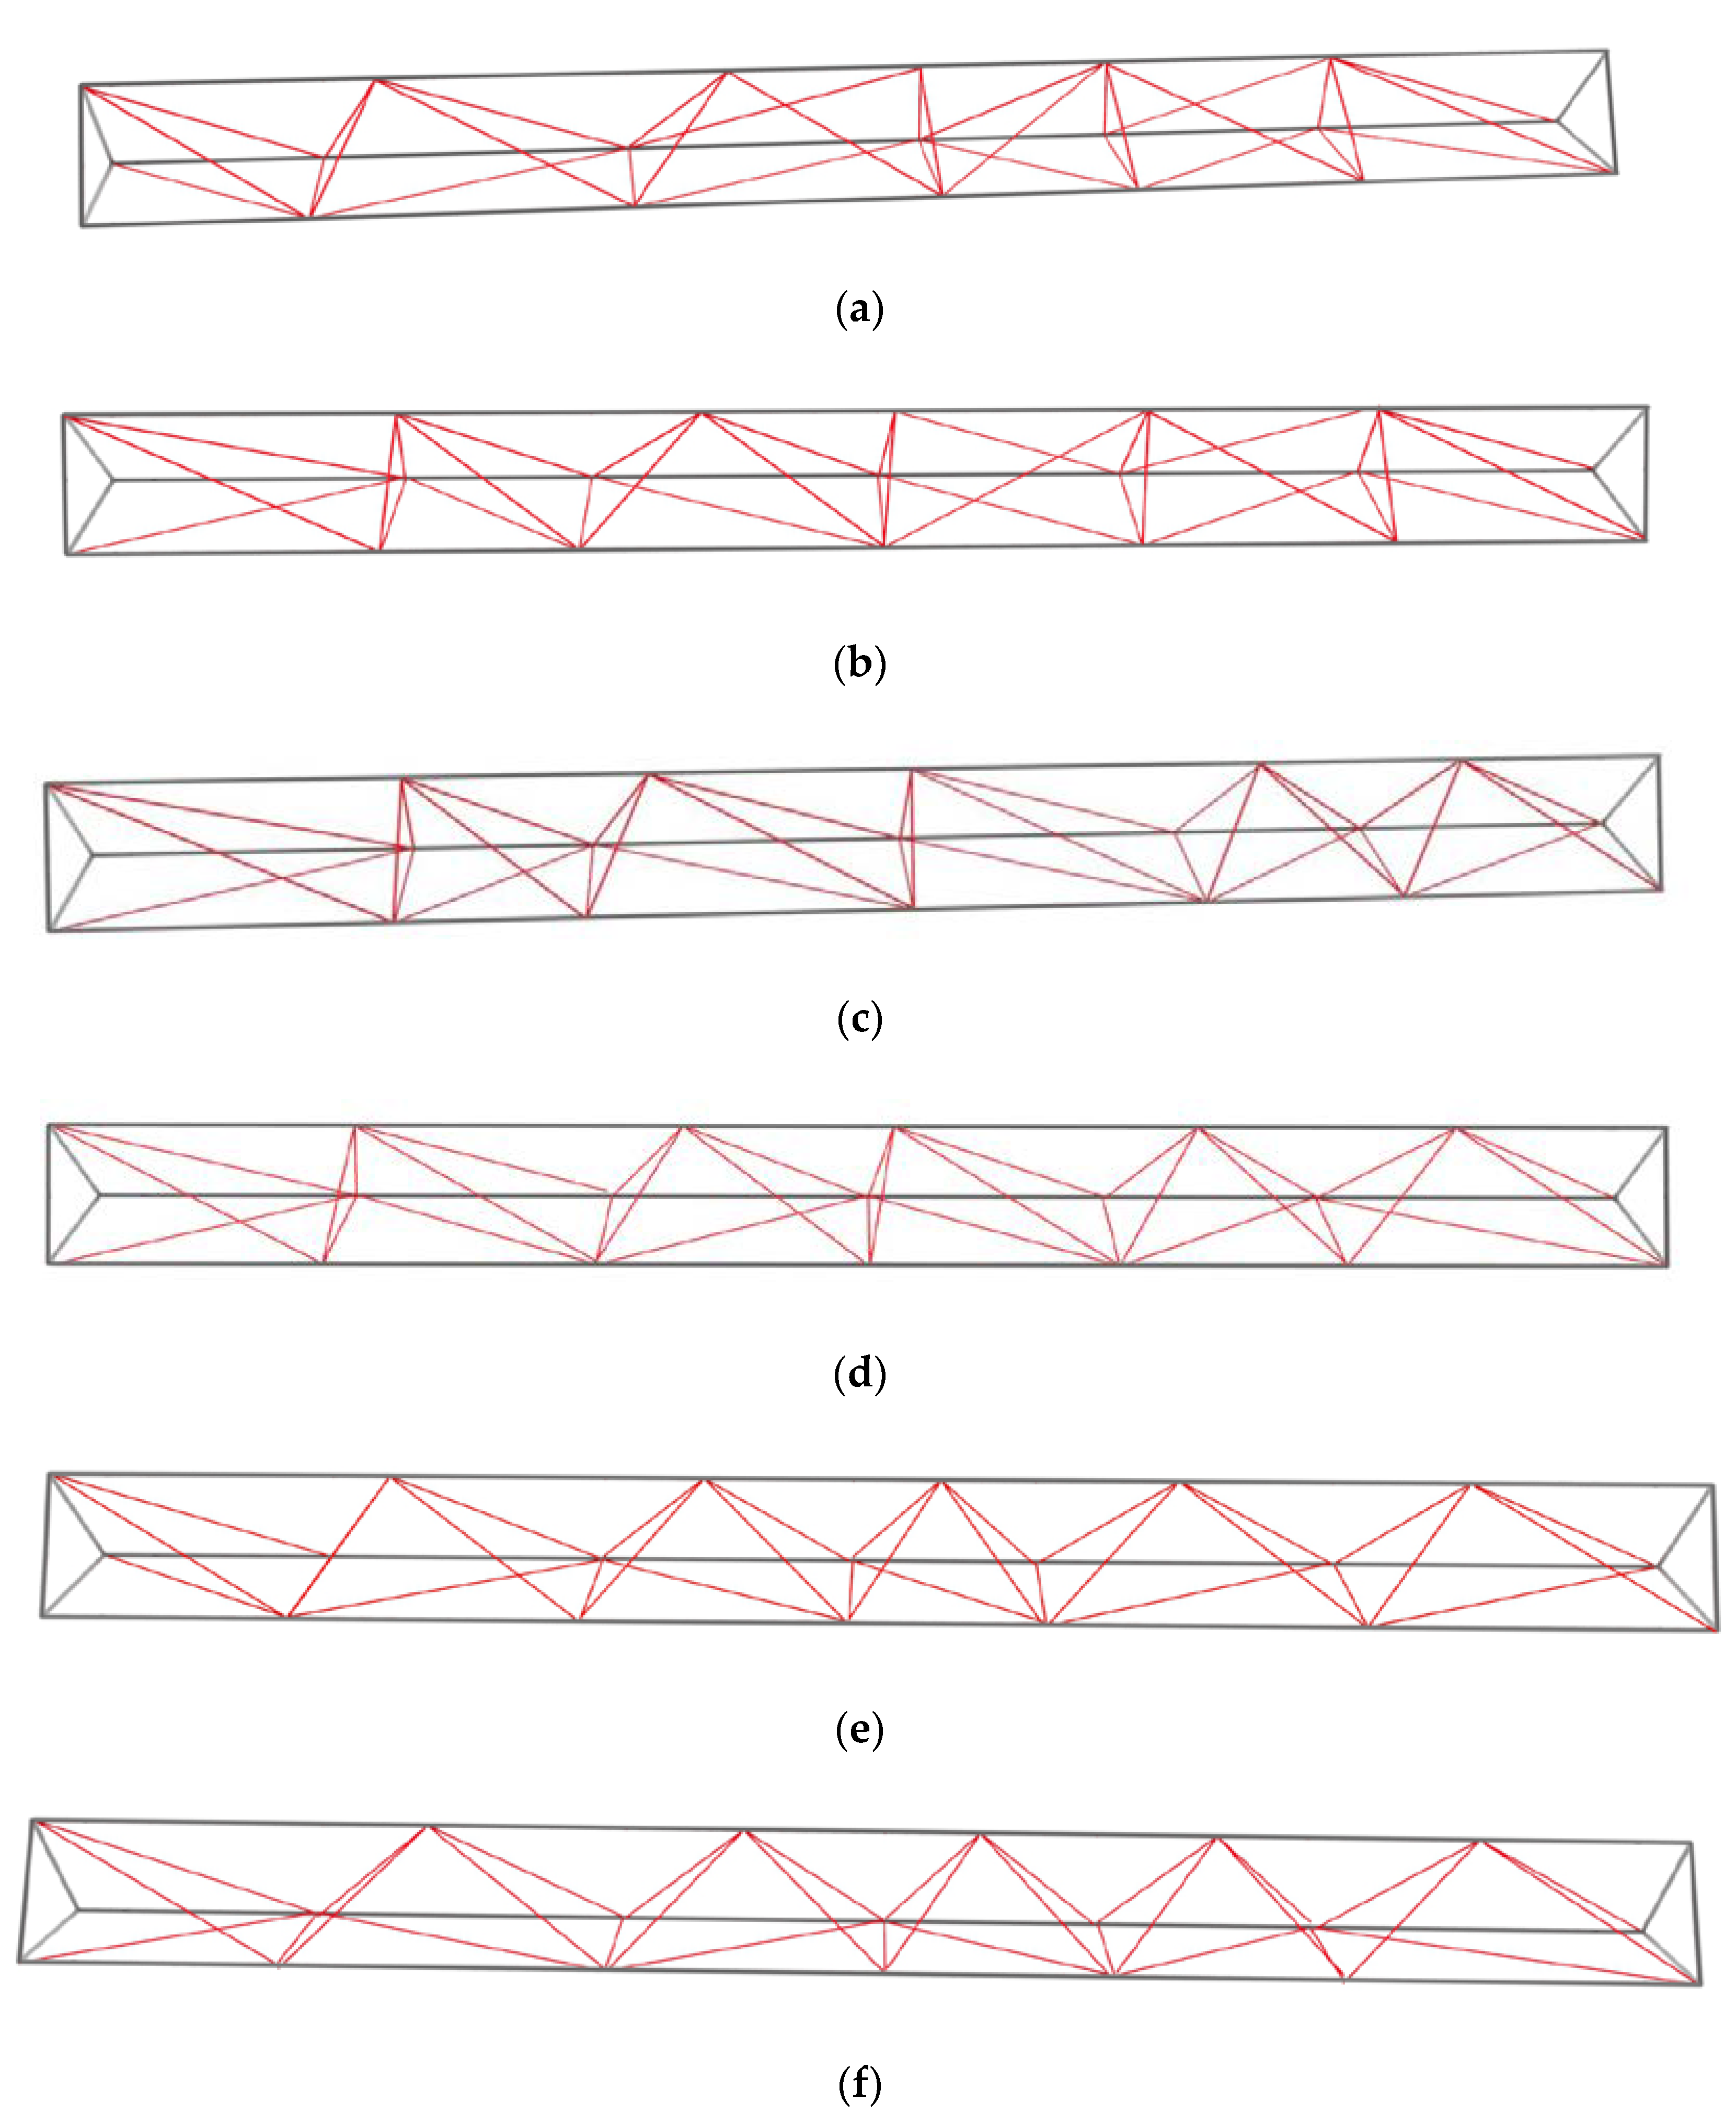
The analytical result involves optimization of the discrete variables in the space truss structures, where the variable is the z direction coordinate of the truss node and its locator variable is eight positions. The individual number of MOEA population is 100; then, the maximum sample size N is set to 30, and the final result is obtained by iterative computations, from the 5th step, 16th step, 25th step, 31st step, 42nd step, and to the 50th step (Figure 8a–f).
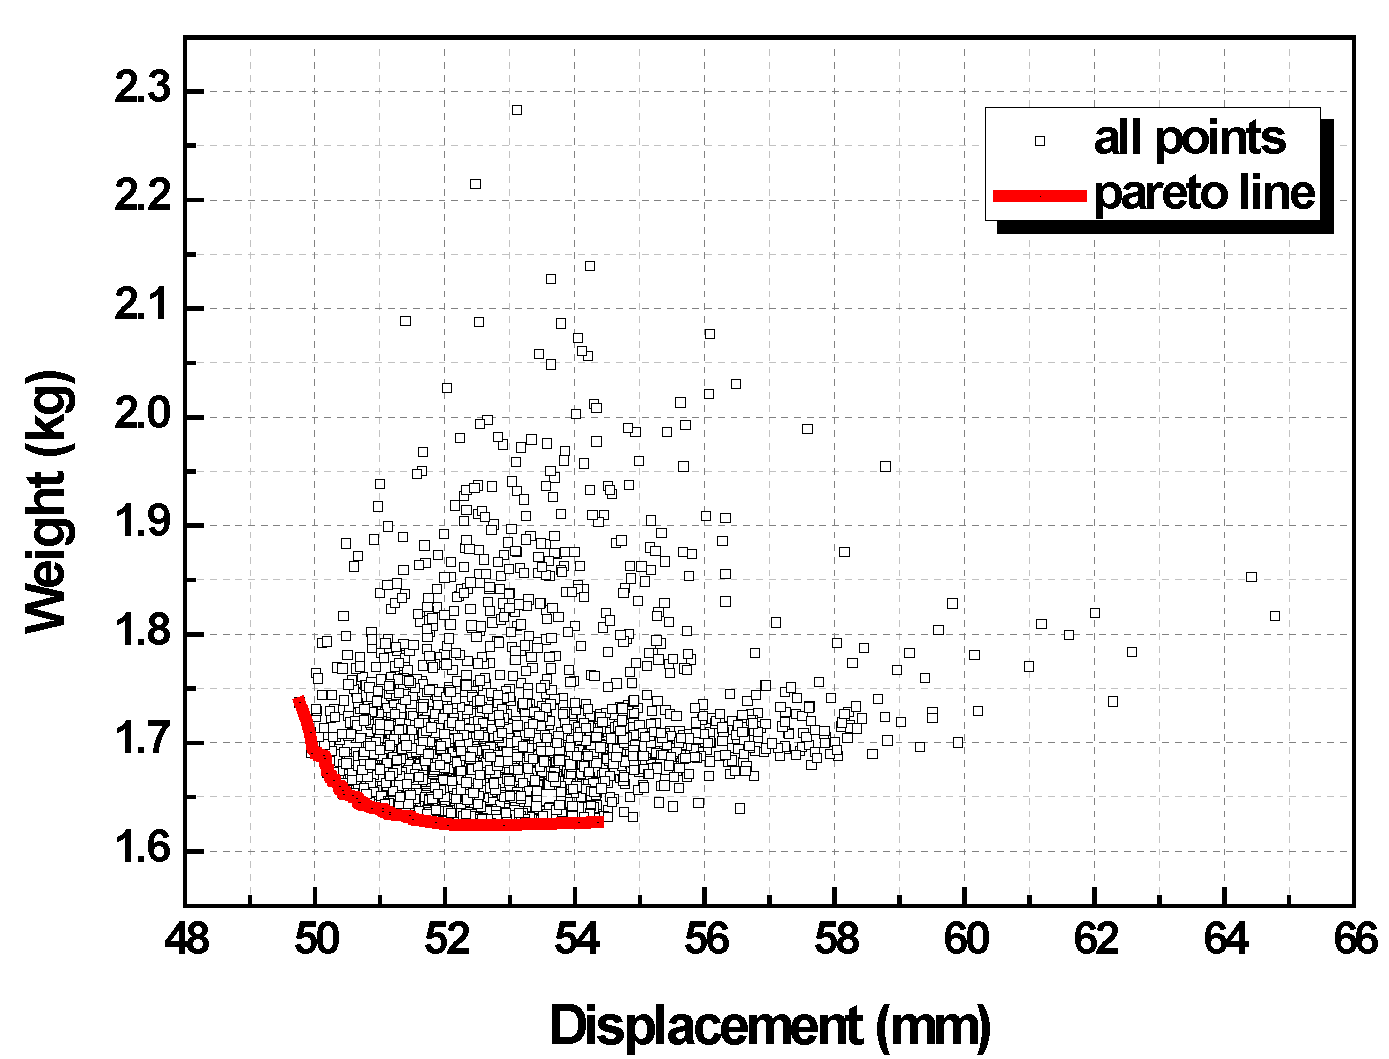
This method has the following characteristics. 1. During the first few steps of evolution, there were relatively few Pareto front points, and there were often obvious inflection points. 2. As the number of iterations increased, the points on the front edge of Pareto became more evenly distributed, and the inflection point positions became more blurred. 3. As the optimization process continued, the Pareto frontier did not stop the forward leading until a satisfying result was obtained (as shown in Figure 9). All data points resulting from this calculation and the total Pareto frontier curve are shown in Figure 10.
The truss shape with typical evolution characteristics is shown in Figure 7, and the result indicates that truss shape appeared disordered and had a poor regularity during the early stage of evaluation. When there were more than 30 steps in the evaluation, four small pyramid structures on the two sides with a vertical web member disappeared from the initial model, while the vertical web member on the surface was maintained. Moreover, the diagonal web member presents a topological configuration from end to end. With an increase in evolution steps, a rectangular pyramid also shows the variation trend of dimensional unification (Figure 11 shows the truss topological graph that corresponds to the optimization procedure in Figure 8).
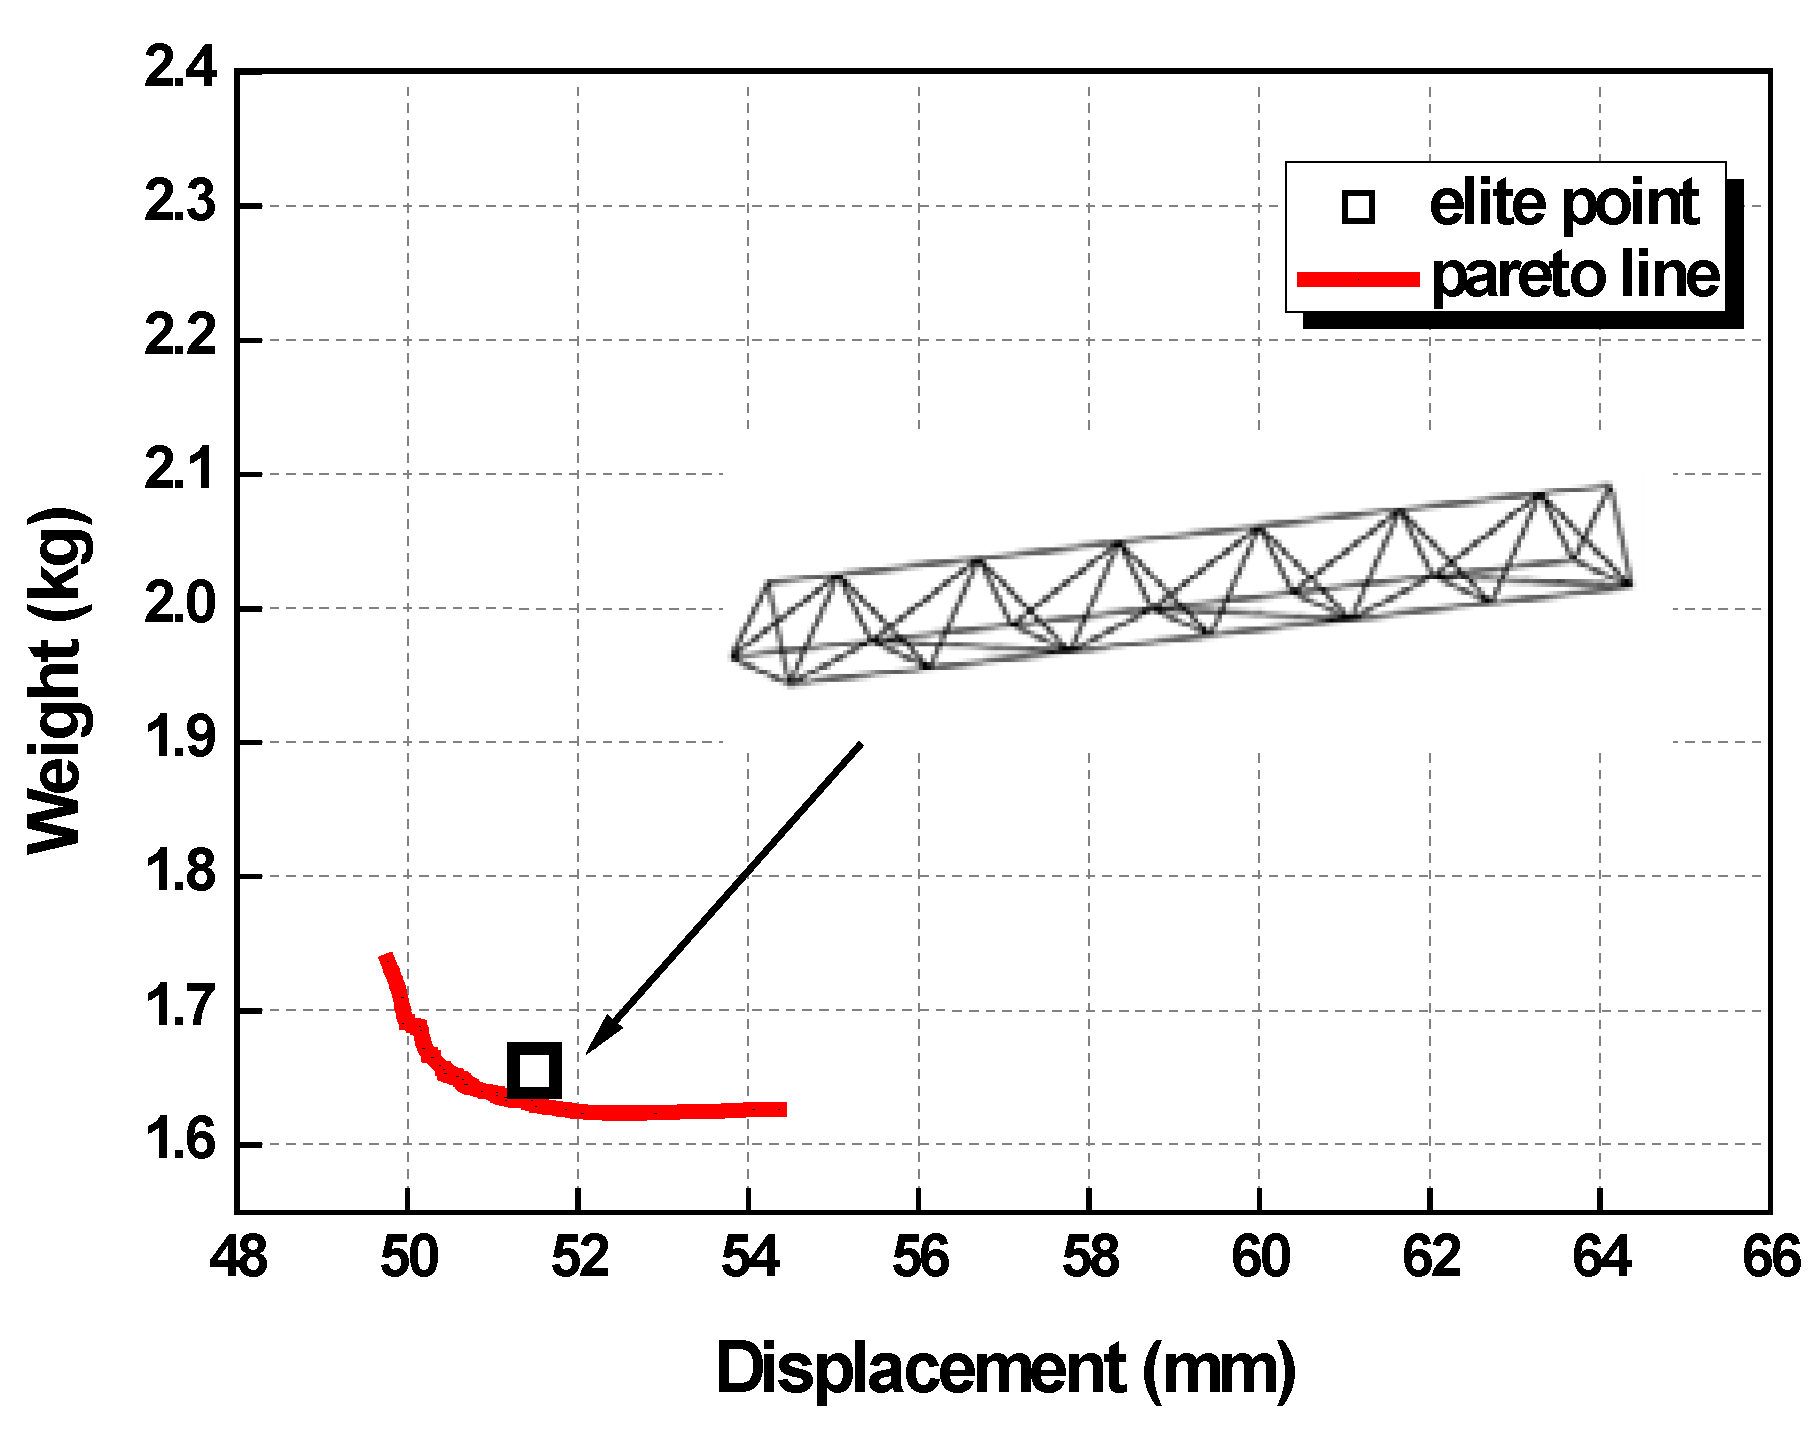
In practical structural design, the chosen modal is not the top result in the optimal computation but a relatively good result according to the particular needs, such as site condition, user demand, economy, beauty, and so on. Based on the rule of truss evolution, the topological form is good, which has a side that is a symmetrical rectangular pyramid, surface as a vertical web member, and diagonal web member from end to end. According to the loading symmetry, practical engineering should choose the truss of the upper chord with more half-sections, as in Figure 12. As a result, this truss has an optimizing index that is closer to the Pareto frontier, which is a reasonable choice.

4.2. Space Tower Optimization

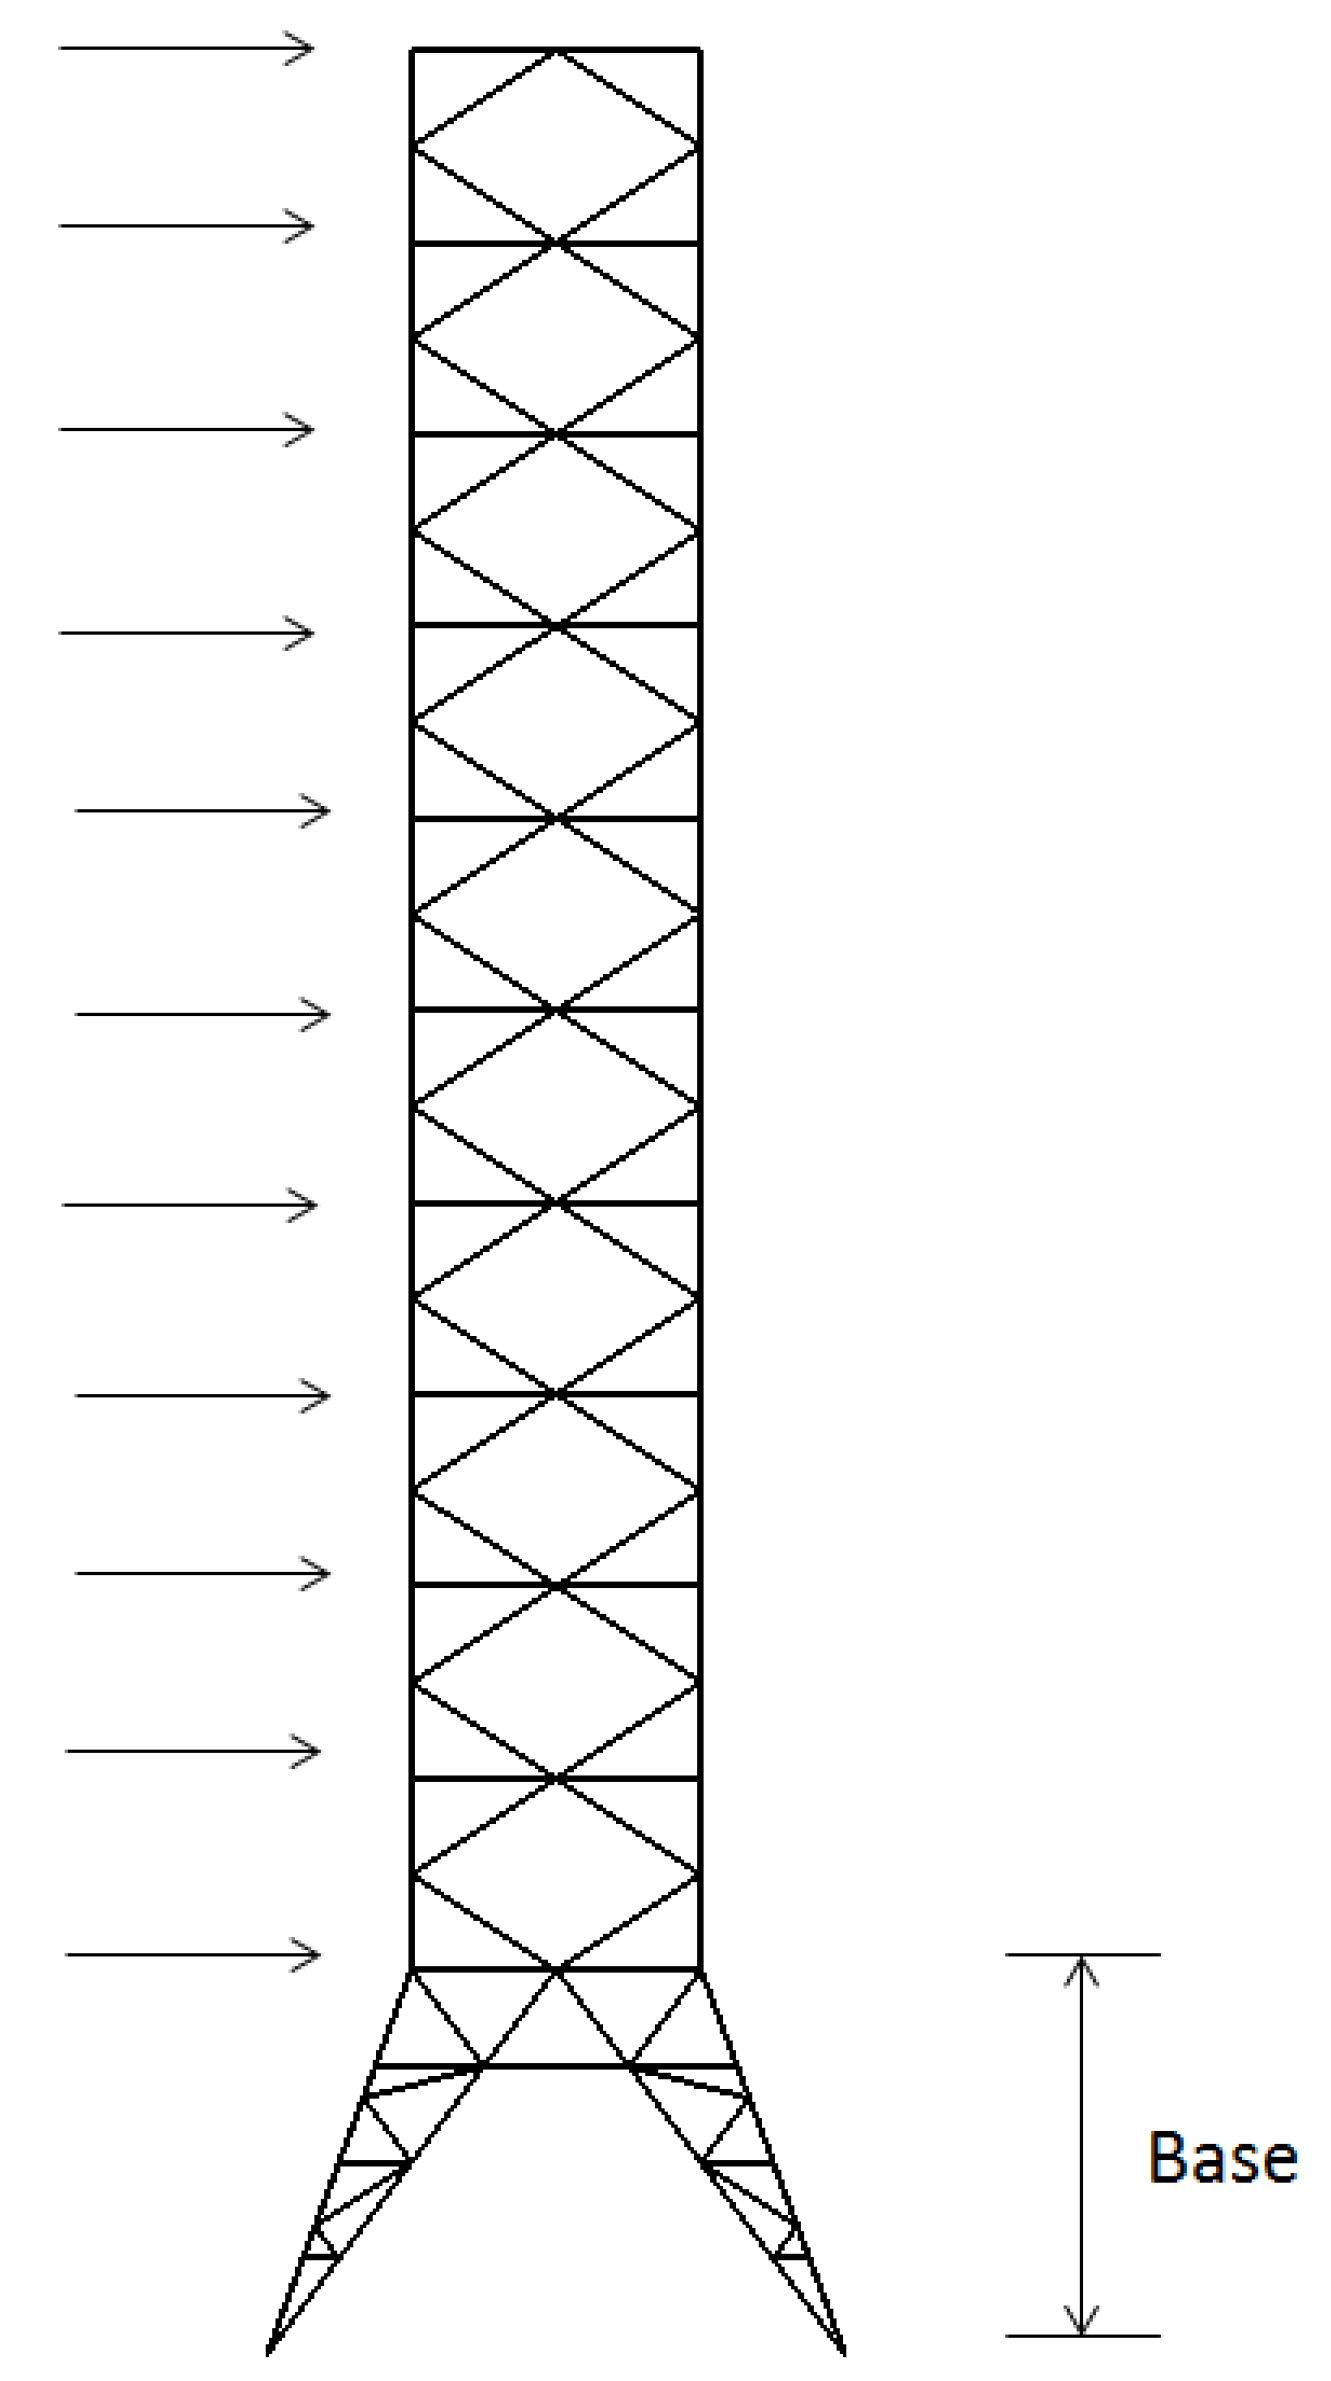
The form for a tower structure is shown in Figure 13, whose internode length of horizontal and vertical lengths are both 3 m. There is a 10 kN horizontal load on left side node (as shown in Figure 14). Under this load, the structure was optimized and analyzed to minimize the total structure weight and the maximum structural displacement. There were three boundary conditions. (a) The four angular points of each part of the tower were defined as the control nodes, which allowed the displacement value to move in the horizontal direction from 0 to 1.5m for intra-movement; moreover, the maximum displacement distance was half the side length. After control nodes were located, other nodes were obtained by interpolating, then connected to the vertical members. (b) The coordinate of the base position did not change.
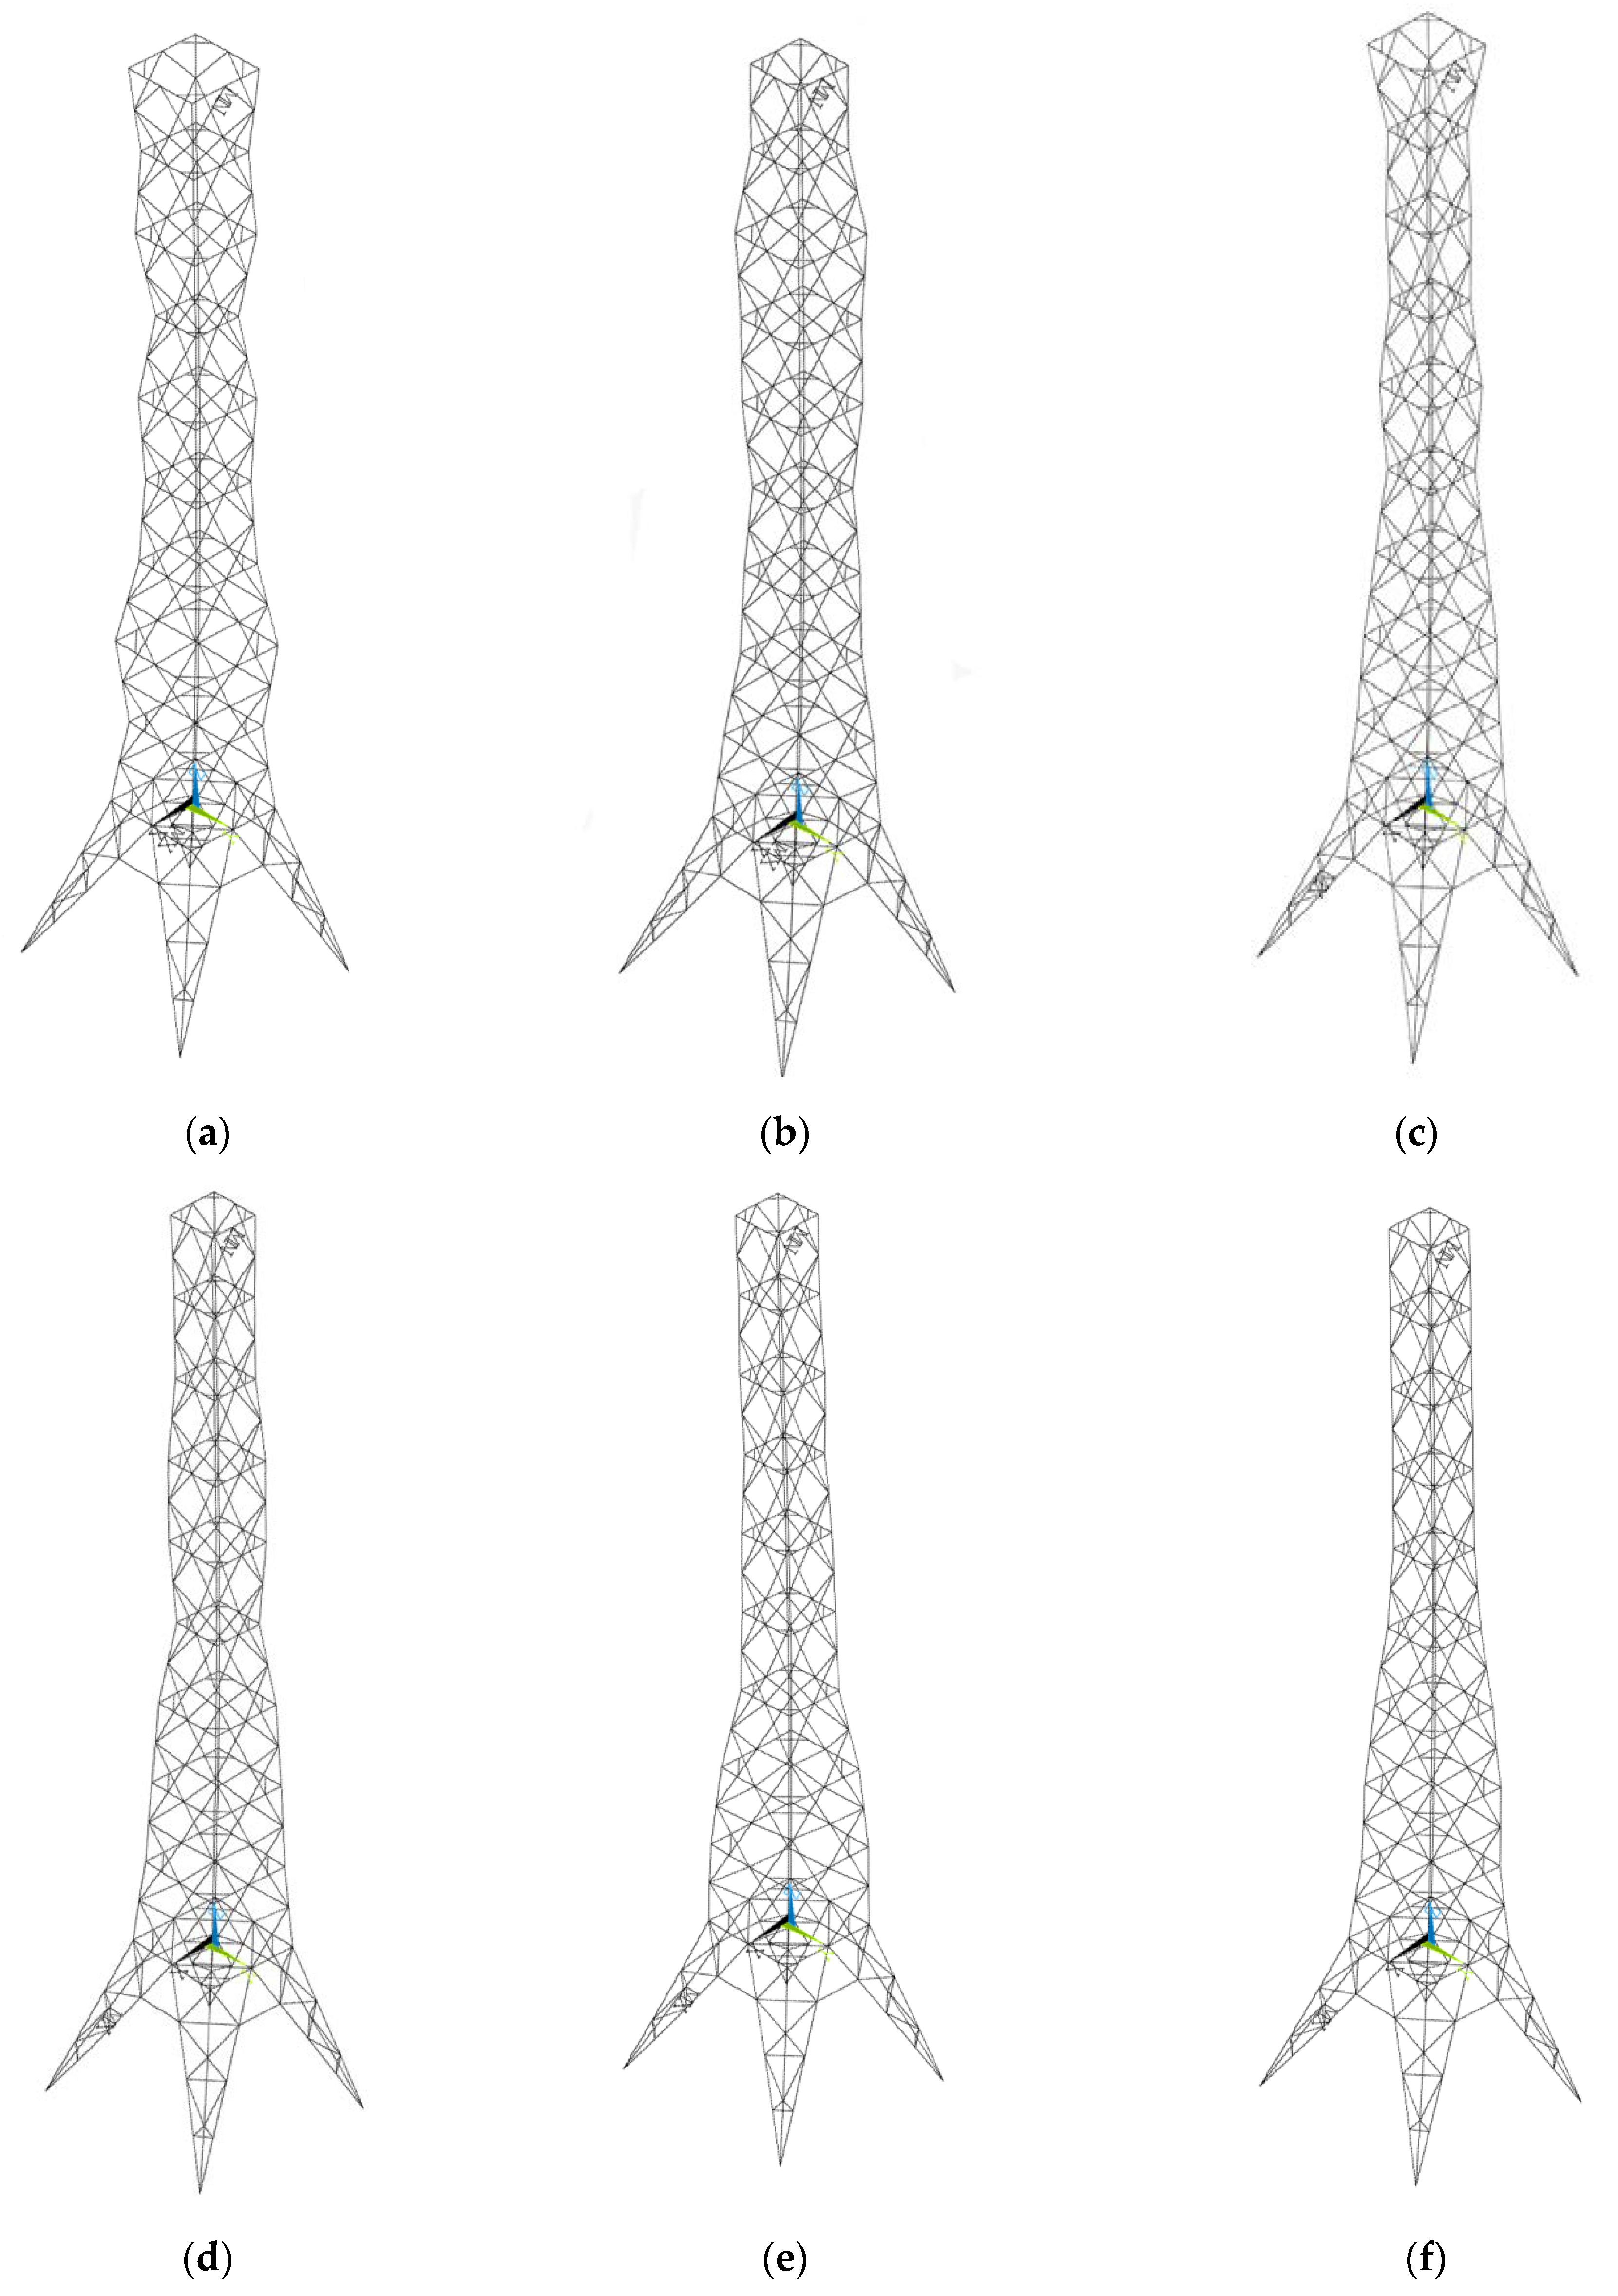
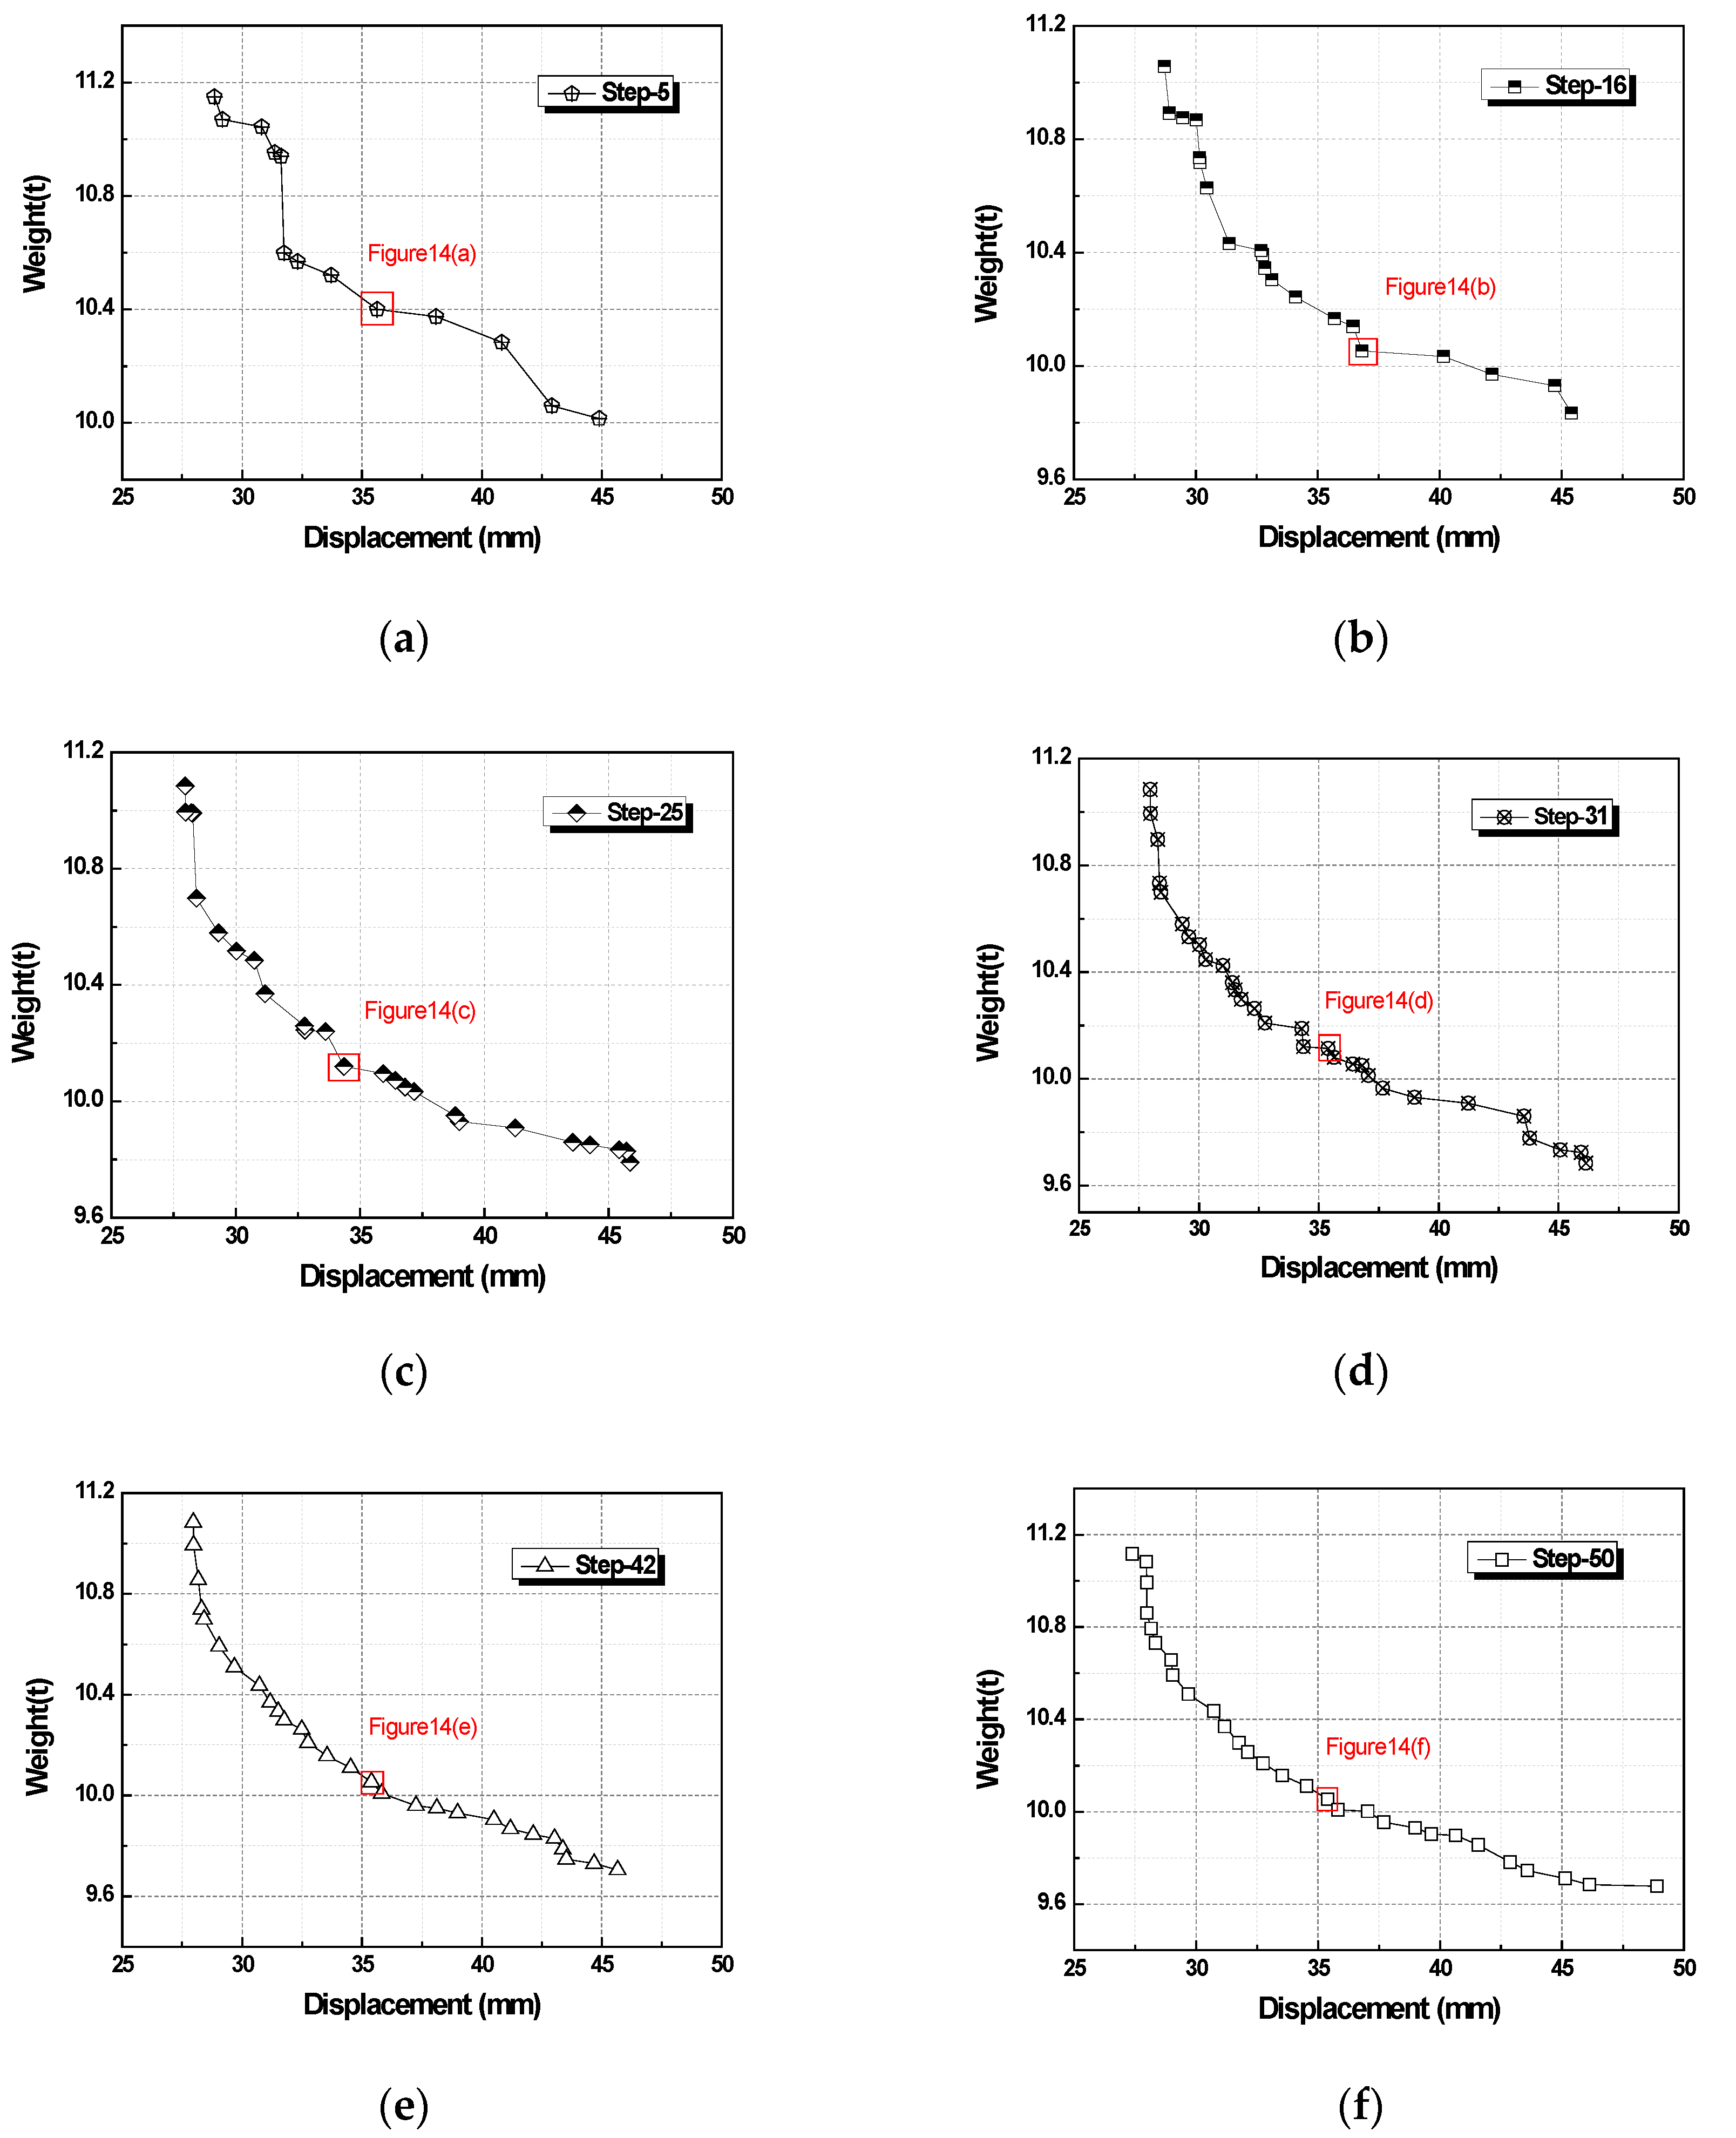
As shown by the continuous evolution diagram of the tower frame, all the nodes were constantly moving during the early stage of the optimization calculation, but the movement was more chaotic (as shown in Figure 15). When optimal computation accessed 30 steps, the nodes close to the base are moved away from the section center, meaning the tower was sturdier. However, the closer the node was to the top, the closer to the section center, meaning the tower was thinner, which is also conformed to the load-bearing characteristics of the cantilever. When the optimal computation achieved 50 steps, the tower weight was 10,000 kg at the maximum displacement of 35 mm, compared with the first generation for the same displacement, which lost a weight of 4%. In addition, the overall configuration showed that the points between the nodes were smoother.
Figure 16 shows the Pareto frontier curve drawn using the optimization step corresponding to Figure 15. With continuous deepening of evolution, the data points became smoother and more uniform, and the optimization effect became more obvious; thus, the method is feasible, and the results are credible.

5. Conclusions

(1)
In this study, an improved MOEA optimization method was adopted to realize optimization of spatial discrete structures using moving bar node coordinates.
(2)
In contrast to the traditional optimization, which uses weight as the only object, the improved MOEA multi-objective optimization method is a combination of the structural weight and the maximum displacement of the spatially discrete structure. This method uses the strength rank idea and obtains a group of optimal solutions, not an individual value. Then, the optimal case can be confirmed according to other constraint conditions, such as the boundary value and the user’s preferences.
(3)
This algorithm was tested using standard mathematical functions, and the results indicate that the rate of convergence is fast and that no inferior solution evenly distributes in the solution space, which maintains good diversity without converging to a local part. Thus, we used the combination of this method with ANSYS to analyze a three-dimensional truss and tower structure, and the results confirmed that the modified MOEA algorithm appears to be feasible and superior with respect to the optimization of the discrete structure design.

Author Contributions

Conceptualization, B.N. and Y.W.; Formal analysis, B.N.; Methodology, B.N. and Y.B.; software, B.N.; Writing—original draft, B.N. and Y.B.; Writing—review & editing, B.N., Y.B. and Y.W.; Funding acquisition, B.N., Y.W. and Y.B. All authors have read and agreed to the published version of the manuscript.

Funding

The work described in this paper was jointly funded by the National Natural Science Foundation of China under Grant No. 51378150 and Liaoning Provincial education department fund No.LSNQN201718, Liaoning provincial science and technology department project No. 20180550496 and Key project of liaoning science and technology department No. 2018103007.

Conflicts of Interest

The authors declare no conflict of interest.

References

  1. Michell, A.G.M. The limits of economy of material in frame structures. Philos. Mag. 1904, 8, 589–597. [Google Scholar] [CrossRef] [Green Version]
  2. Prager, W. A note on discredited michell structures. Comput. Method Appl. Mech. 1974, 3, 349–355. [Google Scholar] [CrossRef]
  3. Dorn, W.S.; Gomory, R.E.; Greenberg, H.J. Automatic design of optimal structures. J. Mech. 1964, 3, 25–52. [Google Scholar]
  4. Sivapuram, R.; Picelli, R. Topology optimization of binary structures using Integer Linear Programming. Finite Elem. Anal. Des. 2018, 139, 49–61. [Google Scholar] [CrossRef]
  5. Tang, Z.F.; Sun, H.C. The modified simplex method for topology optimization of space truss structure with multiple loading conditions. Acta Mech. Sin. PRC 1994, 26, 90–96. [Google Scholar]
  6. Víctor, C.; Juan, L.C.; Abubakr, M.I. Optimization using the gradient and simplex methods. Talanta 2016, 148, 641–648. [Google Scholar]
  7. Sun, R.F.; Mou, Z.G.; Yan, M. Application of genetic algorithms design of truss structures. J. Build. Eng. 2004, 5, 75–79. [Google Scholar]
  8. Ioannis, N.T.; Lassi, L.; Toni, K.; Jarkko, N. Structural optimization employing isogeometric tools in particle swarm optimizer. J. Build. Eng. 2019, 24, 100761. [Google Scholar] [CrossRef]
  9. Ghannad, M.; Rahimi, G.H.; Nejad, M.Z. Elastic analysis of pressurized thick cylindrical shells with variable thickness made of functionally graded materials. Compos. Part B Eng. 2013, 45, 388–396. [Google Scholar] [CrossRef]
  10. Laumanns, M.; Thiele, L.; Deb, K.; Zitzler, E. Combining convergence and diversity in evolutionary multi-objective optimization. Evol. Comput. 2002, 10, 263–282. [Google Scholar] [CrossRef] [PubMed]
  11. Fonseca, C.; Fleming, P.J. Multi-objective optimization and multiple constraints handling with evolutionary algorithms Part 1: A Unified for mutation. IEEE Trans. Syst. Man Cybern. A 1998, 28, 26–37. [Google Scholar] [CrossRef] [Green Version]
  12. Srinivas, N.; Deb, K. Multi-objective optimization using non-dominated sorting in genetic algorithms. Evol. Comput. 1995, 2, 221–248. [Google Scholar] [CrossRef]
  13. San, B.; Waisman, H.; Harari, I. Analytical and Numerical Shape Optimization of a Class of Structures under Mass Constraints and Self-Weight. J. Eng. Mech. ASCE 2010, 146, 04019109. [Google Scholar] [CrossRef]
  14. Luis, M.J.; Alejandro, B.P.; Gutierrez, G.J.; Di, R.A. A selective genetic algorithm for multi objective optimization of cross sections in 3D trussed structures based on a spatial sensitivity analysis. Multidiscip. Model. Mater. Struct. 2016, 12, 423–435. [Google Scholar]
  15. Deb, K. Multi-Objective Optimization Using Evolutionary Algorithms; Wiley: Chichester, UK, 2001. [Google Scholar]
  16. Noilublao, N.; Bureerat, S. Simultaneous topology, shape and sizing optimization of a three-dimensional slender truss tower using multi objective evolutionary algorithms. Comput. Struct. 2011, 89, 2531–2538. [Google Scholar] [CrossRef]
  17. Galante, M. Genetic algorithms as an approach to optimize real-world trusses. Int. J. Numer. Methods Eng. 1996, 39, 361–382. [Google Scholar] [CrossRef]
  18. Kaveh, A.; Zolghadr, A. Democratic PSO for truss layout and size optimization with frequency. Comput. Struct. 2014, 130, 10–21. [Google Scholar] [CrossRef]
  19. Mokarram, V.; Banan, M. A new PSO-based algorithm for multi-objective optimization with continuous and discrete design variables. Struct. Multidiscip. Optim. 2018, 57, 509–533. [Google Scholar] [CrossRef]
  20. Deb, K.; Samir, A.; Amrit, P.; Meyarivan, T. A Fast and Elitist Multi-Objective Genetic Algorithm: NSGA-II. KanGal Report, 2000, 01; Indian Institute of Technology: KanPur, India, 2000; Volume 1. [Google Scholar]
  21. Hirad, A.; Ali, J.; Nader, N. Multi-objective sizing and topology optimization of truss structures using genetic programming based on a new adaptive mutant operator. Neural Comput. Appl. 2019, 31, 5729–5749. [Google Scholar]
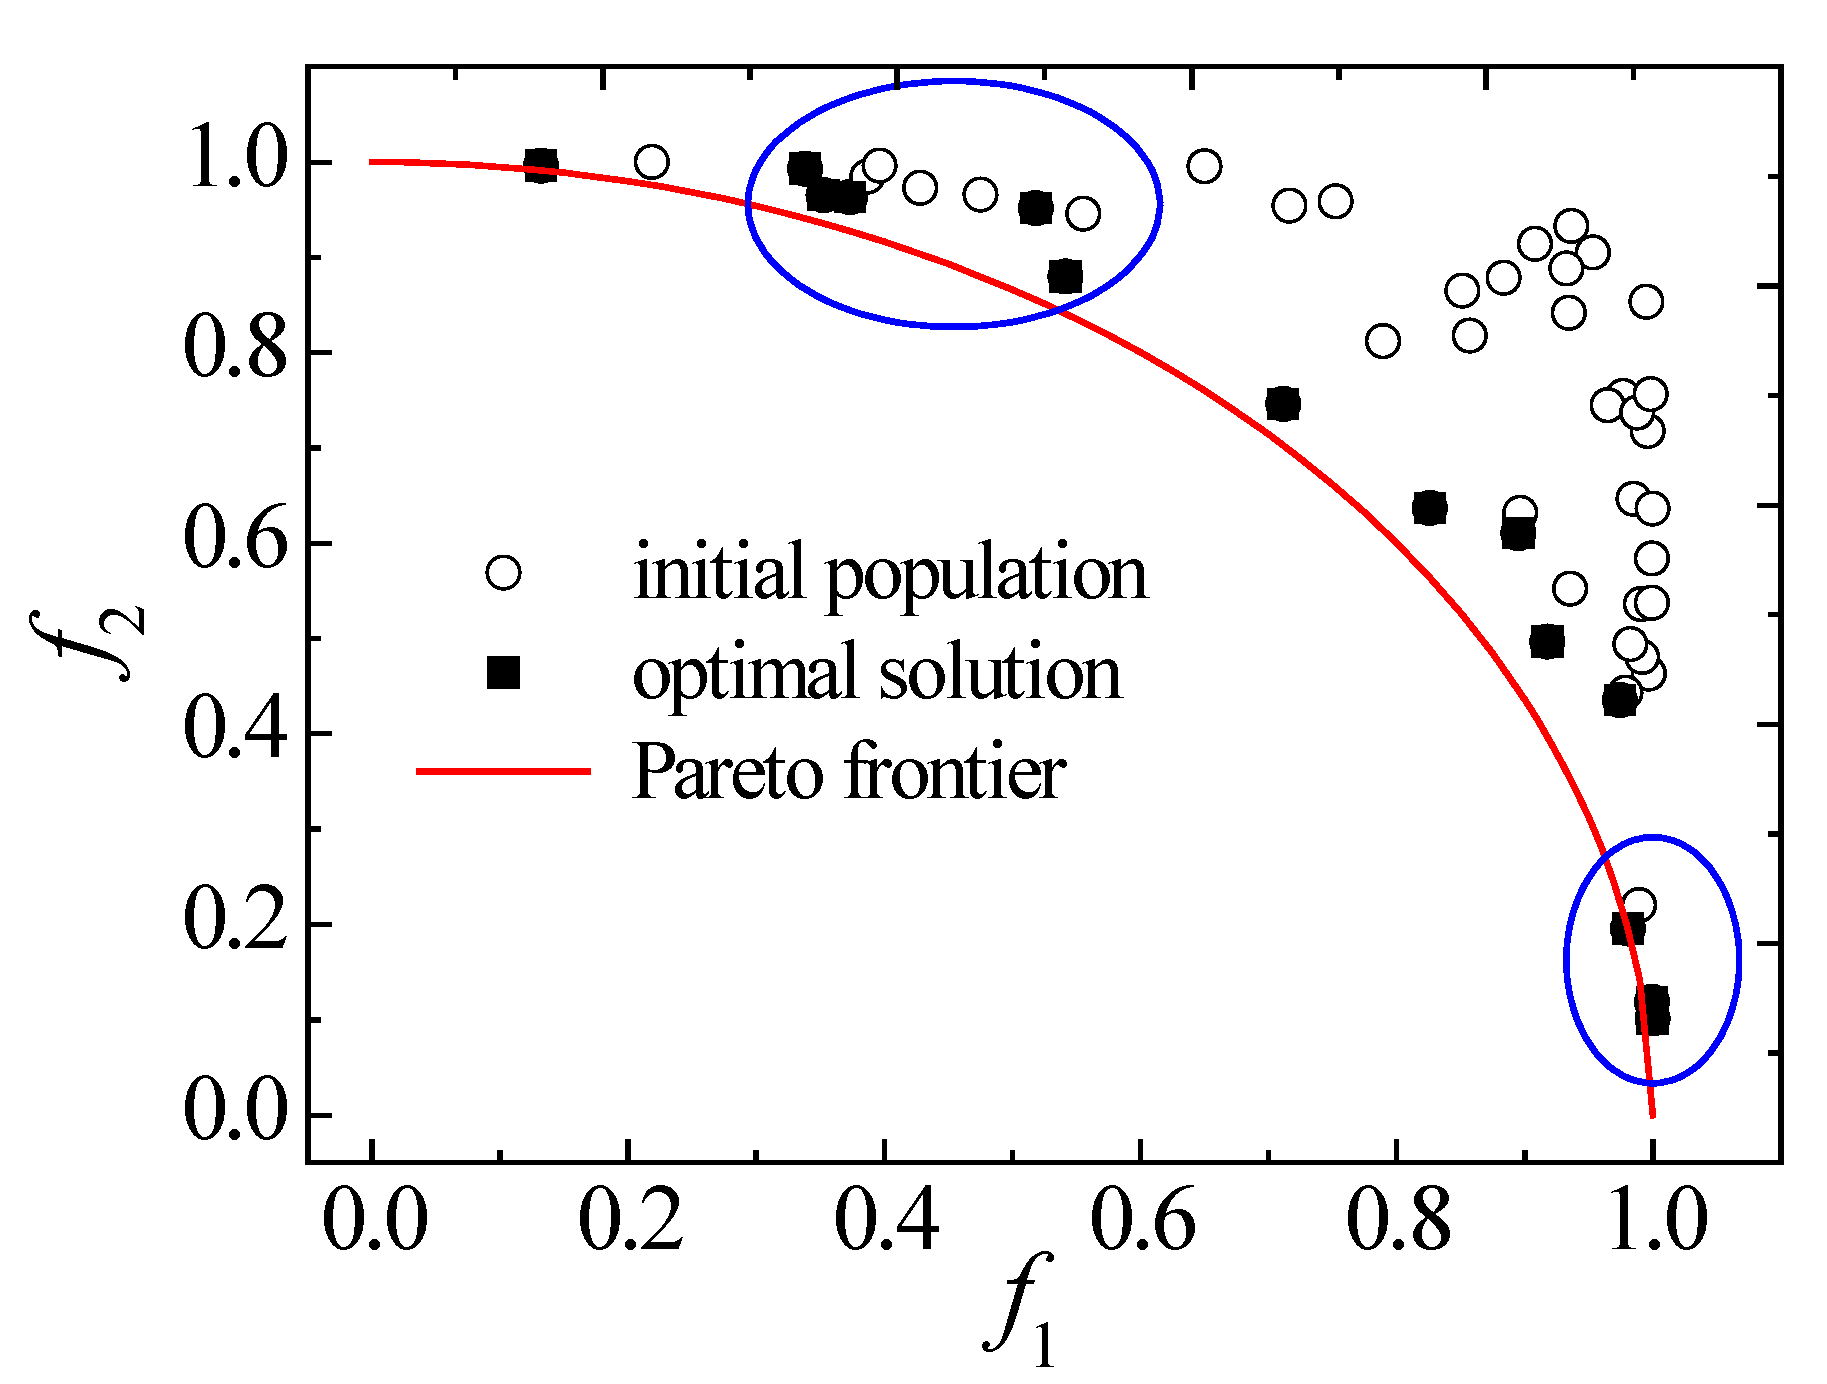
Figure 1. Pareto frontier and optimal solutions.
Applsci 10 01964 g001
Figure 2. Improved multi-objective evolutionary algorithm (MOEA) flow chart.
Applsci 10 01964 g002
Figure 3. Pareto curve of the function test: (a) MOP1 Pareto curve and scatterplots and (b) MOP2 Pareto curve and scatterplots (MOP: Multi-objective Optimization).
Applsci 10 01964 g003
Figure 4. Truss schematic diagram.
Applsci 10 01964 g004
Figure 5. Truss cross section.
Applsci 10 01964 g005
Figure 6. Schematic diagram of moving the node.
Applsci 10 01964 g006
Figure 7. Two types of truss: (a) equal number chord type; (b) unequal type.
Applsci 10 01964 g007
Figure 8. Truss chart of the evolution generation scatterplot: (a) Step-5 evolution Pareto frontier curve; (b) Step-16 evolution Pareto frontier curve; (c) Step-25 evolution Pareto frontier curve; (d) Step-31 evolution Pareto frontier curve; (e) Step-42 evolution Pareto frontier curve; and (f) Step-50 evolution Pareto frontier curve.
Applsci 10 01964 g008
Figure 9. Evolution of Pareto frontier.
Applsci 10 01964 g009
Figure 10. Truss optimization Pareto envelope.
Applsci 10 01964 g010
Figure 11. Shape change diagram of truss: (a) Step-5 shape diagram of the truss; (b) Step-16 shape diagram of the truss; (c) Step-25 shape diagram of the truss; (d) Step-31 shape diagram of the truss; (e) Step-42 shape diagram of the truss; and (f) Step-50 shape diagram of the truss.
Applsci 10 01964 g011
Figure 12. Suggested selection point.
Applsci 10 01964 g012
Figure 13. Initial tower model.
Applsci 10 01964 g013
Figure 14. Wind load effect.
Applsci 10 01964 g014
Figure 15. Tower evolution diagrams: (a) Step-5 evolution diagram; (b) Step-16 evolution diagram; (c) Step-25 evolution diagram; (d) Step-31 evolution diagram; (e) Step-42 evolution diagram; (f) Step-50 evolution diagram.
Applsci 10 01964 g015
Figure 16. Tower chart of evolution generation scatterplot: (a) Step-5 evolution Pareto frontier curve; (b) Step-16 evolution Pareto frontier curve; (c) Step-25 evolution Pareto frontier curve; (d) Step-31 evolution Pareto frontier curve; (e) Step-42 evolution Pareto frontier curve; and (f) Step-50 evolution Pareto frontier curve.
Applsci 10 01964 g016
Table 1. Operating parameters of MOP1.
Population SizeTerminate GenerationCrossover ProbabilityMutation Probability
40300.40.02
Table 2. Operating parameters of MOP2.
Population SizeTerminate GenerationCrossover ProbabilityMutation Probability
50500.40.02