Article

Determination of a Complete Conversion Model for Gasification of Lignite Char

TU Darmstadt, Institute for Energy Systems and Technology, 64287 Darmstadt, Germany
*
Author to whom correspondence should be addressed.
Appl. Sci. 2020, 10(6), 1916; https://doi.org/10.3390/app10061916
Submission received: 14 February 2020 / Revised: 2 March 2020 / Accepted: 6 March 2020 / Published: 11 March 2020

Abstract

:
The conversion of solid fuels via gasification is a viable method to produce valuable fuels and chemicals or electricity while also offering the option of carbon capture. Fluidized bed gasifiers are most suitable for abundantly available low-rank coal. The design of these gasifiers requires well-developed kinetic models of gasification. Numerous studies deal with single aspects of char gasification, like influence of gas compositions or pre-treatment. Nevertheless, no unified theory for the gasification mechanisms exists that is able to explain the reaction rate over the full range of possible temperatures, gas compositions, carbon conversion, etc. This study aims to demonstrate a rigorous methodology to provide a complete char gasification model for all conditions in a fluidized bed gasifier for one specific fuel. The non-isothermal thermogravimetric method was applied to steam and CO2 gasification from 500 °C to 1100 °C. The inhibiting effect of product gases H2 and CO was taken into account. All measurements were evaluated for their accuracy with the Allan variance. Two reaction models (i.e., Arrhenius and Langmuir–Hinshelwood) and four conversion models (i.e., volumetric model, grain model, random pore model and Johnson model) were fitted to the measurement results and assessed depending on their coefficient of determination. The results for the chosen char show that the Langmuir–Hinshelwood reaction model together with the Johnson conversion model is most suitable to describe the char conversion for both steam and CO2 gasification of the tested lignite. The coefficient of determination is 98% and 95%, respectively.

1. Introduction

The electric power sector contributes to about a quarter of the total CO2 emissions worldwide. Therefore, in most mitigation scenarios for climate change the share of low-carbon electricity supply (comprising renewable energy, nuclear and carbon capture and storage) increases from the current share of approximately 30% to more than 80% by 2050 [1].
A power plant based on integrated gasification combined cycle (IGCC) is a very suitable addition to any future power system, because it offers the possibility to capture CO2 in a very efficient pre-combustion process. Furthermore, in a poly-generation configuration, this technology is able to accommodate the intermittent renewable power generation from wind and solar and operate the gasification island at full load by producing synthetic chemical products like hydrogen, SNG, methanol, and Fischer–Tropsch fuels. For high-ash and low-rank coals, fluidized bed gasifiers are especially suitable [2].
The rate of char gasification is the limiting step in gasifiers and most relevant for determining residence times of the particles and size of the reactors. Therefore, an understanding of the mechanics of char gasification for the chosen fuel is essential for the design of gasifiers. Considerable work has been done already in the field of char gasification processes. Irfan et al. [3] did a comprehensive review on CO2 gasification of coal regarding different factors of influence like coal rank, pressure, gas composition, temperature, and mineral matter. In this study, it was concluded that CO2 gasification characteristics are hard to conclude with full authenticity and the researchers observed those differently for a variety of coals. Generally, the same is true for steam gasification [4]. Ye et al [5] investigated the kinetics and reactivity of two South Australian low-rank coals and quantified the reaction rate for steam and CO2 gasification as well as the influence of mineral content and particle size. Nevertheless, the carbon conversion in the presented data never exceeded 70% and the inhibiting effect of the products has not been included in the model. Another study by Huang et al. [6] focused on the influence of H2 and CO at different temperatures, but only worked with the reaction rate at 50% carbon conversion and omitted a comparison of different conversion models. Fermoso et al. [7] used non-isothermal experiments to determine a suitable conversion model and made statements on the errors of the models but again omitted any inhibiting influence of product gases. Everson et al. [8] assessed the gasification kinetics with steam and CO2 including the influence of the product gases of an inertinite-rich coal with isothermal measurements in a temperature range of 150 K. They used data for almost the complete carbon conversion and validated their assumed kinetic and conversion model with the measurement results but neglected to test other possible models.
It can be stated that most existing work focuses on analysis of single aspects of the gasification, and is not suitable to describe the conversion process in a gasifier completely with its changing gas compositions, temperatures, and particles of varying carbon conversion. For correct prediction of the gasifier behavior with Computational Fluid Dynamic (CFD), a sound modelling of the reaction properties of the fuel is imperative. Therefore, this work aims at demonstrating a methodology to find a complete model for the char conversion during gasification of one specific lignite char that takes into account all relevant temperatures and gas compositions for the full range of char conversion.

2. Theory

2.1. Kinetic Models

Generally, external mass transport from the gas phase to the outer particle surface, the intra-particle diffusion and/or the chemical reaction at the char surface determine the rate of char–gas reactions, depending on temperature and particle properties. For temperatures below 1000 °C and particles in the order of magnitude of 0.1 mm, the reaction rate is controlled by the chemical reaction [9].
Equation (1) is a general expression for the chemical reaction rate, given by Lu et al. [10].
d X d t = k ( T , p ¯ g )   f ( X )
Here, k is the apparent reaction rate depending on temperature T and the partial pressures, of the gasifying agents and gas phase products, described by the vector p ¯ g , according to a reaction model. f ( X ) describes the change in physical or chemical properties of the char with ongoing char conversion, X , according to a conversion model.
A simple representation of the apparent reaction rate during gasification is the Arrhenius reaction model, which only considers the partial pressure p g of the gasifying agent and the temperature.
k A r r ( T , p g ) = p g   k 0   e E a R   T
The kinetic parameters for this model are the pre-exponential factor k 0 and the activation energy E a . The inhibitive influence of the product, which has been observed in several studies [11,12], is considered when applying the Langmuir–Hinshelwood reaction model (L–H model) to the gasification mechanism [13]. Here, the rate-determining step is the formation of occupied sites on the carbon surface. Equations (3) and (4) apply to the CO2 and H2O gasification respectively.
k L H , C O 2 ( T , p ¯ g ) = p C O 2   k 1   e E a , 1 R   T 1 + p C O   k 2   e E a , 2 R   T + p C O 2   k 3   e E a , 3 R   T
k L H , H 2 O ( T , p ¯ g ) = p H 2 O   k 1   e E a , 1 R   T 1 + p H 2   k 2   e E a , 2 R   T + p H 2 O   k 3   e E a , 3 R   T
Here, the kinetic parameters are the three pre-exponential factors k 1 , k 2 and k 3 and the three activation energies E a , 1 , E a , 2 and E a , 3 . They have to be determined separately for steam and CO2 gasification.
In this work, four conversion models for the change in char properties with progressing char conversion are investigated with respect to their applicability for the fuel sample: the volumetric model (VM), the grain model (GM), the random pore model (RPM), which are the most common models used in gasification kinetics [14], and the Johnson model (JM). According to Equation (5), the VM assumes a decreasing reaction surface proportional to the remaining volume or mass of the particle.
d X d t = k ( T , p ¯ g )   ( 1 X )
In Equation (6), the GM or shrinking core model considers the particles as an assembly of nonporous spheres with constant density and decreasing diameter [15]. The reaction only takes place at the surface.
d X d t = k ( T , p ¯ g )   ( 1 X ) 2 3
The RPM was proposed as an semi-empirical model by Bhatia and Perlmutter [16]. It considers arbitrary pore size distributions in the reacting solid and is able to predict a first increasing and then decreasing reaction rate due to the growth and later the coalescence of pores. In the according equation, Equation (7), ψ is a parameter related to the pore structure of the unreacted sample.
d X d t = k ( T , p ¯ g )   ( 1 X )   ( 1 ψ ln ( 1 X ) ) 0.5
The JM is another semi-empirical approach by Johnson [17].
d X d t = k ( T , p ¯ g )   ( 1 X ) 2 3   e α X 2
In Equation (8), the term ( 1 X ) 2 3 is proportional to the effective surface area, as in the shrinking core model, and the term e α X 2 represents the relative reactivity of the effective surface area, which decreases with increasing conversion levels.

2.2. Mass Influence

It is commonly known that diffusional effects play a major role, when kinetic studies are performed in thermoscopes. Ollero et al. [18] have shown that the kinetic results of thermo-gravimetric analyzer (TGA) measurements depend on the geometry and the mass of the sample because of the influence on the local partial pressure distribution within the sample. On the other hand, they also showed that the assumption of a constant temperature throughout the sample is applicable without any significant influence on the results. Therefore, the diffusional effect should be incorporated into the kinetic model by only correcting the frequency factor of the reaction. In this work, the mass influence is considered through a correction factor g ( m 0 ) , with m 0 as the sample mass. The general rate equation, Equation (1), extends to following form to model the reaction rate in the experiment.
( d X d t ) e x p = d X d t   g ( m 0 )

3. Experimental

3.1. Fuel Sample and Char Preparation

The raw material used in this work is abundantly available lignite from the Rhenish area, which was pre-processed and pre-dried for the use in a 2300 MWth lignite power plant. The pre-drying was performed via a fluidized bed with internal waste heat utilization [19]. The ultimate and proximate analysis of the fuel sample is shown in Table 1. The mean Sauter diameter of the sample is about 140 µm.
The chars for the TGA experiments were prepared by devolatilizing the raw fuels in a muffle furnace at 900 °C for 7 min according to DIN 51720 or ISO 562:2010, respectively. Generally, the kinetics of the gasification strongly depend on the duration of the pyrolysis and the temperature gradient used during the heat up [20]. Devolatilizing the samples according to DIN 51720 leads to significantly higher heating rates than any possible pyrolysis in the TGA, but still is slower than heating rates one can expect in a fluidized bed gasifier.

3.2. Experimental Setup

The gasification tests were conducted in a TGA (Netzsch STA 449 F3 Jupiter) at atmospheric pressure, which allows the injection of two dry reaction gases and is fitted with a steam generator. The flow rate of gases is controlled with mass flow controllers (MFCs).
The crucibles used were plate-shaped and had a diameter of 17 mm. On these plates, 10 ± 2 mg of the fuel samples was evenly distributed for ideal gas exchange. The temperature of the sample was monitored with a thermocouple in the sample carrier. The systematic error of the mass measurement was mitigated by a correction run for every gas composition with an empty crucible. The correction measurement was then subtracted from the actual measurement.
In the first step, prior to the actual gasification tests, the samples were heated in the TGA to approximately 1100 °C with 20 K/min in a nitrogen atmosphere to ensure a complete drying and devolatilization of the samples. Then, the samples were cooled down to 500 °C and stabilized at this temperature for 30 min. During this time period, the reactive purge gases were injected into the oven to ensure enough time for gas mixing and gas distribution with the oven. Then, the experiments were performed under non-isothermal conditions with a heating rate of 20 K/min up to a temperature of 1100 °C. Finally, this temperature was held constant for 20 min for a complete reaction of the carbon.
The experiments were conducted for CO2 gasification as well as steam gasification. For both sets of experiments, the gasifying agent was introduced into the oven with 20%, 25%, 33% and 50% of the gas flow. For each gas concentration, a configuration with and without gasifying product, H2 or CO respectively, was tested. In total, 16 different atmospheres were used for the CO2 and steam gasification. Table 2 and Table 3 display the matrix of the experiment configurations. For each of the configurations, three separate experiments were performed to test the reproducibility of the results.
In order to define the type of function for the mass influence g ( m 0 ) , an additional set of experiments was performed for a constant gas composition but varying sample masses. The experiments are listed in Table 4.

3.3. Data Preparation and Evaluation

For each measurement, weight and temperature were recorded with a sampling rate of 300 Hz. The char conversion is calculated depending on starting and final mass for every measurement according to Equation (10).
X ( m ) = m 0 m m 0 m a s h
The char conversion during the experiment is represented over temperature and time, as well as dX/dt over temperature. To reduce the measurement noise, the signal is smoothed with a first order Savitzky–Golay-Filter [21]. The integration time for the Savitzky–Golay-Filter was obtained based on the method described by Werle et al. [22] through minimizing the Allan variance for each measurement. The standard deviation for the char reaction rate after filtering is in the range of 3.6 × 10⁻³ min−1 and 15.6 × 10⁻³ min−1 with the mean at 8.5 × 10⁻³ min−1.
The models investigated in this paper were fitted to the measurement with the nonlinear least-squares method and the parameters of the models were calculated by minimizing the objective function OF, Equation (11).
O F = i = 1 n ( ( d X d t ) e x p , i ( d X d t ) c a l c , i ) 2

4. Results and Discussion

4.1. Mass Influence

To gain an understanding of the effect of varying masses in the TGA as explained in Section 2.2, the experiments listed in Table 4 were evaluated using the Arrhenius equation together with all four kinetic models (VM, GM, RPM, and JM). In Figure 1, the frequency factor is plotted over the sample mass for each conversion model. A correction term of an exponential type fits the results for every conversion model to a satisfactory degree ( R 2 95 % ), with b as the model parameter.
g ( m 0 ) = e b   m 0
With the addition of this correction term, a determination of the intrinsic gasification rate is possible. Therefore, all further experiments were evaluated with the following rate equation, Equation (13), and the value for b is obtained by optimization with Equation (11).
( d X d t ) e x p = k ( T , p ¯ g )   f ( X )   e b   m 0

4.2. Confirmation of Reaction Model

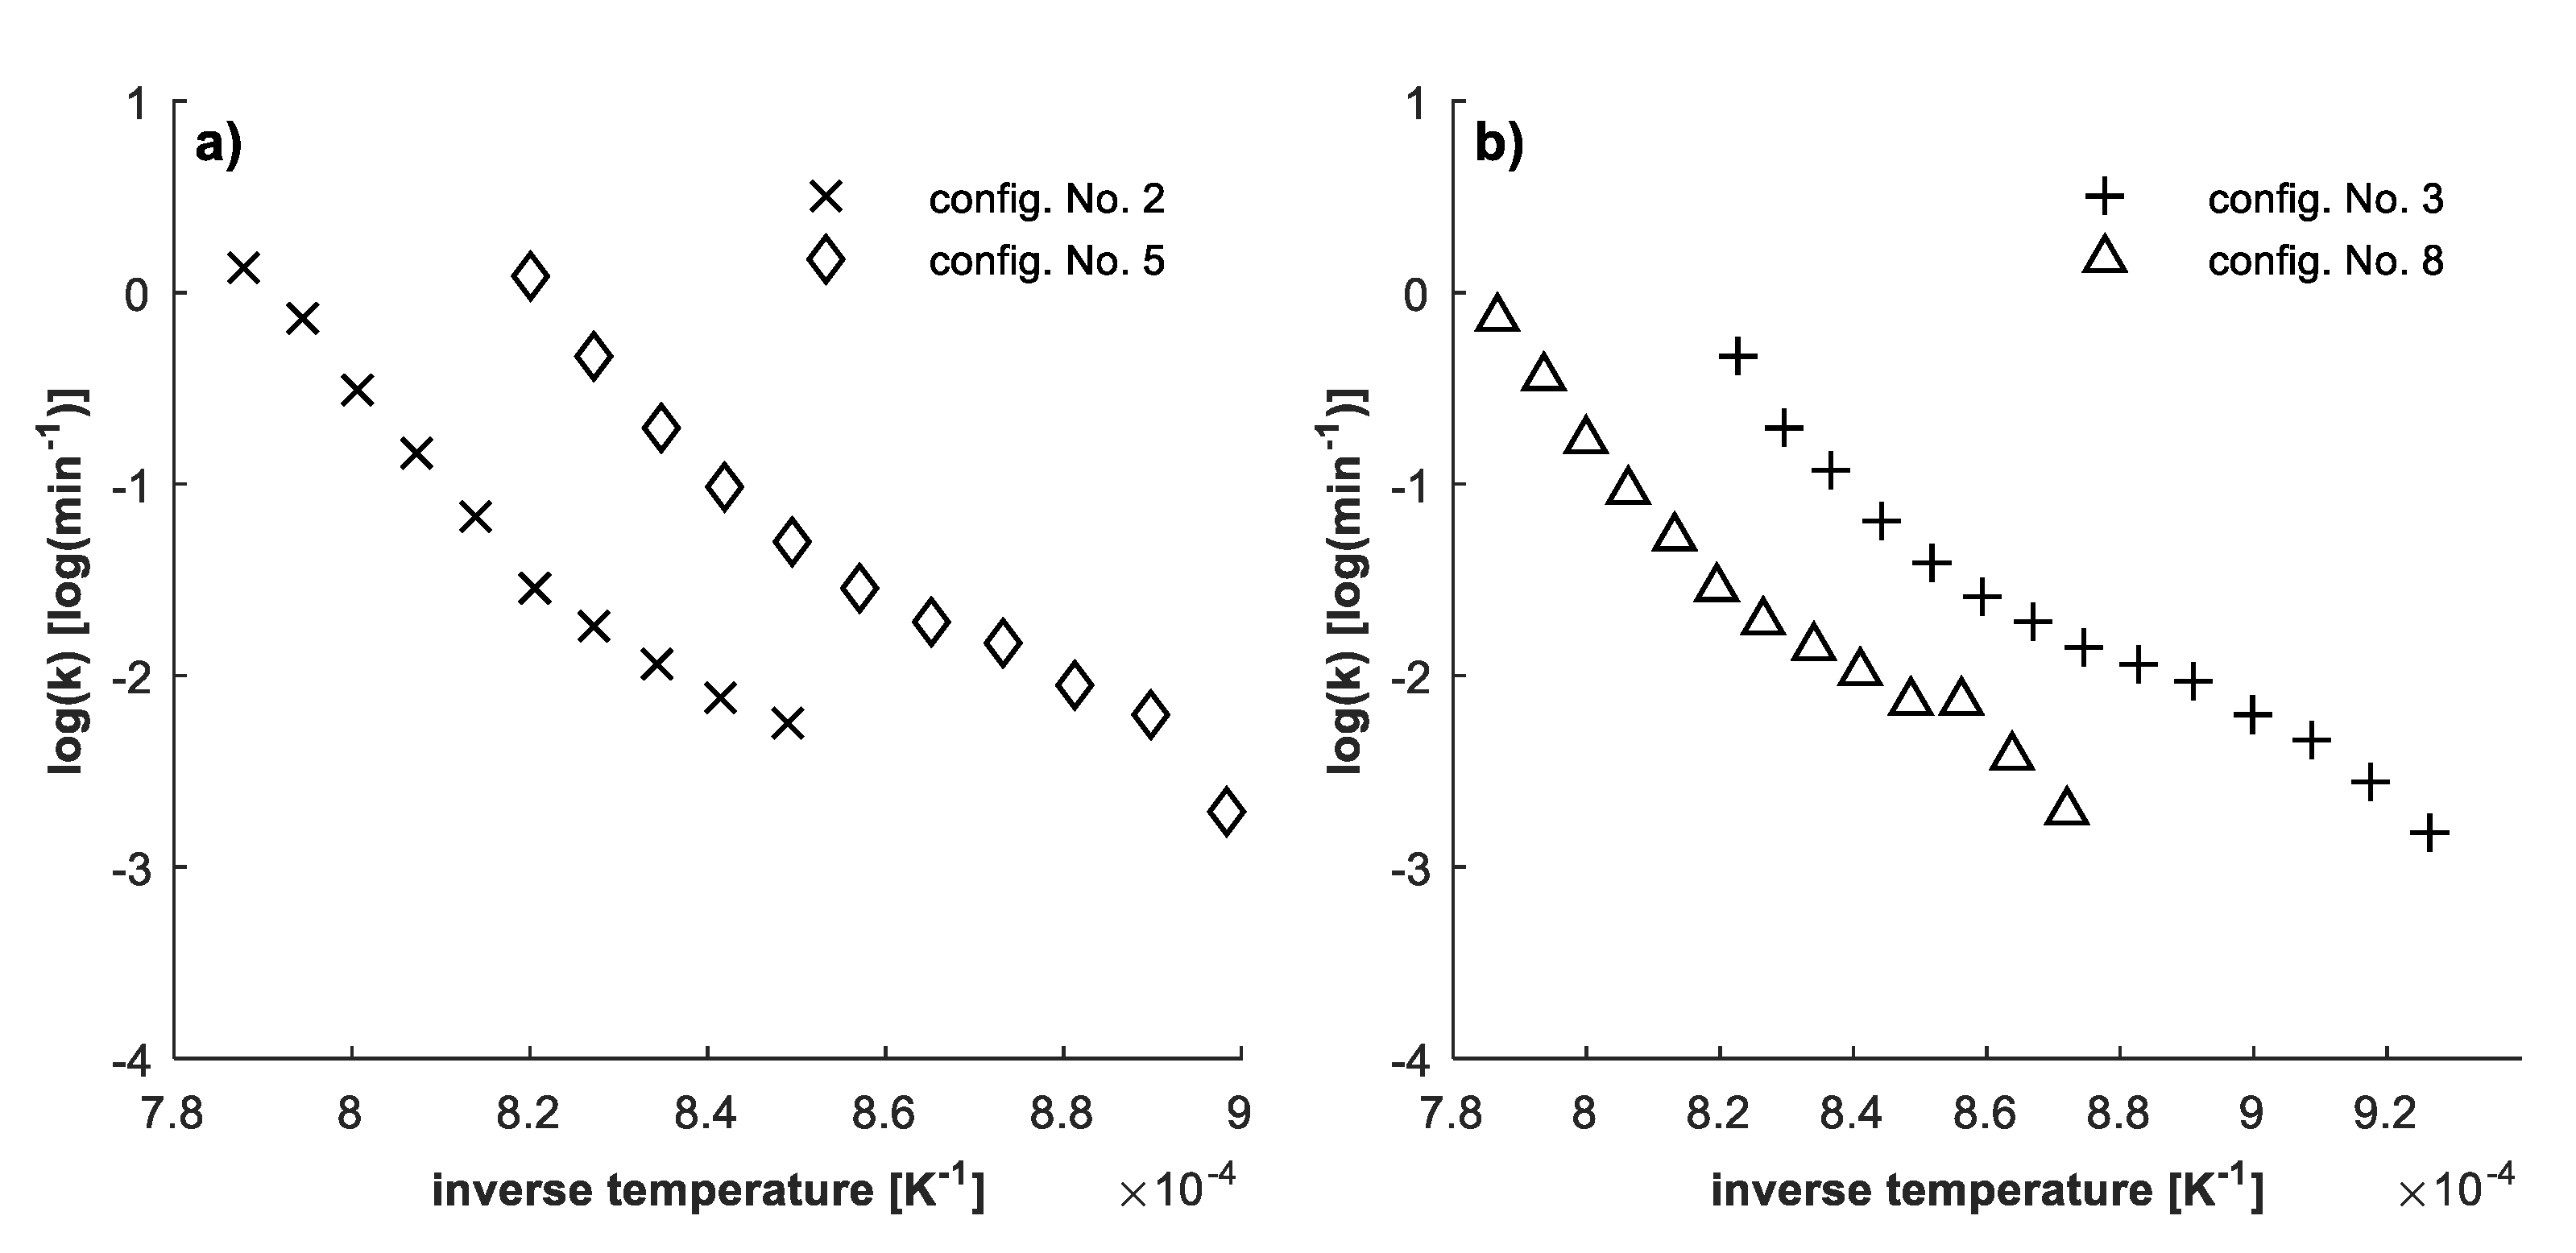
The kinetic model for the gasification of the char has to describe sufficiently the change in reaction rate with ongoing carbon conversion. In Figure 2, the Arrhenius plot is shown for the CO2 gasification in configurations No. 2 and 5 as well as for the steam gasification in configuration No. 3 and 8 for the volumetric model.
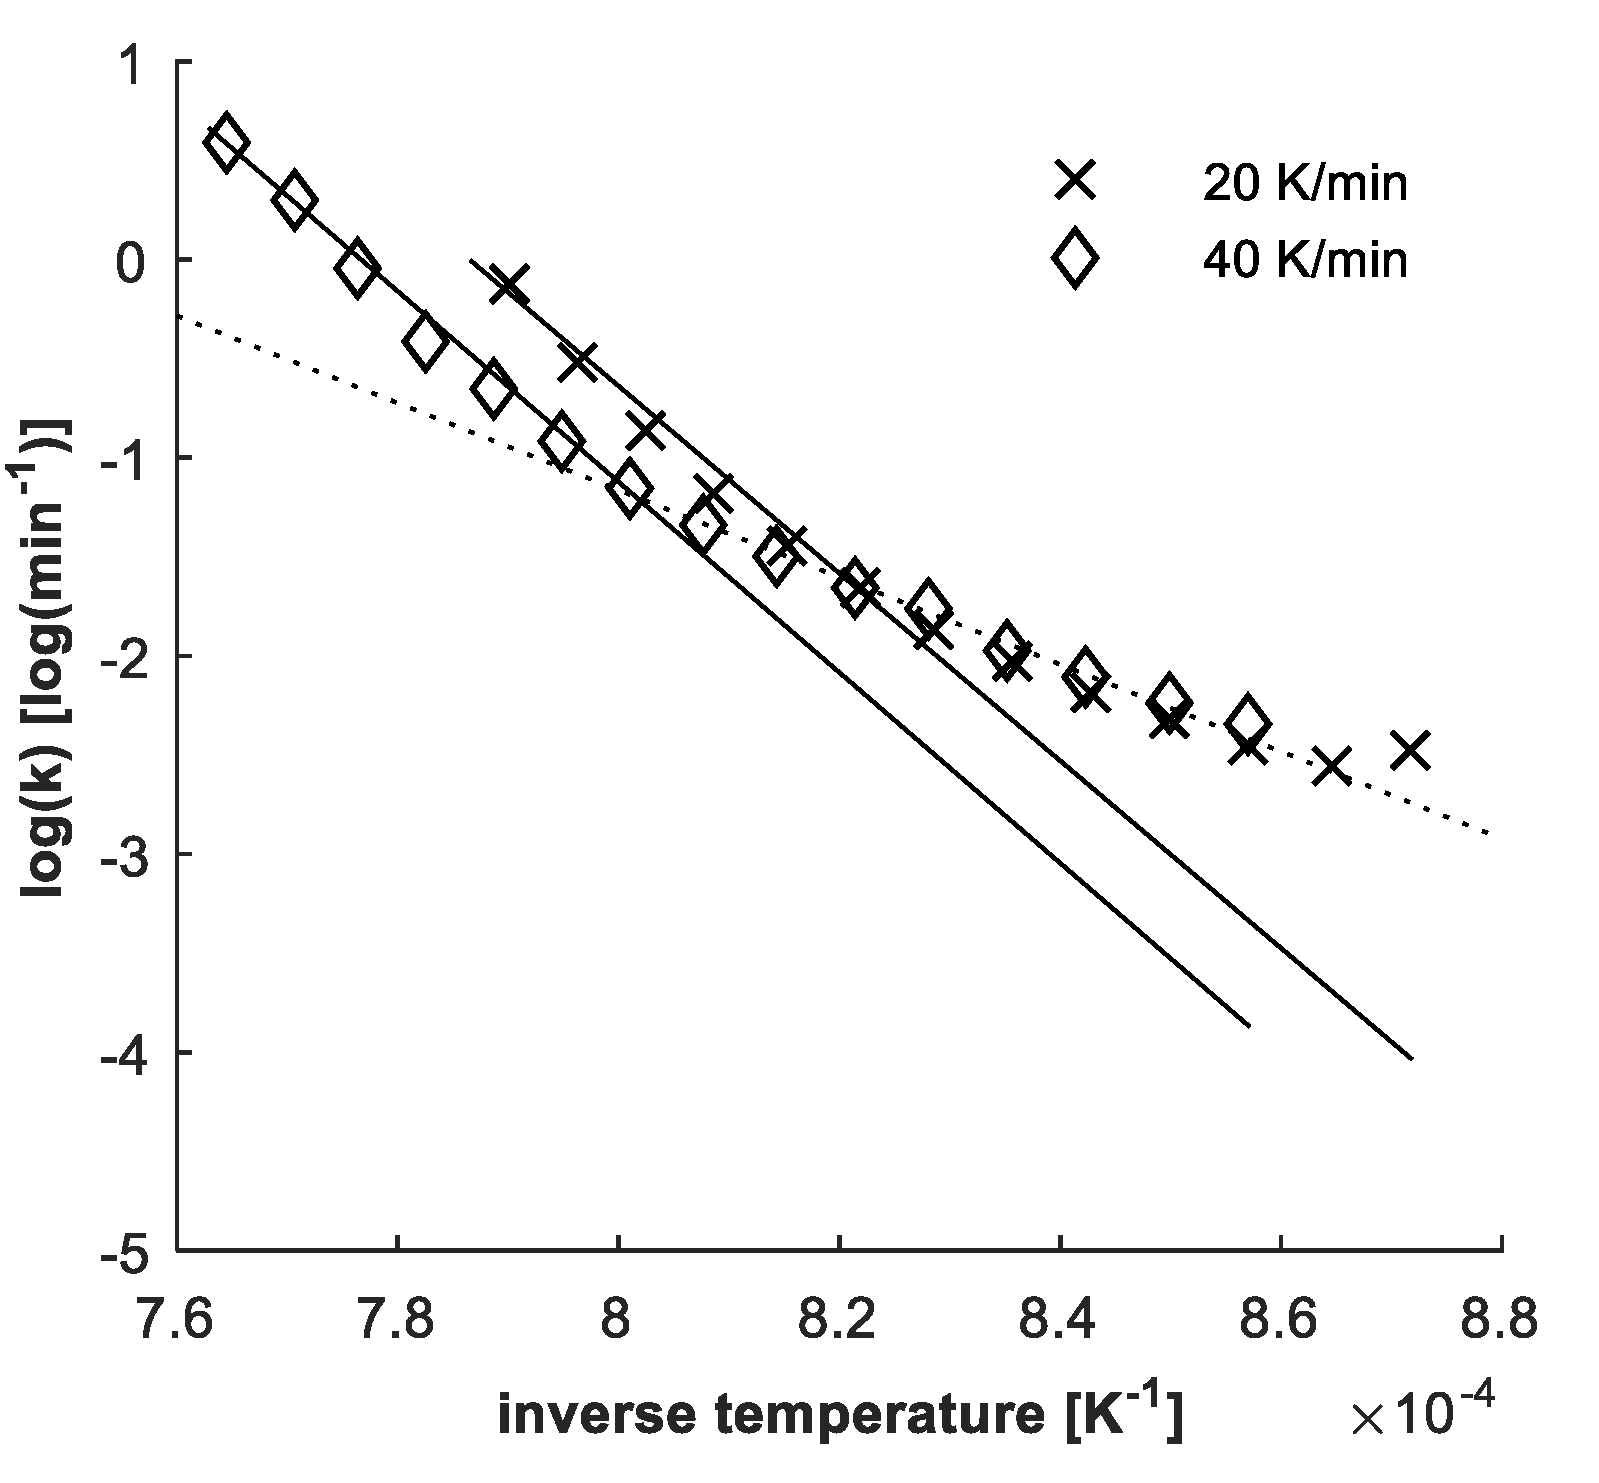
It can be seen that the gradient of the Arrhenius graph (i.e., activation energy) increases with increasing temperature. Generally, two possible explanations exist for the change in reactivity. Firstly, two separate reactions with different activation energies and frequency factors could determine the gasification of the char at different temperatures, e.g., a catalyzed and a non-catalyzed reaction. In this case, a suitable reaction model must be selected. Secondly, the reactivity of the char increases more with ongoing gasification than the volumetric model predicts. In this case, another conversion model should be used, like the GM, RPM or JM. Only additional runs with different heating rates can make the distinction between those two possible explanations, as stated by Miura et al. [23].
The test configuration No. 1 of the CO2 gasification was repeated with heating rates of 20 K/min and 40 K/min in another oven of the TGA. In Figure 3, one representative run for each heating rate is plotted. The solid lines represent the reaction rate according to the Arrhenius model for both runs. The dashed lines show the reaction rate according to the Arrhenius model, when only inverse temperatures of more than 8.2 × 10⁻⁴ K−1 are considered. It is apparent that the change in reaction rate happens at different temperatures.
Additionally, the samples were acid washed according to ISO 602:2015 to remove the mineral content. The acid washed samples were used in CO2 gasification experiments (Table 2) of the configurations No. 1, 3, 5, and 7. Compared to the non-acid washed samples, the Arrhenius plots have the same shape, but exhibit a shift to lower frequency factors by about 0.15–0.4 log(min−1). This indicates the general catalytic effect of the mineral matter in the ash but without any temperature dependency.
Therefore, it can be concluded that the change in char reactivity has to be explained by a suitable conversion model.

4.3. Determination of Kinetic Parameters

For the determination of the kinetic parameters, the objective function (11) was minimized for the Arrhenius equation and the L–H model in combination with all four kinetic models (VM, RM, RPM and JM) for both the CO2 gasification as well as the steam gasification. The coefficients of determination R 2 are listed in Table 5. The L–H model generally leads to significantly better results than the Arrhenius model with the coefficient of determination being larger for any given conversion model except from the GM for CO2 gasification. In this case, R2 is very similar for the Arrhenius and the L–H model. Regarding the conversion models, the JM is the most suitable for the selected char samples.
Table 6 shows the kinetic parameters for the L–H model, the parameter α of the JM and the parameter b for the mass influence.
A closer look has to be taken at the activation energy E a , 2 , which is negative for both CO2 and steam gasification. Negative activation energies have been observed for gasification before [6] and are a hint that the L–H model does not completely describe the reaction mechanisms during gasification. In the case of steam gasification, a possible reason is the hydrogen inhibition through the irreversible adsorption of hydrogen on the active char sites, described by Hüttinger et al. [24].
For both, steam and CO2 gasification, the influence of ash acting as a catalyst is another explanation. Still, with a coefficient of determination at about 98% and 95% for steam and CO2 gasification respectively, the confidence intervals are narrow enough for practical use.
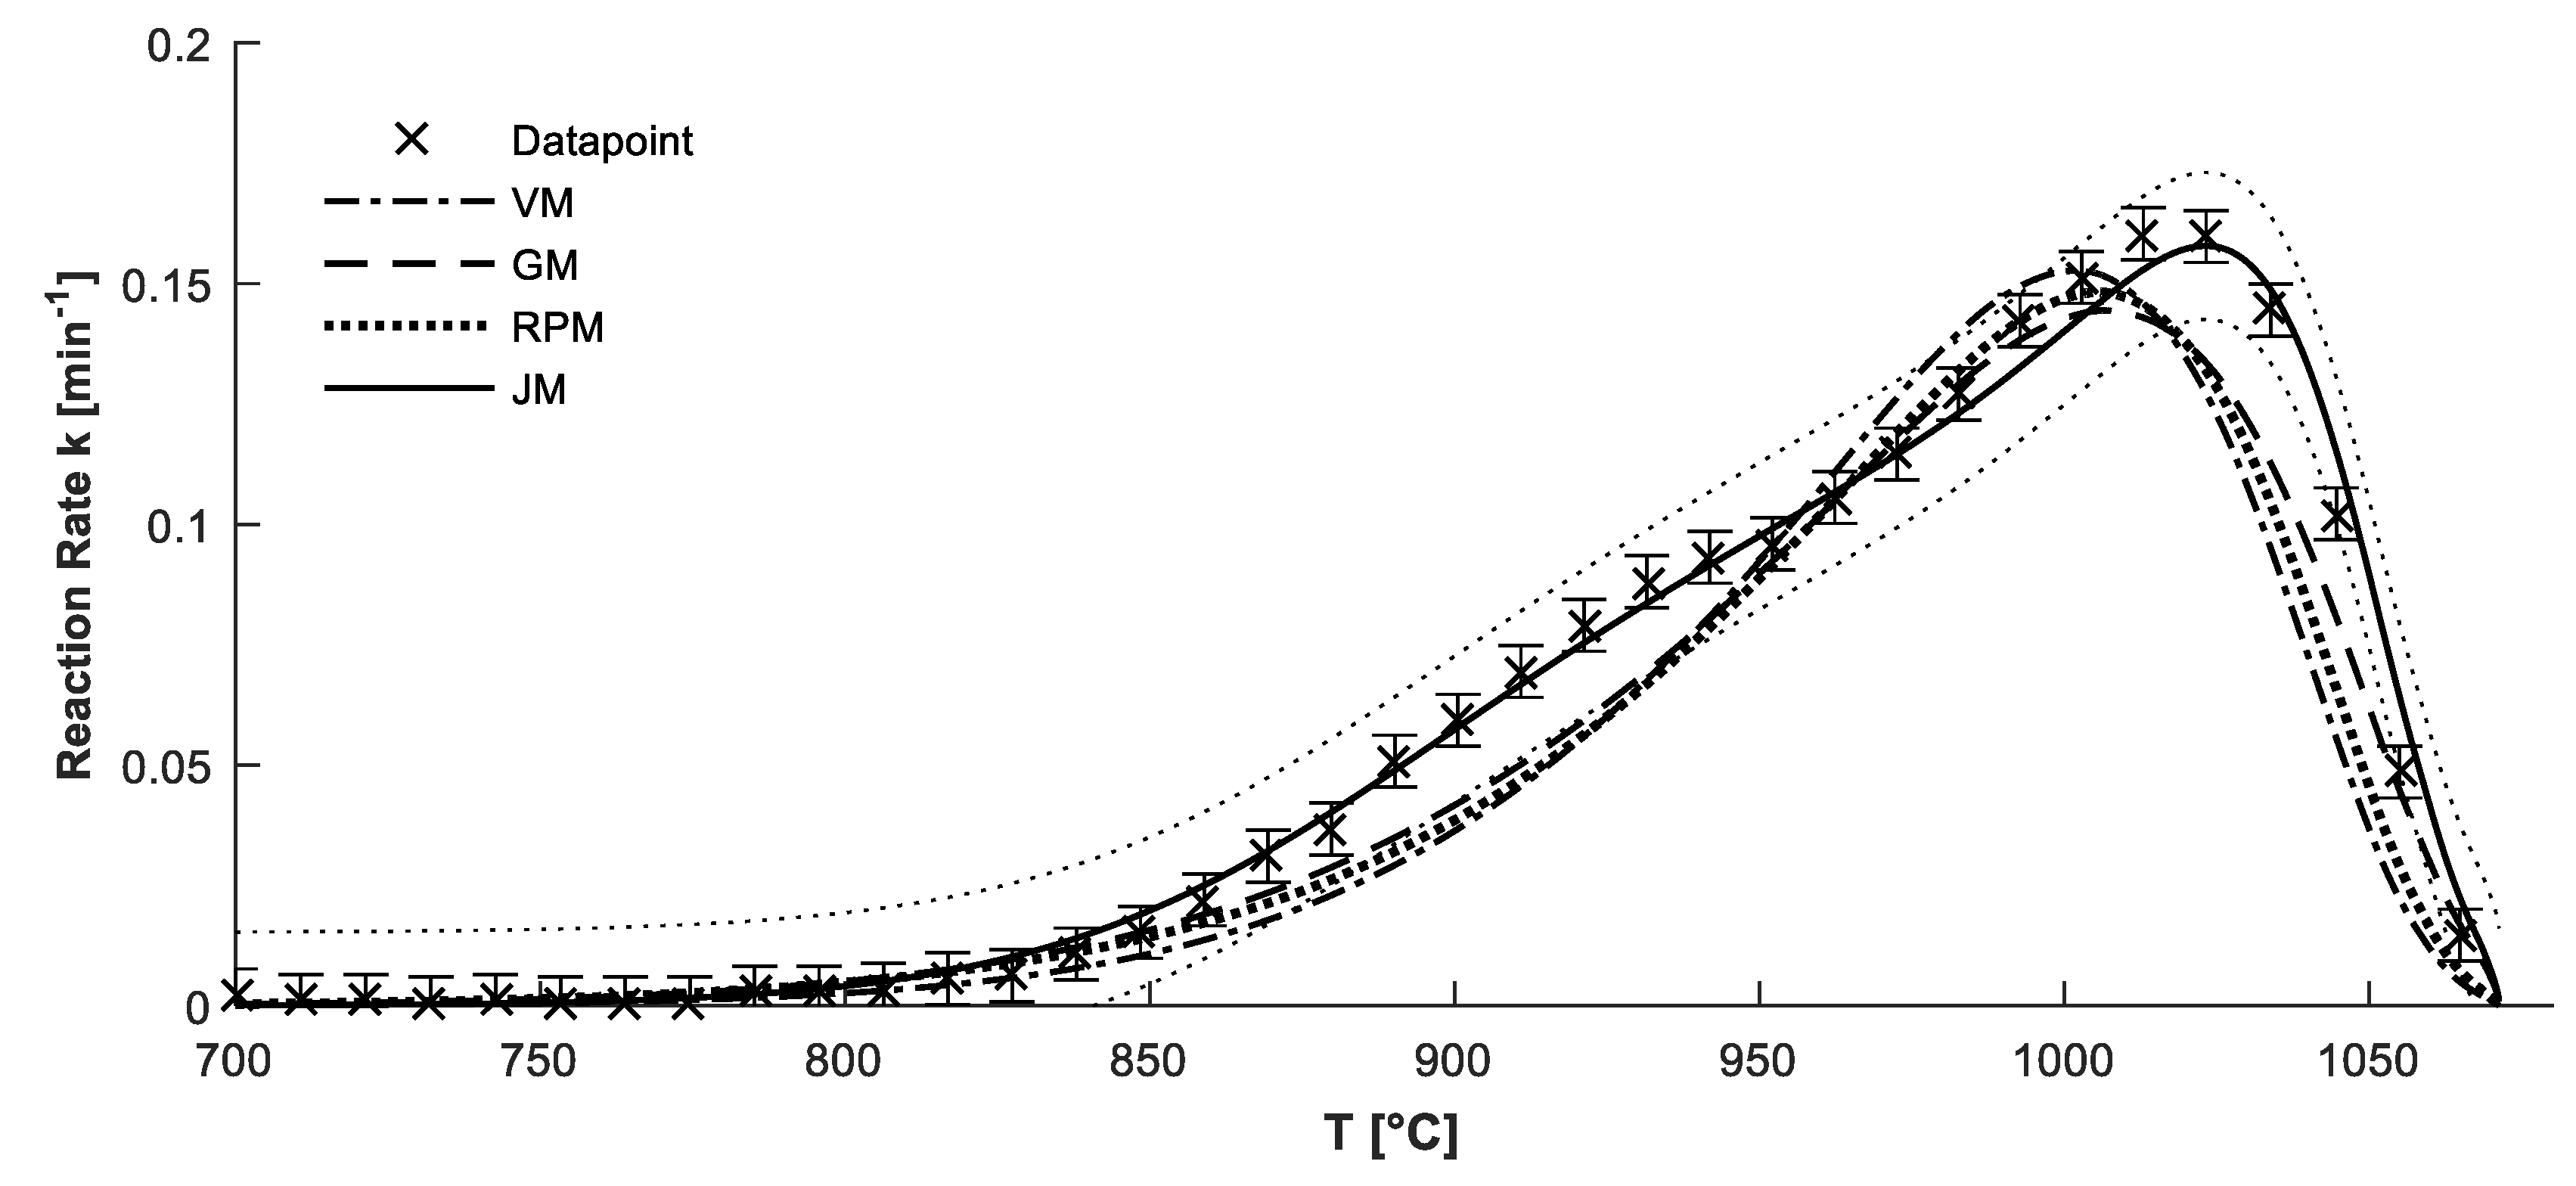
Figure 4 exemplarily shows the results of a steam gasification run in test configuration No. 2 with 20 mL/min steam and 35 mL/min hydrogen for a selection of temperatures with their error bar according to the Allan deviation. Additionally, the predicted reaction rates of the L–H model together with all four conversion models are plotted. For the JM, the 95% confidence interval is marked in the plot, too. The measurements show a digressive change in reaction rate between 900 °C and 970 °C that was observed in all measurements with steam. Only the JM satisfactorily models this characteristic, leading to the very high coefficient of determination. The results are in good agreement with the JM model, especially in the relevant range from 750 °C to 950 °C.
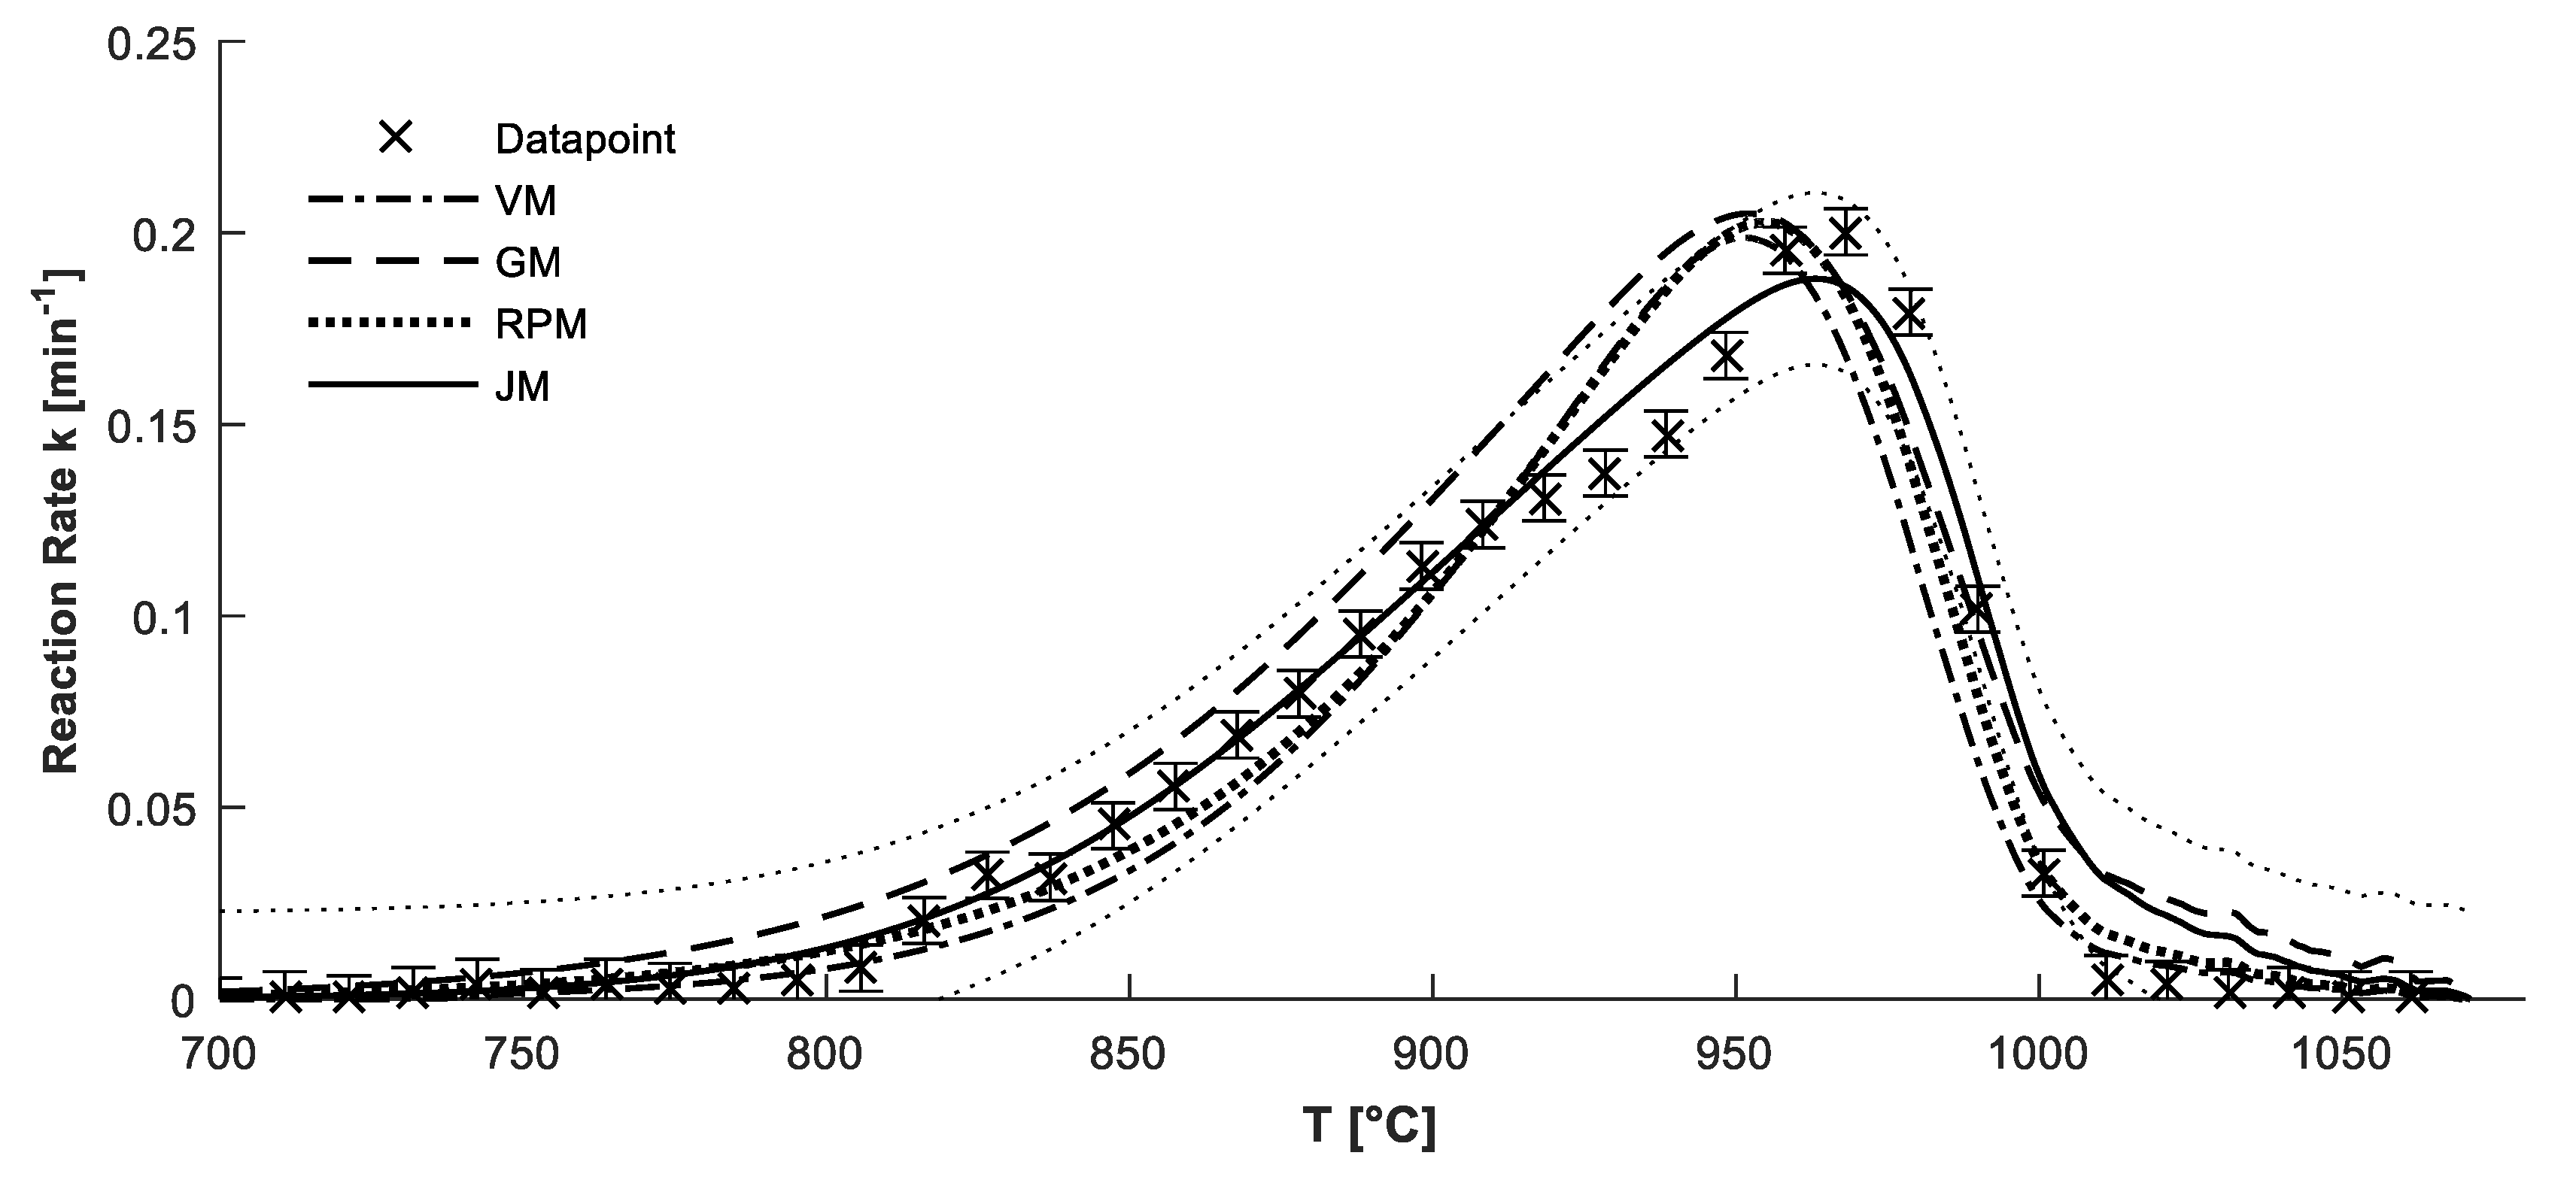
Figure 5 shows the respective information for a trial with 33% CO2 and 20% CO for the L–H reaction model together with all conversion models. Here, the L–H model emulates the measurements for the CO2 gasification best, too. In addition, similarly to Figure 4, the change in reaction rate decreases between 900 °C and 950 °C. However, for the CO2 gasification, the JM is not able to model this effect correctly. For very high conversions and temperatures, all models overestimate the reaction rate. These deviations are observed for most CO2 measurements and lead to a smaller coefficient of determination. Still, the results are satisfying in the relevant temperature range for practical use in fluidized bed gasification.

5. Conclusions

Within this work, it was possible to demonstrate a suitable approach for determining gasification kinetics of one char with thermogravimetric analysis by the followings steps: determination of the mass influence; determination of possible influence of mineral matter or conversion model; non-isothermal measurement of a representative set of gas compositions; evaluation of measurement error; fitting results to possible models and assessment of model quality.
Hence, the char of a Rhenish lignite was gasified in a TGA at atmospheric pressure under non-isothermal conditions in order to determine the gasification kinetics for steam and CO2 gasification with the inhibiting effect of H2 and CO respectively. The measurement data were filtered with a first order Savitzky–Golay-Filter and an optimal integration time determined by means of the Allan variance.
Two reactions models, Arrhenius and Langmuir–Hinshelwood, and four conversion models, the volumetric model (VM), the grain model (GM), the random pore model (RPM) and the Johnson model (JM), were investigated. Furthermore, a model for the influence of the sample mass in a TGA was incorporated to account for mass transfer effects.
With this rigorous approach, it was found that the reaction is best described by the L–H rate equation together with the JM as the conversion model. For both, steam and CO2 gasification, the activation energies of the reverse reactions are negative. This is a hint that the L–H model does not completely describe the underlying reaction mechanism. Still, for typical environments of fluidized bed gasifiers, the L–H model can be used to predict the reactions rates.

Author Contributions

C.H. is responsible for administration, conceptualization, the original draft, and developed the applied methodology. The experimental investigation were conducted by E.L. J.M. supported the writing process with his reviews and edits. B.E. supervised the research progress and the presented work. All authors have read and agreed to the published version of the manuscript.

Funding

The research leading to these results has received funding from the COORETEC initiative as part of the 6th Program on Energy Research of the Federal Ministry for Economic Affairs and Energy of Germany under grant agreement No. 03ET7048A (FABIENE; Flexible Supply of Electricity and Fuels from Gasification of Lignite in a Fluidized Bed). The funding is gratefully acknowledged.

Conflicts of Interest

The authors declare no conflict of interest.

Abbreviations

IGCCIntegrated Gasification Combined Cycle
CFDComputational Fluid Dynamic
L–H ModelLangmuir–Hinshelwood Reaction Model
VMVolumetric Model
GMGrain Model
RPMRandom Pore Model
JMJohnson Model
TGAThermo-Gravimetric Analyzer

References

  1. Edenhofer, O.; Pichs-Madruga, R.; Sokona, Y.; Farahani, E.; Kadner, S.; Seyboth, K.; Adler, A.; Baum, I.; Brunner, S.; Eickemeier, P. IPCC, 2014: Summary for policymakers—Sectoral and cross-sectoral mitigation pathways and measures. Clim. Chang. 2014, 17–26. [Google Scholar]
  2. Heinze, C.; Peters, J.; Ströhle, J.; Epple, B.; Hannes, J.; Ullrich, N.; Wulcko, I. Polygeneration von Strom und Kraftstoffen basierend auf der Wirbelschichtvergasung von Braunkohle. DGMK Tag. 2016, 2, 205–213. [Google Scholar]
  3. Irfan, M.F.; Usman, M.R.; Kusakabe, K. Coal gasification in CO2 atmosphere and its kinetics since 1948: Abrief review. Energy 2011, 36, 12–40. [Google Scholar] [CrossRef]
  4. Takarada, T.; Tamai, Y.; Tomita, A. Reactivities of 34 coals under steam gasification. Fuel 1985, 64, 1438–1442. [Google Scholar] [CrossRef]
  5. Ye, D.; Agnew, J.; Zhang, D. Gasification of a South Australian low-rank coal with carbon dioxide and steam: kinetics and reactivity studies. Fuel 1998, 77, 1209–1219. [Google Scholar] [CrossRef]
  6. Huang, Z.; Zhang, J.; Zhao, Y.; Zhang, H.; Yue, G.; Suda, T.; Narukawa, M. Kinetic studies of char gasification by steam and CO2 in the presence of H2 and CO. Fuel Process. Technol. 2010, 91, 843–847. [Google Scholar] [CrossRef]
  7. Fermoso, J.; Gil, M.V.; Pevida, C.; Pis, J.; Rubiera, F. Kinetic models comparison for non-isothermal steam gasification of coal–biomass blend chars. Chem. Eng. J. 2010, 161, 276–284. [Google Scholar] [CrossRef] [Green Version]
  8. Everson, R.C.; Neomagus, H.W.; Kasaini, H.; Njapha, D. Reaction kinetics of pulverized coal-chars derived from inertinite-rich coal discards: gasification with carbon dioxide and steam. Fuel 2006, 85, 1076–1082. [Google Scholar] [CrossRef]
  9. Laurendeau, N.M. Heterogeneous kinetics of coal char gasification and combustion. Prog. Energy Combust. Sci. 1978, 4, 221–270. [Google Scholar] [CrossRef]
  10. Lu, G.; Do, D. Comparison of structural models for high-ash char gasification. Carbon 1994, 32, 247–263. [Google Scholar] [CrossRef]
  11. Barrio, M.; Hustad, J. CO2 gasification of birch char and the effect of CO inhibition on the calculation of chemical kinetics. Prog. Thermochem. Biomass Convers. 2008, 47–60. [Google Scholar]
  12. Lussier, M.; Zhang, Z.; Miller, D.J. Characterizing rate inhibition in steam/hydrogen gasification via analysis of adsorbed hydrogen. Carbon 1998, 36, 1361–1369. [Google Scholar] [CrossRef]
  13. Ergun, S. Kinetics of the Reactions of Carbon Dioxide and Steam with Coke; US Government Printing Office: Washington, DC USA, 1962.
  14. Molina, A.; Mondragon, F. Reactivity of coal gasification with steam and CO2. Fuel 1998, 77, 1831–1839. [Google Scholar] [CrossRef]
  15. Szekely, J.; Evans, J. A structural model for gas—Solid reactions with a moving boundary. Chem. Eng. Sci. 1970, 25, 1091–1107. [Google Scholar] [CrossRef]
  16. Bhatia, S.K.; Perlmutter, D. A random pore model for fluid-solid reactions: I. Isothermal, kinetic control. AIChE J. 1980, 26, 379–386. [Google Scholar] [CrossRef]
  17. Johnson, J. Kinetics of bituminous coal char gasification with gases containing steam and hydrogen. Am. Chem. Soc. Coal Gasification (USA) 1974, 10, 145–178. [Google Scholar]
  18. Ollero, P.; Serrera, A.; Arjona, R.; Alcantarilla, S. Diffusional effects in TGA gasification experiments for kinetic determination. Fuel 2002, 81, 1989–2000. [Google Scholar] [CrossRef]
  19. Klutz, H.-J.; Moser, C.; Block, D. Development status of WTA fluidized-bed drying for lignite at RWE Power AG. Power Plant Technol. Secure Sustain. Energy Supply 2010, 2, 427–444. [Google Scholar]
  20. Liu, H.; Kaneko, M.; Luo, C.; Kato, S.; Kojima, T. Effect of pyrolysis time on the gasification reactivity of char with CO2 at elevated temperatures. Fuel 2004, 83, 1055–1061. [Google Scholar] [CrossRef]
  21. Savitzky, A.; Golay, M.J. Smoothing and differentiation of data by simplified least squares procedures. Anal. Chem. 1964, 36, 1627–1639. [Google Scholar] [CrossRef]
  22. Werle, P.; Mücke, R.; Slemr, F. The limits of signal averaging in atmospheric trace-gas monitoring by tunable diode-laser absorption spectroscopy (TDLAS). Appl. Phys. B Lasers Opt. 1993, 57, 131–139. [Google Scholar] [CrossRef]
  23. Miura, K.; Silveston, P.L. Analysis of gas-solid reactions by use of a temperature-programmed reaction technique. Energy Fuels 1989, 3, 243–249. [Google Scholar] [CrossRef]
  24. Hüttinger, K.J.; Merdes, W.F. The carbon-steam reaction at elevated pressure: formations of product gases and hydrogen inhibitions. Carbon 1992, 30, 883–894. [Google Scholar] [CrossRef]
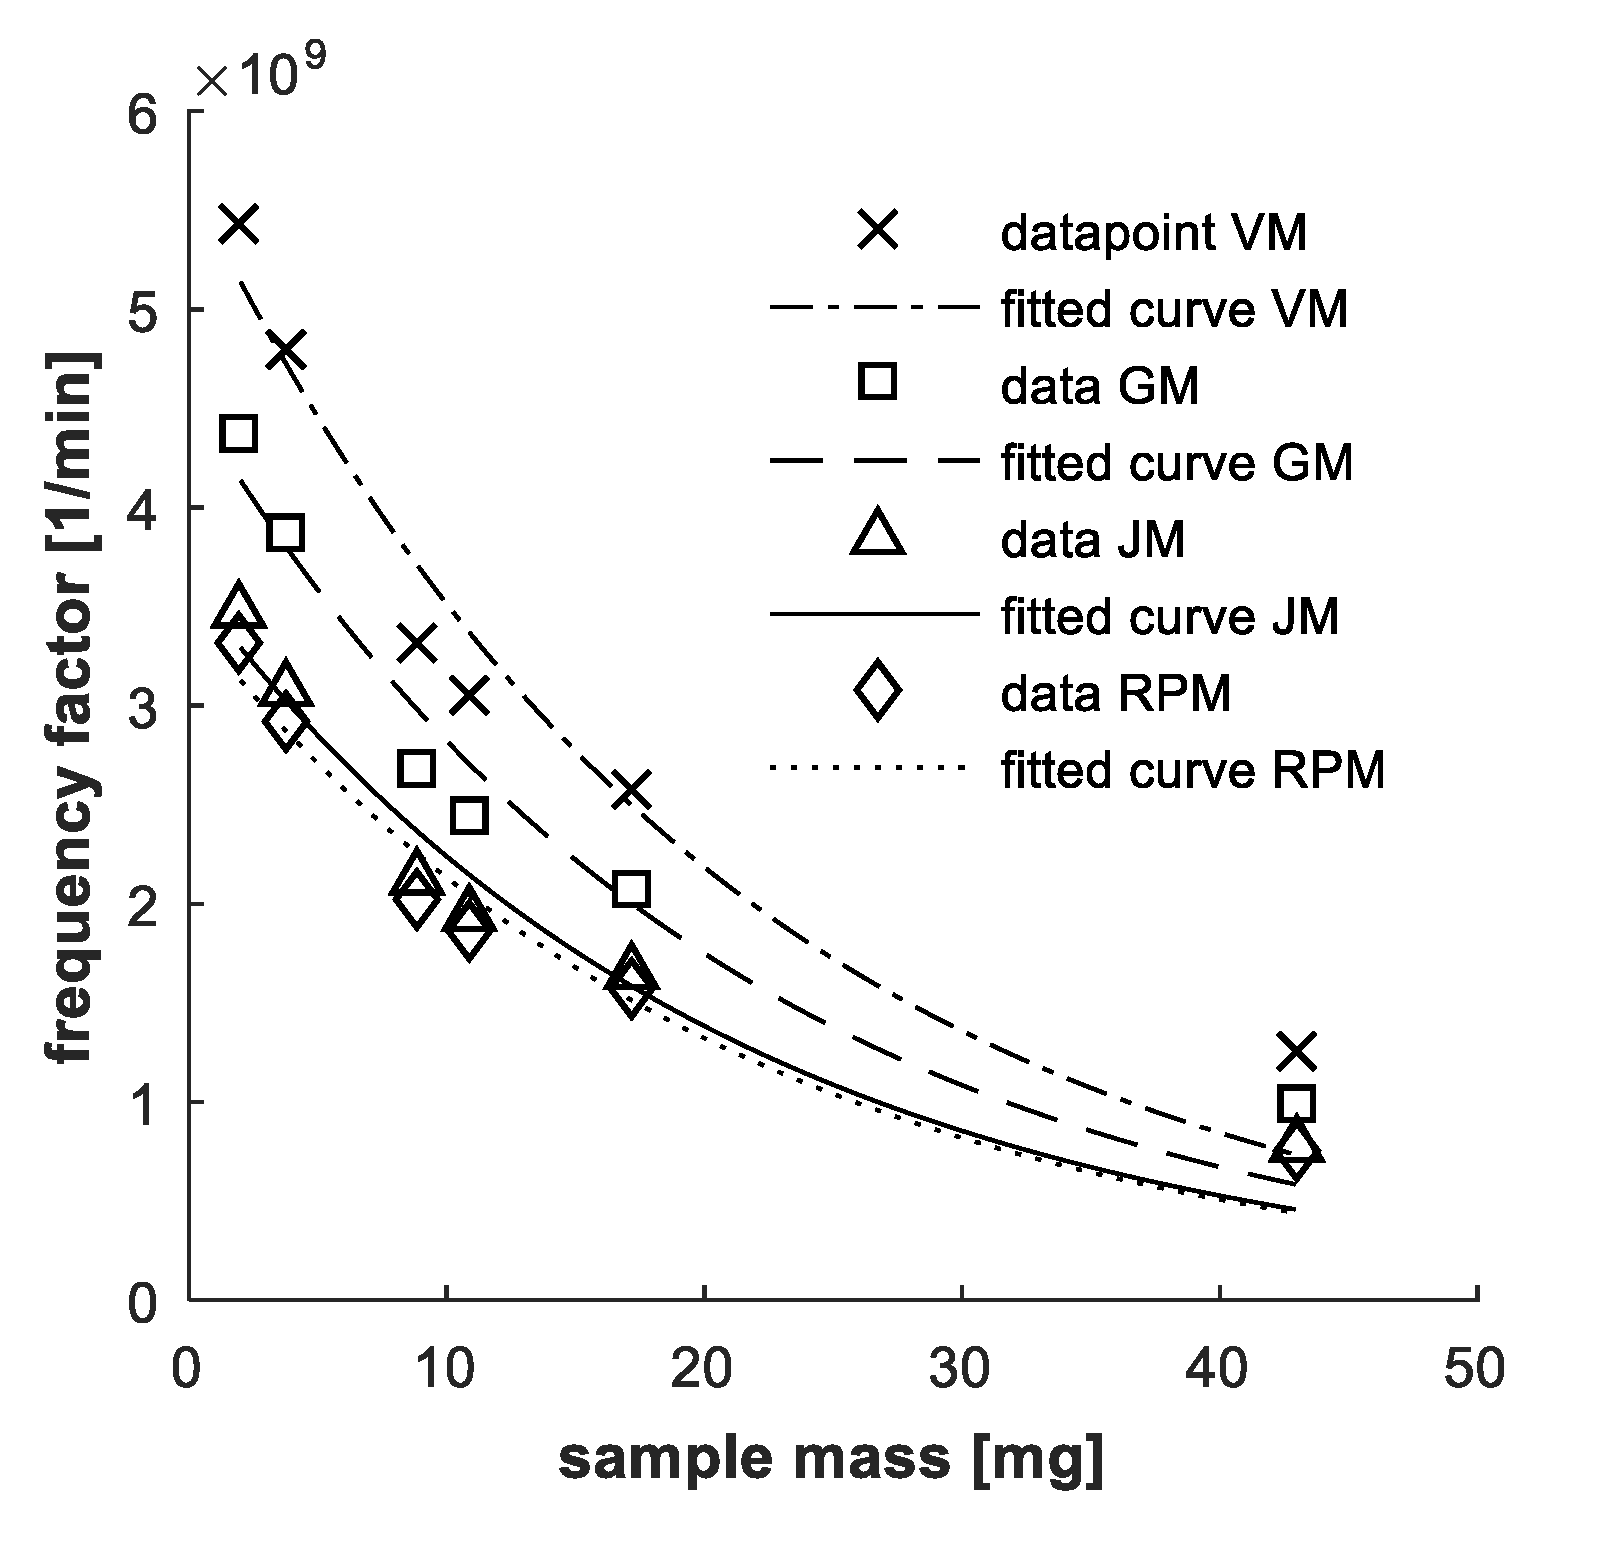
Figure 1. Frequency factor over sample mass for all four conversion models.
Applsci 10 01916 g001
Figure 2. Arrhenius plot for (a) CO2 gasification (configurations No. 2, 5) and (b) steam gasification (configuration No. 3, 8) (VM).
Applsci 10 01916 g002
Figure 3. Arrhenius plot for CO2 gasification in configuration No. 1 with 20 K/min and 40 K/min heating rate.
Applsci 10 01916 g003
Figure 4. Measurement and L–H model results for steam gasification in configuration No. 2 (20 mL/min H2O, 35 mL/min H2); 95% confidence interval for JM is marked with a thin dotted line.
Applsci 10 01916 g004
Figure 5. Measurement and L–H model results for CO2 gasification in configuration No. 6 (33 mL/min CO2, 20 mL/min CO); 95% confidence interval for JM is marked with a thin dotted line.
Applsci 10 01916 g005
Table 1. Proximate and ultimate analyses of the char samples, oxygen calculated by difference.
Proximate Analysis (wt%)Ultimate Analysis (wt%, daf)
WaterAshVolatile MatterFixed CarbonCHO (Calculated)NS
15.317.0537.130.5570.14.8423.120.751.19
Table 2. Experiment configurations for CO2 gasification; N2 was added to yield a total gas flow of 100 mL/min.
Config. No.Flow Rate CO2 (mL/min)Flow Rate CO (mL/min)
1200
22024
3250
42522.5
5330
63320
7500
85015
Table 3. Experiment configurations for steam gasification; N2 was added to yield a total gas flow of 100 mL/min.
Config. No.Flow Rate H2O (mL/min)Flow Rate H2 (mL/min)
1200
22035
3250
42535
5330
63335
7500
85035
Table 4. Experiment configurations for determination of the sample mass influence; N2 was added to yield a total gas flow of 100 mL/min.
Config. No.Sample Mass (mg)Flow Rate CO2 (mL/min)
12.520
2520
31020
41320
52020
64520
Table 5. Coefficient of determination R2 for all model combinations.
Gasifying AgentCarbon DioxideSteam
Conversion ModelVMGMRPMJMVMGMRPMJM
R2 for Arrhenius Model [%]57.572.179.378.432.741.853.657.3
R2 for L–H Model [%]85.171.890.694.886.192.489.498.4
Table 6. Results for the L–H reaction model with the Johnson conversion model.
k 1 k 2 k 3 E a , 1 E a , 2 E a , 3 α b
[kPa−1 min−1][kPa−1][kJ/mol][-][µg−1]
CO2 Gasification
3.70 × 1084.04 × 10−68.73 × 109236.1−87.8256.71.417.7
Steam Gasification
1.39 × 10125.14 × 10−33.25 × 1012298.5−39.8287.51.8910.8