Non-Energy Valorization of Residual Biomasses via HTC: CO2 Capture onto Activated Hydrochars

 ,
, 
Abstract
1. Introduction
2. Materials and Methods
2.1. Synthesis of Carbon Porous Sorbent
2.1.1. Materials
2.1.2. Experimental Apparatus
2.1.3. Experimental Procedure
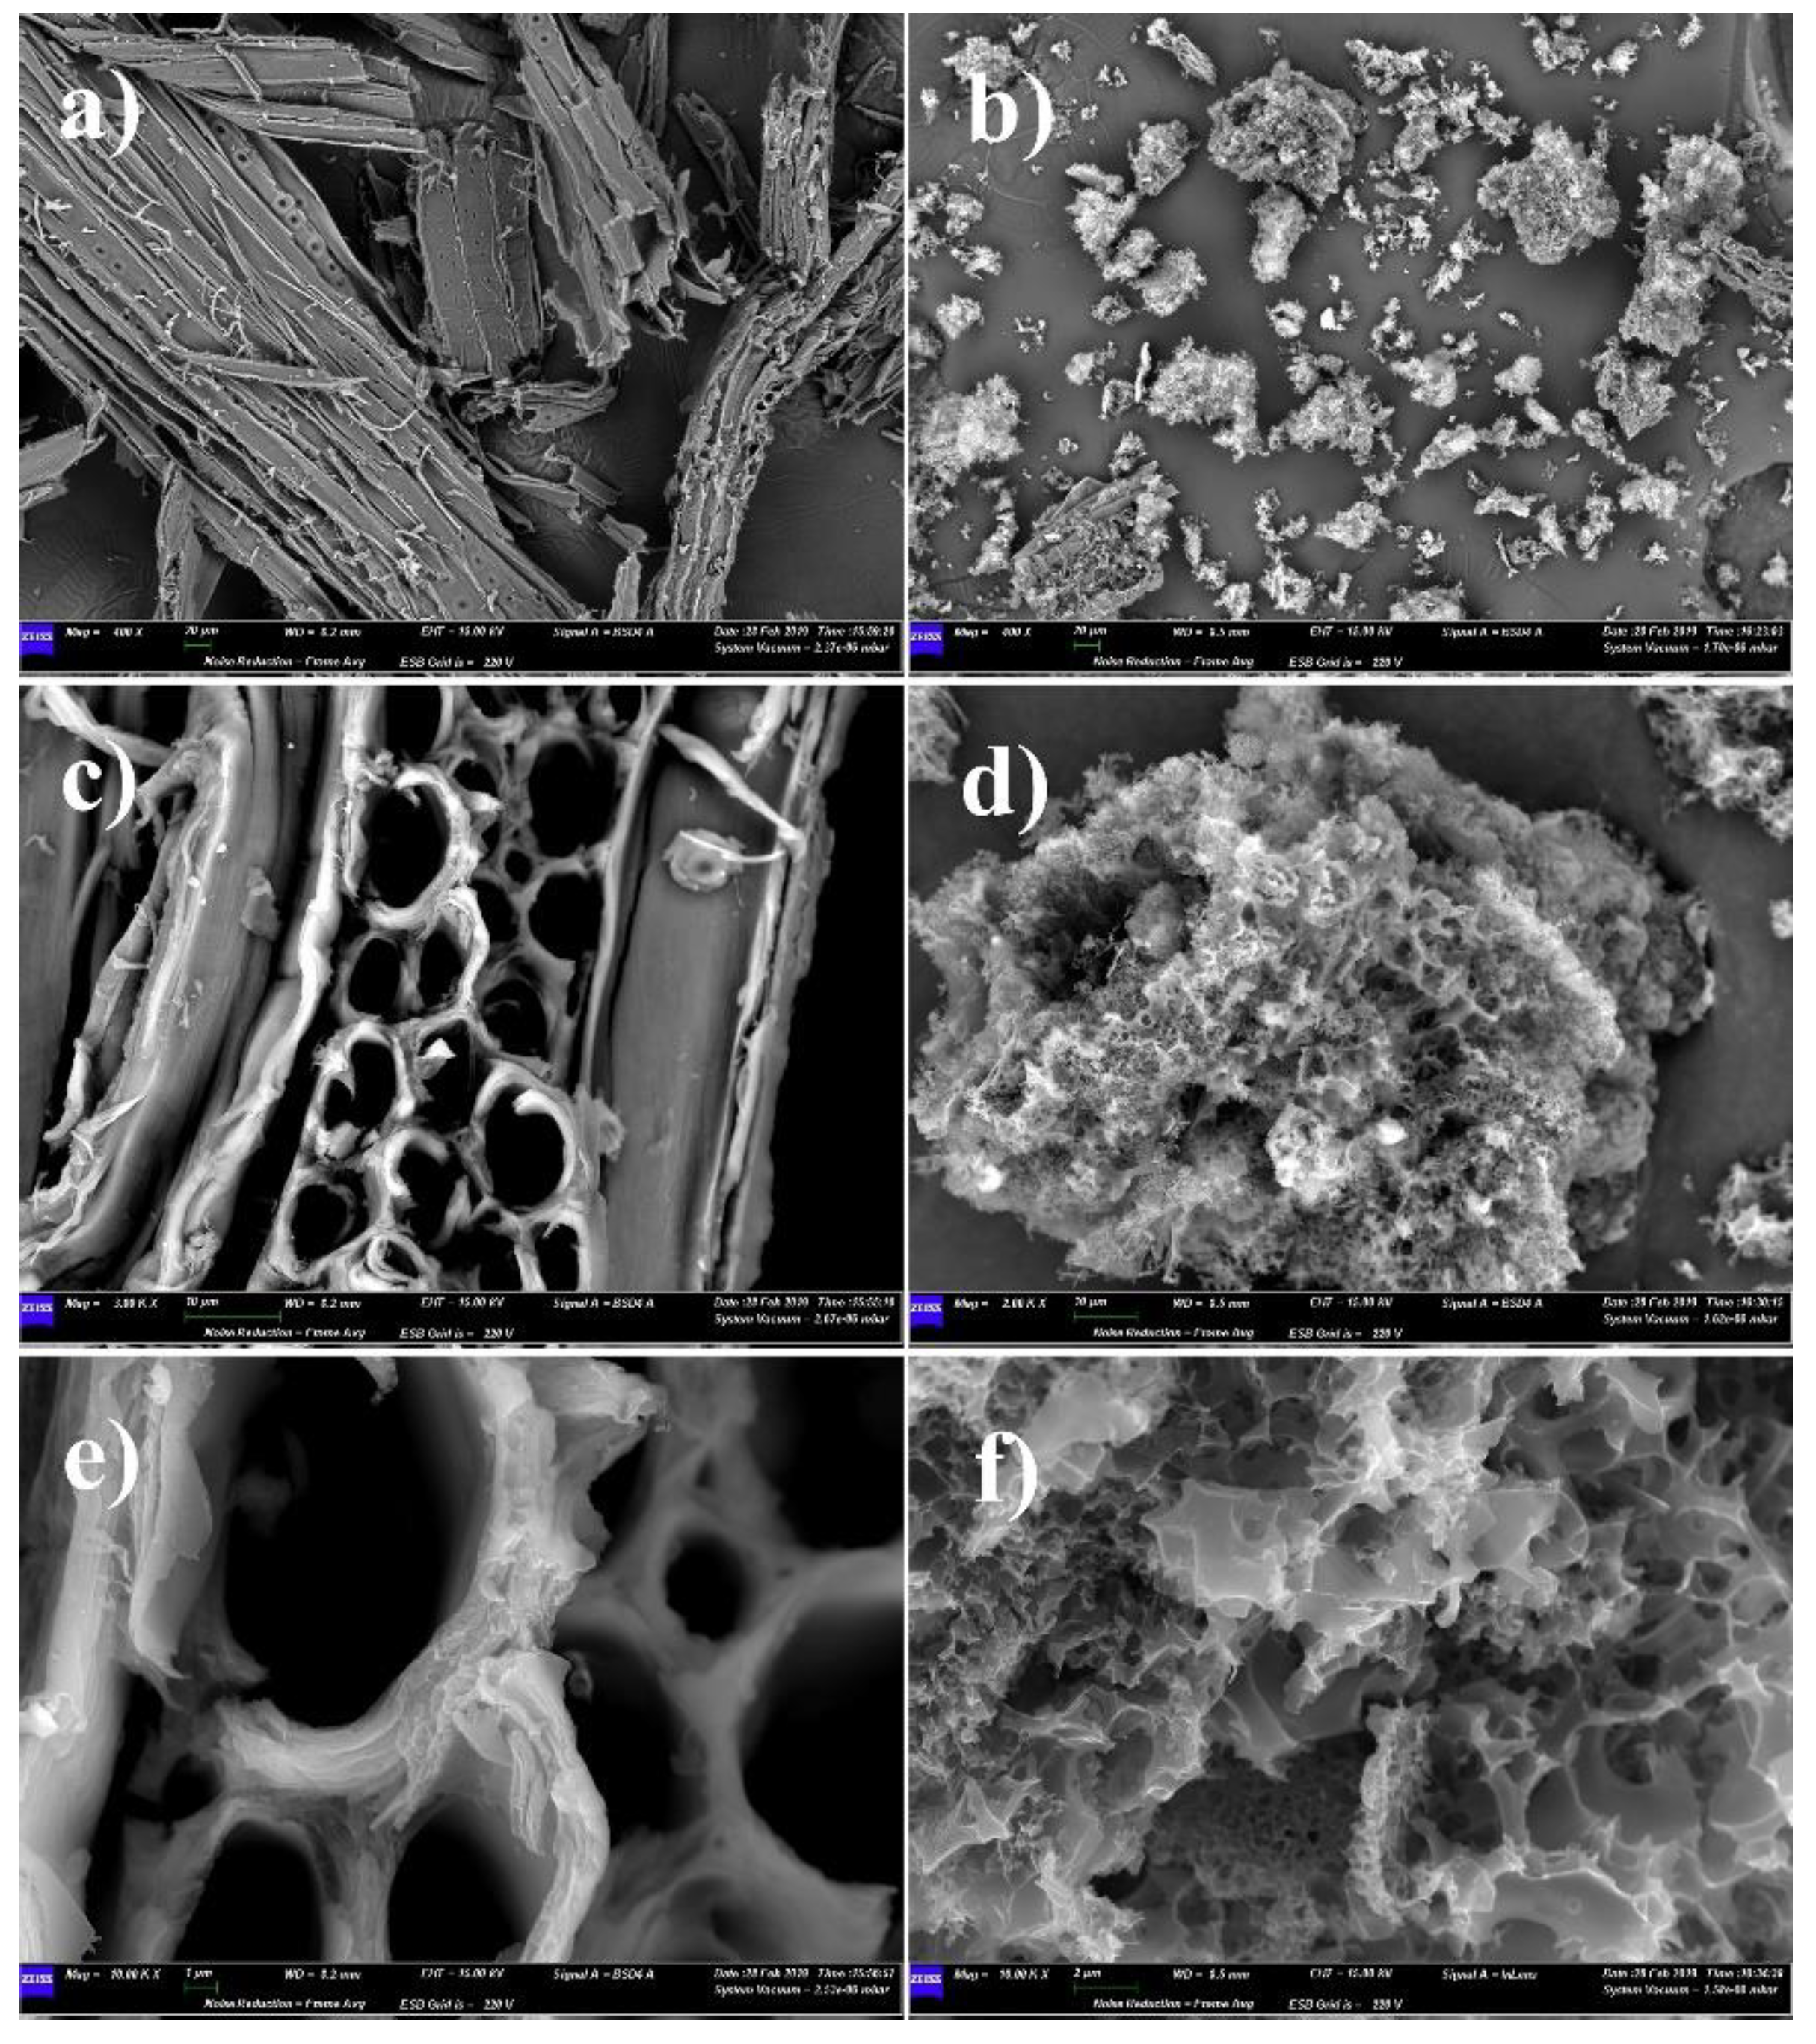
2.1.4. Characterization Methods
2.2. CO2 Adsorption Test
2.2.1. Materials
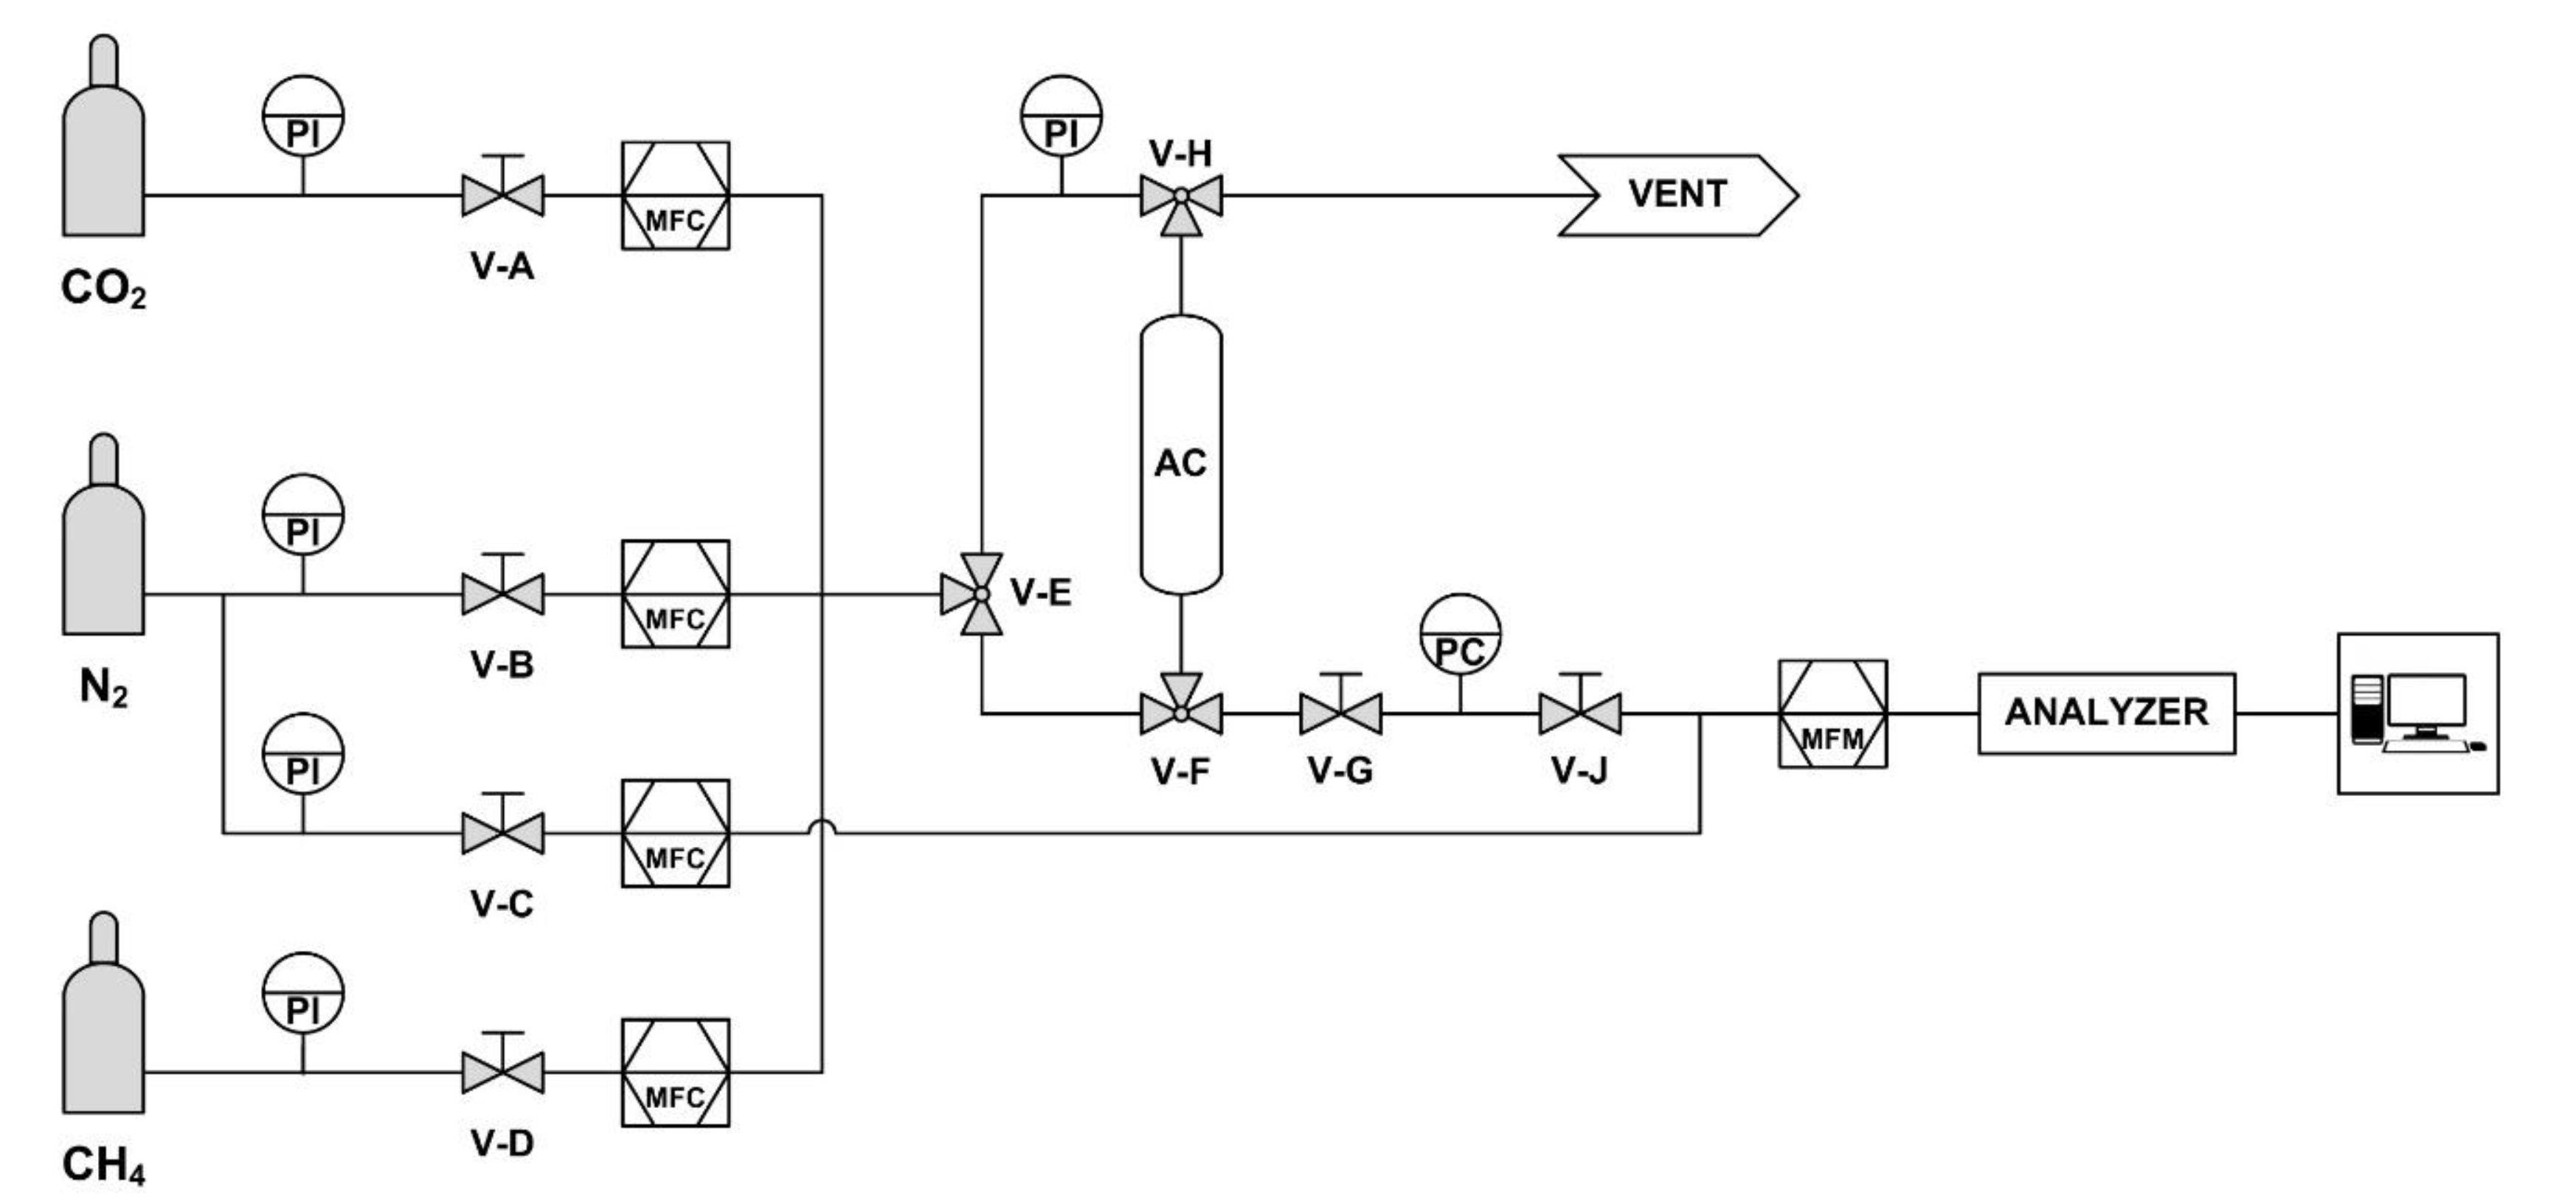
2.2.2. Experimental Apparatus
2.2.3. Experimental Procedure
2.2.4. Mathematical Model
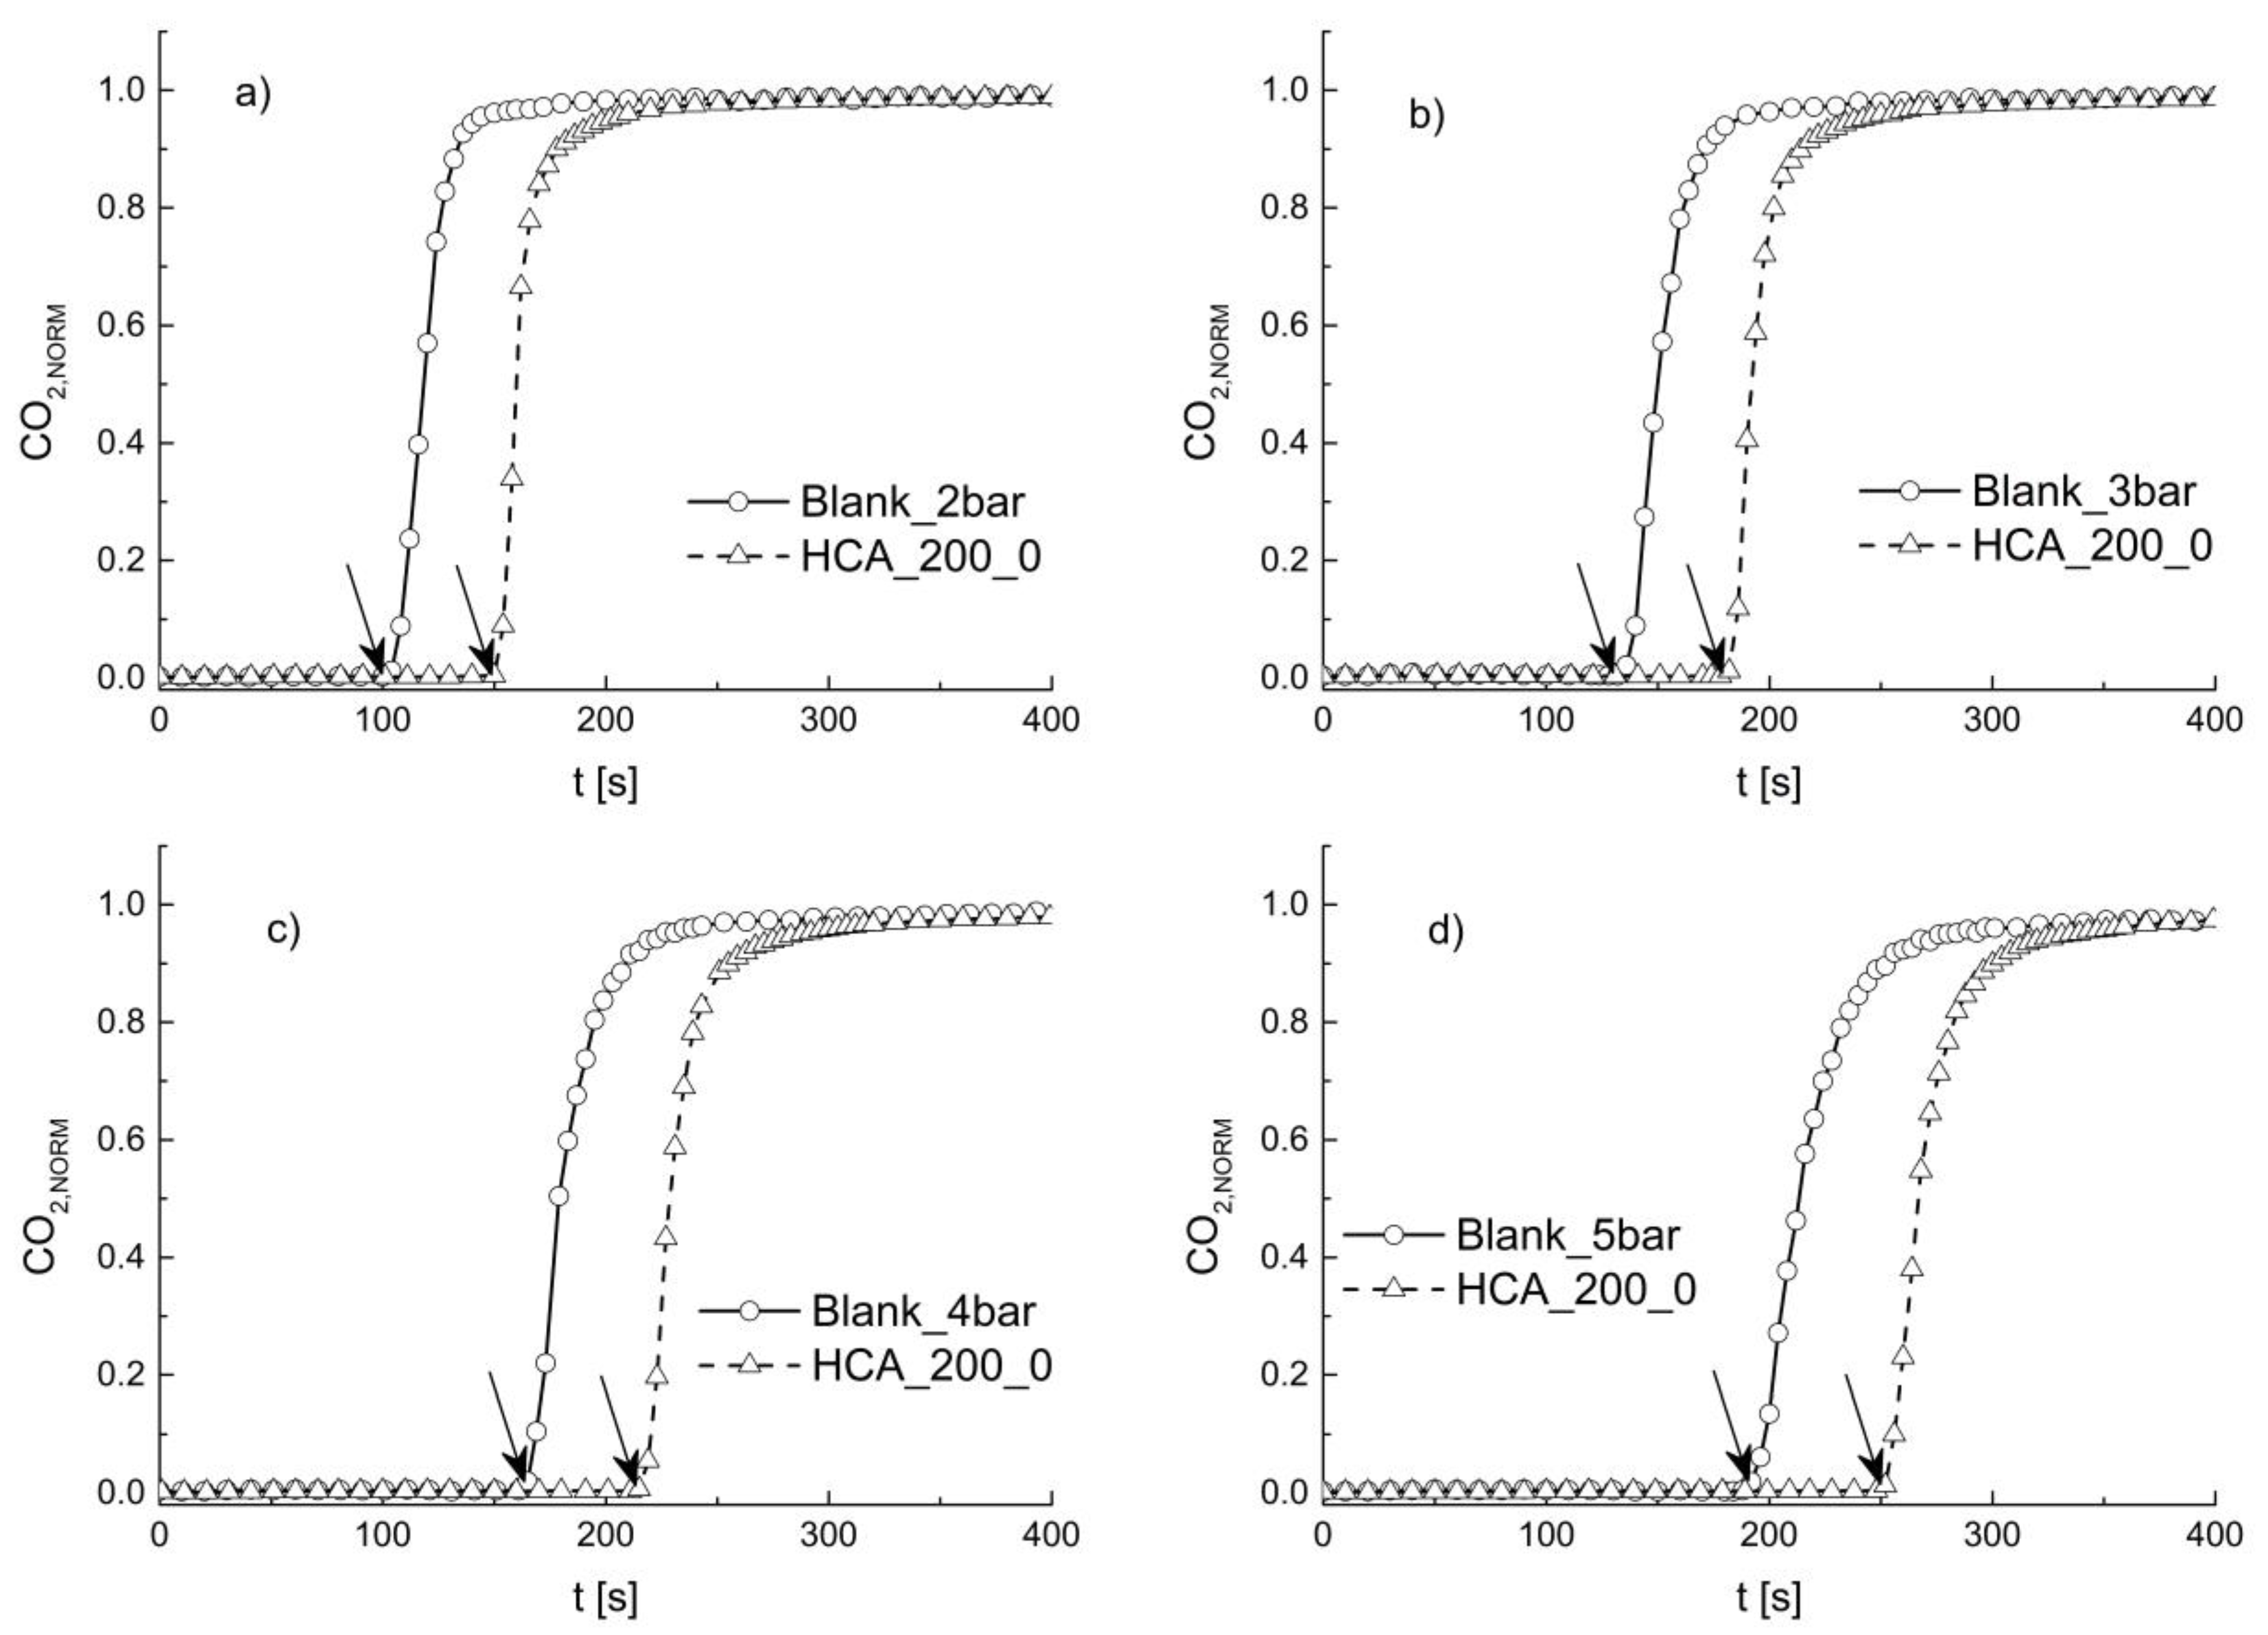
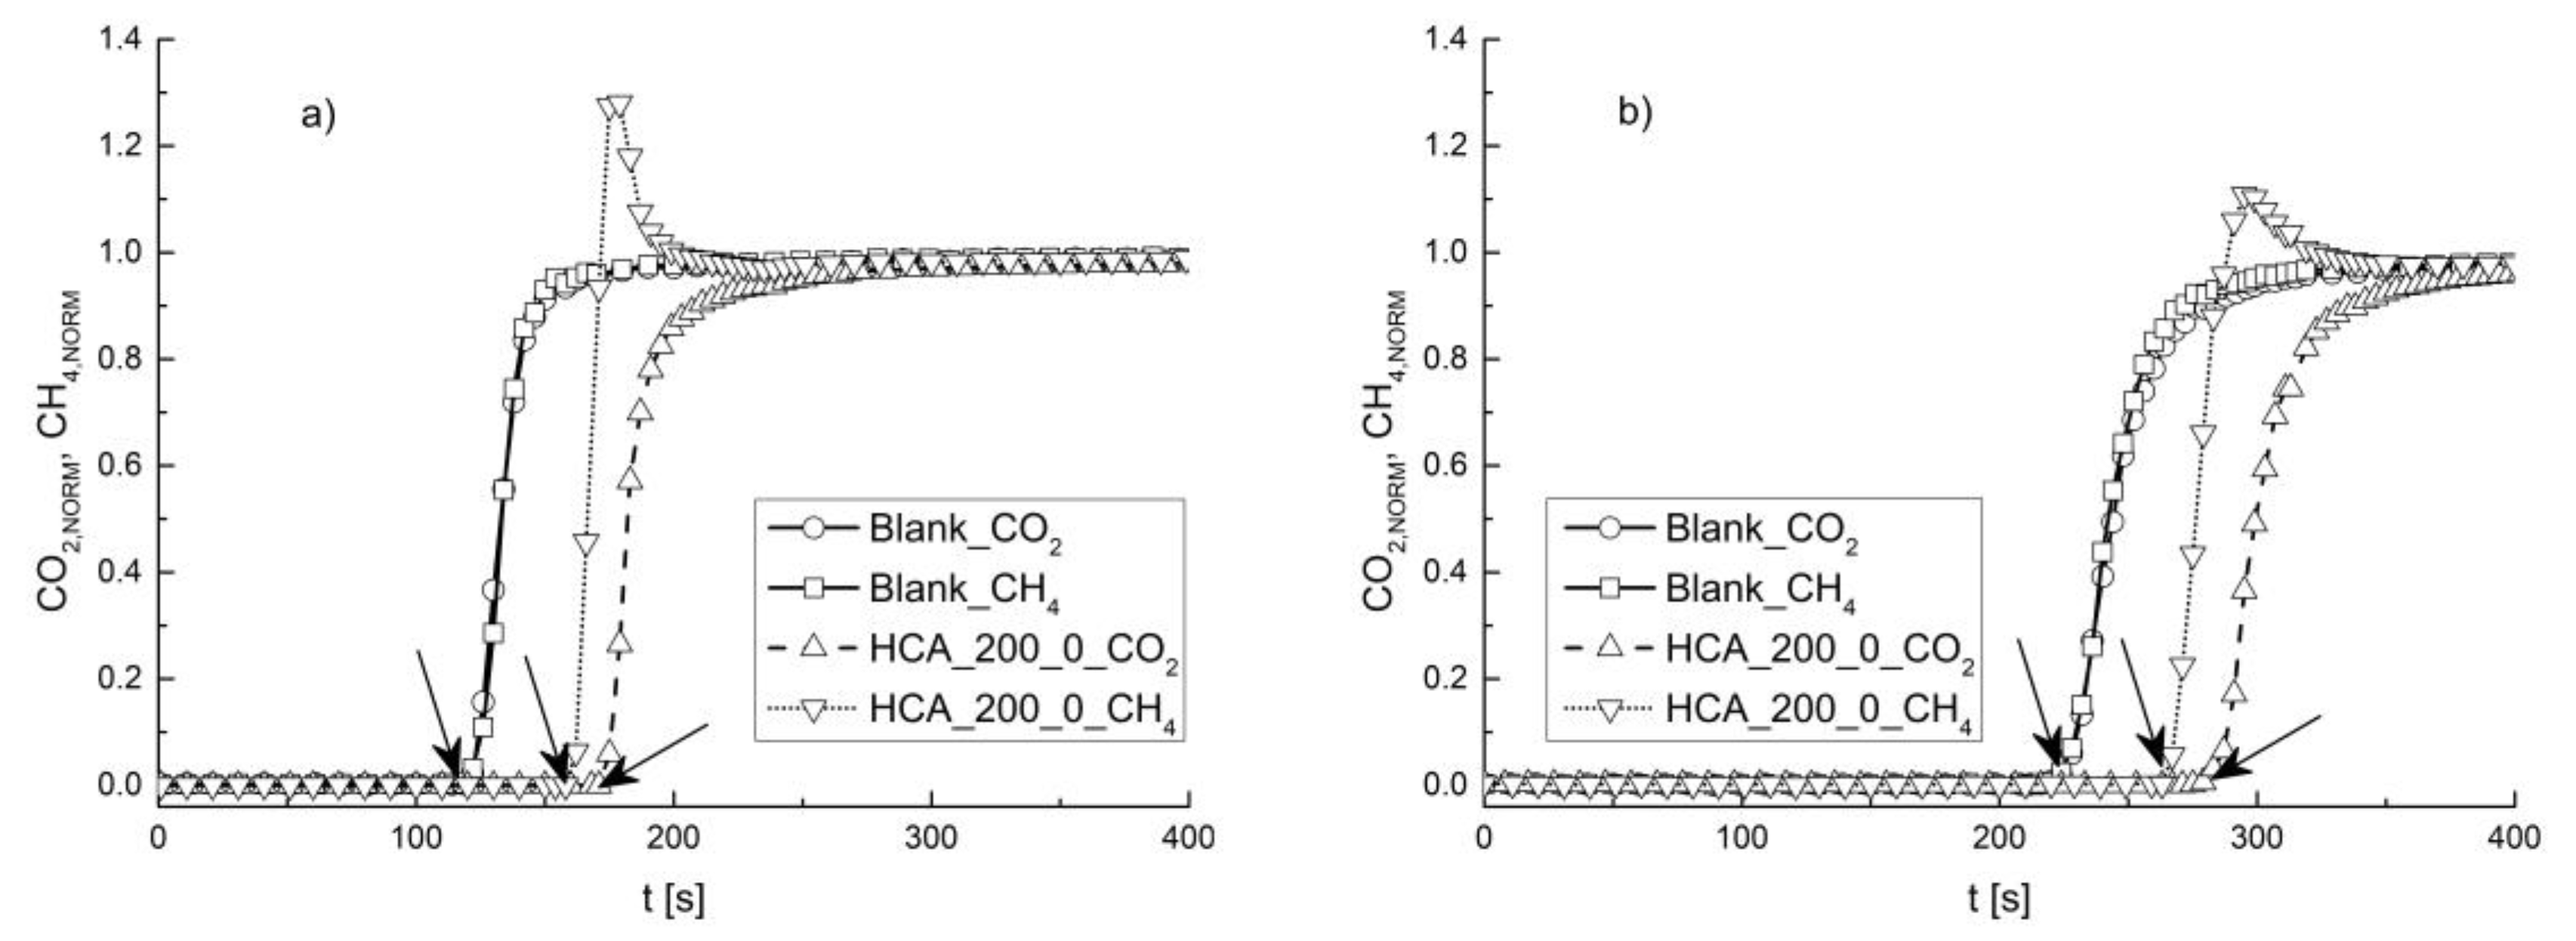
3. Results and Discussions
4. Conclusions
Supplementary Materials
Author Contributions
Funding
Conflicts of Interest
References
- Vitillo, J.G.; Smit, B.; Gagliardi, L. Introduction: Carbon Capture and Separation. Energy Convers. Manag. 2002, 43, 63–75. [Google Scholar] [CrossRef]
- IEA International Energy Agency (Paris (France)). Technology Roadmap: Carbon Capture and Storage. 2013. Available online: https://insideclimatenews.org/sites/default/files/IEA-CCS%20Roadmap.pdf (accessed on 8 March 2020).
- NOAA National Centers for Environmental Information. State of the Climate: Global Climate Report for September 2018. 2018. Available online: https://www.ncdc.noaa.gov/sotc/global/201809 (accessed on 8 March 2020).
- Hoegh-Guldberg, O.; Jacob, D.; Taylor, M.; Bindi, M.; Brown, S.; Camilloni, I.; Diedhiou, A.; Djalante, R.; Ebi, K.L.; Engelbrecht, F.; et al. Impacts of 1.5 °C Global Warming on Natural and Human Systems. In Global Warming of 1.5 °C. An IPCC Special Report on the Impacts of Global Warming of 1.5 °C above Pre-Industrial Levels and Related Global Greenhouse Gas Emission Pathways, in the Context of Strengthening the Global Response to the Threat of Climate Change, Sustainable Development, and Efforts to Eradicate Poverty; IPCC Secretariat: Geneva, Switzerland, 2018. [Google Scholar]
- IPCC. Annex II: Glossary. In Climate Change 2014: Synthesis Report. Contribution of Working Groups I, II and III to the Fifth Assessment Report of the Intergovernmental Panel on Climate Change; Core Writing Team, Pachauri, R.K., Meyer, L.A., Eds.; IPCC: Geneva, Switzerland, 2014; pp. 117–130. [Google Scholar]
- WHO. COP24 Special Report: Health and Climate Change; World Health Organization: Geneva, Switzerland, 2018; Available online: http://apps.who.int/iris (accessed on 9 March 2020).
- European Commission. 2030 Climate & Energy Framework. 2014. Available online: https://ec.europa.eu/clima/policies/strategies/2030_en (accessed on 8 March 2020).
- European Commission. Paris Agreement 2015. Available online: https://ec.europa.eu/clima/policies/international/negotiations/paris_en (accessed on 8 March 2020).
- Harrison, D.P. Sorption-Enhanced Hydrogen Production: A Review. Ind. Eng. Chem. Res. 2008, 47, 6486–6501. [Google Scholar] [CrossRef]
- Jain, S.; Jain, S.; Wolf, I.T.; Lee, J.; Tong, Y.W. A comprehensive review on operating parameters and different pretreatment methodologies for anaerobic digestion of municipal solid waste. Renew. Sustain. Energy Rev. 2015, 52, 142–154. [Google Scholar] [CrossRef]
- Ryckebosch, E.; Drouillon, M.; Vervaeren, H. Techniques for transformation of biogas to biomethane. Biomass Bioenergy 2011, 35, 1633–1645. [Google Scholar] [CrossRef]
- EBA—European Biomass Association. EBA Biomethane & Biogas Report 2015. 2015. Available online: http://european-biogas.eu/2015/12/16/biogasreport2015/ (accessed on 8 March 2020).
- Favre, E. Carbon dioxide recovery from post-combustion processes: Can gas permeation membranes compete with absorption? J. Memb. Sci. 2007, 294, 50–59. [Google Scholar] [CrossRef]
- Khan, I.U.; Othman, M.H.D.; Hashim, H.; Matsuura, T.; Ismail, A.F.; Rezaei-DashtArzhandi, M.; Azelee, I.W. Biogas as a renewable energy fuel—A review of biogas upgrading, utilisation and storage. Energy Convers. Manag. 2017, 150, 277–294. [Google Scholar] [CrossRef]
- Tuinier, M.J.; van Sint Annaland, M.; Kramer, G.J.; Kuipers, J.A.M. Cryogenic CO2 capture using dynamically operated packed beds. Chem. Eng. Sci. 2010, 65, 114–119. [Google Scholar] [CrossRef]
- Olajire, A.A. CO2 capture and separation technologies for end-of-pipe applications—A review. Energy 2010, 35, 2610–2628. [Google Scholar] [CrossRef]
- Mondal, M.K.; Balsora, H.K.; Varshney, P. Progress and trends in CO2 capture/separation technologies: A review. Energy 2012, 46, 431–441. [Google Scholar] [CrossRef]
- Haefeli, S.; Bosi, M.; Philibert, C. Carbon Dioxide Capture and Storage Issues. Accounting and Baselines under the United Nations Framework Convention on Climate Change (UNFCCC). IEA Information Paper. Available online: https://www.osti.gov/etdeweb/biblio/20543208 (accessed on 8 March 2020).
- Quintella, C.M.; Hatimondi, S.A.; Musse, A.P.S.; Miyazaki, S.F.; Cerqueira, G.S.; De Araujo Moreira, A. CO2 capture technologies: An overview with technology assessment based on patents and articles. Energy Procedia 2011, 4, 2050–2057. [Google Scholar] [CrossRef]
- Zhao, Z.; Cui, X.; Ma, J.; Li, R. Adsorption of carbon dioxide on alkali-modified zeolite 13X adsorbents. Int. J. Greenh. Gas. Control 2007, 1, 355–359. [Google Scholar] [CrossRef]
- Liu, Y.; Lin, X.; Wu, X.; Liu, M.; Shi, R.; Yu, X. Pentaethylenehexamine loaded SBA-16 for CO2 capture from simulated flue gas. Powder Technol. 2017, 318, 186–192. [Google Scholar] [CrossRef]
- Ferella, F.; Puca, A.; Taglieri, G.; Rossi, L.; Gallucci, K. Separation of carbon dioxide for biogas upgrading to biomethane. J. Clean. Prod. 2017, 164, 1205–1218. [Google Scholar] [CrossRef]
- Dawson, R.; Cooper, A.I.; Adams, D.J. Chemical functionalization strategies for carbon dioxide capture in microporous organic polymers. Polym. Int. 2013, 62, 345–352. [Google Scholar] [CrossRef]
- Kenarsari, S.D.; Yang, D.; Jiang, G.; Zhang, S.; Wang, J.; Russell, A.G.; Weif, Q.; Fan, M. Review of recent advances in carbon dioxide separation and capture. RSC Adv. 2013, 3, 22739–22773. [Google Scholar] [CrossRef]
- Philibert, C. Technology Penetration and Capital Stock Turnover. Lessons from IEA Scenario Analysis. France. 2007. Available online: http://www.oecd.org/dataoecd/55/52/38523883.pdf (accessed on 8 March 2020).
- Chakravarti, S.; Gupta, A.; Hunek, B. Advanced Technology for the Capture of Carbon Dioxide from Flue Gases. In Proceedings of the First National Conference on Carbon Sequestration, Washington, DC, USA, 14–17 May 2001; U.S. Department of Energy National Energy Technology Laboratory: Washington, DC, USA, 2001; pp. 1–11. [Google Scholar] [CrossRef]
- IPCC. Carbon Dioxide Capture and Storage; Metz, B., Davidson, O., de Coninck, H., Loos, M., Meyer, L., Eds.; Cambridge University Press: New York, NY, USA, 2005; 431p, Available online: https://archive.ipcc.ch/pdf/special-reports/srccs/srccs_wholereport.pdf (accessed on 8 March 2020).
- Wang, M.; Lawal, A.; Stephenson, P.; Sidders, J.; Ramshaw, C. Post-combustion CO2 capture with chemical absorption: A state-of-the-art review. Chem. Eng. Res. Des. 2011, 89, 1609–1624. [Google Scholar] [CrossRef]
- Titirici, M.M.; White, R.J.; Falco, C.; Sevilla, M. Black perspectives for a green future: Hydrothermal carbons for environment protection and energy storage. Energy Environ. Sci. 2012, 5, 6796–6822. [Google Scholar] [CrossRef]
- Berge, N.D.; Ro, K.S.; Mao, J.; Flora, J.R.V.; Chappell, M.A.; Bae, S. Hydrothermal carbonization of municipal waste streams. Environ Sci. Technol. 2011, 45, 5696–5703. [Google Scholar] [CrossRef]
- Uddin, H.M.; Reza, M.T.; Lynam, J.G.; Coronella, J.C. Effects of Water Recycling in Hydrothermal Carbonization of Loblolly Pine. Environ. Prog. Sustain. 2013, 33, 1309–1315. [Google Scholar] [CrossRef]
- Stemann, J.; Ziegler, F. Hydrothermal Carbonisation (Htc): Recycling of Process Water. In Proceedings of the 19th European Biomass Conferences and Exhibition, Berlin, Germany, 6–10 June 2011. [Google Scholar]
- Gallifuoco, A.; Taglieri, L.; Scimia, F.; Papa, A.A.A.; Di Giacomo, G. Hydrothermal carbonization of Biomass: New experimental procedures for improving the industrial Processes. Bioresour Technol. 2017, 244, 160–165. [Google Scholar] [CrossRef]
- Gallifuoco, A.; Taglieri, L.; Papa, A.A.; Scimia, F.; Di Giacomo, G. Hydrothermal conversions of waste biomass: Assessment of kinetic models using liquid-phase electrical conductivity measurements. Waste Manag. 2018, 77, 586–592. [Google Scholar] [CrossRef] [PubMed]
- Mariscal, R.; Maireles-Torres, P.; Ojeda, M.; Sádaba, I.; López Granados, M. Furfural: A renewable and versatile platform molecule for the synthesis of chemicals and fuels. Energy Environ. Sci. 2016, 9, 1144–1189. [Google Scholar] [CrossRef]
- Centi, G.; Lanzafame, P.; Perathoner, S. Analysis of the alternative routes in the catalytic transformation of lignocellulosic materials. Catal. Today 2011, 167, 14–30. [Google Scholar] [CrossRef]
- Reza, M.T.; Andert, J.; Wirth, B.; Busch, D.; Pielert, J.; Lynam, J.G.; Mumme, J. Hydrothermal Carbonization of Biomass for Energy and Crop Production. Appl. Bioenergy 2014, 1, 11–29. [Google Scholar] [CrossRef]
- Kruse, A.; Funke, A.; Titirici, M.M. Hydrothermal conversion of biomass to fuels and energetic materials. Curr. Opin. Chem. Biol. 2013, 17, 515–521. [Google Scholar] [CrossRef] [PubMed]
- Román, S.; Valente Nabais, J.M.; Ledesma, B.; González, J.F.; Laginhas, C.; Titirici, M.M. Production of low-cost adsorbents with tunable surface chemistry by conjunction of hydrothermal carbonization and activation processes. Microporous Mesoporous Mater. 2013, 165, 127–133. [Google Scholar] [CrossRef]
- Sevilla, M.; Fuertes, A.B. Sustainable porous carbons with a superior performance for CO2 capture. Energy Environ. Sci. 2011, 4, 1765–1771. [Google Scholar] [CrossRef]
- Farjon, A. Abies alba. The IUCN Red List of Threatened Species 2017: E.T42270A83978869. Available online: https://www.iucnredlist.org/species/42270/83978869 (accessed on 2 March 2020).
- Brunauer, S.; Emmett, P.H.; Teller, E. Adsorption of Gases in Multimolecular Layers. J. Am. Chem. Soc. 1938, 60, 309–319. [Google Scholar] [CrossRef]
- Barrett, E.P.; Joyner, L.G.; Halenda, P.P. The Determination of Pore Volume and Area Distributions in Porous Substances. I. Computations from Nitrogen Isotherms. J. Am. Chem. Soc. 1951, 73, 373–380. [Google Scholar] [CrossRef]
- Thommes, M.; Kaneko, K.; Neimark, A.V.; Olivier, J.P.; Rodriguez-Reinoso, F.; Rouquerol, J.; Sing, K.S.W. Physisorption of gases, with special reference to the evaluation of surface area and pore size distribution (IUPAC Technical Report). Pure Appl. Chem. 2015, 87, 1051–1069. [Google Scholar] [CrossRef]
- Di Felice, L.; Foscolo, P.; Gibilaro, L.G. CO2 capture by dolomite particles in a gas fluidized bed: Experimental Data and Numerical Simulations. Int. J. Chem. React. Eng. 2011, 9, 1542–6580. [Google Scholar] [CrossRef]
- Ruayruay, W.; Khongtong, S. Impregnation of Natural Rubber into Rubber Wood: A Green Wood Composite. BioResources 2014, 9. [Google Scholar] [CrossRef]
- Rackley, S.A. 7-Adsorption capture systems. In Carbon Capture and Storage, 2nd ed.; Rackley, S.A., Ed.; Butterworth-Heinemann: Oxford, UK, 2017; ISBN 9780128120415. [Google Scholar] [CrossRef]
- Kikkinides, E.S.; Yang, R.T.; Cho, S.H. Concentration and recovery of carbon dioxide from flue gas by pressure swing adsorption. Ind. Eng. Chem. Res. 1993, 32, 2714–2720. [Google Scholar] [CrossRef]
- Przepiórski, J.; Skrodzewicz, M.; Morawski, A. High temperature ammonia treatment of activated carbon for enhancement of CO2 adsorption. Appl. Surf. Sci. 2004, 225, 235–242. [Google Scholar] [CrossRef]
- Meng, L.-Y.; Park, S.-J. Effect of heat treatment on CO2 adsorption of KOH-activated graphite nanofibers. J. Colloid Interface Sci. 2010, 352, 498–503. [Google Scholar] [CrossRef]
- Pevida, C.; Drage, T.C.; Snape, C.E. Silica-templated melamine–formaldehyde resin derived adsorbents for CO2 capture. Carbon 2008, 46, 1464–1474. [Google Scholar] [CrossRef]
- Plaza, M.G.; Pevida, C.; Arias, B.; Fermoso, J.; Rubiera, F.; Pis, J.J. A comparison of two methods for producing CO2 capture adsorbents. Energy Procedia 2009, 1, 1107–1113. [Google Scholar] [CrossRef]
- Hao, G.-P.; Li, W.-C.; Qian, D.; Lu, A.-H. Rapid Synthesis of Nitrogen-Doped Porous Carbon Monolith for CO2 Capture. Adv. Mater. 2010, 22, 853–857. [Google Scholar] [CrossRef]
- Wahby, A.; Ramos-Fernández, J.M.; Martínez-Escandell, M.; Sepúlveda-Escribano, A.; Silvestre-Albero, J.; Rodríguez-Reinoso, F. High-Surface-Area Carbon Molecular Sieves for Selective CO2 Adsorption. ChemSusChem 2010, 3, 974–981. [Google Scholar] [CrossRef]


| Test | Hydrothermal Conditions | Adsorption Conditions | Activation | |
|---|---|---|---|---|
| Time [min] | P [bar] | WBED [g] | ||
| CO2/N2 | ||||
| HC_200_120_2 | 120 | 2 | 1.135 | no |
| HC_200_120_3 | 120 | 3 | 1.135 | no |
| HC_200_120_4 | 120 | 4 | 1.135 | no |
| HC_200_120_5 | 120 | 5 | 1.135 | no |
| HCA_200_0_2 | 0 | 2 | 0.695 | yes |
| HCA_200_0_3 | 0 | 3 | 0.695 | yes |
| HCA_200_0_4 | 0 | 4 | 0.695 | yes |
| HCA_200_0_5 | 0 | 5 | 0.695 | yes |
| HCA_200_120_2 | 120 | 2 | 1.135 | yes |
| HCA_200_120_3 | 120 | 3 | 1.135 | yes |
| HCA_200_120_4 | 120 | 4 | 1.135 | yes |
| HCA_200_120_5 | 120 | 5 | 1.135 | yes |
| CO2/CH4 | ||||
| HCA_200_0_2 | 0 | 2 | 0.695 | yes |
| HCA_200_0_5 | 0 | 5 | 0.695 | yes |
| Sample Parameters | Surface Area (ABET) [m2/g] | BJH Desorption Pore Volume (VBJH) [cm3/g] | Average Diameter of the Pores (Dav,BJH) [Å] |
|---|---|---|---|
| HC_200_0 | 1.13 | 0.004 | 142 |
| HCA_200_0 | 881 | 0.241 | 11 |
| HC_200_120 | 1.33 | 0.008 | 241 |
| HCA_200_120 | 284 | 0.109 | 15 |
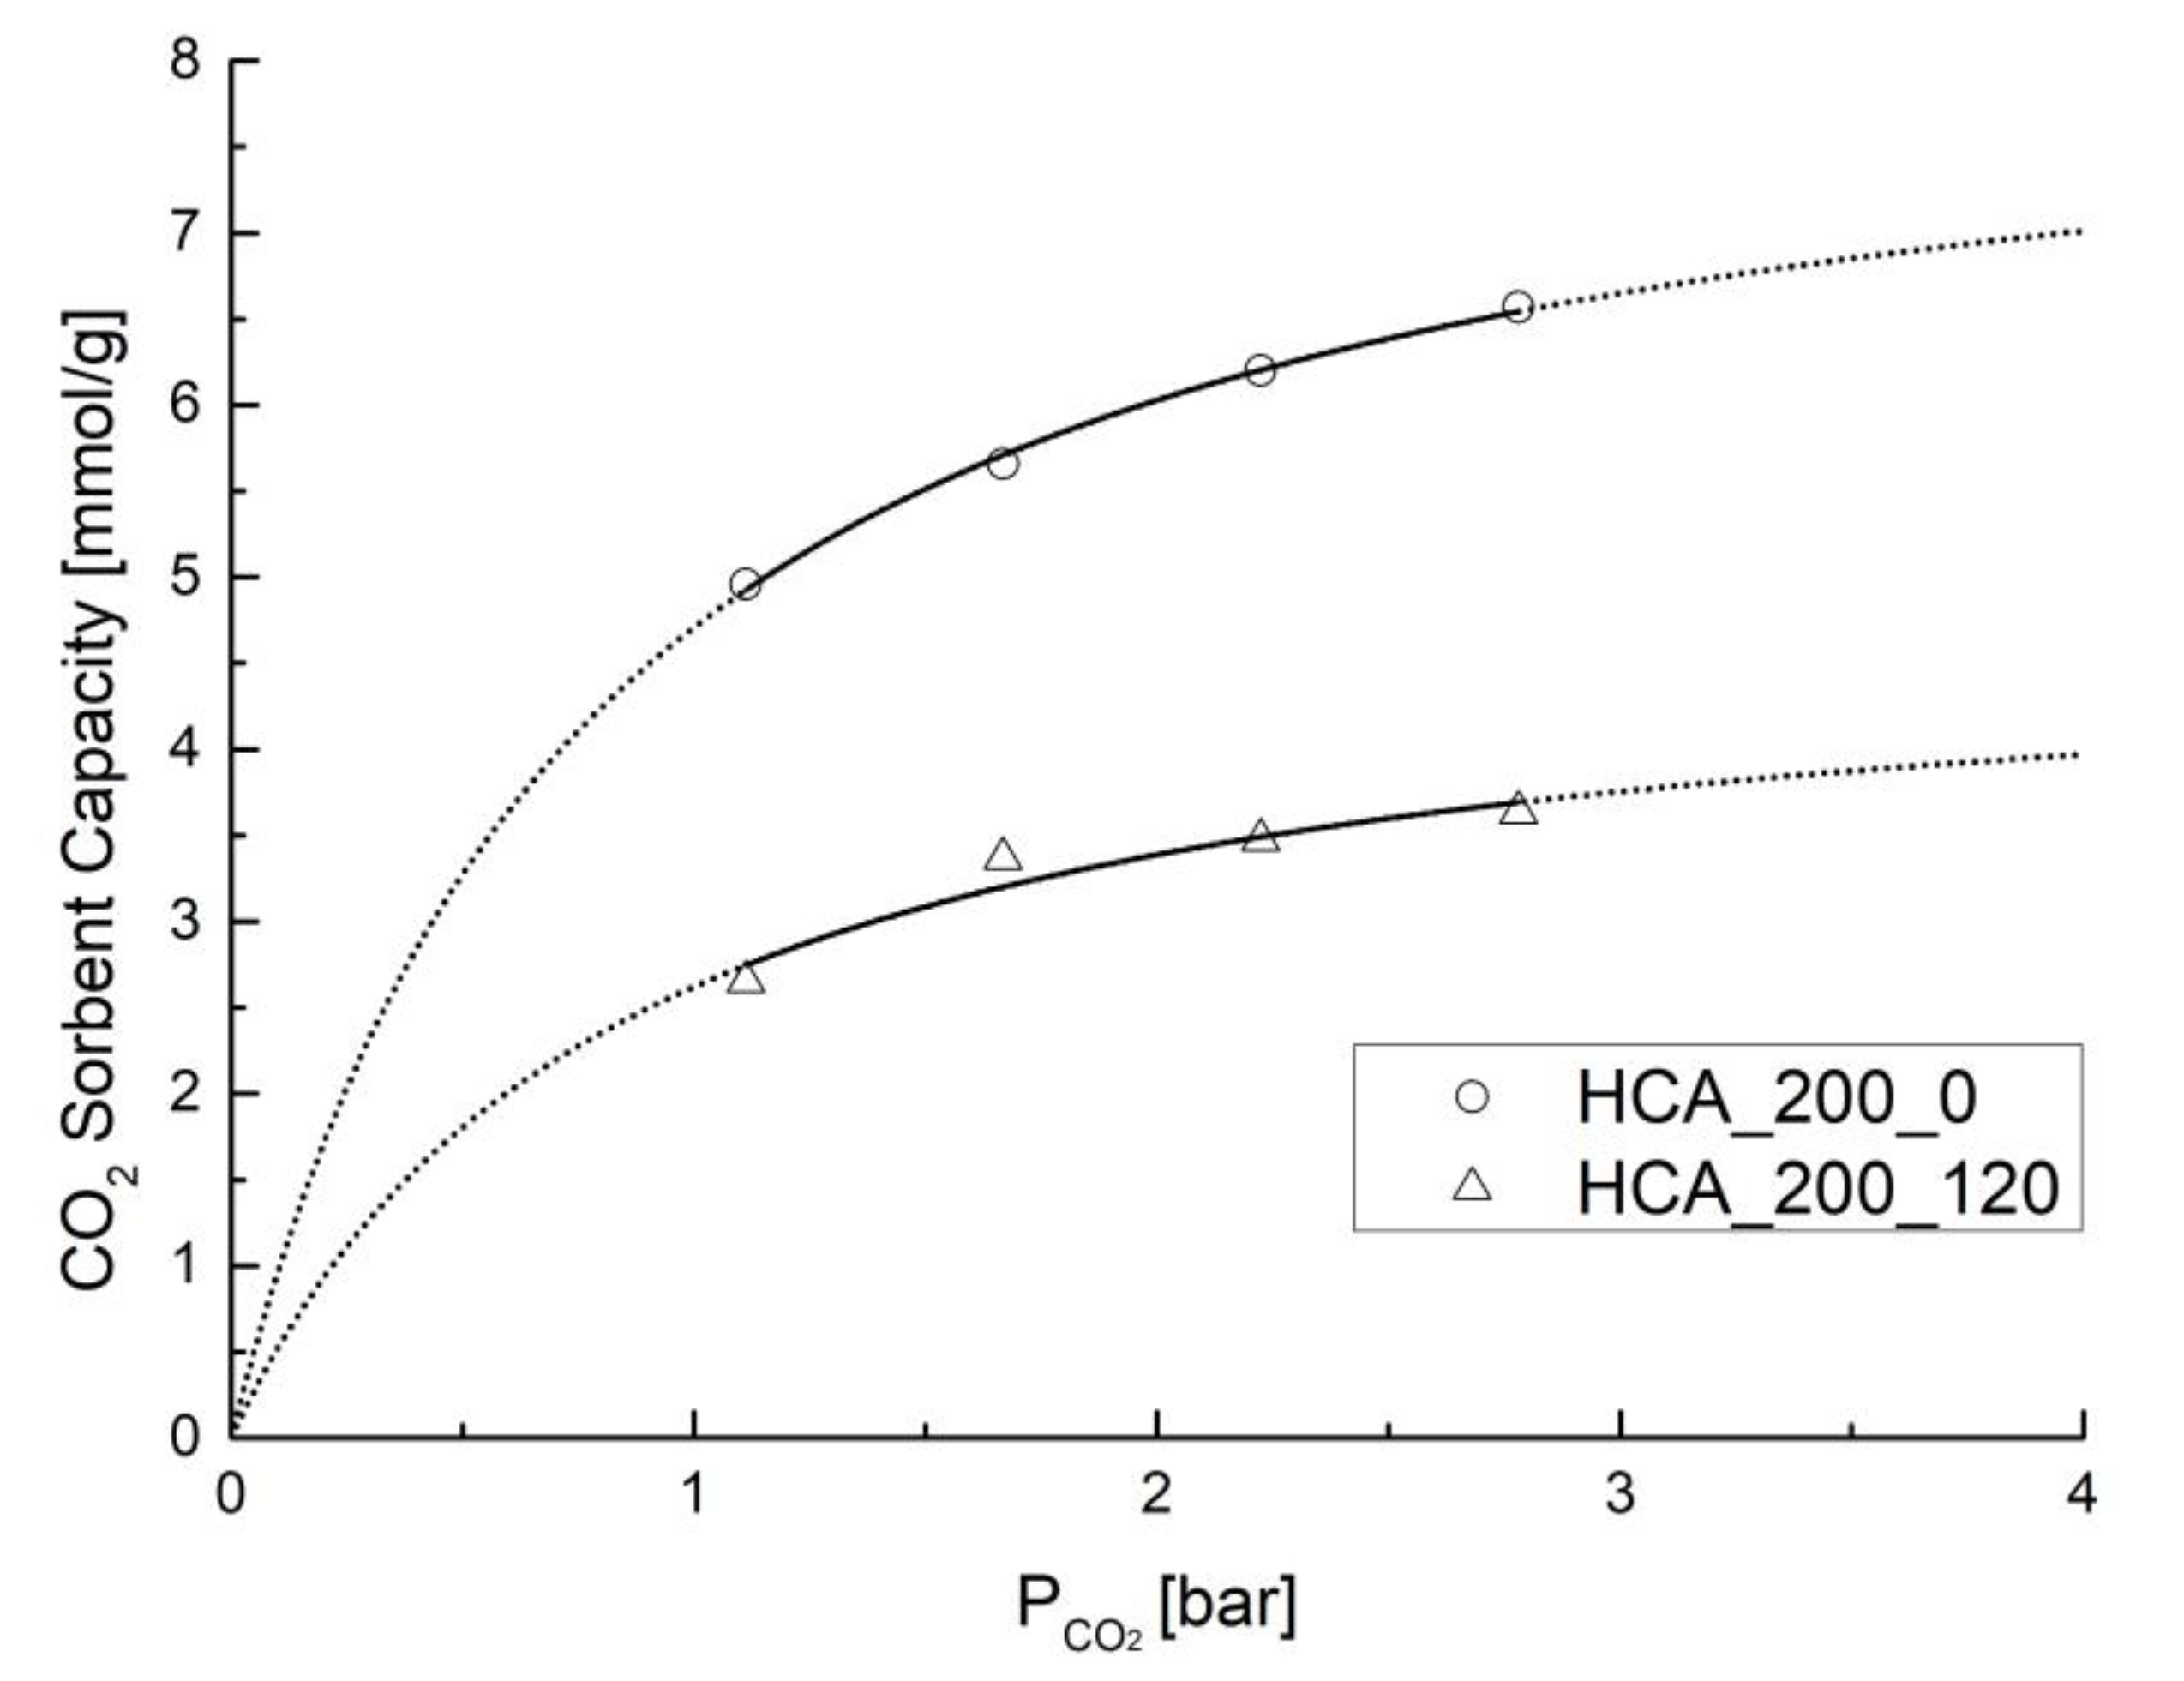
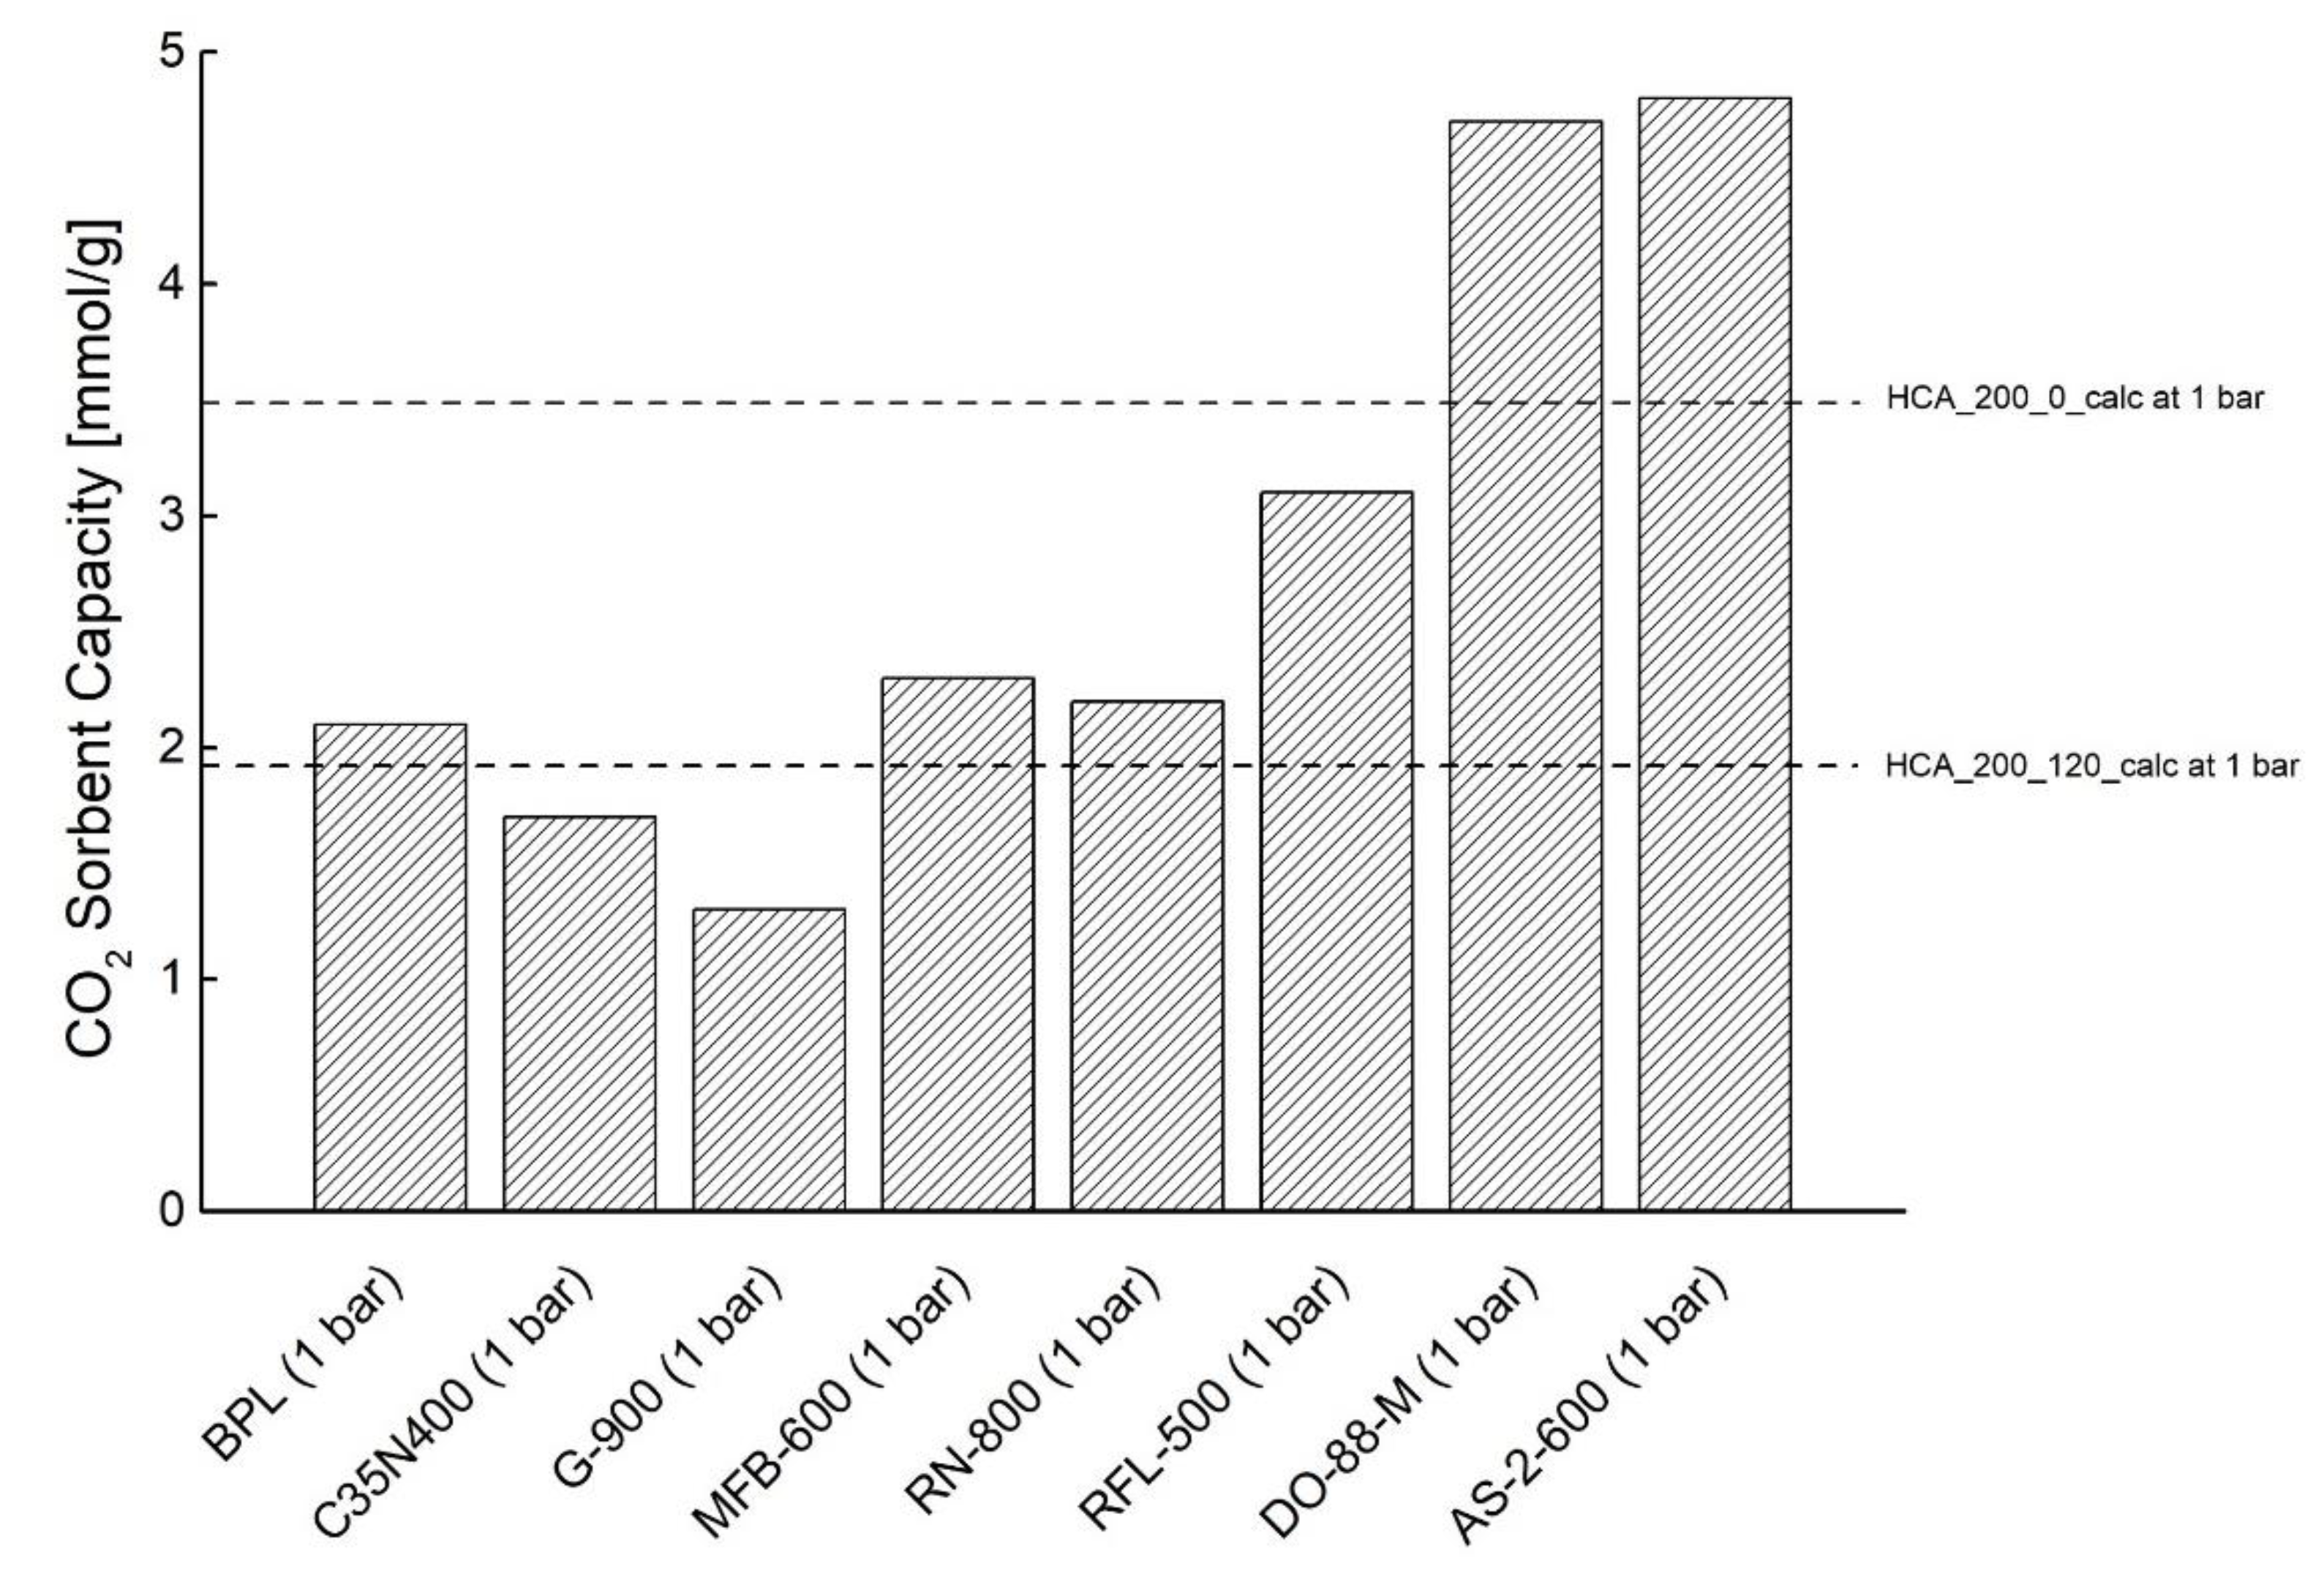
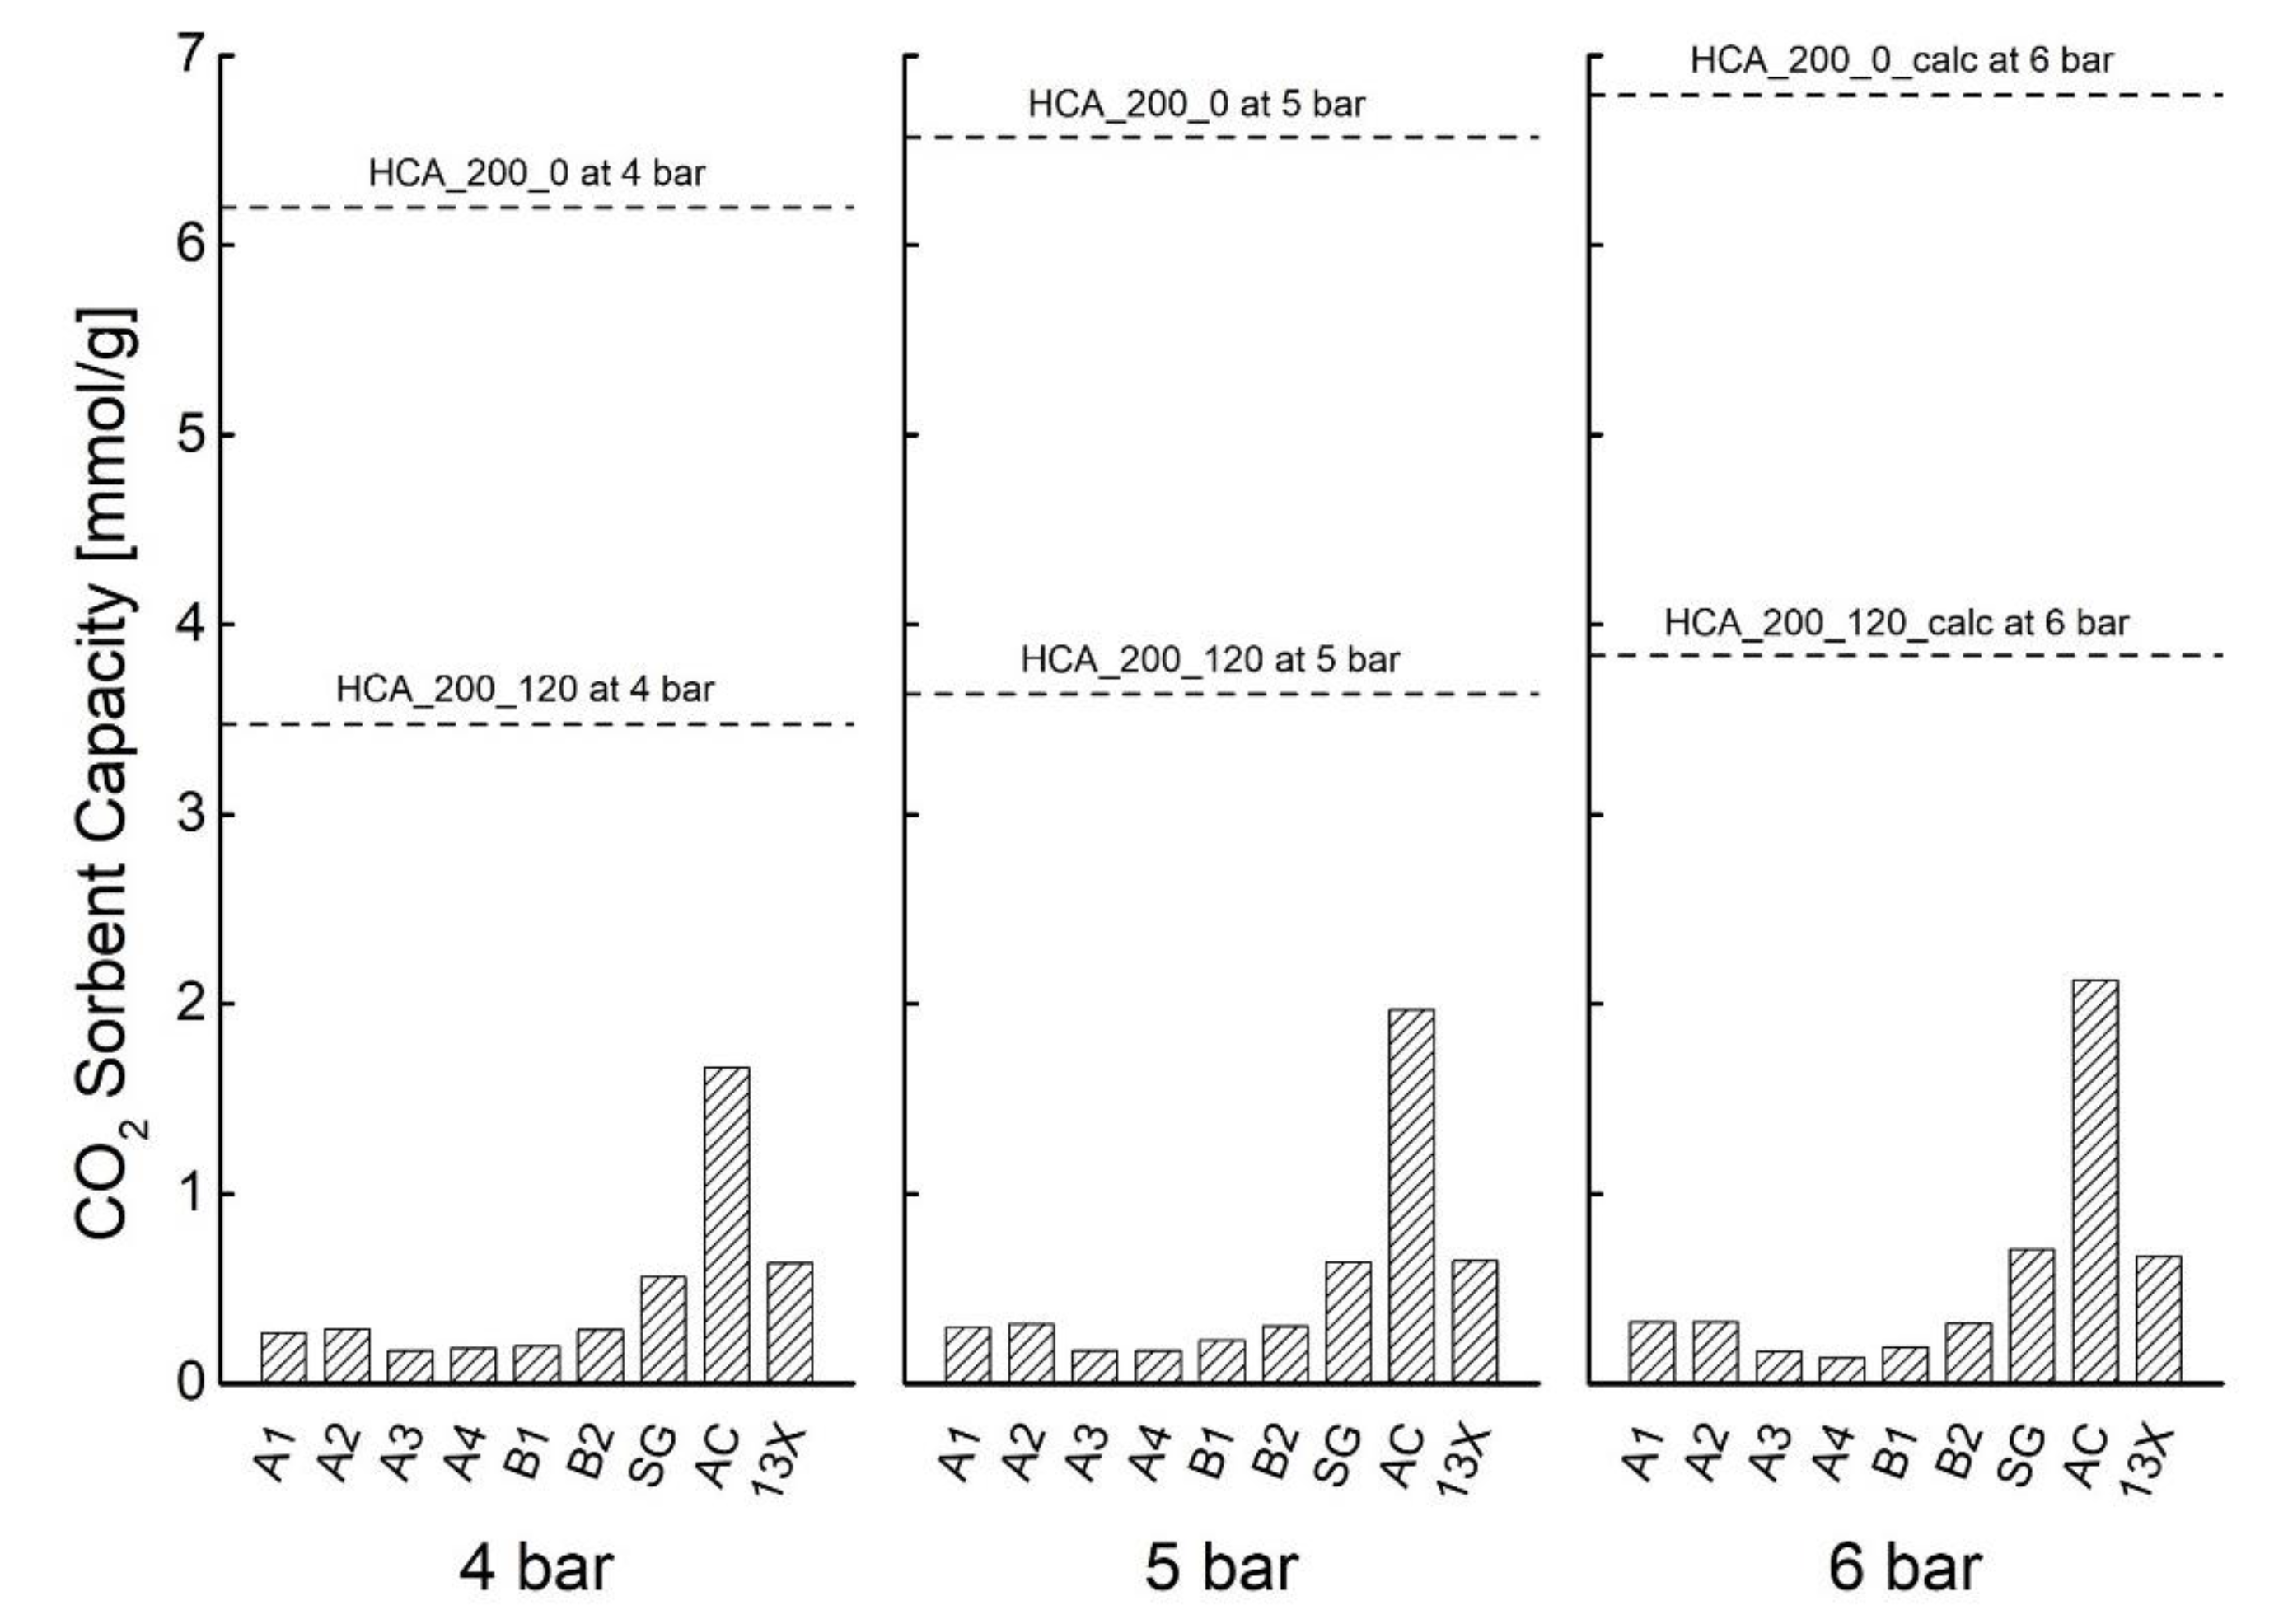
| Sample | TEST | P [bar] | Sorbent Capacity * [mmol/g] |
|---|---|---|---|
| HC_200_120 | CO2/N2 | 2 | 0.335 ± 0.129 |
| 3 | 0.425 ± 0.181 | ||
| 4 | 0.688 ± 0.210 | ||
| 5 | 0.692 ± 0.228 | ||
| HCA_200_120 | CO2/N2 | 2 | 2.651 ± 0.225 |
| 3 | 3.366 ± 0.292 | ||
| 4 | 3.475 ± 0.368 | ||
| 5 | 3.635 ± 0.268 | ||
| HCA_200_0 | CO2/N2 | 2 | 4.957 ± 0.952 |
| 3 | 5.658 ± 0.070 | ||
| 4 | 6.199 ± 0.081 | ||
| 5 | 6.569 ± 0.119 |
| Sample | TEST | P [bar] | Recovery (Purity = 95%) [%] | Recovery (Purity = 70%) [%] | Selectivity |
|---|---|---|---|---|---|
| HCA_200_0 | CO2/CH4 | 2 | 31.98 ± 0.13 | 60.12 ± 0.35 | 1.88 ± 0.02 |
| 5 | 36.09 ± 0.87 | 68.11 ± 0.10 | 2.10 ± 0.02 |
| CMax | K | R2 | |
|---|---|---|---|
| HCA_200_0 | 8.38 ± 0.15 | 0.77 ± 0.05 | 0.99 |
| HCA_200_120 | 4.79 ± 0.45 | 0.83 ± 0.26 | 0.90 |
© 2020 by the authors. Licensee MDPI, Basel, Switzerland. This article is an open access article distributed under the terms and conditions of the Creative Commons Attribution (CC BY) license (http://creativecommons.org/licenses/by/4.0/).
Share and Cite
Gallucci, K.; Taglieri, L.; Papa, A.A.; Di Lauro, F.; Ahmad, Z.; Gallifuoco, A. Non-Energy Valorization of Residual Biomasses via HTC: CO2 Capture onto Activated Hydrochars. Appl. Sci. 2020, 10, 1879. https://doi.org/10.3390/app10051879
Gallucci K, Taglieri L, Papa AA, Di Lauro F, Ahmad Z, Gallifuoco A. Non-Energy Valorization of Residual Biomasses via HTC: CO2 Capture onto Activated Hydrochars. Applied Sciences. 2020; 10(5):1879. https://doi.org/10.3390/app10051879
Chicago/Turabian StyleGallucci, Katia, Luca Taglieri, Alessandro Antonio Papa, Francesco Di Lauro, Zaheer Ahmad, and Alberto Gallifuoco. 2020. "Non-Energy Valorization of Residual Biomasses via HTC: CO2 Capture onto Activated Hydrochars" Applied Sciences 10, no. 5: 1879. https://doi.org/10.3390/app10051879
APA StyleGallucci, K., Taglieri, L., Papa, A. A., Di Lauro, F., Ahmad, Z., & Gallifuoco, A. (2020). Non-Energy Valorization of Residual Biomasses via HTC: CO2 Capture onto Activated Hydrochars. Applied Sciences, 10(5), 1879. https://doi.org/10.3390/app10051879