A Machine-Learning Model Based on Morphogeometric Parameters for RETICS Disease Classification and GUI Development


Abstract
Featured Application
Abstract
1. Introduction
2. Materials and Methods
2.1. Patients
2.2. Methods
2.3. Statistical Analysis
3. Results
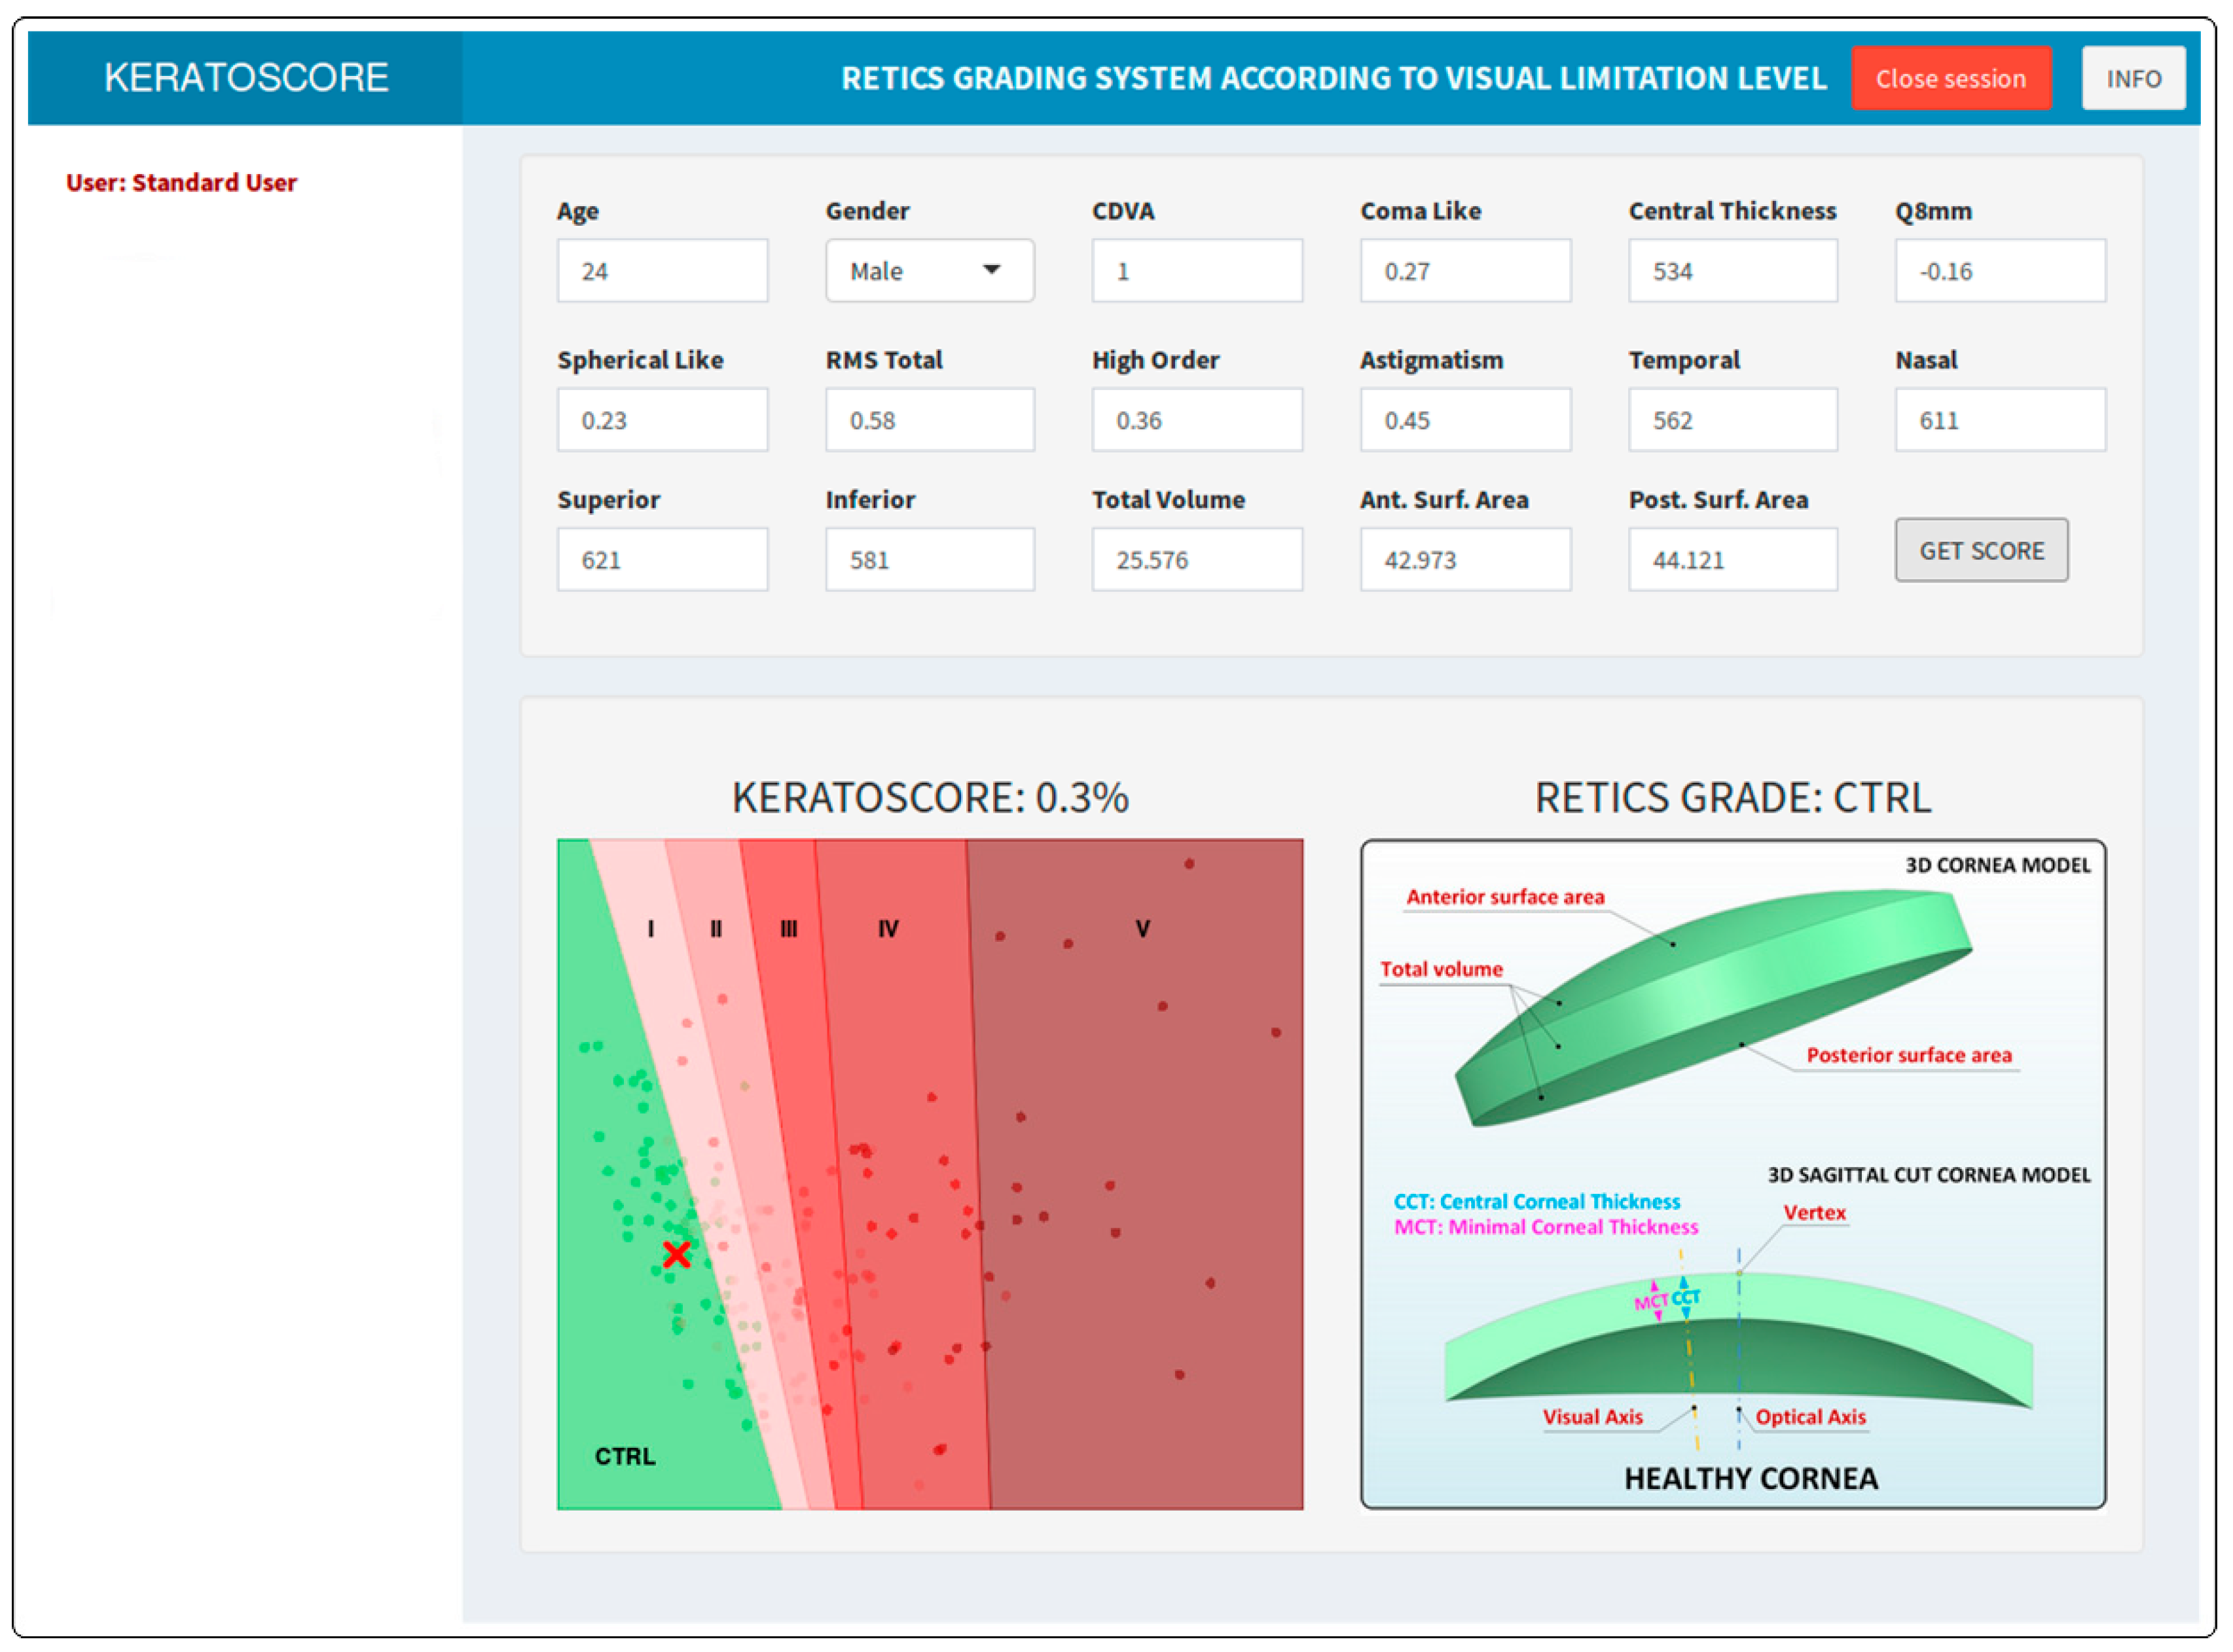
Graphics User Interface
4. Discussion
5. Conclusions
Author Contributions
Funding
Conflicts of Interest
References
- Pinero, D.P. Technologies for Anatomical and Geometric Characterization of the Corneal Structure and Anterior Segment: A Review; Informa Healthcare: London, UK, 2015; pp. 161–170. [Google Scholar]
- Cavas-Martínez, F.; Bataille, L.; Fernández-Pacheco, D.G.; Cañavate, F.J.F.; Alio, J.L. Keratoconus detection based on a new corneal volumetric analysis. Sci. Rep. 2017, 7, 15837. [Google Scholar] [CrossRef] [PubMed]
- Wisse, R.P.L.; Simons, R.W.P.; van der Vossen, M.J.B.; Muijzer, M.B.; Soeters, N.; Nuijts, R.M.M.A.; Godefrooij, D.A. Clinical Evaluation and Validation of the Dutch Crosslinking for Keratoconus Score. JAMA Ophthalmol. 2019, 137, 610–616. [Google Scholar] [CrossRef] [PubMed]
- Binder, P.S. Risk factors for ectasia after LASIK. J. Cataract Refract. Surg. 2008, 34, 2010–2011. [Google Scholar] [CrossRef]
- Binder, P.S.; Trattler, W.B. Evaluation of a risk factor scoring system for corneal ectasia after LASIK in eyes with normal topography. J. Refract. Surg. 2010, 26, 241–250. [Google Scholar] [CrossRef]
- Chan, C.; Ang, M.; Saad, A.; Chua, D.; Mejia, M.; Lim, L.; Gatinel, D. Validation of an Objective Scoring System for Forme Fruste Keratoconus Detection and Post-LASIK Ectasia Risk Assessment in Asian Eyes. Cornea 2015, 34, 996–1004. [Google Scholar] [CrossRef]
- Hwang, E.S.; Perez-Straziota, C.E.; Kim, S.W.; Santhiago, M.R.; Randleman, J.B. Distinguishing Highly Asymmetric Keratoconus Eyes Using Combined Scheimpflug and Spectral-Domain OCT Analysis. Ophthalmology 2018, 125, 1862–1871. [Google Scholar] [CrossRef]
- Randleman, J.B.; Woodward, M.; Lynn, M.J.; Stulting, R.D. Risk assessment for ectasia after corneal refractive surgery. Ophthalmology 2008, 115, 37–50. [Google Scholar] [CrossRef]
- Saad, A.; Gatinel, D. Topographic and tomographic properties of forme fruste keratoconus corneas. Investig. Ophthalmol. Vis. Sci. 2010, 51, 5546–5555. [Google Scholar] [CrossRef]
- Seiler, T.; Quurke, A.W. Iatrogenic keratectasia after LASIK in a case of forme fruste keratoconus. J. Cataract Refract. Surg. 1998, 24, 1007–1009. [Google Scholar] [CrossRef]
- Cavas-Martinez, F.; De la Cruz Sanchez, E.; Nieto Martinez, J.; Fernandez Canavate, F.J.; Fernandez-Pacheco, D.G. Corneal topography in keratoconus: State of the art. Eye Vis. 2016, 3, 5. [Google Scholar] [CrossRef] [PubMed]
- Awad, E.A.; Abou Samra, W.A.; Torky, M.A.; El-Kannishy, A.M. Objective and subjective diagnostic parameters in the fellow eye of unilateral keratoconus. BMC Ophthalmol. 2017, 17, 186. [Google Scholar] [CrossRef] [PubMed]
- Bae, G.H.; Kim, J.R.; Kim, C.H.; Lim, D.H.; Chung, E.S.; Chung, T.Y. Corneal topographic and tomographic analysis of fellow eyes in unilateral keratoconus patients using Pentacam. Am. J. Ophthalmol. 2014, 157, 103–109. [Google Scholar] [CrossRef] [PubMed]
- De Sanctis, U.; Loiacono, C.; Richiardi, L.; Turco, D.; Mutani, B.; Grignolo, F.M. Sensitivity and specificity of posterior corneal elevation measured by Pentacam in discriminating keratoconus/subclinical keratoconus. Ophthalmology 2008, 115, 1534–1539. [Google Scholar] [CrossRef]
- Li, Y.; Chamberlain, W.; Tan, O.; Brass, R.; Weiss, J.L.; Huang, D. Subclinical keratoconus detection by pattern analysis of corneal and epithelial thickness maps with optical coherence tomography. J. Cataract Refract. Surg. 2016, 42, 284–295. [Google Scholar] [CrossRef] [PubMed]
- Reddy, J.C.; Rapuano, C.J.; Cater, J.R.; Suri, K.; Nagra, P.K.; Hammersmith, K.M. Comparative evaluation of dual Scheimpflug imaging parameters in keratoconus, early keratoconus, and normal eyes. J. Cataract Refract. Surg. 2014, 40, 582–592. [Google Scholar] [CrossRef]
- Randleman, J.B.; Lynn, M.J.; Perez-Straziota, C.E.; Weissman, H.M.; Kim, S.W. Comparison of central and peripheral corneal thickness measurements with scanning-slit, Scheimpflug and Fourier-domain ocular coherence tomography. Br. J. Ophthalmol. 2015, 99, 1176–1181. [Google Scholar] [CrossRef]
- Reinstein, D.Z.; Archer, T.J.; Urs, R.; Gobbe, M.; RoyChoudhury, A.; Silverman, R.H. Detection of Keratoconus in Clinically and Algorithmically Topographically Normal Fellow Eyes Using Epithelial Thickness Analysis. J. Refract. Surg. 2015, 31, 736–744. [Google Scholar] [CrossRef]
- Savini, G.; Carbonelli, M.; Sbreglia, A.; Barboni, P.; Deluigi, G.; Hoffer, K.J. Comparison of anterior segment measurements by 3 Scheimpflug tomographers and 1 Placido corneal topographer. J. Cataract Refract. Surg. 2011, 37, 1679–1685. [Google Scholar] [CrossRef]
- Shajari, M.; Jaffary, I.; Herrmann, K.; Grunwald, C.; Steinwender, G.; Mayer, W.J.; Kohnen, T. Early tomographic changes in the eyes of patients with keratoconus. J. Refract. Surg. 2018, 34, 254–259. [Google Scholar] [CrossRef]
- Li, X.; Rabinowitz, Y.S.; Rasheed, K.; Yang, H. Longitudinal study of the normal eyes in unilateral keratoconus patients. Ophthalmology 2004, 111, 440–446. [Google Scholar] [CrossRef]
- Ferdi, A.C.; Nguyen, V.; Gore, D.M.; Allan, B.D.; Rozema, J.J.; Watson, S.L. Keratoconus Natural Progression: A Systematic Review and Meta-analysis of 11 529 Eyes. Ophthalmology 2019, 126, 935–945. [Google Scholar] [CrossRef] [PubMed]
- Alio, J.L.; Pinero, D.P.; Aleson, A.; Teus, M.A.; Barraquer, R.I.; Murta, J.; Maldonado, M.J.; Castro de Luna, G.; Gutierrez, R.; Villa, C.; et al. Keratoconus-integrated characterization considering anterior corneal aberrations, internal astigmatism, and corneal biomechanics. J. Cataract Refract. Surg. 2011, 37, 552–568. [Google Scholar] [CrossRef]
- Martinez-Abad, A.; Pinero, D.P. New perspectives on the detection and progression of keratoconus. J. Cataract Refract. Surg. 2017, 43, 1213–1227. [Google Scholar] [CrossRef]
- Romero-Jimenez, M.; Santodomingo-Rubido, J.; Wolffsohn, J.S. Keratoconus: A review. Cont. Lens Anterior Eye 2010, 33, 157–166. [Google Scholar] [CrossRef]
- Belin, M.W.; Duncan, J.K. Keratoconus: The ABCD Grading System. Klin. Mon. Augenheilkd. 2016, 233, 701–707. [Google Scholar] [CrossRef] [PubMed]
- Alio, J.L.; Shabayek, M.H. Corneal higher order aberrations: A method to grade keratoconus. J. Refract. Surg. 2006, 22, 539–545. [Google Scholar] [CrossRef] [PubMed]
- Smadja, D. Topographic and tomographic indices for detecting keratoconus and subclinical keratoconus: A systematic review. Int. J. Keratoconus Ect. Corneal Dis. 2013, 2, 60. [Google Scholar] [CrossRef]
- McMahon, T.T.; Szczotka-Flynn, L.; Barr, J.T.; Anderson, R.J.; Slaughter, M.E.; Lass, J.H.; Iyengar, S.K. A new method for grading the severity of keratoconus: The Keratoconus Severity Score (KSS). Cornea 2006, 25, 794–800. [Google Scholar] [CrossRef] [PubMed]
- Kanellopoulos, A.J.; Asimellis, G. Revisiting keratoconus diagnosis and progression classification based on evaluation of corneal asymmetry indices, derived from scheimpflug imaging in keratoconic and suspect cases. Clin. Ophthalmol. 2013, 7, 1539–1548. [Google Scholar] [CrossRef]
- Krumeich, J.H.; Daniel, J.; Knülle, A. Live-epikeratophakia for keratoconus. J. Cataract Refract. Surg. 1998, 24, 456–463. [Google Scholar] [CrossRef]
- Vega-Estrada, A.; Alio, J.L.; Brenner, L.F.; Javaloy, J.; Plaza Puche, A.B.; Barraquer, R.I.; Teus, M.A.; Murta, J.; Henriques, J.; Uceda-Montanes, A. Outcome analysis of intracorneal ring segments for the treatment of keratoconus based on visual, refractive, and aberrometric impairment. Am. J. Ophthalmol. 2013, 155, 575–584.e571. [Google Scholar] [CrossRef] [PubMed]
- Huseynli, S.; Salgado-Borges, J.; Alio, J.L. Comparative evaluation of Scheimpflug tomography parameters between thin non-keratoconic, subclinical keratoconic, and mild keratoconic corneas. Eur. J. Ophthalmol. 2018, 28, 521–534. [Google Scholar] [CrossRef] [PubMed]
- Cavas-Martinez, F.; Fernandez-Pacheco, D.G.; De la Cruz-Sanchez, E.; Nieto Martinez, J.; Fernandez Canavate, F.J.; Vega-Estrada, A.; Plaza-Puche, A.B.; Alio, J.L. Geometrical custom modeling of human cornea in vivo and its use for the diagnosis of corneal ectasia. PLoS ONE 2014, 9, e110249. [Google Scholar] [CrossRef] [PubMed]
- Cavas-Martínez, F.; Fernández-Pacheco, D.; Cañavate, F.; Velázquez-Blázquez, J.; Bolarín, J.; Alió, J. Study of Morpho-Geometric Variables to Improve the Diagnosis in Keratoconus with Mild Visual Limitation. Symmetry 2018, 10, 306. [Google Scholar] [CrossRef]
- Cavas-Martinez, F.; Fernandez-Pacheco, D.G.; Cañavate, F.J.F.; Velázquez-Blázquez, J.S.; Bolarin, J.M.; Tiveron, M.; Alio, J.L. Detección del queratocono temprano mediante modelado 3D personalizado y análisis de sus parámetros geométricos. DYNA Ing. Ind. 2019, 2, 175–181. [Google Scholar]
- Cavas-Martínez, F.; Fernández-Pacheco, D.G.; Parras, D.; Cañavate, F.J.F.; Bataille, L.; Alió, J. Study and characterization of morphogeometric parameters to assist diagnosis of keratoconus. Biomed. Eng. Online 2018, 17, 161. [Google Scholar] [CrossRef]
- Efron, B.; Tibshirani, R. Improvements on cross-validation: The 632+ bootstrap method. J. Am. Stat. Assoc. 1997, 92, 548–560. [Google Scholar]
- R Core Team. R: A Language and Environment for Statistical Computing. Available online: https://www.R-project.org/ (accessed on 6 January 2020).
- Aberson, C.L. Applied Power Analysis for the Behavioral Sciences, 2nd ed.; Taylor & Francis: Abingdon, UK, 2019. [Google Scholar]
- Demidenko, E. Sample size determination for logistic regression revisited. Stat. Med. 2007, 26, 3385–3397. [Google Scholar] [CrossRef]
- Chang, W.; Cheng, J.; Allaire, J.; Xie, Y.; Jonathan, M. Shiny: Web Application Framework for R. R Package Version 1.3.2. Available online: https://CRAN.R-project.org/package=shiny (accessed on 6 January 2020).
- Campbell, P. Shinyauthr: Shiny Authentication Modules. R Package Version 0.0.99. Available online: https://rdrr.io/github/PaulC91/shinyauthr/ (accessed on 6 January 2020).
- Yousefi, S.; Yousefi, E.; Takahashi, H.; Hayashi, T.; Tampo, H.; Inoda, S.; Arai, Y.; Asbell, P. Keratoconus severity identification using unsupervised machine learning. PLoS ONE 2018, 13, e0205998. [Google Scholar] [CrossRef]
- Lavric, A.; Valentin, P. KeratoDetect: Keratoconus Detection Algorithm Using Convolutional Neural Networks. Comput. Intell. Neurosci. 2019, 2019, 9. [Google Scholar] [CrossRef]
- Larrosa, J.M.; Moreno-Montañés, J.; Martinez-de-la-Casa, J.M.; Polo, V.; Velázquez-Villoria, Á.; Berrozpe, C.; García-Granero, M. A Diagnostic Calculator for Detecting Glaucoma on the Basis of Retinal Nerve Fiber Layer, Optic Disc, and Retinal Ganglion Cell Analysis by Optical Coherence TomographyDiagnostic Calculator of OCT for Detecting Glaucoma. Investig. Ophthalmol. Vis. Sci. 2015, 56, 6788–6795. [Google Scholar] [CrossRef][Green Version]
- Moreno-Montañés, J.; García-Nieva, A.; Osio, I.A.; Guarnieri, A.; Morilla-Grasa, A.; García-Granero, M.; Antón, A. Evaluation of RETICs Glaucoma Diagnostic Calculators in Preperimetric Glaucoma. Transl. Vis. Sci. Technol. 2018, 7, 13. [Google Scholar] [CrossRef] [PubMed]
- Schmidl, D.; Garhöfer, G.; Schmetterer, L. A New Scoring System for Progressive Keratoconus. JAMA Ophthalmol. 2019, 137, 617. [Google Scholar] [CrossRef] [PubMed]
- Lin, S.R.; Ladas, J.G.; Bahadur, G.G.; Al-Hashimi, S.; Pineda, R. A Review of Machine Learning Techniques for Keratoconus Detection and Refractive Surgery Screening. Semin. Ophthalmol. 2019, 34, 317–326. [Google Scholar] [CrossRef] [PubMed]
- Smadja, D.; Touboul, D.; Cohen, A.; Doveh, E.; Santhiago, M.R.; Mello, G.R.; Krueger, R.R.; Colin, J. Detection of subclinical keratoconus using an automated decision tree classification. Am. J. Ophthalmol. 2013, 156, 237–246. [Google Scholar] [CrossRef] [PubMed]
- Klyce, S.D. Chasing the suspect: Keratoconus. Br. J. Ophthalmol. 2009, 93, 845–847. [Google Scholar] [CrossRef] [PubMed]
- Saad, A.; Gatinel, D. Validation of a new scoring system for the detection of early forme of keratoconus. Age 2012, 37, 37–38. [Google Scholar] [CrossRef]
- Qin, B.; Chen, S.; Brass, R.; Li, Y.; Tang, M.; Zhang, X.; Wang, X.; Wang, Q.; Huang, D. Keratoconus diagnosis with optical coherence tomography-based pachymetric scoring system. J. Cataract Refract. Surg. 2013, 39, 1864–1871. [Google Scholar] [CrossRef][Green Version]
- Rabinowitz, Y.S.; Li, X.; Canedo, A.L.; Ambrosio, R., Jr.; Bykhovskaya, Y. Optical coherence tomography combined with videokeratography to differentiate mild keratoconus subtypes. J. Refract. Surg. 2014, 30, 80–87. [Google Scholar] [CrossRef]
- Silverman, R.H.; Urs, R.; RoyChoudhury, A.; Archer, T.J.; Gobbe, M.; Reinstein, D.Z. Combined tomography and epithelial thickness mapping for diagnosis of keratoconus. Eur. J. Ophthalmol. 2017, 27, 129–134. [Google Scholar] [CrossRef]
- Arbelaez, M.C.; Versaci, F.; Vestri, G.; Barboni, P.; Savini, G. Use of a support vector machine for keratoconus and subclinical keratoconus detection by topographic and tomographic data. Ophthalmology 2012, 119, 2231–2238. [Google Scholar] [CrossRef] [PubMed]
- Riley, R.D.; Snell, K.I.; Ensor, J.; Burke, D.L.; Harrell, F.E., Jr.; Moons, K.G.; Collins, G.S. Minimum sample size for developing a multivariable prediction model: PART II - binary and time-to-event outcomes. Stat. Med. 2019, 38, 1276–1296. [Google Scholar] [CrossRef] [PubMed]


| Ctrl | I | II | III | IV | V | p | |
|---|---|---|---|---|---|---|---|
| Number of cases | 62 | 44 | 18 | 15 | 15 | 15 | |
| Age in years (mean ± SD) | 37.5 ± 14.4 | 41.2 ± 16.6 | 47.4 ± 22.5 | 40.3 ± 12.6 | 34.0 ± 14.3 | 36.3 ± 18.0 | 0.161 |
| Female/Male | 32/30 | 12/32 | 6/12 | 7/8 | 6/9 | 4/11 | 0.146 |
| Variables | Mean | SD | Median | Range | Normality | Ctrl vs. RETICS I | Ctrl–RETICS I–II–III–IV–V |
|---|---|---|---|---|---|---|---|
| Demographic | |||||||
| Age | 39 | 16 | 38 | 7–98 | <0.001 | 0.665 | 0.344 |
| Optical | |||||||
| CDVA | 0.77 | 0.32 | 0.96 | 0.05–1.20 | <0.001 | <0.001 | <0.001 |
| Coma-like | 1.85 | 2.15 | 1.01 | 0.08–13.0 | <0.001 | <0.001 | <0.001 |
| Q8mm | −0.63 | 0.70 | −0.45 | −2.80–2.82 | < 0.001 | 0.025 | <0.001 |
| Spherical-like | 0.70 | 0.93 | 0.44 | 0.15–7.20 | <0.001 | <0.001 | <0.001 |
| RMS total | 3.22 | 3.09 | 2.38 | 0.33–15.6 | <0.001 | <0.001 | <0.001 |
| High-order | 2.02 | 2.33 | 1.12 | 0.24–13.8 | <0.001 | <0.001 | <0.001 |
| Astigmatism | 2.31 | 2.25 | 1.57 | 0.04–11.22 | <0.001 | <0.001 | <0.001 |
| Pachymetry | |||||||
| Central thickness | 499 | 62 | 508 | 285–633 | <0.001 | <0.001 | <0.001 |
| Temporal | 545 | 50 | 546 | 385–645 | 0.073 | <0.001 | <0.001 |
| Nasal | 579 | 48 | 579 | 451–692 | 0.835 | <0.001 | <0.001 |
| Superior | 591 | 50 | 590 | 408–695 | 0.062 | <0.001 | <0.001 |
| Inferior | 559 | 57 | 563 | 332–762 | <0.001 | <0.001 | <0.001 |
| Morpho-Geometric | |||||||
| Total volume | 24.7 | 1.9 | 24.4 | 19.8–29.1 | 0.335 | <0.001 | <0.001 |
| Anterior surface area | 43.35 | 0.59 | 43.24 | 42.49–47.44 | <0.001 | <0.001 | <0.001 |
| Posterior surface area | 44.70 | 0.93 | 44.53 | 43.53–51.14 | <0.001 | <0.001 | <0.001 |
| Std. | Z | p | 95% CI | ||||
|---|---|---|---|---|---|---|---|
| Variables | Coefficient | Error | Value | Value | OR | Lower | Upper |
| Demographic | |||||||
| Age | 0.135 | 0.078 | 1.727 | 0.084 | 1.145 | 1.021 | 1.416 |
| Gender | 5.267 | 2.520 | 2.090 | 0.037 | 193.907 | 4.154 | 2.14 × 10⁵ |
| Clinical | |||||||
| CDVA | −6.345 | 4.613 | −1.376 | 0.169 | 0.002 | 0.001 | 1.821 |
| Coma-like | 4.072 | 1.917 | 2.124 | 0.034 | 58.687 | 3.615 | 1.16 × 10⁴ |
| Q8mm | 6.027 | 4.618 | 1.305 | 0.192 | 414.459 | 0.070 | 3.02 × 10⁷ |
| Spherical-like | 1.673 | 1.259 | 1.329 | 0.119 | 5.329 | 0.671 | 1.08 × 10² |
| RMS total | 2.482 | 1.591 | 1.560 | 0.119 | 11.969 | 1.071 | 8.65 × 10² |
| High-order | 5.534 | 2.484 | 2.227 | 0.026 | 253.143 | 5.830 | 3.12 × 10⁵ |
| Astigmatism | −1.054 | 1.218 | −0.866 | 0.387 | 0.348 | 0.014 | 2.963 |
| Pachymetry | |||||||
| Central thickness | -0.242 | 0.116 | −2.083 | 0.037 | 0.785 | 0.577 | 0.941 |
| Temporal | 0.028 | 0.012 | 2.248 | 0.025 | 1.028 | 1.009 | 1.064 |
| Nasal | 0.007 | 0.011 | 0.641 | 0.522 | 1.007 | 0.987 | 1.034 |
| Superior | 0.092 | 0.058 | 1.587 | 0.113 | 1.096 | 0.995 | 1.263 |
| Inferior | −0.051 | 0.034 | −1.479 | 0.139 | 0.951 | 0.870 | 0.995 |
| Morpho-Geometric | |||||||
| Total volume | 0.067 | 0.547 | 0.124 | 0.901 | 1.070 | 0.349 | 3.908 |
| Anterior surface area | −0.326 | 0.532 | −0.614 | 0.539 | 0.722 | 0.218 | 2.105 |
| Posterior surface area | −1.189 | 0.779 | −1.525 | 0.127 | 0.305 | 0.044 | 1.199 |
| Constant | 135.027 | 61.595 | 2.192 | 0.028 | - | - | - |
| Std. | t | p | 95% CI | ||||
|---|---|---|---|---|---|---|---|
| Variables | Coefficient | Error | Value | Value | OR | Lower | Upper |
| Demographic | |||||||
| Age | 0.016 | 0.011 | 1.475 | 0.140 | 1.016 | 0.995 | 1.037 |
| Gender | −0.073 | 0.361 | −0.203 | 0.839 | 0.929 | 0.458 | 1.885 |
| Clinical | |||||||
| CDVA | −5.495 | 0.865 | −6.355 | 0.001 | 0.004 | 0.001 | 0.022 |
| Coma-like | 0.106 | 0.348 | 0.304 | 0.761 | 1.111 | 0.562 | 2.197 |
| Q8mm | 0.184 | 0.359 | 0.512 | 0.609 | 1.201 | 0.595 | 2.423 |
| Spherical-like | −0.063 | 0.250 | −0.250 | 0.803 | 0.940 | 0.575 | 1.535 |
| RMS total | −0.422 | 0.298 | 1.416 | 0.157 | 1.526 | 0.850 | 2.737 |
| High-order | 0.621 | 0.345 | 1.797 | 0.072 | 1.860 | 0.945 | 3.660 |
| Astigmatism | −0.250 | 0.239 | −1.046 | 0.296 | 0.779 | 0.488 | 1.244 |
| Pachymetry | |||||||
| Central thickness | −0.024 | 0.007 | −3.298 | 0.001 | 0.977 | 0.963 | 0.991 |
| Temporal | 0.006 | 0.002 | 2.662 | 0.008 | 1.006 | 1.002 | 1.010 |
| Nasal | −0.002 | 0.003 | −0.771 | 0.441 | 0.998 | 0.992 | 1.004 |
| Superior | 0.006 | 0.007 | 0.933 | 0.351 | 1.006 | 0.993 | 1.019 |
| Inferior | −0.002 | 0.005 | −0.522 | 0.601 | 0.998 | 0.989 | 1.007 |
| Morpho-Geometric | |||||||
| Volume | 0.071 | 0.141 | 0.500 | 0.617 | 1.073 | 0.814 | 1.414 |
| Anterior area | −0.204 | 0.133 | −1.533 | 0.125 | 0.816 | 0.623 | 1.058 |
| Posterior area | 0.046 | 0.129 | 0.361 | 0.718 | 1.048 | 0.814 | 1.348 |
| Intercepts | |||||||
| Ctrl vs. RETICS I | −16.769 | 0.017 | −98.428 | <0.001 | - | - | - |
| RETICS I vs. II | −13.926 | 0.396 | −35.205 | <0.001 | - | - | - |
| RETICS II vs. III | −12.270 | 0.522 | −23.530 | <0.001 | - | - | - |
| RETICS III vs. IV | −9.998 | 0.765 | −13.072 | <0.001 | - | - | - |
| RETICS IV vs. V | −6.691 | 1.057 | −6.330 | <0.001 | - | - | - |
| Predicted Value | ||||||
|---|---|---|---|---|---|---|
| True Value | Ctrl | I | II | III | IV | V |
| Ctrl | 55 | 7 | 0 | 0 | 0 | 0 |
| I | 12 | 26 | 4 | 2 | 0 | 0 |
| II | 2 | 9 | 6 | 3 | 1 | 0 |
| III | 0 | 3 | 3 | 6 | 3 | 0 |
| IV | 0 | 1 | 0 | 1 | 12 | 1 |
| V | 0 | 0 | 0 | 1 | 1 | 13 |
| Sensitivity | 0.887 | 0.591 | 0.333 | 0.400 | 0.800 | 0.867 |
| Specificity | 0.869 | 0.840 | 0.954 | 0.955 | 0.968 | 0.994 |
| Balanced accuracy | 0.878 | 0.715 | 0.643 | 0.677 | 0.884 | 0.930 |
© 2020 by the authors. Licensee MDPI, Basel, Switzerland. This article is an open access article distributed under the terms and conditions of the Creative Commons Attribution (CC BY) license (http://creativecommons.org/licenses/by/4.0/).
Share and Cite
Bolarín, J.M.; Cavas, F.; Velázquez, J.S.; Alió, J.L. A Machine-Learning Model Based on Morphogeometric Parameters for RETICS Disease Classification and GUI Development. Appl. Sci. 2020, 10, 1874. https://doi.org/10.3390/app10051874
Bolarín JM, Cavas F, Velázquez JS, Alió JL. A Machine-Learning Model Based on Morphogeometric Parameters for RETICS Disease Classification and GUI Development. Applied Sciences. 2020; 10(5):1874. https://doi.org/10.3390/app10051874
Chicago/Turabian StyleBolarín, José M., F. Cavas, J.S. Velázquez, and J.L. Alió. 2020. "A Machine-Learning Model Based on Morphogeometric Parameters for RETICS Disease Classification and GUI Development" Applied Sciences 10, no. 5: 1874. https://doi.org/10.3390/app10051874
APA StyleBolarín, J. M., Cavas, F., Velázquez, J. S., & Alió, J. L. (2020). A Machine-Learning Model Based on Morphogeometric Parameters for RETICS Disease Classification and GUI Development. Applied Sciences, 10(5), 1874. https://doi.org/10.3390/app10051874