1. Introduction
Computer-based simulation processes and numerical methods have been developed over recent years on different segments of automotive structure and human occupant to assess, measure, monitor, and characterize the level of vibration and its effect on humans. On the basis of the aspects of investigation, generally lumped mass parameter, finite element, or multi-body method is used to evaluate the vibration and frequency levels, although each of the methods has its own pros and cons. Numerous combinations of input parameters, segments of interest, and output data can be considered for the automotive-seated human body; however, depending on the nature of the research, only specific parameters and portions are considered.
Simulation research work on the entire vehicle dynamics [
1] clearly states that because of the high costs involved in the real life development of a new vehicle, CAE (Computer Aided Engineering)-based simulation methodologies for the vehicle dynamics and vibration are gaining more importance in the automotive development process. A bio-dynamic model using a numerical algorithm of seated human [
2] considered two numbers of four DOF (Degree/s of Freedom) models and one number of seven DOF model and on the basis of the optimized parameters such as frequency, damping co-efficient, and stiffness, the range of vibration transmissibility was evaluated.
Harmonic analysis to evaluate the vibration amplitude of the car bonnet with respect to various frequencies [
3] was carried out using the finite element method. The engine of the car was assumed to be operating in ideal condition at 1000 rpm and the frequency range considered was in-between 1 Hz and 100 Hz. The frequency of the car bonnet was found as 20 Hz, whereas the engine frequency was 16 Hz. A similar type of simulation was carried out on the transmission of vibration [
4] inside the automotive engine components. The damping coefficients and stiffness data were taken from an engineering catalogue and the study concluded that the locations of measurement would play an important role for assessing the vibration inside the structure.
Spinal segments of the human body were investigated [
5] through finite element simulation to find out the natural frequency, finding that the amplitudes of vibration at different locations of a particular spinal segment were different. Similar kinds of conclusions were drawn during studies characterizing vibration inside human portions [
6] and dynamics of intervertebral joints [
7].
Human thigh and buttock areas were investigated using finite element to understand the dynamic interaction between the human muscles and automotive seat cushion during the study of experimental mathematical interaction of human and chair [
8], automotive seat and human tissue interaction [
9], stress inside the muscles of a seated person [
10], and 3D computer programming of human buttocks [
11]. Human buttocks were analysed for designing the different comfort parameters of the automotive seat [
12].
A modal analysis was carried out on the human portions to extract seven mode shapes under the frequency of 10 Hz [
13], where the human spine and inter vertebral discs were constructed by rigid and deformable bodies, respectively. The study showed how the pressure at the thigh and seat cushion interface would vary with respect to different posture of seated human body.
An advance methodology was taken into account where a three-dimensional model of the human body was constructed using spine, ribs, pelvis, skull, skin, and muscles [
14], and several human bodies of different shapes were created by adjusting the sizes of all these constructing elements. Human spine was created using deformable bodies, whereas rib, skull, and pelvis were created using rigid bodies. Later, the skins and muscles were combined into the human body assembly by using the most suitable material human soft tissue properties. These human models of several shapes and sizes were exported to another investigation [
15] and configured into various positions to analyse the comfort levels of the seated human body inside an automotive. The entire process developed a new conceptual design of articulated automotive seat.
Study on the whole human body was conducted using finite element software to estimate the vibration transmissibility [
16] between the seat and human. That study considered feet, leg, arm, hand torso, pelvis, thigh, neck, and head along with human soft tissue material properties. The outcome of the study was able to predict the apparent mass and vibration transmission to the human spine in vertical and fore-aft direction. Another finite element study on the human apparent mass and vibration transmissibility of human and rigid seat [
17] considered a seated human exposed to vertical vibration. Average height and mass of human were taken as 1.74 m and 68.5 kg, respectively, and head, neck, torso, pelvis, thigh, leg, and arm were modelled in the finite element environment.
Past research works and investigations on the human-automotive interaction are mainly based on the specific segments of the human–automotive assembly. Only a few technologies took the initiative to carry out comprehensive analyses of the whole human body, though the results from these studies were limited to only vibration transmission, natural frequency, or seat–human interaction. Moreover, the existing technologies considered the stiffness values of human segments on the basis of the general experimental data or guidelines from past related works, and hence lacked the practicality of human shape-specific stiffness data. Further conclusions can be made after reviewing the past related works on human bio-dynamics that simplification of the human body modelling before carrying out finite element analysis is an inevitable part of the research in order to obtain a fruitful output from the simulation.
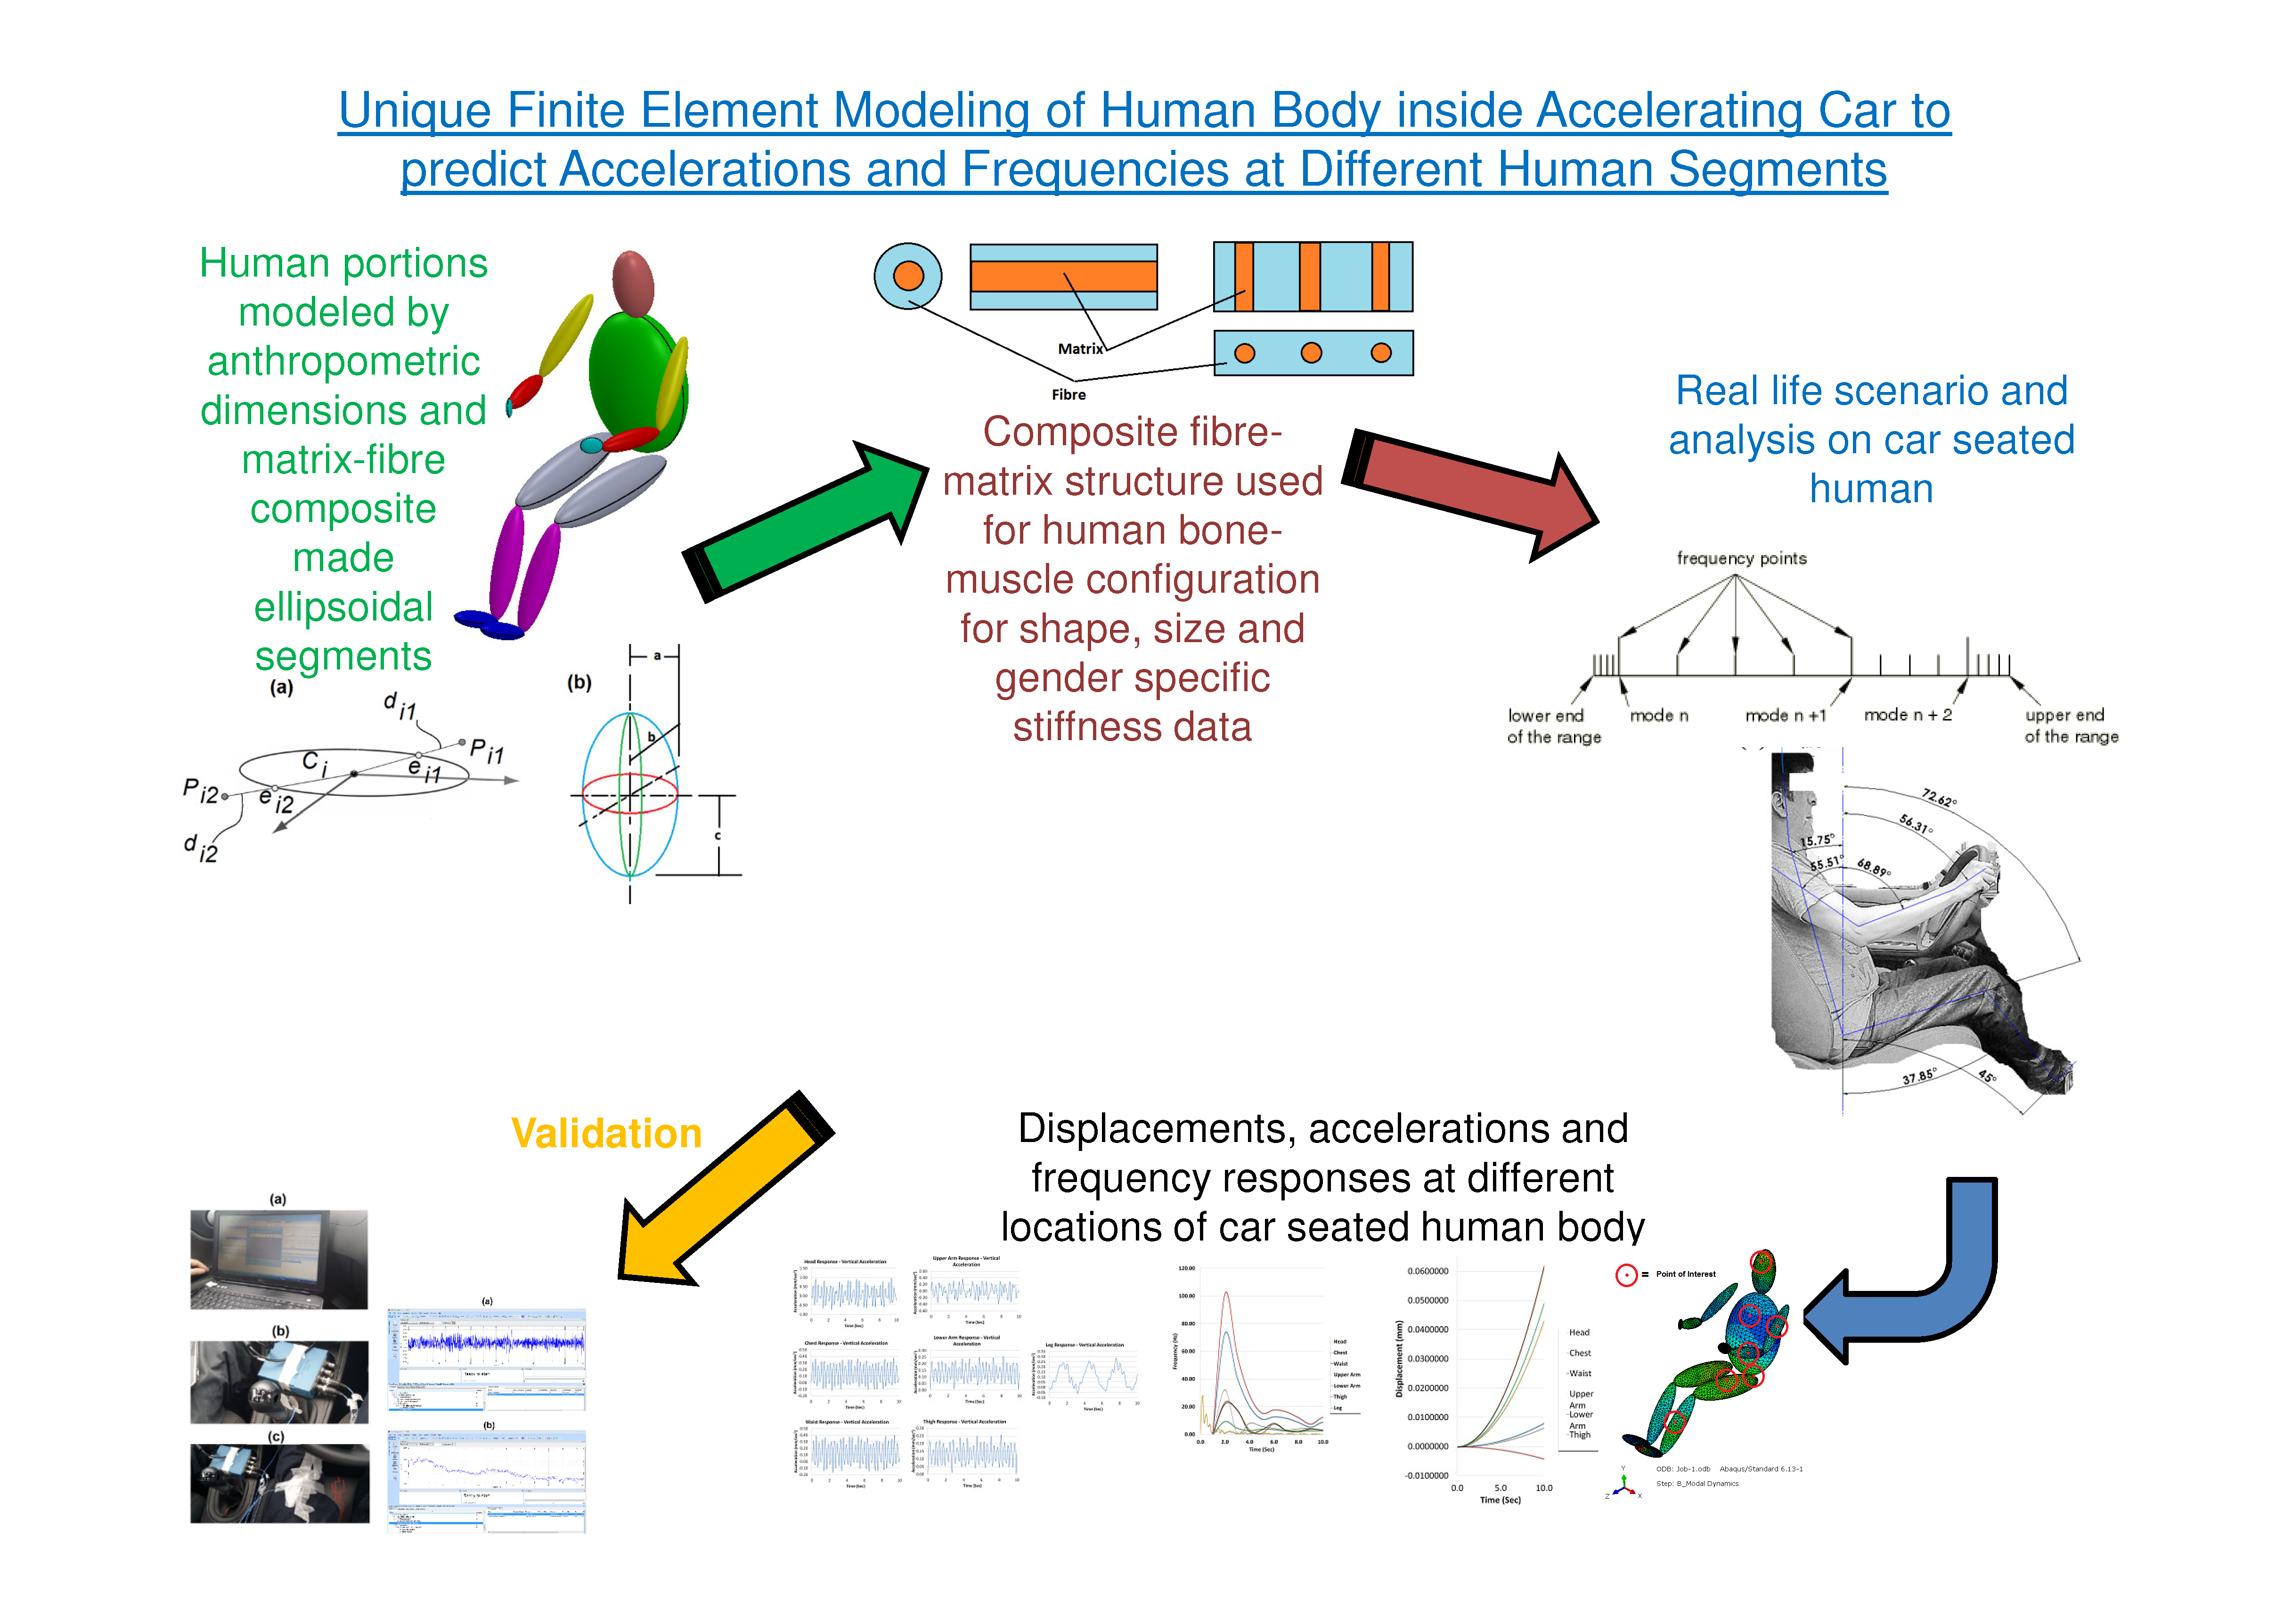
The biggest possible human size is the 95th percentile male body, whereas the smallest possible human size is the 5th percentile female body, and the automotive seating arrangement must offer the highest level of comfort to this range of human sizes. In the present research work, a simulated model of car-seated human body was established as per the real life scenario, which was able to predict the final level of vibration inside different portions of the human body. Bone and muscle properties were combined along with anthropometric data to obtain the human shape specific stiffness data for human parts. Boundary conditions were implemented to the model as accurate as possible on the basis of real life sitting posture and driving conditions. Vertical displacement and acceleration were extracted from the simulation of simplified human model followed by evaluating the frequency values at different locations.
The uniqueness of this simulation methodology was in its predicting of the final level of vibrations at different segments of human–automotive seat structure through finite element simulation, omitting the necessity of real life vibration measurement, representing human portions by ellipsoidal segments, and assigning shape-specific stiffness data to different human segments.
2. Simulation Methodology
2.1. Human Segmental Masses and Dimensions
Masses of the human portions are defined as fraction of the total body mass, which vary on gender, age, and shape of human. A standard 50th percentile male human body of 77.3 kg was taken into account, and the masses of different human portions were calculated on the basis of the guidelines in human segmental databases [
18,
19].
Human segmental dimensions differ from one continent to another. Anthropometric measurement data have been detailed in Chinese elderly people [
20]; industrial workers of India, Jakarta, and Indonesia [
21]; Turkish women [
22]; Italian gymnasts [
23]; Mexican adults [
24]; and rugby sportsmen [
25]. Basics of the human body dimension measurement are outlined in international standards BS EN ISO 7250:1998 and PD ISO/TR 7250-2:2010. The handbook on human ergonomics [
26] shows the factors for designing human comfort and comprehensive data for anthropometric dimensions, which was published [
27] on the basis of the analysis of principal components. After consulting with all the handbooks, standards, and literature, dimensions for a 50th percentile 77.3 kg male human were extracted.
2.2. Representation of Human Segments by Ellipsoidal Bodies
Representing the human body with ellipsoidal segments is an effective way to simplify the human model for carrying out robust analysis tasks. The greatest advantage of this method is that the parameters for comfort analysis can be calculated on the basis of the axes of the ellipsoid bodies, instead of using hypothetical data.
A study on the deformations of human arm and leg [
28] exhibited how the human portions could be represented by portions of ellipsoidal sections. Truncated ellipsoidal bodies were considered during the study in an academic environment [
29] in order to validate the eigenvectors of different human parts, where the dimensions of human parts were taken from anthropometric data tables.
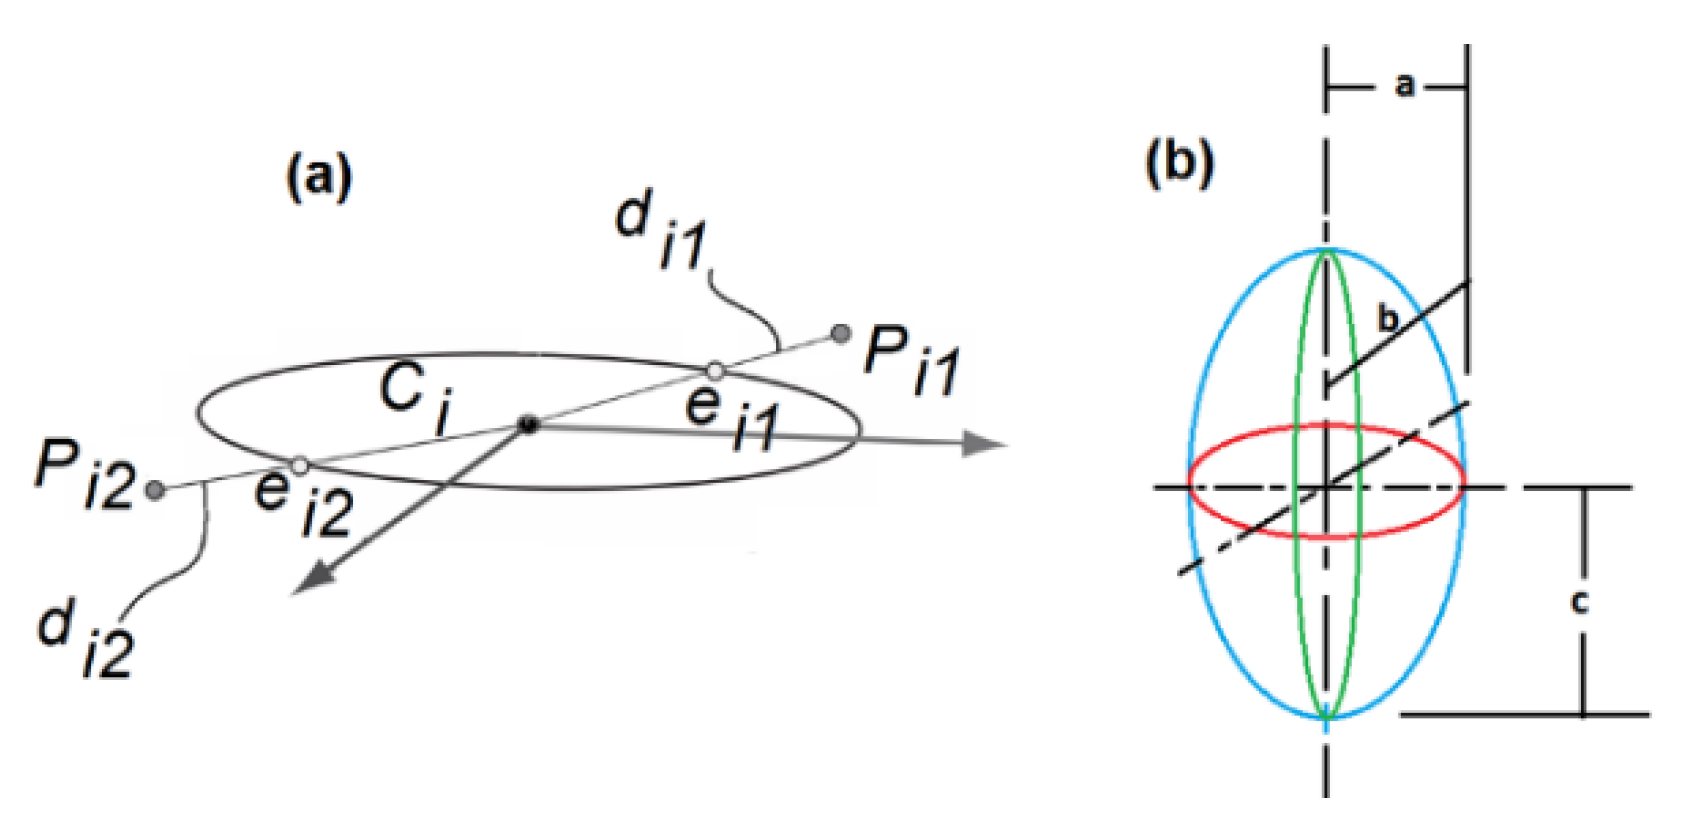
The deviation of an original point to the displaced location of a particular ellipsoid section is shown in
Figure 1 and can be derived from the following equation:
= the surface parameters of the point on surface .
On the basis of the anthropometric data collected, head including neck, torso, arms, legs, and feet of a 50th percentile male human body were modelled using ellipsoidal segments. From the derived ellipsoidal segments, ratios of lateral axes, average densities, and volumes were evaluated.
2.3. Human Posture
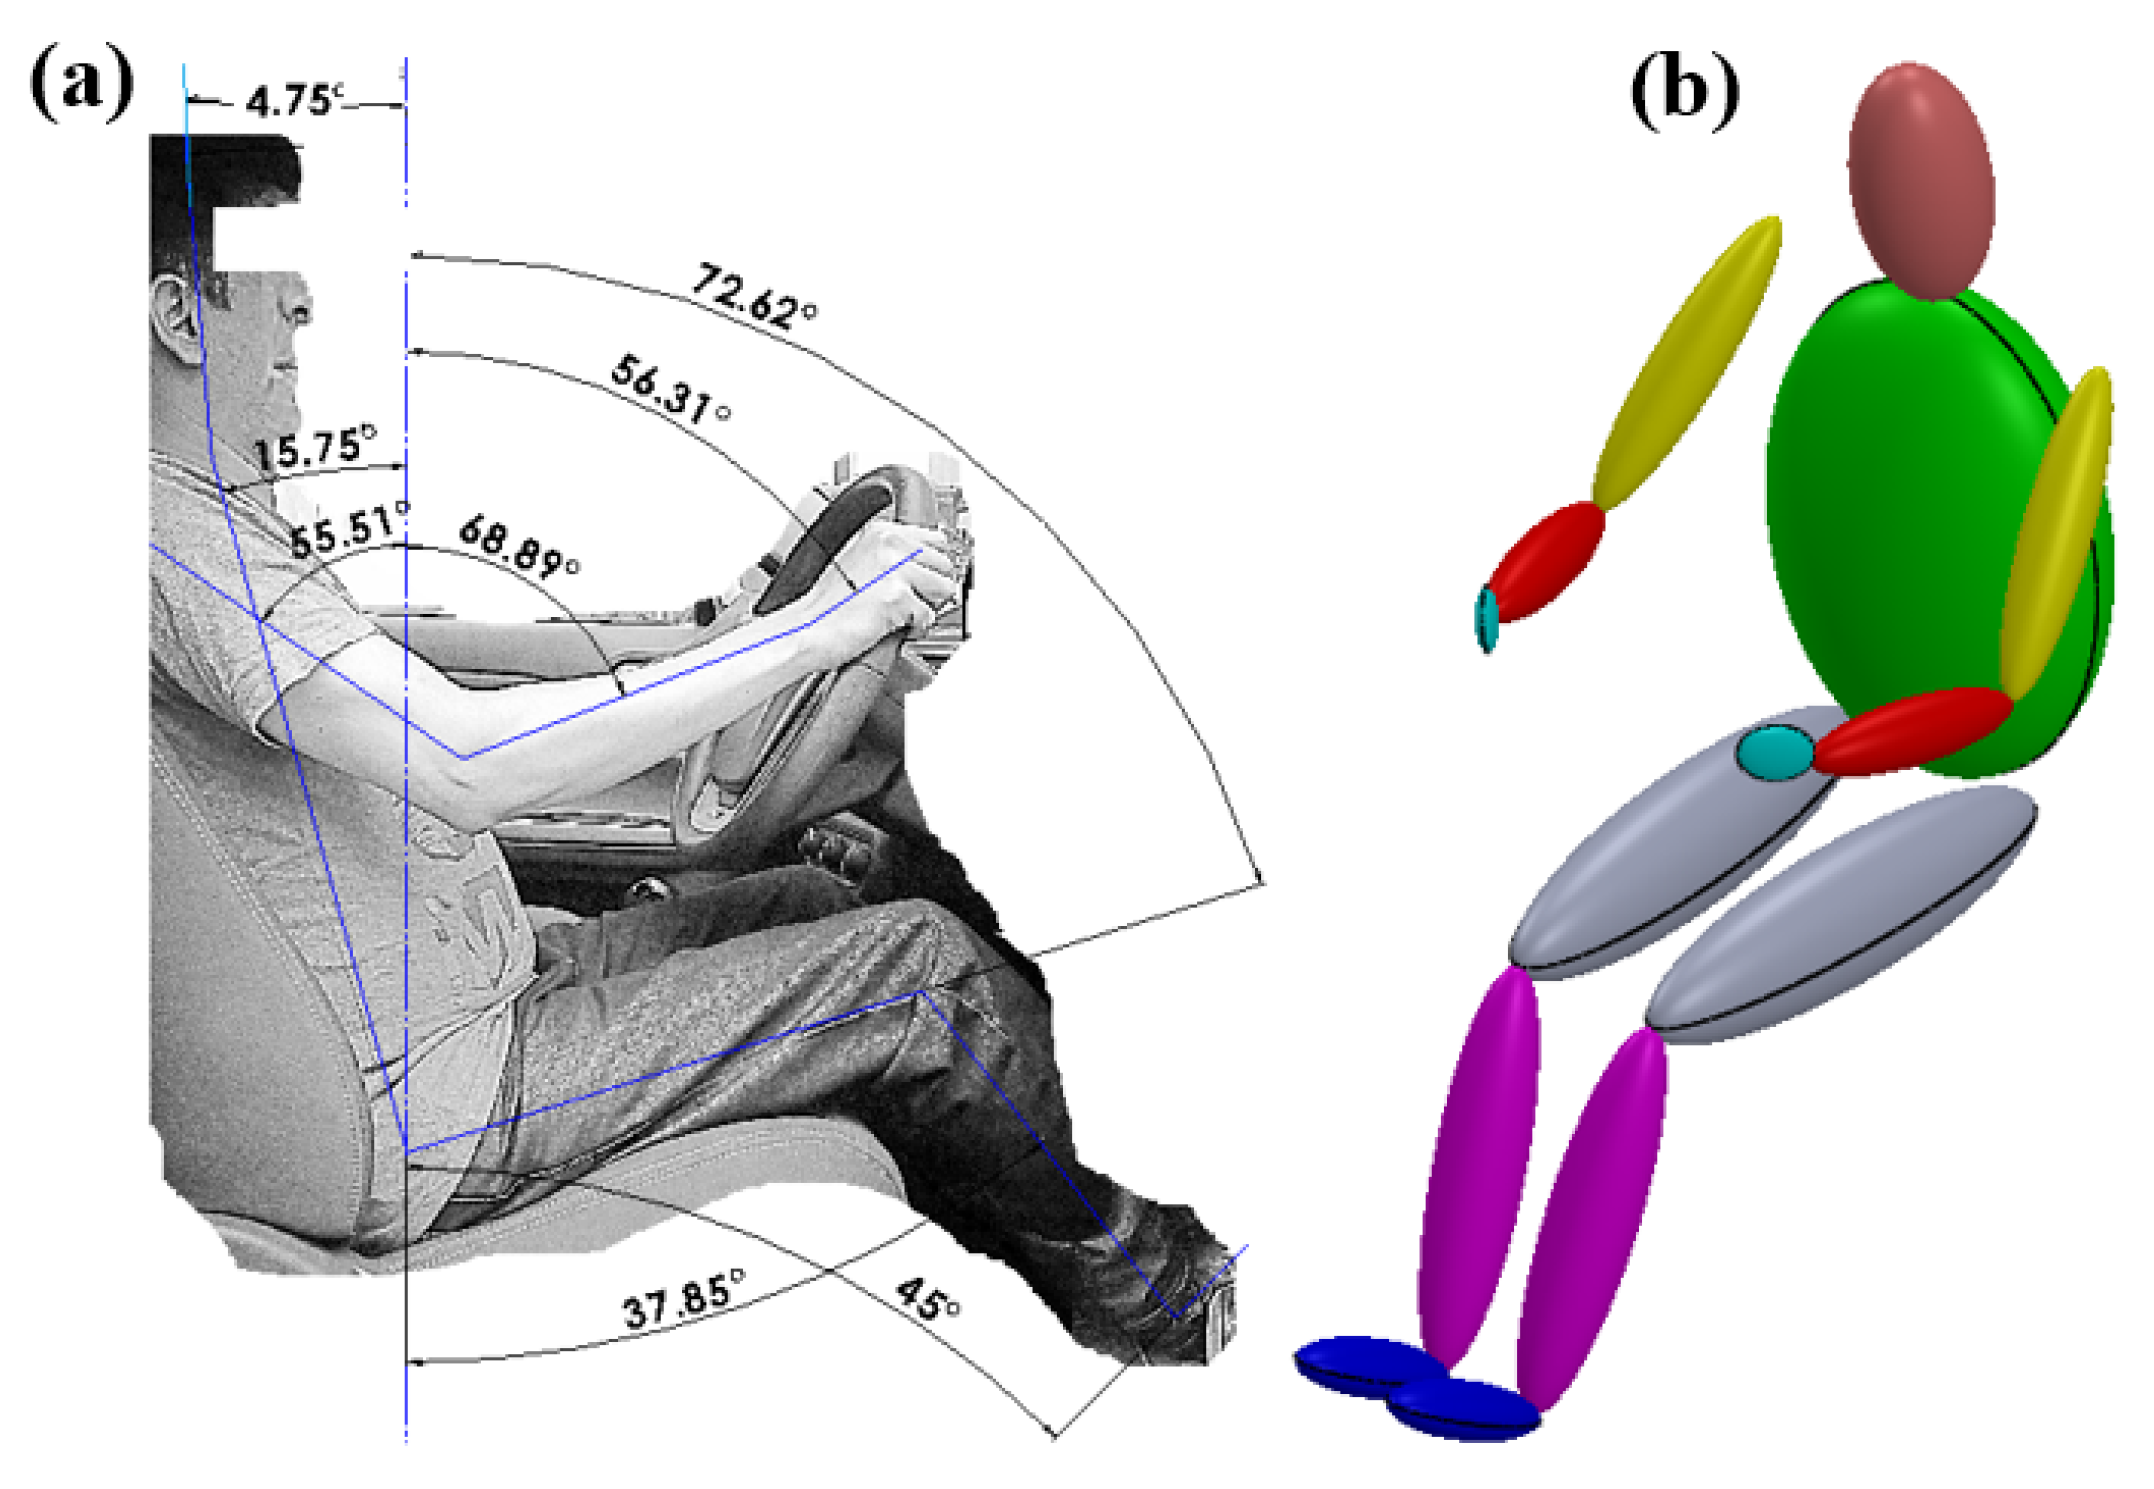
Global standards ISO/TC 159/SC 1, ISO/TC 159/SC 3, and ISO/TC 159/SC 4 define the ergonomic principles, anthropometric data, and biomechanics of system–human interaction, respectively. The angular orientations of comfortable human posture inside a car can be defined from those standards; however, to make this research work more practical, all the angular dimensions were measured from a real life male human driver of 77 kg mass sitting on a driving seat inside a standard hatchback car.
Figure 2 shows the images of the real human body along with all the major angular dimensions measured after importing it into drafting environment and the parametric human model constructed using Solidworks 2016 with the help of ellipsoidal dimensions and practical human segment orientations.
2.4. Segmental Properties of Human Body in Finite Element Environment
Defining accurate Young’s modulus (YM) for the human muscle and bone structure is a great challenge for modelling a realistic human body, as human muscle and bone properties are non-linear in nature, especially the muscles and skin, which exhibit hyper-elastic and viscoelastic properties. Mechanical indentation and tensile measurement processes on soft biological tissues [
30] found the YM values for the tendons, muscles, and tissues to be in-between 3 kPa and 8 kPa. A comparative study on the mechanical properties of human bones with respect to gender and age [
31] found the maximum YM value of human bone as 20.04 GPa. Another investigation on the finite element modelling of human bones [
32] considered the YM as 15 GPa. For this research work, YM values for the human bones and muscles were considered as 20.04 GPa and 8 kPa, respectively.
The integrated structure of human muscles and bones can be represented either by composite, fibre, or silicon substances. Considering composite had distinct advantages over other materials, as the stresses and stiffness parameters inside the composites can be calculated in an accurate way. Advanced human nutrition database [
33] defines the percentage of bone inside a male human body as 15%, whereas the percentage of organ, fat, and muscles is 85%. On the basis of these percentage data, YM values for each of the human segments in all three directions were evaluated using the following relationships:
Combining the YM values and ellipsoidal segment parameters, the stiffness values for all the human portions in all three directions were calculated using the relationship between force, stress, strain, and cross-sectional area:
= stiffness of jth segment in ith direction;
= YM of jth segment in ith direction;
= half axis (transverse axis-1) length of the of jth segment perpendicular to ith direction;
= half axis (transverse axis-2) length of the of jth segment perpendicular to ith direction;
= half axis length of the of jth segment in ith direction.
Soft human tissues are fully incompressible in nature, and the Poisson’s ratio is generally considered in the range of 0.45 and 0.49. While measuring the YM value of human soft tissue [
34], the value of Poisson’s ratio was considered as 0.49, and the finite element model of human tissue considered [
35] Poisson’s ratio as 0.49995. Human bones are rigid in nature and most of the past studies on human bio-dynamics assumed the bone to be a fully rigid body. From the practical point of view, the human soft tissue and muscles are more sensitive to being deformed faster than the rigid bones. Poisson’s ratio was considered as 0.49 for the human segments in this project.
Damping coefficient varies from one portion to another inside human body. The general expression for a damped system is
= mass matrix multiplier constant;
= stiffness matrix multiplier constant;
= material dependent stiffness matrix multiplier constant;
= variable stiffness matrix multiplier constant;
= frequency dependent damping matrix;
= element damping matrix;
= material (1,…,);
= element (1,…,).
This analysis work considered the linear perturbation step followed by the modal dynamics step in finite element. The main focus was paid to
, which can be defined as
As the main aim of this research work was to establish a simulation methodology to find out the frequency data at different locations of the human body, the damping model of the human portions were simplified by considering only damping coefficient and constant damping ratio.
The damping coefficients for lower torso, arms, upper torso, and hands was considered as 2376.4, 145.8, 1797.7, and 1797.7 Ns/m, respectively, while studying the vertical and fore-aft vibration inside a 75 kg human body [
36]. Vibration analysis on a human body [
37] of 90 kg considered damping coefficients for head including neck, chest including upper torso, lower torso, and pelvis including thigh as 620, 8550, 5685, and 3564 Ns/m, respectively. Investigation on a human of 80 kg in seated condition [
38] took the damping coefficients for head, back, torso, thorax, and abdomen as 3575.506, 3575.506, 3575.506, 291.878, and 291.878 Ns/m, respectively. On the basis of the closest match to the human mass used for this research work, damping coefficients for head, torso, upper arms, lower arms, hands, thighs, legs, and feet were considered as 620, 1797.7, 145.8, 145.8, 1797.7, 2376.4, 2376.4, and 2376.4 Ns/m, respectively, for this simulation work. Constant damping ratio was considered as 0.2 on the basis of the work done on human joints [
39,
40].
2.5. Interaction, Meshing, Boundary Conditions, and Load Scenario
ABAQUS CAE 6.13 was used for analysing the entire structure in a finite element environment. In the absence of an automotive seat, careful attention was paid to implement the boundary conditions as realistically as possible. For the human hands, rotation around steering centre was allowed, but detachment from steering wheel was restricted. For the legs, angular movement was permitted around the leg–ankle interface, but detachment from brake and clutch positions was restricted. The head was restrained to the headrest, but lateral adjustment was permitted. Bottom surfaces of the thighs were tied up to the seat cushion position. All the adjacent portions were interconnected through ‘Tie’ constrains.
Quadrahedral or hexahedral element is useful for analysing deformable bodies in ABAQUS. For this analysis 10-node tetrahedral element C3D10 was used for meshing. Linear perturbation and modal dynamic steps were taken into account to solve the analysis.
Figure 3 shows the connection between the segments and the meshed body. Care was taken during mesh generation to ensure that there were at least few layers of elements across all the sections.
The load primarily came from the acceleration of the moving vehicle. For Jaguar XK coupe [
41], the acceleration value was measured as 4.5 m/sec
2, whereas for another racing car [
42] the value was 28 m/sec
2. Initial acceleration values of non-racer automotive at 60 km/h and 40 km/h on multiple lane highway was calculated [
43] as 1.083 m/sec
2 and 0.861 m/sec
2, respectively.
The acceleration value for the passenger vehicle operated in a rural area was defined by [
44]:
= average acceleration in m/sec2;
= maximum acceleration in m/sec2;
vehicle speed in m/sec;
constants.
Assuming the car was a non-racer type and picked up a speed of around 30 m/h from static condition, the value of accelerations was taken as 0.861 m/sec2 for this analysis work, and accordingly the force cause of this acceleration was calculated. The road condition was assumed to be smooth, and the initial 10 s of the vehicle operation was accounted for. The calculated force was implemented to the human body in a seated posture in modal dynamic step to understand the behaviour of the human system under the effect of vibration. The modal dynamics step was used to understand the system behaviour after the eigenfrequencies were obtained from the earlier step. This modal dynamics step considered the damping of the structure and calculated the system response on the basis of the mode shapes obtained from the system.
3. Results
The analysis was carried out on a 64 bit Windows XP-based PC with two dual-core 2.1 GHz Intel(R) Pentium(R) CPU B950 processors and 6 GB of RAM. Because of the computer memory limitation, the simulation running time was set to 10 s. ABAQUS solver took around 5 wall-clock hours to complete the analysis.
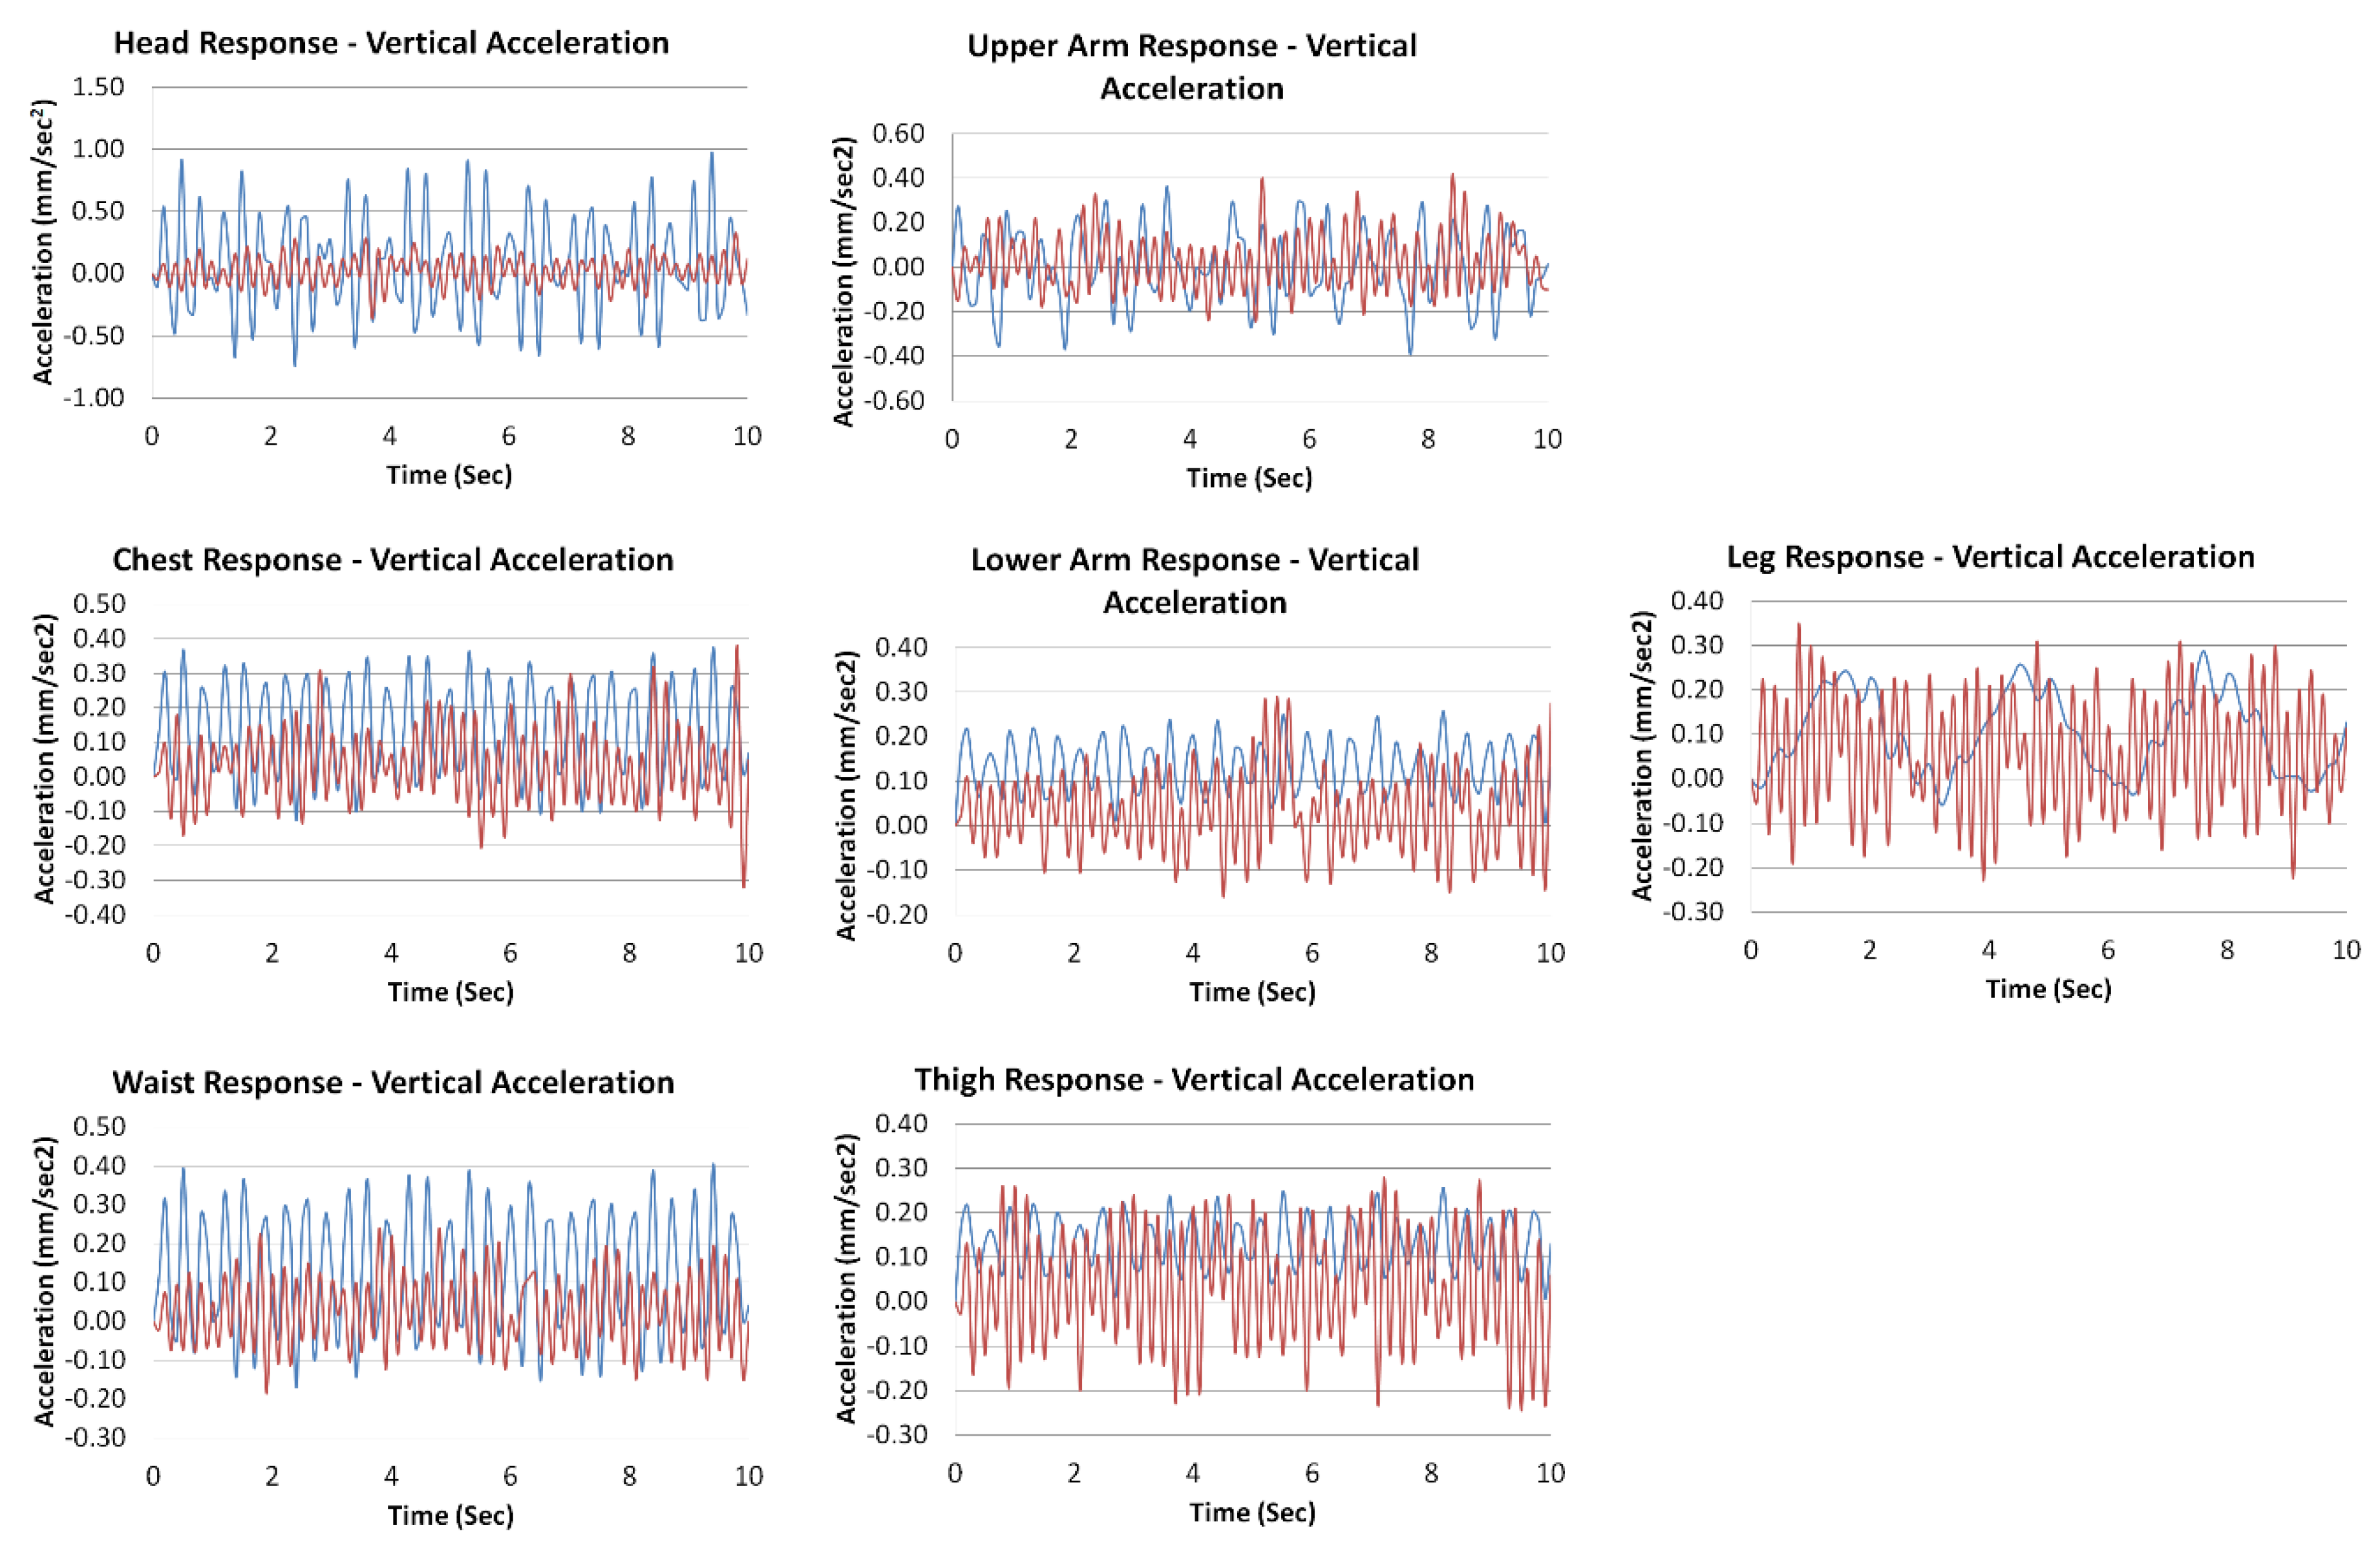
Acceleration was one of the parameters used to characterize the vibration. As this research work aimed to focus on the vibration in the vertical direction, the vertical acceleration responses at head, chest, upper arm, lower arm, waist, thigh, and legs were evaluated from the results. The chosen points for extracting the vertical accelerations, along with the obtained values, are shown in
Figure 4.
Figure 5 shows the vertical acceleration responses of all the points of interest.
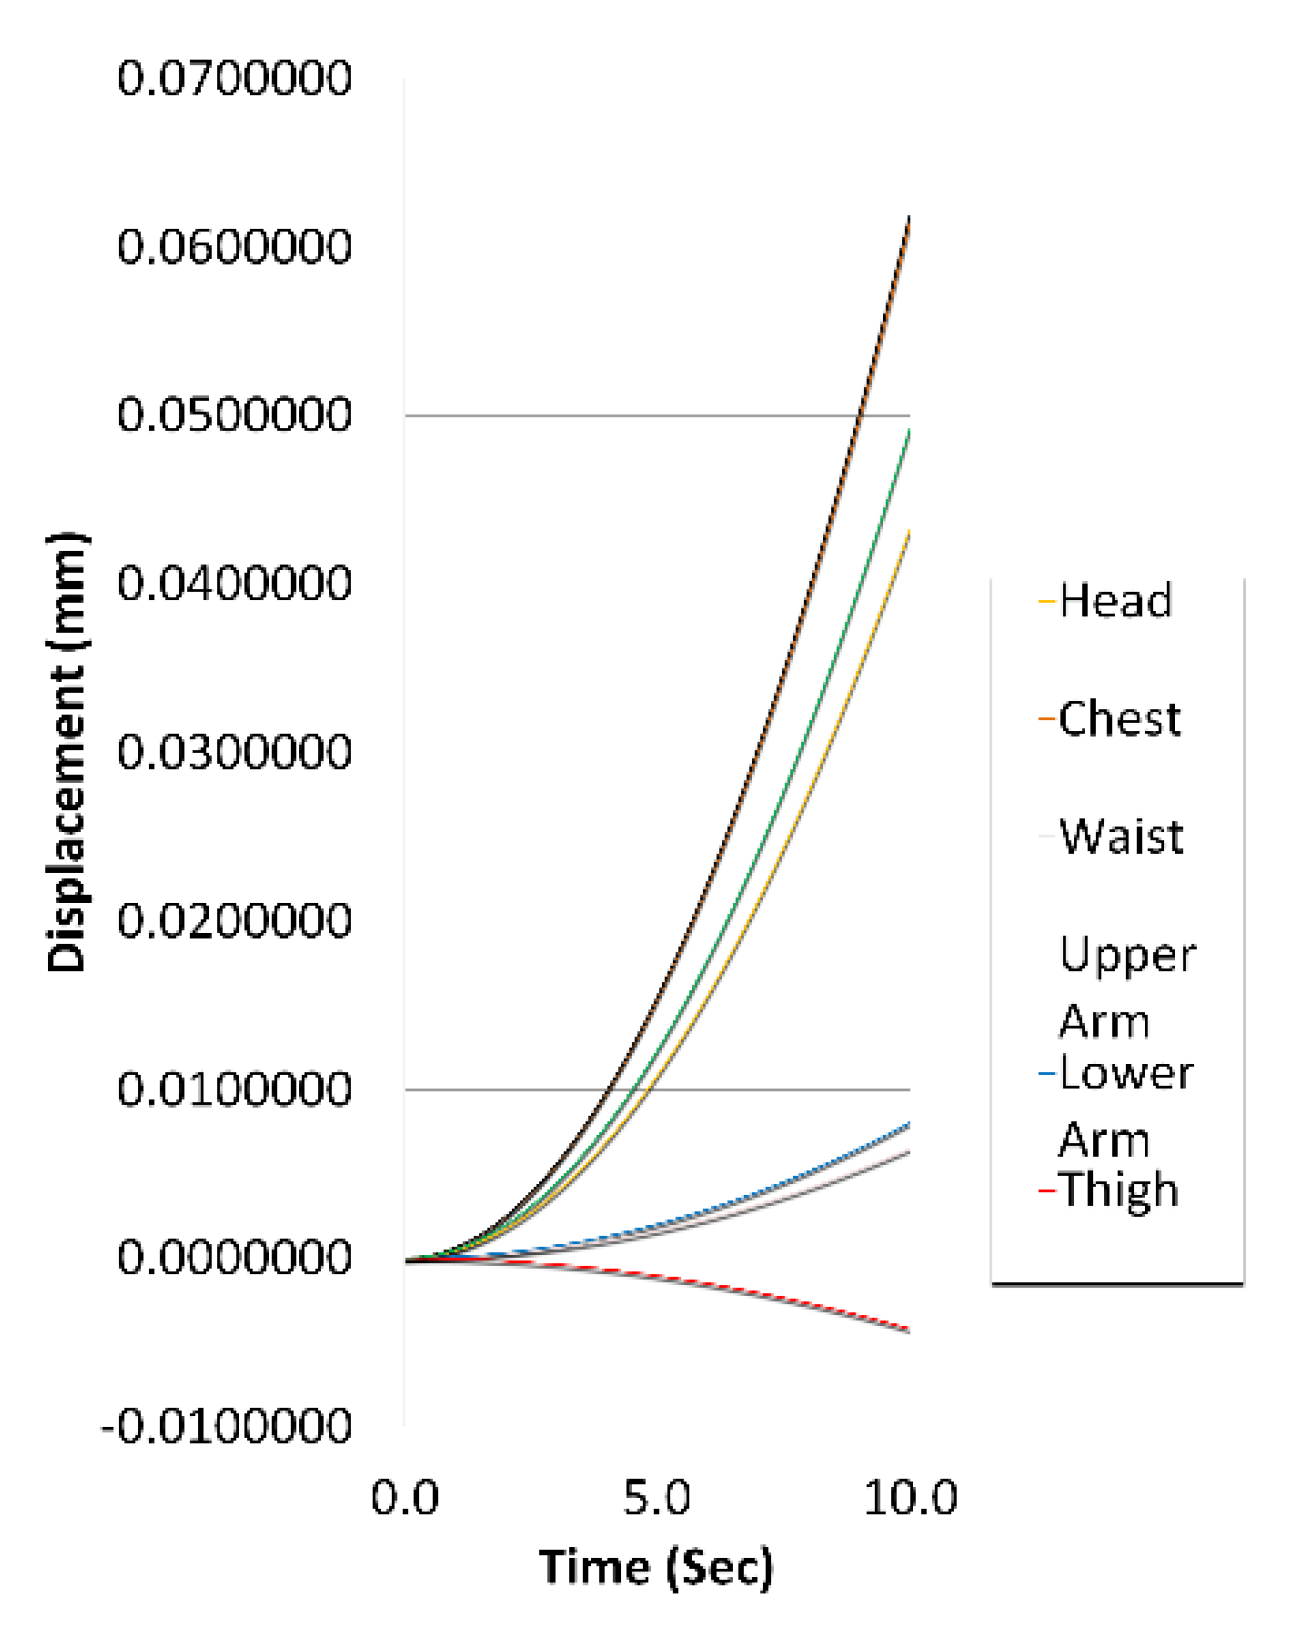
Vertical displacement plots were obtained in similar fashion and are shown in
Figure 6.
Simple co-relation between the frequency, time, mass, acceleration, damping, velocity, stiffness, and displacement was
mass;
acceleration;
damping coefficient;
velocity
stiffness;
displacement;
force;
frequency;
time.
For a multi-mass system, this co-relation in Equation (10) can be represented through matrix format, and the set of equations inside the solver system can be expressed as
are mass, damping, and stiffness matrices, respectively, and
is the external force acting on the system. Taking the Fourier transformation of Equation (11), complex displacement response of a multi-mass system can be obtained as a function of frequency
and displacement
:
where
is the complex Fourier transformation vector of
.
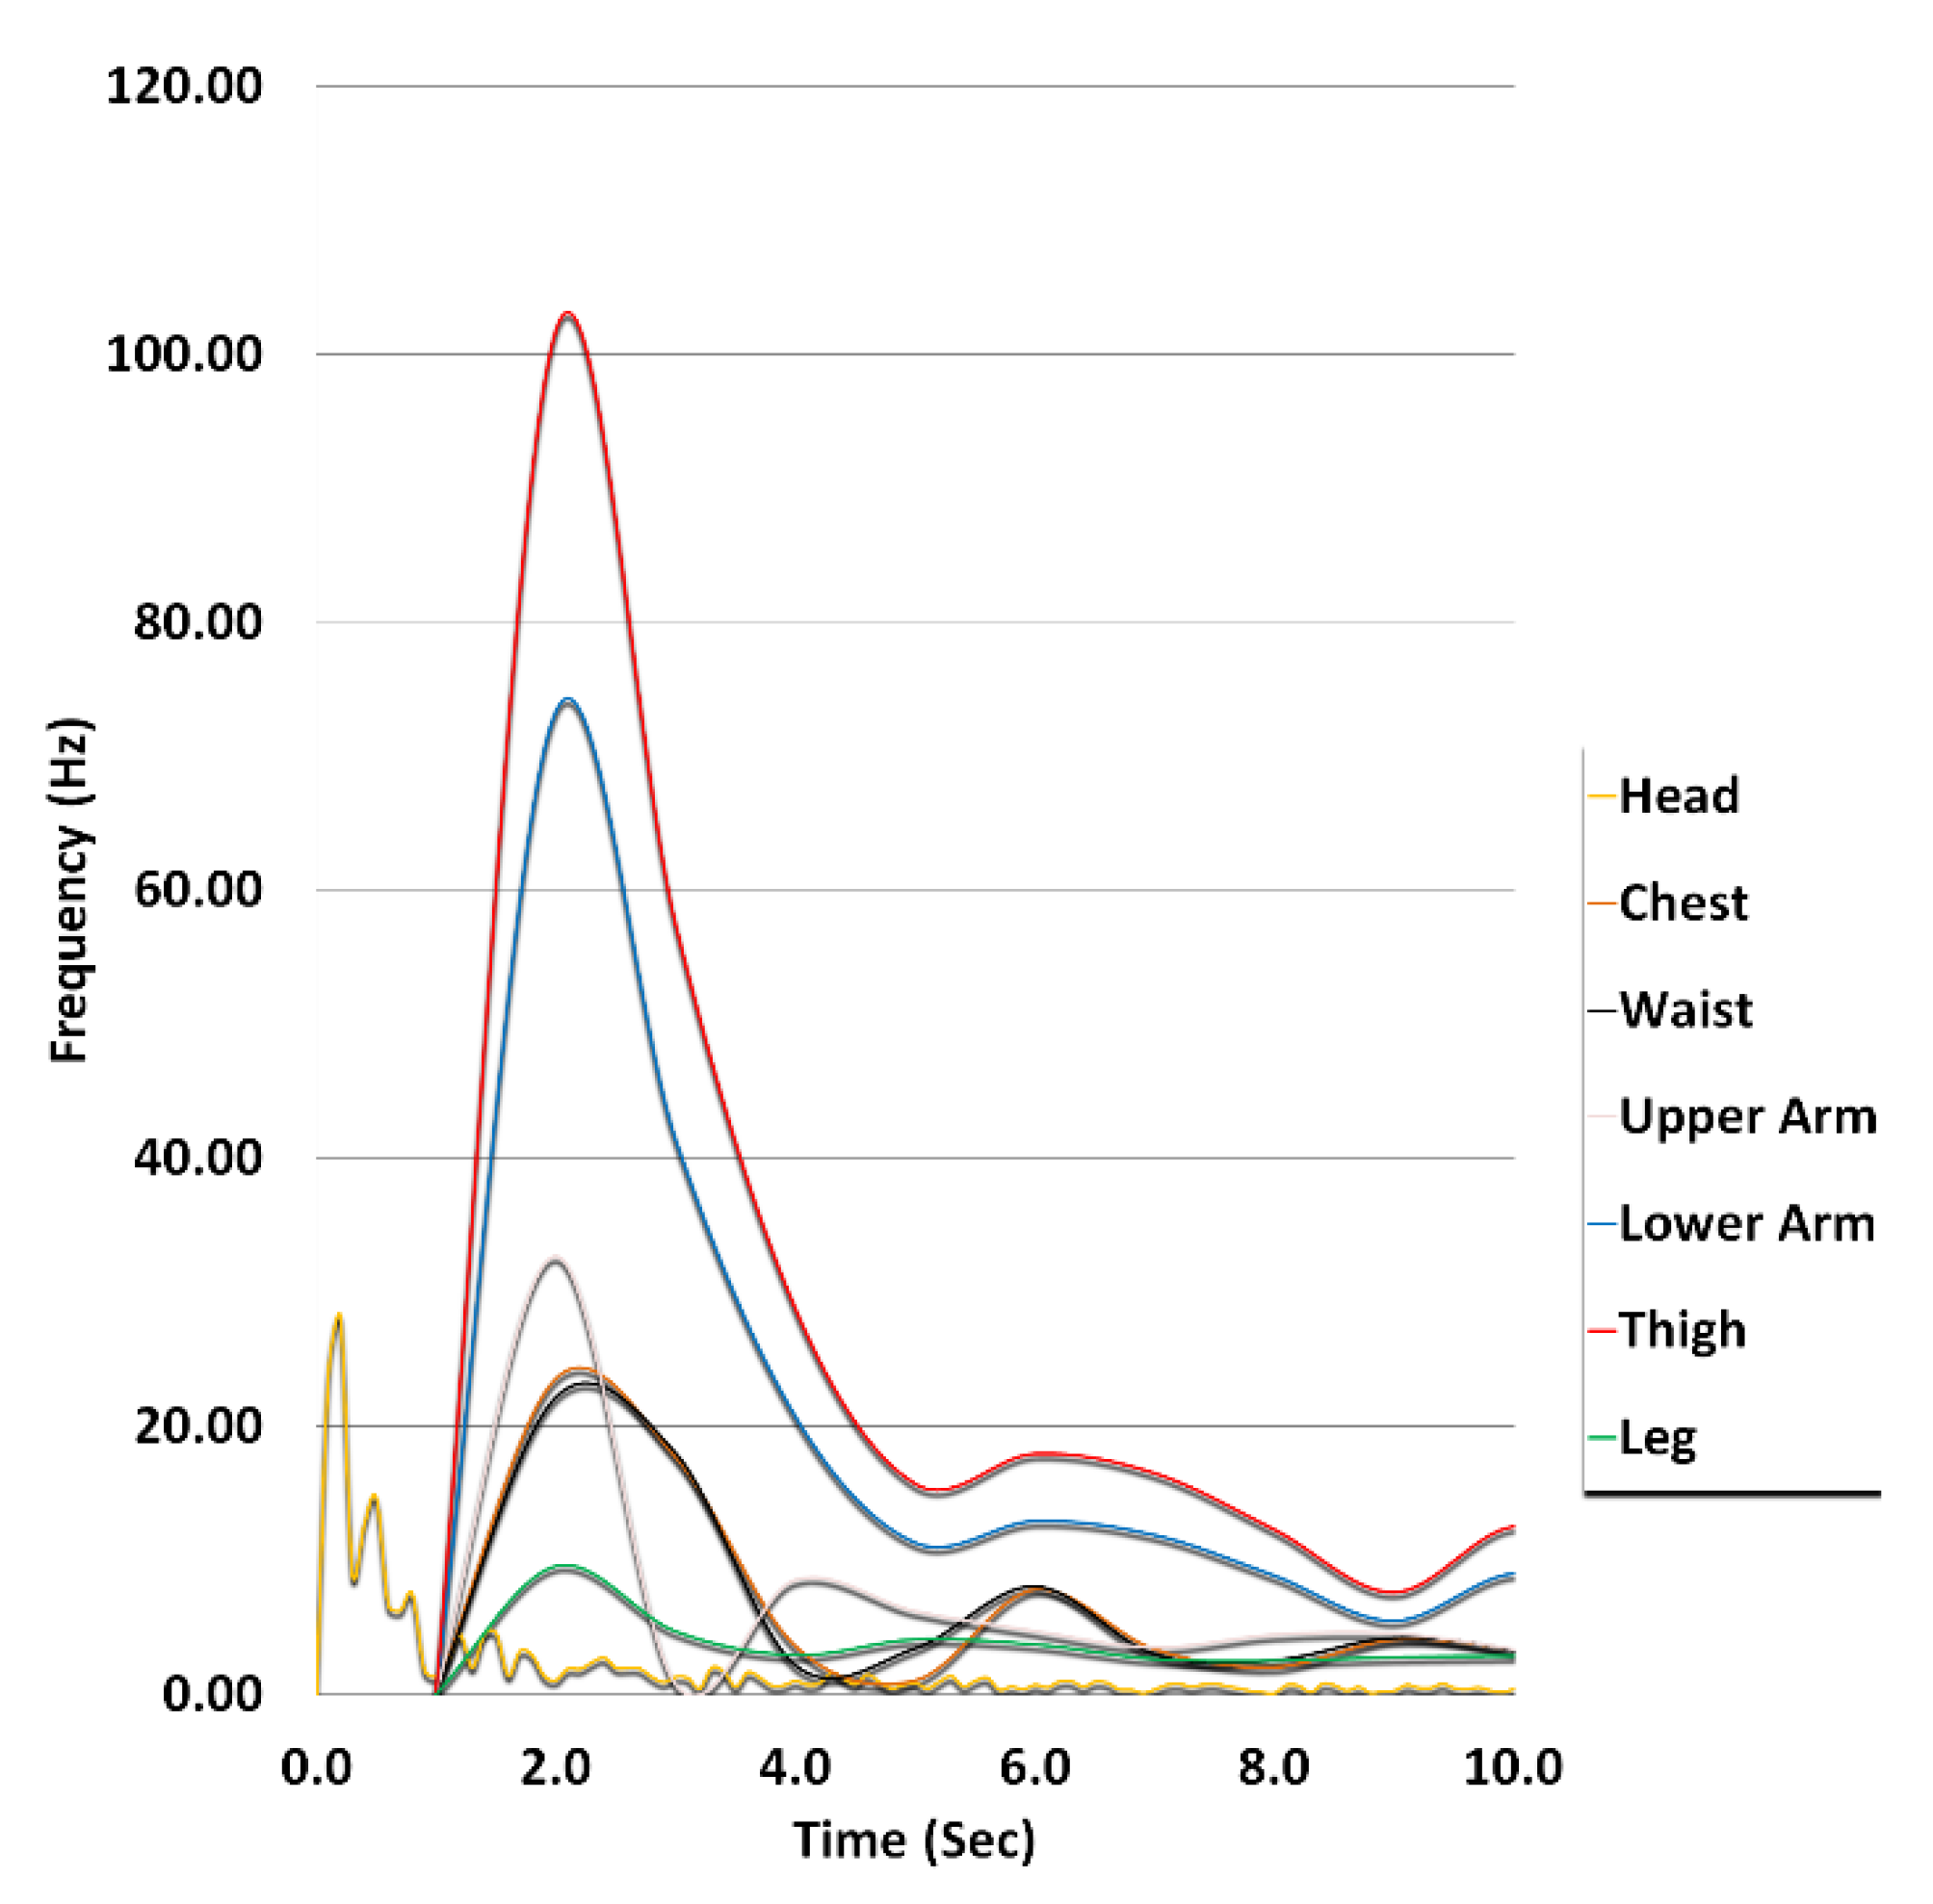
The frequencies at points of interest on the human body were plotted and are shown in
Figure 7.
The average frequency values of all the human portions were extracted from the frequency plot and are shown in
Table 1.
4. Validation and Discussions
The vertical acceleration values obtained from this simulation work were validated by the testing data gathered from real-life car and driver system operating at the condition identical to this simulation set up. A standard hatchback car was maintained to achieve a speed of 30–35 m/h from static state, whereas a human male driver of 78 kg mass occupied the driver seat. The road terrain had no visible sign of roughness, and acceleration vs. time data was recorded for 60 s. The vibration measurement equipment—NI 9234 USB module, CompactDAQ chassis, and transducer Dytran 3055—were utilized to record data at different points of driver body. Testing set up and sample raw test data for thigh of human male driver are shown in
Figure 8 and
Figure 9, respectively.
The testing data for vertical acceleration were collected in SOT (In-built file type from “m+p Analyzer”) format for a time span of 60 s, and to match to the time duration of simulation, the test data were curtailed and filtered to initial 10 s in XLS (ExceL Spreadsheet) format. For comparison purpose, test data and the respective simulation results were merged into a single plot area, and the contrasts are displayed in
Figure 10.
For human head, human waist, and human upper arm, the upper and lower limits of the testing data were well below the respective limits of simulation results. For human chest, human lower arm, and human thigh, the upper limits of accelerations from simulation were above the respective upper limits of test data, whereas magnitudes of the lower limits of accelerations from testing data exceeded the respective limits from simulation results. For human leg, both the limits from simulation results were lower that the respective testing data. The testing data were based on both the human body and the car seat, where numerous parameters were associated while measuring the acceleration output, and each of the parameters was capable of manipulating the output characteristics on its own. In contrast, at the present stage of this analysis work, the simplified human model was utilized and no car seat was associated with the human model in finite element simulation. Thus, the mismatches between the testing data and simulation results were inevitable.
To validate the frequencies obtained from this simulation work, past references in the relevant field were consulted. While establishing the biodynamic model of human body [
36], the frequency ranges in the for-aft and vertical directions were taken as 0.5–12 Hz and 0.5–20 Hz, respectively. Vibro-acoustic analysis on the human body [
45] presented a set of frequency data for different human organs and parts, as shown in
Table 2.
From the past investigations in the field of human biomechanics, it is inevitably clear that the maximum permissible level of frequency inside the human portions are generally restricted to a limit of 20 Hz. The international standards on biodynamics and ergonomics ISO/TC 159/SC 1, ISO/TC 159/SC 3, and ISO/TC 159/SC 4 also outline the guidelines to design the human interfacing structures not exceeding this limit. International standard vibration transmission study [
46] on 12 human objects reported frequency level as 4 Hz, whereas the peak values were between 8 Hz and 9 Hz. Acceleration transmission investigation on human lumbar spine [
47] found the frequency to be in-between 4 Hz and 5 Hz. Seat–head transmissibility analysis [
48] reported the frequency value of 5 Hz. Acceleration transmission and mode shapes of human body were investigated [
13,
49], and the first two natural frequencies for the entire human body were reported as 5 Hz and 8–9 Hz. ISO 5892 (2001) defined the frequency value of 5 Hz for seat–head transmissibility in seated posture without the presence of car seat backrest. Hence, it can be stated that the results from this simulation methodology showed justified levels of average frequency values, compared to the allowable ranges for human organs as explored in different studies.
In this simulation work, to obtain the frequency data at different locations of a human inside an automotive structure, forced vibration formulations were implemented and three-dimensional human shape-specific stiffness values were applied. The frequencies of the waist and chest shown in
Figure 7 were almost identical and this occurrence because of the consideration of waist and chest within a single ellipsoidal body. Human thigh was under the effect of highest level of frequency, and that was justified as the fixed connection had been applied at the thigh underneath instead of in contact interaction to the polyurethane seat foam cushion. Peak value of each curve of the frequency plot was above the permissible limit. It was obviously understandable that association of automotive seat cushion with hyperelastic and viscoelastic material properties to the developed human model in this unique finite element technique will provide more realistic outputs, possibly with lower peak magnitudes. Consideration of real shaped anatomical geometry of the human being will also add some advantage to obtain more accurate results.
Because of the limitation of computer hardware, the simulation running time was set to 10 s for this research work. Operating the complete simulation work in a highly configured computer system will help the simulation to run more than 10 s. Bearing in mind the uneven and non-uniform surface of the road terrain, it is recommended that the analysis be run for at least 60 s. From the curve in the frequency plot, we observed that the frequency values gradually declined and stabilized over time. Thus, running the simulation for a longer period would eventually yield more accurate frequency and vertical acceleration values for the seated human portions. This unique simulation methodology is useful in predicting the vertical accelerations and frequencies at various segments of seated human body inside a moving car to optimize human health, comfort, and safety, regardless of the justified amount of gaps between the collected test data and simulation outcomes.
5. Conclusions and Scopes of Further Development
In this paper, a unique finite element simulation methodology was described to predict the final level of vibration inside car seated human body. From the outputs of this research work, the following conclusions can be drawn:
Finite element method can be used effectively to simulate the entire human body to predict the acceleration and frequency values at different points of a car-seated human body. Numerous combinations of different input parameters can be chosen for the analysis work, and the greater the numbers of parameters considered, more realistic and accurate the outputs that can be obtained from the results.
Human portions can be represented by ellipsoidal segments and bone–muscle structure can be modelled through the concept of matrix-fibre system to define the shape and size-specific stiffness data. The stiffness values calculated by this method have a higher degree of practical feasibility compared with gathering the stiffness values from hypothetical database.
This unique simulation methodology is able to predict the peak acceleration values and average frequency magnitude inside the segments of car-seated human in a justified way. More detailed investigations of the human and automotive parameters are required in order to minimize the frequency peak values.
An enormous scope of future development is there to take this research work to an advanced level. Firstly and most importantly, a longer simulation running time will be beneficial to characterize the level of accelerations and frequency inside human parts in a better way. In this span of research work, 10 s simulation time was considered, which was useful in characterizing the acceleration and frequency levels during the accelerating period of non-racer cars. Secondly, damping and stiffness data can be calculated and assigned in a more accurate way. It was observed that the frequency curves from this simulation output became steady over time; therefore, the effects of damping and stiffness parameters worked as expected, and more realistic damping and stiffness properties would evidently show more convincing frequency curves. Thirdly, association of car seat to the developed human model and assigning the mating interfaces between seat and human body would potentially reduce the level of vibration inside the whole human–seat assembly. If the viscoelastic and hyperelastic material properties of an automotive seat foam cushion are modelled and the entire human–seat assembly is excited with forced vibration as per a real life condition, the obtained simulation results will be in a more convincing shape when compared with the experimental test data.
On the basis of all these discussions, it can be concluded that this unique biodynamic simulation technique exhibited reasonable values of all the desired outputs. Thus, the present research work is headed towards the right direction and this unique methodology with further refinement can successfully be executed to anticipate the accelerations and frequencies inside a car-seated human body of different ages, shapes, and genders. As explained earlier, this technique can help to substitute the time-consuming and costly real life vibration testing method for different human segments in various industries with favourable and non-favourable operating scenarios where human entities are exposed to machinery pulsation.


