Abstract
Conducting polymers are often used as sensor electrodes due to their conjugated chain structure, which leads to high sensitivity and rapid response at room temperature. Numerous studies have been conducted on the structures of conducting polymer nanomaterials to increase the active surface area for the target materials. However, studies on the control of the chemical state of conducting polymer chains and the modification of the sensing signal transfer with these changes have not been reported. In this work, polypyrrole nanoparticles (PPyNPs), where is PPy is a conducting polymer, are applied as a sensor transducer to analyze the chemical sensing ability of the electrode. In particular, the protonation of PPy is adjusted by chemical methods to modify the transfer sensing signals with changes in the polymer chain structure. The PPyNPs that were modified at pH 1 exhibit high sensitivity to the target analyte (down to 1 ppb of NH3) with short response and recovery times of less than 20 s and 50 s, respectively, at 25 °C.
1. Introduction
In the past few decades, chemical gas sensors have been widely used in several applications, including the detection of combustible, flammable, and toxic gases [1,2,3,4,5]. Various semiconductive materials are used as transducers for chemical sensors, and extensive investigations have been conducted to improve their performance [6,7,8,9]. The critical indicators for sensor performance include high sensitivity to the target analyte, short response and recovery times, and cycle stability [10,11]. Among these, the sensitivity and cycle stability are optimized via the control of the morphology of electrode materials. However, the response and recovery times can be adjusted by modifying the semiconductive properties of the electrode material, unlike other factors.
Conducting polymers, which are semiconductive materials, have been investigated for sensor applications, owing to their versatility originating from the conjugated backbone structure consisting of alternating single and double bonds [12,13]. Conducting polymers have been used as sensor transducers with inherent electronic, optical, and mechanical transducing properties because of their unique properties [14,15,16]. Considerable efforts have been directed toward the fabrication of nanometer-scale conducting polymers, owing to their beneficial characteristics, such as small size, high surface-to-volume ratio, and amplified signals, to enhance the sensitivity [17,18,19,20]. In recent years, several studies have focused on increasing the surface area of conducting polymer nanomaterials to maximize the interactions between the transducers and analytes [21,22,23,24]. Cho et al. fabricated multidimensional conductive nanofilms that consisted of graphene-coated carboxyl polypyrrole nanowires for application as a Hepatitis B surface antigen aptamer sensor electrode [21]. Bao et al. synthesized three-dimensional polyaniline hydrogels with high surface areas and conductivities for application in glucose oxidase sensors [24]. However, research on controlling the electrical signal transmission speed of the electrode materials is limited.
Among the most popular conducting polymers, polypyrrole (PPy) exhibits several beneficial characteristics, including high electrical conductivity, redox property, and environmental stability [25,26,27]. PPy has been extensively investigated in sensor applications, owing to its unique chemical and electrical properties [28,29,30]. In particular, PPy has different electronic band structures, such as neutral, polaron, and bipolaron states, which can be facilely modified by controlling the doping ratio [31,32]. However, its structure rather than the doping ratio is more often modified for application in sensor transducer materials.
Herein, the sensing performance of polypyrrole nanoparticles (PPyNPs) as a sensor transducer in different chemical states is investigated. First, PPyNPs with a uniform diameter of 60 nm were synthesized via a modified monodisperse method, and then subjected to chemical treatment while using aqueous solutions of different pH levels (pH 1–13). The charge carrier (hole) density and diameter of the particles decreased with an increase in pH, owing to the deprotonation of the polymer chain under basic conditions. The nanoparticles with controlled protonation were subsequently introduced on an interdigitated array electrode surface via spin-coating for application as an NH3 gas-sensing transducer. The sensor electrode at pH 1 exhibited high sensitivity to the target analyte (down to 1 ppb of NH3), with short response and recovery times of less than 20 s and 50 s, respectively, at 25 °C.
2. Materials and Methods
2.1. Materials
Iron chloride (III) FeCl3 (97%), poly(vinyl alcohol) (PVA, Mw 9000), dodecyl trimethylammonium bromide (DTAB, ≥ 98%), and pyrrole (98%) were purchased from Sigma–Aldrich and used as purchased. Sodium hydroxide (NaOH, 95%) and hydrochloric acid (HCl, 35~37%) were purchased from Samchun Pure Chemical Company (Pyeongtaek-si, Korea).
2.2. Fabrication of PPyNPs
PPyNPs were prepared while using PVA, FeCl3, and pyrrole in distilled water. A 0.5 g sample of PVA in distilled water (50 mL) was magnetically stirred (300 rmp) at 25 °C for 1 h. After the dissolution of PVA in distilled water, 0.02 mol of FeCl3 was added into the aqueous PVA solution with 300 rpm. After 1 h of equilibration, 0.06 mol of pyrrole monomer was rapidly added into the aqueous PVA/FeCl3 solution and then stirred for 4 h. After the completion of polymerization, the resulting nanoparticles were separated from the dispersion by centrifugation and then washed several times with water to remove the impurities. The remaining PPyNP precipitate was dried in a vacuum oven at room temperature for 6 h.
2.3. Protonation Control of PPyNPs
PPyNPs were added to the aqueous solutions with different pH values and sonicated for 1 h to uniformly disperse the nanoparticles in the solution. Except for pH 7, HCl and NaOH were used for realizing acidic and basic conditions, respectively. The pH 7 solution is used commercial phosphate buffers (Samchun Co.). Subsequently, the solutions with PPyNPs were stirred at a low rate for an additional 1 h to allow for the completion of the reaction between the particles and solvent. The mixed solution was centrifuged and dried overnight at 60 °C in an oven.
2.4. Electrical Sensing Measurement of Hazardous Gases
Spin-coating was conducted to obtain a uniformly coated sensor electrode array. In detail, 0.1 wt% PPyNP containing aqueous solution is used. 10 µL of the solution was deposited on the electrode and following spin-coating was conducted (1000 rpm, 60 s). Afterwards, the electrode was dried at 60 °C in an inert atmosphere for 6 h to obtain good electrical ohmic contact between the PPyNPs and electrodes. The sensor electrode was placed inside the vacuum chamber (100 Torr) and connected to a source meter to monitor the resistance change while using a computer. In this experiment, a bubbler was used to vaporize the organic compounds from ammonia and methanol solutions and to mix the vapors with N2 gas using a mass flow controller to modify the concentrations of the analyte gases. The sensor electrode was exposed to various concentrations of analyte gases (1 ppb–100 ppm) for 100 s and then purged with N2 gas to recover the conductance. The measurement was performed by applying a constant current of 10−6 A to the electrode and the sensitivity was calculated by measuring the normalized electrical resistance change, ΔR/R0 = (R − R0)/R0, where R and R0 are the measured real-time resistance and initial resistance, respectively. The response time was defined as the time that is required for a sensor to attain 90% of the maximum signal after gas exposure, and the recovery time was defined as the time that is required by a sensor to attain 10% of the preceding signal after purging with N2 gas. The sensing performance was evaluated under ambient conditions (ca. 20% relative humidity).
2.5. Characterization
The field emission-scanning electron microscopy (FE-SEM) images were obtained while using the JSM-6701F system (JEOL Ltd., Tokyo, Japan). X-ray photoelectron spectroscopy (XPS) data were acquired using a Sigma probe (Thermo, Waltham, MA, USA). The electrical conductivity was measured using a Keithley 2400 system. Raman spectra were obtained while using a LabRam Aramis (Horiba Jobin Yvon, Bensheim, Germany) spectrometer. Ultra-violet visible and near infra-red (UV-vis-NIR) spectra were collected on a UV-3600 Plus spectrophotometer (Shimadzu, Tokyo, Japan).
3. Results and Discussion
3.1. Transformation of Polymer Chain Structure
Uniform PPyNPs (ca. diameter of 60 nm) as a sensor transducer material were synthesized via a modified monodisperse method [30]. Here, polyvinyl alcohol (PVA) and ferric chloride (FeCl3) were dissolved in deionized water to form the PVA/iron cation (Fe3+) complex that acted as the oxidizing and forming agent during the polymerization reaction. Subsequently, the pyrrole monomer was introduced into the aqueous PVA/Fe3+ complex solution with vigorous stirring to allow for the formation of PPyNPs at the reactive sites, where the pyrrole monomer contacted the PVA/Fe3+ complex.
The charge carrier density and mobility of the PPy chain change reversibly with different protonation states, as shown in Figure 1. The expanded state of the polymer chain is formed upon protonation, while the contracted state is formed upon deprotonation. The PPyNPs were dispersed in aqueous solutions with pH values ranging from pH 1 to 13 to achieve different chemical states of the polymer chains. The concentrations of the charge carriers in the polymer chain were determined while using UV-vis-NIR spectroscopy. UV-vis-NIR spectra were collected to examine the types and transition of the polymer chain at various pH values (Figure 2). The polymer nanoparticles at pH 1 show the highest absorption intensity of the band above 1000 nm and around the 450 nm region because of the high carrier density in the polymer chain, which causes a reduction in the band gap, as shown in Figure 2a. An increase in pH results in the reduction of the band intensity above 1000 nm and a blue shift of the medium intensity around 450 nm. These spectral changes show that a high pH results in the loss of protons (reduction) from the polymer chain [33]. Thus, the polymer chains transform from expanded to contracted states with an increase in pH. Figure 2b also shows the maximum absorption at different wavelengths (300, 450, and 1000 nm). The absorption of the bands in the high-NIR region (1000 nm) continuously decreases as the chain structure changes from an expanded to contracted state. In addition, the intensity of absorption at 450 nm (visible) shifts to a low wavelength with an increase in intensity at 300 nm (UV) due to the same reason.

Figure 1.
Chemical structures of polypyrrole (PPy) in different chemical states.
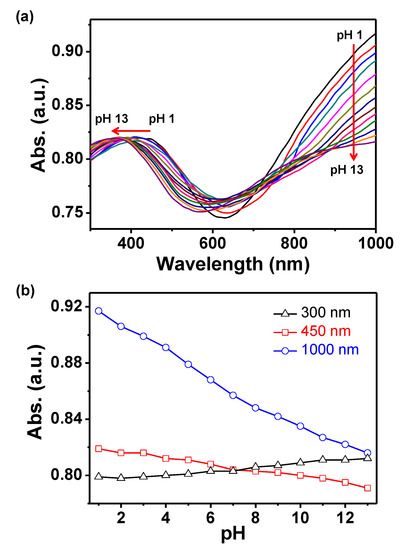
Figure 2.
(a) Ultra-violet visible and near infra-red (UV-vis-NIR) absorption spectra of polypyrrole nanoparticles (PPyNPs) at different pH values. (b) Normalized absorption spectra of PPyNPs with a change in pH at different wavelengths (black for 300 nm, red for 450 nm, and blue for 1000 nm).
Raman spectroscopy was performed to characterize the different chemical states of the PPyNPs. Figure 3a shows the Raman spectra at different pH values (pH 1–13). The bands at 1049 and 1332 cm−1 corresponded to the in-plane C-H and C-C stretching vibrations, respectively. Moreover, the strong bands at 1421 and 1591 cm−1 are attributed to the C=C symmetric and C=C asymmetric vibrations, respectively. These bands shift to 1415 and 1562 cm−1, respectively, with an increase in pH indicating the transformation of the polymer chains from quinoid to benzenoid structures. Specifically, the positively doped species are located at the geometrical defects and form the quinoid structure. Therefore, high pH decreases the amount of (bi)polarons and changes the polymer chain structures to quinoid structures [34,35].
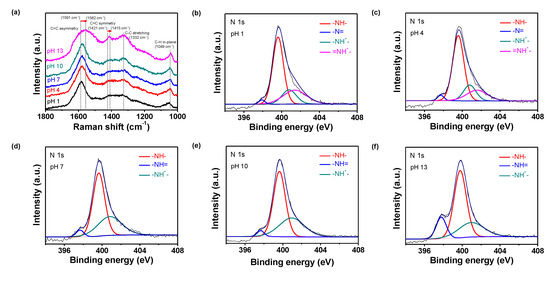
Figure 3.
(a) Raman spectra of PPyNPs at different pH values (black: pH 1, red: pH 4, blue: pH 7, green: pH 10, and pink: pH 13). N 1s X-ray photoelectron spectra (XPS) of PPyNPs at different pH values: (b) pH 1, (c) pH 4, (d) pH 7, (e) pH 10, and (f) pH 13.
Furthermore, high-resolution N 1s X-ray photoelectron spectroscopy (XPS) was employed to confirm the change in the chemical state of the PPy chain at different pH values (Figure 3b–f). The peaks at ca. 400 eV (related to the neutral amine N of the pyrrole unit (-NH-)) and ca. 398 eV (attributed to imine (-N=)) are observed in all cases [36]. For the nanoparticles at pH 1 and 4, two types of positive nitrogen peaks, including the N peaks at 403.0 eV (=NH+-) and 401.4 eV (-NH+-), are observed. At high pH, a peak corresponding to the positively charged N (-NH+-) is observed at 401.4 eV. While using these data, the protonation of the nanoparticles can be calculated in terms of the ratio of the positive nitrogen peak area over the total nitrogen peak area (N+/Ntotal) [37]. On treatment with a base, N+/Ntotal is lower than those that were obtained under other conditions, because the positive nitrogen (N+) content in the structure decreases (i.e., deprotonation) at high pH. Thus, an increase in the protonation (i.e., lower pH) of the particle increases the amount of positively charged N in the structure.
Field emission scanning electron microscopy (FE-SEM) measurements were performed for each nanoparticle to determine the morphological transformations of the PPyNPs with varying pH values (Figure 4). The morphologies of the PPyNPs change reversibly at different pH values through the osmotic effect of the counter ion (Cl−). Upon protonation, the electrons are ejected from the PPyNPs and a positive charge develops in the polymer chain. Thereafter, the anions in the solution can displace and induce a volume expansion in the polymer through the insertion of the counter ions and subsequent uptake of the solvent. Consequently, the average diameter of the individual nanoparticles reduces from 68.71 nm at pH 1 to 60.63 nm at pH 13.
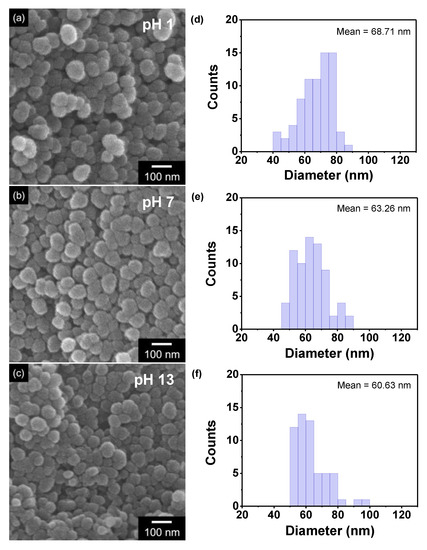
Figure 4.
(a–c) Field emission scanning electron micrographs of PPyNPs and (d–f) size distribution of the nanoparticles within a unit area (1 µm × 1 µm) at different pH values ((a,d): pH 1; (b,e): pH 7; (c,f): pH 13).
3.2. Electrical Conductivity
The electrical conductivity of the PPyNPs is investigated to determine the charge transfer with changes in pH (Figure 5). Different protonation levels control the electrical conductivity (128 S cm−1 at pH 1 to 1.9 S cm−1 at pH 13), as an increase in acidity increases the carrier density (hole) in polymer chains. This is because proton doping occurs during the acidic treatment and the β-carbon in the polymer chain structure is preferentially protonated [38]. Protonation is essential for inducing the short-range ordering of the polymer backbone and for the efficient proton transport in the conjugated chains, and it is achieved by increasing the amount of C=C stretching [39]. Additionally, a significant decrease in the electrical conductivity is observed under basic conditions due to a drastic reduction in the number of charge carriers during deprotonation.
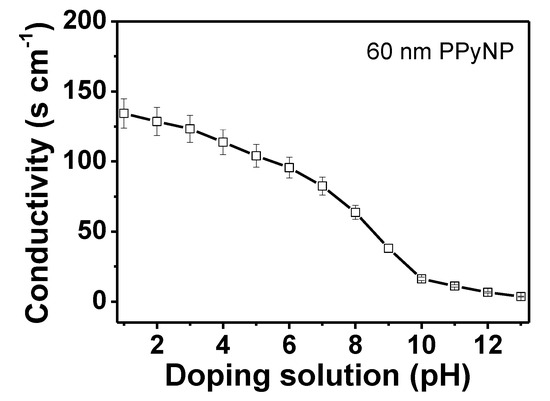
Figure 5.
Electrical conductivities of PPyNPs at various pH values.
3.3. Preparation of PPyNP-Based Sensor Electrode
PPyNPs were immobilized on the interdigitated array electrode to determine the sensing performance of the particles as a function of pH. The conduction pathway and effective surface area were utilized to compare the performance of the particles with the variation in their chemical state. Figure 6 shows the data for the source-drain current as a function of the source-drain voltage (ISD-VSD) for the nanoparticles; the results indicate that the nanoparticles are in good electrical contact with the sensor substrate. However, the uniform decoration of the particles improves the conduction pathway, i.e., increases the sensitivity to the analyte. The randomly stacked arrangement of the PPyNPs that were prepared by drop-casting has a higher contact resistance than the uniform array that was obtained by spin-coating due to the interruption of the conduction pathway through the accumulated particle-particle assembly. Therefore, PPyNPs were deposited on the electrode via spin-coating to determine the sensing performance in real time with minimum contact resistance.
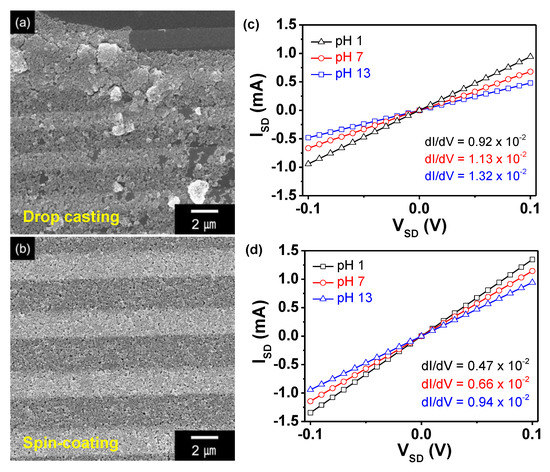
Figure 6.
(a,b) Field emission scanning electron microscopy (FE-SEM) images and (c,d) source-drain voltage-current curves of the PPyNP-decorated sensor electrodes prepared by (a,c) drop-casting or (b,d) spin-coating.
3.4. Comparison of Sensing Performance
The changes in the real-time responsive resistance were measured for different concentrations of gases at 25 °C. Figure 7a shows the sensing performance of the electrodes toward NH3 gas, which is one of the reducing gases, with respect to the pH. The NH3 molecules generate electrons, owing to the reduction characteristics during detection. These electrons are transferred to the PPyNPs, thereby reducing the amount of the charge carriers (hole) in the polymer chain. Therefore, the resistance of the sensor electrode increases, owing to the p-type semiconductor characteristics of the polymer. The sensor electrodes exhibit being highly sensitive toward NH3 down to 10 ppb due to the uniformly decorated nanoparticles on the IDA electrode. However, the response amounts of the electrodes display increase with reducing pH of solution. The more protonated PPyNPs (treated at pH 1) have more holes in the chain structure, indicating a higher degree to change in external electron flow. On the other hand, the electrode that was treated at pH 13 shows the smallest amount of resistance change, even though it has the smallest diameter. Thus, a reduction in the amount of holes, rather than a reduction in the surface area, has a greater effect on response change. Figure 7b shows the recovery times of the electrodes, exhibiting a decrease from 59 s (pH 13) to 19 s (pH 1). The numerous charge carriers (hole) at pH 1 induce the rapid transfer of electrons from the analyte and reduce the response time to <20 s. However, the recovery times of the electrodes exhibit similar values, i.e., 66 s for pH 13, 61 s for pH 7, and 49 s for pH 1, because the detachment of the target molecule is related to the applied external energy rather than to the charge carriers and number of active sites (Figure 7c). Moreover, the sensing performance with decreasing NH3 concentration was also measured to confirm the reproducibility of the electrode. Figure 7d shows that the sensing ability of the electrode remains constant, regardless of the direction of change in NH3 concentration. In addition, we also compared the response and recovery times of the electrode with the direction of concentration changes. The response time of the sensor electrode is similar (19 s) in both cases, as shown in Figure 7e. However, the recovery time for backward direction (60 s) presents a little longer than forward direction (49 s), due to exposure to large amount of NH3 molecules during detection (Figure 7f). Therefore, PPy-based sensor electrodes have good reproducibility for environmental changes.
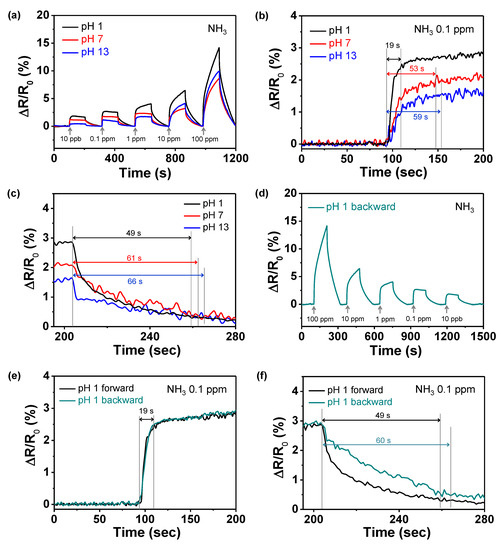
Figure 7.
Reversible and reproducible responses are measured at a constant current (10−6 A) for PPy-based electrodes. (a) Normalized resistance changes upon sequential exposure to increasing concentrations of NH3 at different pH values. (b) Response and (c) recovery times of PPyNPs toward 0.1 ppm of NH3 at different pH values. (d) Normalized resistance changes of pH 1 based-electrode upon sequential exposure to decrease concentrations of NH3. (e) Response and (f) recovery times of pH 1 based-electrode toward 0.1 ppm of NH3, depending on the direction of increase (black) and decrease (green) in concentration of NH3.
Additionally, methanol (MeOH) was used to determine the sensing ability for an oxidizing gas (opposite charge-transfer direction) (Figure 8a). The electrode oxidized at pH 1 is superior to other electrodes for the same reason, as observed in the case of NH3. Figure 8b shows the variation in the normalized resistance of the electrodes as a function of NH3 and MeOH gas concentrations. The linear-behavior range is larger for the electrode oxidized at pH 1 (1 ppb–102 ppm for NH3 and 0.1–103 ppm for MeOH) than for the other electrodes. Therefore, the sensor electrode oxidized at pH 1 can be effectively utilized as a signal transducer for detecting NH3 and MeOH gases at various concentrations. Additionally, outstanding cycle stability is required for use of the electrode materials in practical sensor devices. Figure 8c shows the change in the resistance of the electrode at pH 1 upon periodic exposure to 10 ppb NH3 gas. During the five repetitive on–off tests, the resistance changes remain relatively constant, without a delay in the response or recovery. Furthermore, the sensor electrodes maintain their sensing ability during exposure to 0.1 ppm of NH3 over 15 days (Figure 9).
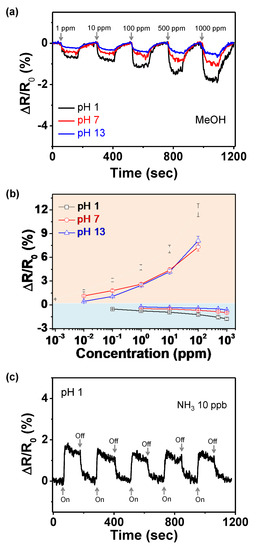
Figure 8.
(a) Change in normalized resistance with different MeOH concentrations. (b) Calibration curves of PPyNPs as functions of NH3 and MeOH concentrations; black for pH 1, red for pH 7, and blue for pH 13. (c) Periodic exposure of PPyNPs treated at pH 1 to 10 ppb of NH3 gas.
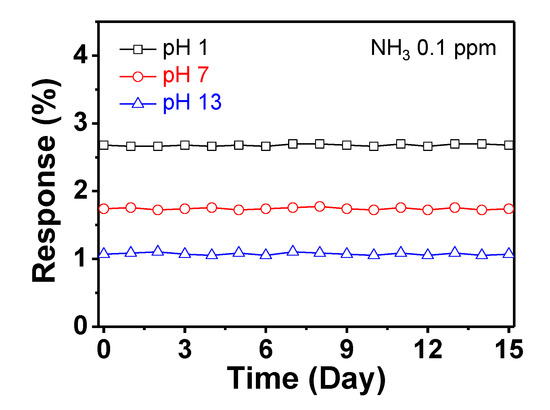
Figure 9.
Normalized resistance changes of the electrodes with periodic exposure to 0.1 ppm of NH3 for 15 days (black: pH 1; red: pH 7; blue: pH 13).
The selectivity of the sensor electrodes is also important for practical applications. Figure 10 exhibits the variation in the normalized resistance of the electrode at pH 1 upon exposure to various volatile gases at low concentrations (1 ppm for NH3 and MeOH; 100 ppm for others). NH3 yields a signal change that is more than five times larger when compared to those of the other gases, although its concentration is lower than those of other gases. Therefore, NH3 can be distinguished from other gases based on the extent and direction of the resistance change.
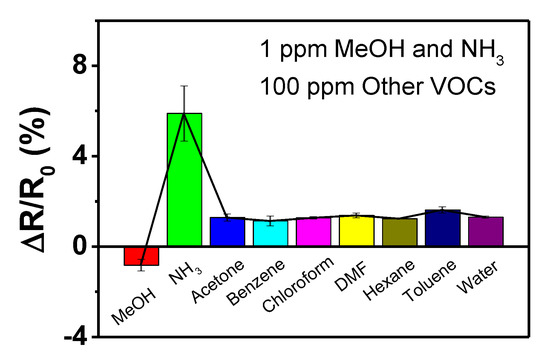
Figure 10.
Sensing performance histogram of the PPyNPs treated at pH 1 toward different oxidizing and reducing volatile gases. The concentrations of the gases are 1 ppm for NH3 and MeOH and 100 ppm for other gases.
4. Conclusions
In summary, the chemical states of PPyNPs are investigated at various pH levels for application in hazardous-gas sensors. The structure of the polymer chain changes from the expanded to contracted state, with an increase in pH. The nanoparticles at pH 1 show higher electrical conductivity (128 S cm−1) and larger diameters than those at other pH levels, due to an increase in the amount of charge carriers (hole) in the chain structure and the osmotic effect of the counter ions. As an NH3 sensing transducer material, the nanoparticles at pH 1 have short response and recovery times of less than 20 s and 50 s, respectively, with high sensitivity (down to 1 ppb) at 25 °C. Thus, the performance of the conductive nanostructures is optimized through chemical-state control, and the proposed method can be effectively applied for the development of electrical devices and sensor systems.
Author Contributions
W.K. performed the experiments; S.C. conceived and designed the experiments; J.S.L. analyzed the data and wrote the paper. All authors have read and agreed to the published version of the manuscript.
Funding
This research received no external funding.
Acknowledgments
This work was supported by the National Research Foundation of Korea (NRF) grant funded by Korea government (NRF-2018R1C1B5041562).
Conflicts of Interest
The authors declare no conflict of interest.
References
- He, Y.; Li, D.; Gao, W.; Yin, H.; Chen, F.; Sun, Y. High-performance NO2 sensors based on spontaneously functionalized hexagonal boron nitride nanosheets via chemical exfoliation. Nanoscale 2019, 11, 21909–21916. [Google Scholar] [PubMed]
- Jannat, A.; Haque, F.; Xu, K.; Zhou, C.; Zhang, B.Y.; Syed, N.; Mohiuddin, M.; Messalea, K.A.; Li, X.; Gras, S.L.; et al. Exciton-Driven Chemical Sensors Based on Excitation-Dependent Photoluminescent Two-Dimensional SnS. ACS Appl. Mater. Interfaces 2019, 11, 42462–42468. [Google Scholar] [PubMed]
- Mi, H.-Y.; Liu, J.-L.; Guan, M.-M.; Liu, Q.-W.; Zhang, Z.-Q.; Feng, G.-D. Fluorescence chemical sensor for determining trace levels of nitroaromatic explosives in water based on conjugated polymer with guanidinium side groups. Talanta 2018, 187, 314–320. [Google Scholar] [PubMed]
- Kim, W.; Lee, J.S.; Jang, J. Facile synthesis of size-controlled Fe2O3 nanoparticle-decorated carbon nanotubes for highly sensitive H2S detection. RSC Adv. 2018, 8, 31874–31880. [Google Scholar]
- Kim, S.G.; Jun, J.; Lee, J.S.; Jang, J. A highly sensitive wireless nitrogen dioxide gas sensor based on an organic conductive nanocomposite paste. J. Mater. Chem. A 2019, 7, 8451–8459. [Google Scholar]
- Barbosa, M.S.; Suman, P.H.; Kim, J.J.; Tuller, H.L.; Orlandia, M.O. Investigation of electronic and chemical sensitization effects promoted by Pt and Pd nanoparticles on single-crystalline SnO nanobelt-based gas sensors. Sens. Actuator B-Chem. 2019, 301, 127055. [Google Scholar]
- Kekkonen, J.; Finnilä, M.A.J.; Heikkilä, J.; Anttonen, V.; Nissinen, I. Chemical imaging of human teeth by a time-resolved Raman spectrometer based on a CMOS single-photon avalanche diode line sensor. Analyst 2019, 144, 6089–6097. [Google Scholar]
- Si, H.; Pan, N.; Zhang, X.; Liao, J.; Rumyantseva, M.N.; Gaskov, A.M.; Lina, S. A real-time on-line photoelectrochemical sensor toward chemical oxygen demand determination based on field-effect transistor using an extended gate with 3D TiO2 nanotube arrays. Sens. Actuator B-Chem. 2019, 289, 106–113. [Google Scholar]
- Cho, S.-Y.; Jang, D.; Kang, H.; Koh, H.-J.; Choi, J.; Jung, H.-T. Ten Nanometer Scale WO3/CuO Heterojunction Nanochannel for an Ultrasensitive Chemical Sensor. Anal. Chem. 2019, 91, 6850–6858. [Google Scholar]
- Broza, Y.Y.; Zhou, X.; Yuan, M.; Qu, D.; Zheng, Y.; Vishinkin, R.; Khatib, M.; Wu, W.; Haick, H. Disease Detection with Molecular Biomarkers: From Chemistry of Body Fluids to Nature-Inspired Chemical Sensors. Chem. Rev. 2019, 119, 11761–11817. [Google Scholar]
- Piro, B.; Mattana, G.; Noël, V. Recent Advances in Skin Chemical Sensors. Sensors 2019, 19, 4376. [Google Scholar]
- Jang, J. Conducting Polymer Nanomaterials and Their Applications. Adv. Polym. Sci. 2006, 199, 189–259. [Google Scholar]
- Cho, S.; Lee, J.S.; Joo, H. Recent Developments of the Solution-Processable and Highly Conductive Polyaniline Composites for Optical and Electrochemical Applications. Polymers 2019, 11, 1965. [Google Scholar]
- Moon, J.-M.; Thapliyal, N.; Hussain, K.K.; Goyal, R.N.; Shim, Y.-B. Conducting polymer-based electrochemical biosensors for neurotransmitters: A review. Biosens. Bioelectron. 2018, 102, 540–552. [Google Scholar]
- Wang, G.; Morrin, A.; Li, M.; Liu, N.; Luo, X. Nanomaterial-doped conducting polymers for electrochemical sensors and biosensors. J. Mater. Chem. B 2018, 6, 4173–4190. [Google Scholar]
- Park, S.J.; Park, C.S.; Yoon, H. Chemo-Electrical Gas Sensors Based on Conducting Polymer Hybrids. Polymers 2017, 9, 155. [Google Scholar]
- Li, S.; Liu, A.; Yang, Z.; He, J.; Wang, J.; Liu, F.; Lu, H.; Yan, X.; Sun, P.; Liang, X.; et al. Room temperature gas sensor based on tin dioxide@ polyaniline nanocomposite assembled on flexible substrate: Ppb-level detection of NH3. Sens. Actuator B-Chem. 2019, 299, 126970. [Google Scholar]
- Bhadra, J.; Popelka, A.; Abdulkareem, A.; Ahmad, Z.; Touati, F.; Al-Thani, N. Fabrication of polyaniline–graphene/polystyrene nanocomposites for flexible gas sensors. RSC Adv. 2019, 9, 12496–12506. [Google Scholar]
- Hassan, G.; Sajid, M.; Choi, C. Highly Sensitive and Full Range Detectable Humidity Sensor using PEDOT: PSS, Methyl Red and Graphene Oxide Materials. Sci. Rep. 2019, 9, 15227. [Google Scholar]
- Zhang, Q.; Wang, X.; Fu, J.; Liu, R.; He, H.; Ma, J.; Yu, M.; Ramakrishna, S.; Long, Y. Electrospinning of Ultrafine Conducting Polymer Composite Nanofibers with Diameter Less than 70 nm as High Sensitive Gas Sensor. Materials 2018, 11, 1744. [Google Scholar]
- Cho, K.H.; Shin, D.H.; Oh, J.; An, J.H.; Lee, J.S.; Jang, J. Multidimensional Conductive Nanofilm-Based Flexible Aptasensor for Ultrasensitive and Selective HBsAg Detection. ACS Appl. Mater. Interfaces 2018, 10, 28412–28419. [Google Scholar] [PubMed]
- Lee, J.S.; Kim, S.G.; Jun, J.; Shin, D.H.; Jang, J. Aptamer-Functionalized Multidimensional Conducting-Polymer Nanoparticles for an Ultrasensitive and Selective Field-Effect-Transistor Endocrine-Disruptor Sensors. Adv. Funct. Mater. 2014, 24, 6145–6153. [Google Scholar]
- Lee, J.S.; Kim, W.; Cho, S.; Jun, J.; Cho, K.H.; Jang, J. Multidimensional hybrid conductive nanoplate-based aptasensor for platelet-derived growth factor detection. J. Mater. Chem. B 2016, 4, 4447–4454. [Google Scholar]
- Pan, L.; Yu, G.; Zhai, D.; Lee, H.R.; Zhao, W.; Liu, N.; Wang, H.; Tee, B.C.-K.; Shi, Y.; Cui, Y.; et al. Hierarchical nanostructured conducting polymer hydrogel with high electrochemical activity. Proc. Natl. Acad. Sci. USA 2012, 109, 9287–9292. [Google Scholar]
- Shen, L.; Huang, X. Tuning the morphologies and electrical properties of azobenzene-4,4′-dicarboxylate-doped polypyrrole via ultraviolet light irradiation and medium pH alteration. Polymers 2019, 176, 188–195. [Google Scholar]
- Santino, L.M.; Diao, Y.; Yang, H.; Lu, Y.; Wang, H.; Hwang, E.; D’Arcy, J.M. Vapor/liquid polymerization of ultraporous transparent and capacitive polypyrrole nanonets. Nanoscale 2019, 11, 12358–12369. [Google Scholar]
- Hea, W.; Zhao, G.; Sun, P.; Hou, P.; Zhu, L.; Wang, T.; Lib, L.; Xu, X.; Zhai, T. Construction of Longan–like hybrid structures by anchoring nickel hydroxide on yolk–shell polypyrrole for asymmetric supercapacitors. Nano Energy 2019, 56, 207–215. [Google Scholar]
- Tang, X.; Raskin, J.-P.; Kryvutsa, N.; Hermans, S.; Slobodian, O.; Nazarovc, A.N.; Debliquy, M. An ammonia sensor composed of polypyrrole synthesized on reduced graphene oxide by electropolymerization. Sens. Actuator B-Chem. 2020, 305, 127423. [Google Scholar]
- Domínguez-Renedo, O.; Navarro-Cuñado, A.M.; Arnáiz-Lozano, V.; Alonso-Lomillo, M.A. Molecularly imprinted polypyrrole based electrochemical sensor for selective determination of 4-ethylphenol. Talanta 2020, 207, 120351. [Google Scholar]
- Jun, J.; Oh, J.; Shin, D.H.; Kim, S.G.; Lee, J.S.; Kim, W.; Jang, J. Wireless, Room Temperature Volatile Organic Compound Sensor Based on Polypyrrole Nanoparticle Immobilized Ultrahigh Frequency Radio Frequency Identification Tag. ACS Appl. Mater. Interfaces 2016, 8, 33139–33147. [Google Scholar]
- Camurlu, P. Polypyrrole derivatives for electrochromic applications. RSC Adv. 2014, 4, 55832–55845. [Google Scholar]
- Patil, A.O.; Heeger, A.J.; Wudl, F. Optical Properties of Conducting Polymers. Chem. Rev. 1988, 88, 183–200. [Google Scholar]
- Arjomandi, J.; Shah, A.-u.-H.A.; Bilal, S.; Hoang, H.V.; Holze, R. In situ Raman and UV–vis spectroscopic studies of polypyrrole and poly(pyrrole-2,6-dimethyl-β-cyclodextrin). Spectroc. Acta Pt. A-Molec. Biomolec. Spectr. 2011, 78, 1–6. [Google Scholar]
- Santos, M.J.L.; Brolo, A.G.; Girotto, E.M. Study of polaron and bipolaron states in polypyrrole by in situ Raman spectroelectrochemistry. Electrochim. Acta 2007, 52, 6141–6145. [Google Scholar]
- Nguyen Thi Le, H.; Bernard, M.C.; Garcia-Renaud, B.; Deslouis, C. Raman spectroscopy analysis of polypyrrole films as protective coatings on iron. Synth. Met. 2004, 140, 287–293. [Google Scholar]
- Carrasco, P.M.; Cortazar, M.; Ochoteco, E.; Calahorra, E.; Pomposo, J.A. Comparison of surface and bulk doping levels in chemical polypyrroles of low, medium and high conductivity. Surf. Interface Anal. 2006, 39, 26–32. [Google Scholar]
- Joo, J.; Lee, J.K.; Lee, S.Y.; Jang, K.S.; Oh, E.J.; Epstein, A.J. Physical Characterization of Electrochemically and Chemically Synthesized Polypyrroles. Macromolecules 2000, 33, 5131–5136. [Google Scholar]
- Li, Y.; He, G. Effect of preparation conditions on the two doping structures of polypyrrole. Synth. Met. 1998, 94, 127–129. [Google Scholar]
- Cheah, K.; Forsyth, M.; Truong, V.-T. Ordering and stability in conducting polypyrrole. Synth. Met. 1998, 94, 215–219. [Google Scholar]
© 2020 by the authors. Licensee MDPI, Basel, Switzerland. This article is an open access article distributed under the terms and conditions of the Creative Commons Attribution (CC BY) license (http://creativecommons.org/licenses/by/4.0/).