Article

Loss of Control Prediction for Motorcycles during Emergency Braking Maneuvers Using a Supervised Learning Algorithm †

Dipartimento di Ingegneria Industriale, Università degli Studi di Firenze, Via di Santa Marta 3-50139 Firenze, Italia
*
Author to whom correspondence should be addressed.
This paper is an extended version of paper published in the international Symposium on Bicycle and Motorcycle Dynamics, BMD 2019, held in Padova, Italy, 9–11 September 2019.
Appl. Sci. 2020, 10(5), 1754; https://doi.org/10.3390/app10051754
Submission received: 10 January 2020 / Revised: 21 February 2020 / Accepted: 25 February 2020 / Published: 4 March 2020
(This article belongs to the Special Issue Intelligent Transportation Systems)

Abstract

:
The most common evasive maneuver among motorcycle riders and one of the most complicated to perform in emergency situations is braking. Because of the inherent instability of motorcycles, motorcycle crashes are frequently caused by loss of control performing braking as an evasive maneuver. Understanding the motion conditions that lead riders to start losing control is essential for defining countermeasures capable of minimizing the risk of this type of crashes. This paper provides predictive models to classify unsafe loss of control braking maneuvers on a straight line before becoming irreversibly unstable. We performed braking maneuver experiments in the field with motorcycle riders facing a simulated emergency scenario. The latter involved a mock-up intersection in which we generated conflict events between the motorcycle ridden by the participants and an oncoming car driven by trained research staff. The data collected comprises 165 braking trials (including 11 trials identified as loss of control) with 13 riders representing four categories of braking skill, ranging from beginner to expert. Three predictive models of loss of control events during braking trials, going from a basic model to a more advanced one, were defined using logistic regressions as supervised learning methods and using the area under the receiver operating characteristic (ROC) curve as a performance indicator. The predictor variables of the models were identified among the parameters of the vehicle kinematics. The best model predicted 100% of the loss of control and 100% of the full control cases. The basic and the more advanced supervised models were adapted for loss of control identification with time series data, and the results detecting in real-time the loss of control events showed excellent performance as well as with the supervised models. The study showed that expert riders may maintain stability under dynamic conditions that normally lead less skilled riders to a loss of control or falling events. The best decision thresholds of the most relevant kinematic parameters to predict loss of control have been defined. The thresholds of parameters that typically characterize the loss of control such as the yaw rate and front-wheel lock duration were dependent on the rider skill levels. The peak-to-root-mean-square ratio of roll acceleration was the most robust parameter for identifying loss of control among all skill levels.

1. Introduction

Braking is the most frequent evasive maneuver and one of the most complicated to perform by motorcycle riders because of the inherent instability and the complex driving dynamics of motorcycles. During emergency braking, while considering the variations occurring in load distribution between the two wheels [1] and the variations in the tire-road adherence conditions, riders require simultaneous optimal management of the front and rear brakes to achieve maximum deceleration. This complexity makes riders frequently lose control and fall when performing braking to avoid a collision [2]. In order to enhance the rider’s safety maintaining the stability of the vehicle and to avoid loss of control events leading to fall during emergency braking, two different approaches can be pursued: designing active systems that support the braking maneuver under stable conditions, and improving the braking skills of the riders. In both cases, it is necessary to understand the process and the motion conditions that lead riders to start losing control.
Previous research analyzed several factors leading to more efficient braking maneuvers, namely the optimum braking from the theoretical perspective with multi-body models and simulations [1,3,4], the braking patterns during different maneuvers [5] and the potential improvements in designing vehicle stability control systems [6,7]. Concerning autonomous braking applications, the stability of riders of powered-two-wheelers (PTWs) under moderate automatic deceleration was assessed with motion captured and EMG data using a motorcycle mock-up mounted on a sled [8] and with qualitative observations in a field trial [9]. Few studies using experimental measures in the field have developed fall detection models. Such studies used the data from several race riders running in a race circuit [10,11] or of a stuntman reproducing fall and near fall scenarios [12,13]. The study focused on race competitions [10] defined a method based on the accelerations and angular rates of both the rider and the motorcycle to represent a falling ‘risk index’ (for which no equations were defined) during the execution of racing maneuvers. The work with a stuntman rider defined a fall detection algorithm based on a certain threshold [13] and multivariate cumulative sum control charts [12] for the values of the norm of the tri-axial gyroscopes and the norm of the tri-axial accelerometers. The few existing fall detection models have focused on loss control events with unavoidable falls to develop passive safety systems such as airbags. However, a momentary loss of control does not always lead to a fall event if the unstable conditions are not maintained or are corrected in time. Loss of control may be limited to the occurrence of instability and of unsafe behaviors and not necessarily to total loss of control [14]. Concerning braking, safe braking may be defined as a maneuver that allows the vehicle to stop in an upright position, with small oscillations, where the driver maintains control of the handlebars with smooth movements [15]. In the literature, we could find only one single example of a definition of algorithms which can be to detect critical braking events (defined as potential loss of control cases with locked wheel) [15]. The parameters of those algorithms were optimized by using virtual data reproducing emergency braking maneuvers and calibrated by six ‘near missed’ accident cases of naturalistic riding data. Given the importance of this topic and the ambition to increase riders’ safety during hard braking, more research to understand the riders’ response under loss of control conditions is necessary.
To contribute to this, in this study we proposed the development of predictive models of the riders’ responses in safety-critical situations, validated with consistent experimental data and including riders who cover all riding skill levels. This paper provides a method to classify unsafe loss of control during hard braking maneuvers on a straight line before becoming irreversibly unstable in order to: (a) support safety active systems developments; and (b) improve riders’ skills braking through braking training. The first hypothesis of our study is that unstable scenarios can be predicted using kinematic parameters using a supervised method of machine learning such as binary logistic regression. The second hypothesis is that different skill levels require different kinematic thresholds to identify loss of control.

2. Materials and Methods

2.1. Participants

Thirteen volunteers (11 male, 2 female) aged 23 to 47 years (mean 32.3; SD 8.9), with various levels of riding expertise were recruited by contacting riding schools and local racetracks, reaching out to groups through social media and posting flyers at the University of Florence. All participants were required to have held a motorcycle license for more than 3 months and to ride regularly (minimum once per week). The participants were grouped by 4 level skills according to their braking performance (1 beginner, 4 intermediate, 6 advanced and 2 experts) [16].

2.2. Equipment and Data Collection

The experimental PTW used was a 300cc Piaggio Beverly scooter with automatic power transmission and standard brakes independently actuated-no anti-lock braking system (ABS) or combined braking system (CBS)-by two hand levers. The scooter was instrumented with an X-Sens inertial measurement unit (IMU) with an integrated GPS to measure vehicle tri-axial acceleration and gyro, pitch, roll and yaw angles, position and speed. The speed of each wheel was measured using phonic wheels to identify lock-up events. Steering angle was measured using a rotational transducer with a range of 120° and an accuracy of 0.3°. All signals were sampled at a rate of 100 Hz. In addition, the experiment was registered by three video cameras: one on the front of the scooter, one facing the rider and one on a tripod placed adjacent to the mock-up intersection to record the lateral view of scooter braking.

2.3. Protocol of the Experiment

We performed braking maneuver experiments using a mock-up of an intersection to simulate a Left Turn Across Path/Opposite Directions scenario (LTAP/OD) with a real car in a closed test track on dry road surface. Figure 1 provides a view of the mock intersection, in which a car approaching from one end could either continue straight through the intersection or make a left turn. Participants were instructed to reach speeds of 50 km/h on approach to the intersection and to brake and stop the PTW as quick and as hard as possible while maintaining balance and control only if they perceived that the car would turn across their path. In this controlled environment, riders’ responses were similar to that of a real emergency event [16] (e.g., pressing abruptly the brakes experimenting high jerks or locking wheels). The original goal of the experiment was to test whether a real-world emergency braking task could be used to examine PTW riders’ abilities to avoid a collision by rapidly decelerating. A thorough explanation of the protocol can be found in Reference [16]. The protocol of the experiment received approval from an institutional human research ethics committee.
Each participant had to complete 24 trials, including 12 braking trials, with the opponent car turning across their path. Trials in which poor synchronization between PTW and a car were achieved and were repeated once. Finally, this study comprises 165 braking trials to be analyzed.

2.4. Loss of Control Predictive Model Development

2.4.1. Loss of Control Identification by Video Analysis

Loss of control cases were identified through video analyses of each braking trial by a first coder.
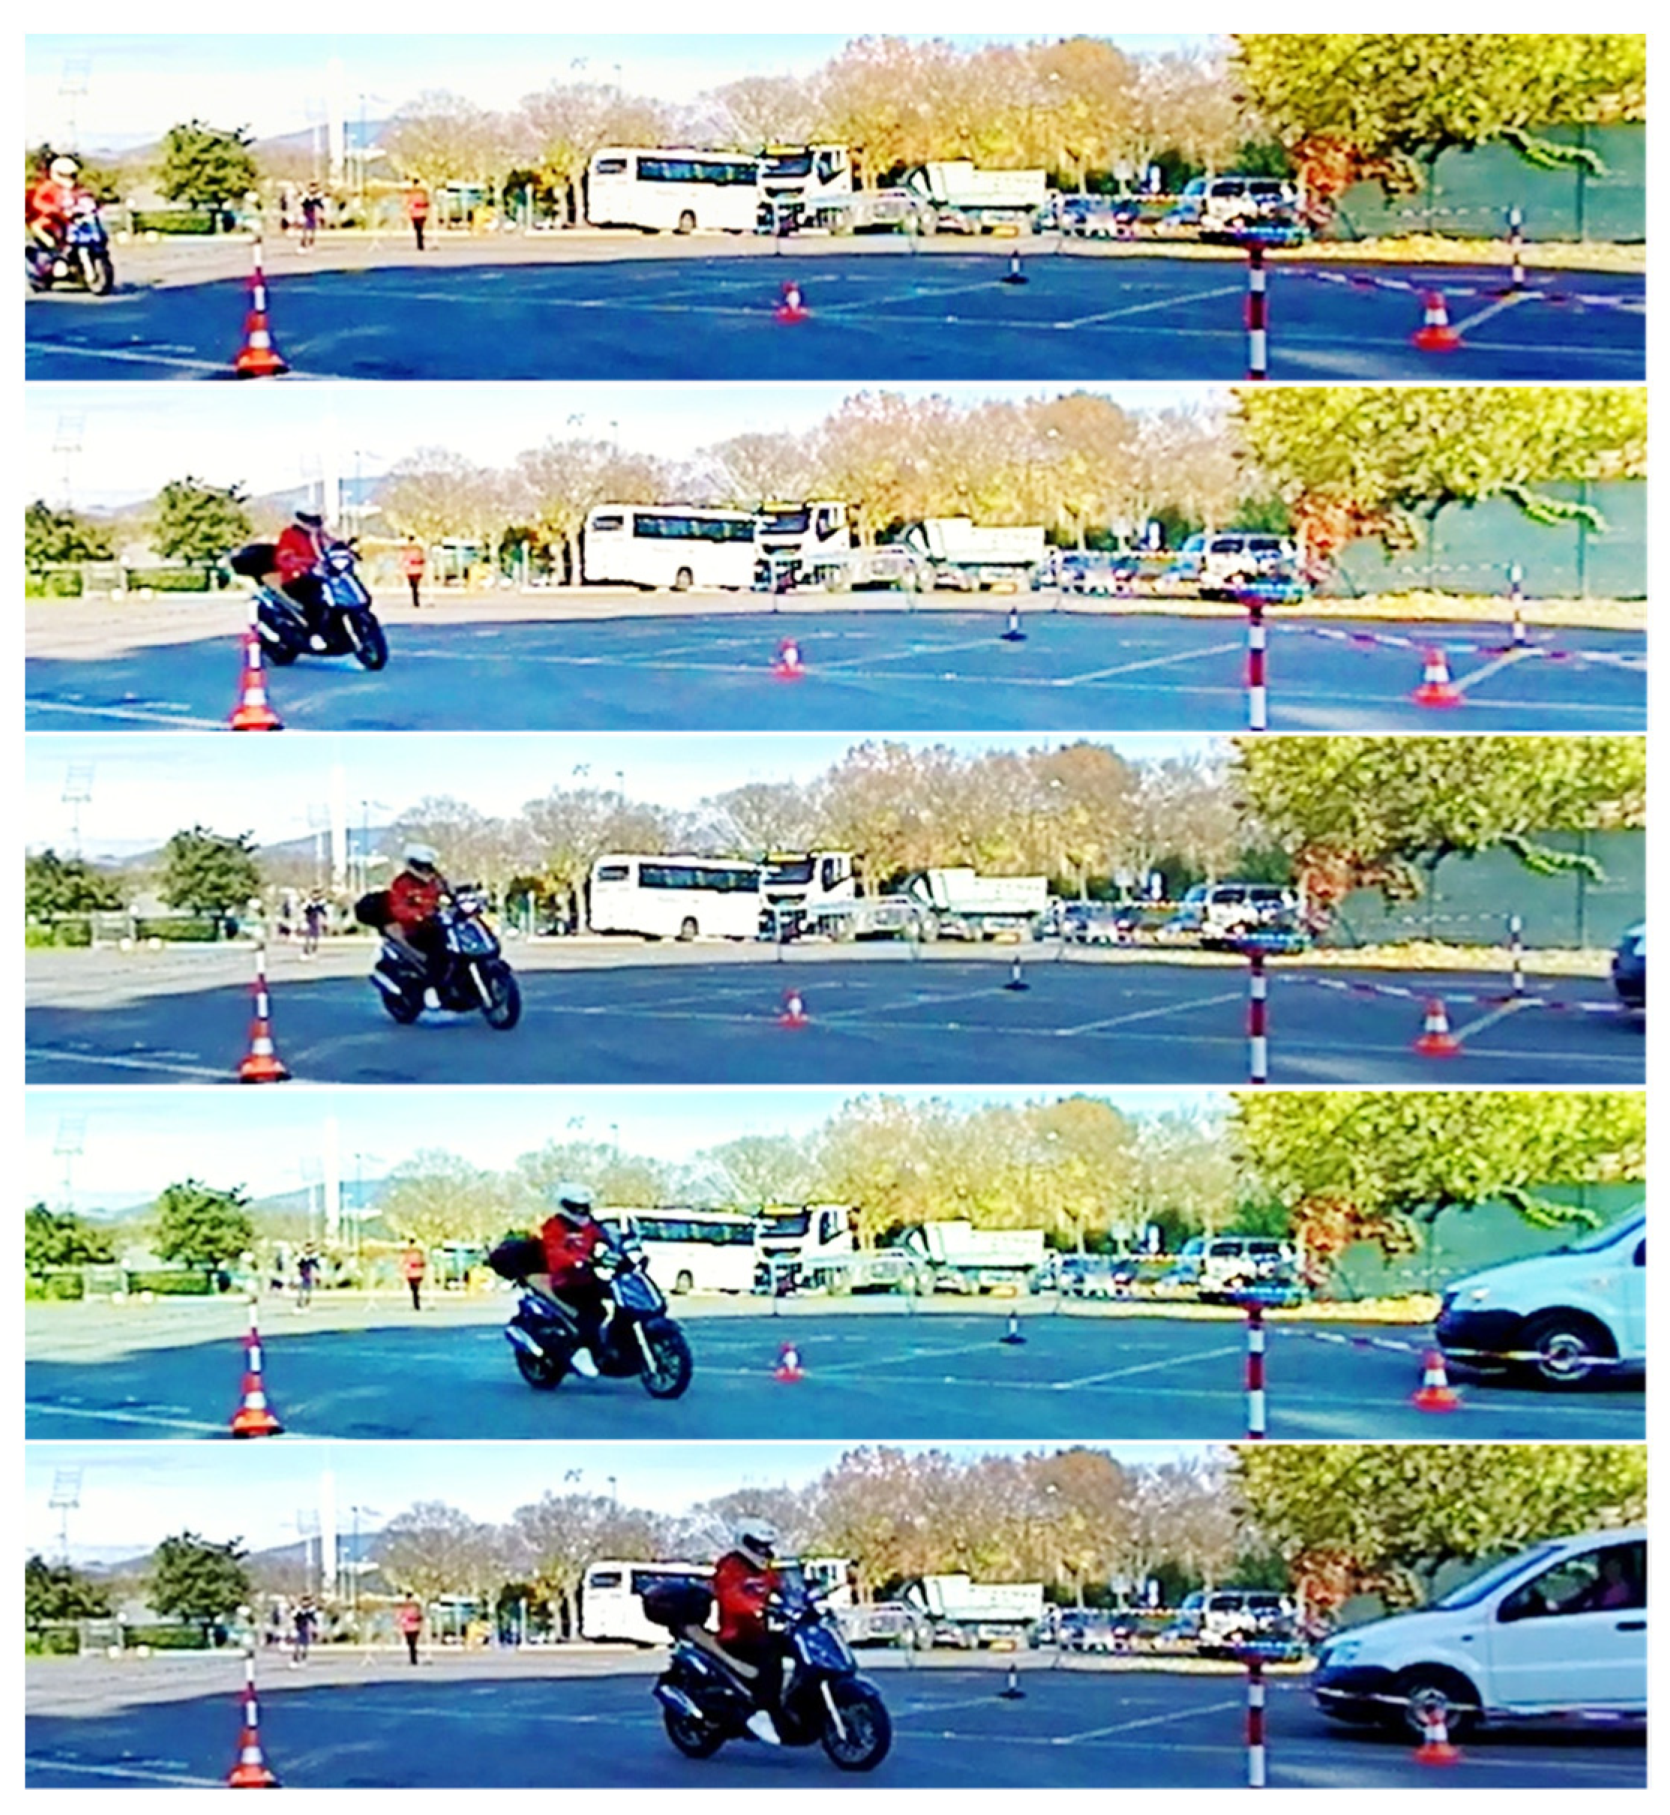
The braking trials were rated with the binary variable Z, giving the value of 0 if the rider showed safe full-control or 1 if the rider showed signs of loss of control: oscillating noticeably or suddenly putting down one or both feet in case of unsteadiness that was difficult to control, see Figure 2.
A subset of 45 braking trial videos was rated independently by four coders. Inter-rater reliability (IRR) tests evaluated the degree to which coders provided consistent ratings of loss of control across braking trials. To compensate for the prevalence problem of unbalanced distribution of classes [17] the subset included all loss of control cases identified by the first coder except for two cases that were used as a reference for the new three coders. To compute the IRR of both the individual coders’ ratings and the mean ratings from multiple coders, we used a two-way mixed, consistency, average-measures and a single-measures Intraclass Correlation Coefficient (ICC) [18].
The final rates of the subset cases were categorized according to the average-rating, which considered the controllability of a trial as loss of control when the previously defined loss of control signs were identified by two or more coders. In the case of a high IRR, the full control rates of the first coder for the remaining trials outside of the 45 trials subset were assumed as being valid rates.

2.4.2. Selection of Predictor Variables

In order to detect the heavy oscillations of the vehicle body and front wheel lock events, we used as input features (predictors) the signals of lateral acceleration, gyro (X, Y, Z), roll, yaw and pitch angle, steering position, vehicle speed as well as rear and front wheel speed. Sensor data were low-pass filtered with 10 Hz cut-off. The selected parameters, to characterize the signals during the braking trials, were the maximum or peak value (Max), the root-mean-square value (RMS) and the peak-to-RMS ratio.

2.4.3. Regression Model Algorithm

Among the different supervised machine learning methods, binary regression models were selected for the prediction task because they have less risk of overfitting and they are a straightforward method to understand the association between the predictor variables and the output (controllability/loss-of-control). The regression model uses the linear function shown in Equation (1):
                                        Y = β 0 + β 1 X 1 + β 2 X 2 +   β k X k  
where β0 is the constant and βk are the population regression coefficients and Xk are the independent variables or predictors.
The logistic function shown in Equation (2) computes the probability P that a case belongs to the target group loss of control (Z = 1):
P   ( Z = 1   |   X ) =   1 1 + e Y =   1 1 +   e ( β 0 + β 1 X 1 + β 2 X 2 +   β k X k   )
where X is the vector of predictors, Y is the linear function of the logistic regression and e is the exponential function.
For the predictive model, we created three algorithms with three different approaches with increasing complexity with respect to the possibility to be computed in a real-time assessment. Consequently, Model-1 with less predictors to add to the model is the most ‘basic’ and the most robust, exclusively using predictors coming from the signals collected by the sensors. This model does not require computing the differential of the variables, so it is more robust, faster, and less sensitive to unfiltered noise.
  • Model-1: ‘basic’ model with maximum and RMS parameters as input variables from the signals collected, including the instantaneous magnitude of the resultant gyro vector (Gyro Norm), that is estimated by computing the square root of the sum of the squares of the three gyro components X, Y and Z.
  • Model-2: ‘extended’ model with input variables from Model-1 adding maximum and RMS from the computed differentials for the gyro and steering angle signals.
  • Model-3: ‘advanced’ version of Model-2, which also contains as input the peak-to-RMS ratio for each of the signals. For real-time assessment, this model requires more computation time for the differential of the signals and for extracting the ratio of two parameters that needed to be calculated previously.
For all three models, the selection of the predictors was done following the forward stepwise Wald method with entry testing based on the significance of the score statistic, and removal testing based on the probability of the Wald statistic [19]. The logistic regression model was fitted using IBM SPSS statistics 25.
In case models present large regression coefficients with large variances, regularization with least absolute shrinkage and selection operator (lasso) was performed to make decision boundaries smoother and to reduce the possibility of overfitting. Lasso methods were used to balance the well performance and the magnitude of the coefficients. Lasso regularization produces a set of coefficient estimates whose values depend on the different values of the weight reduction factor λ. We determined the best value for λ by using cross-validation, and was defined as the λ with minimum cross-validated deviance plus one standard deviation. The regularization was performed using the Statistics and Machine Learning Toolbox of Matlab 2018b.

2.4.4. Performance of the Model (ROC and AUC)

As the true instances (loss of control) are uncommon, the classes in our sample were not balanced. Therefore, in addition to accuracy metric, we used receiver operating characteristic (ROC) curve analysis as a robust metric to assess the ability of the model to classify or predict the loss of control. The optimal cut-point (decision threshold) that determined if the rider had full control of the vehicle during the braking event was established with the highest Youden index, varying the compromise between the false negative and false positives probabilities, i.e., the threshold with the highest ‘sensitivity + specificity’ value [20].
The area under an ROC curve (AUC) measures the performance of a diagnostic test, using a combination of the values of sensitivity (proportion of actual positives or loss of control cases that are correctly identified as such) and specificity (proportion of actual negatives or full control cases that are correctly identified as such). AUC is a typical performance indicator in machine learning and statistics [21]. The possible values of AUC range from 0.5 (no diagnostic ability) to 1.0 (perfect diagnostic ability). Additionally, we used Hosmer-Lemeshow as inferential goodness-of-fit test.

2.4.5. Performance of the Single Predictors (ROC and AUC)

Additionally, the AUC performance of the best single predictors were analyzed individually to define the parameters working better as loss of control predictors. The best threshold for each parameter was also defined with the highest Youden index. While considering the correlation between the predictors, we used regularization to understand the independent contribution of each feature.
This involved fitting a model with all the predictors, but where the estimated coefficients are shrunken towards zero. The key features are the ones whose coefficients are the last to vanish.

2.5. Loss of Control Detection Model for Time Series

Times series analysis for loss of control prediction was done to check if the predictive models ‘1’ and ‘3’ developed may also be applied successfully to detect in real-time the loss of control events. The features of the models are related to RMS and peak values of the braking event that need to be computed in relation to a specified time interval. Thus, we have proceeded in the following way to define the corresponding features FMax(Xt), FRMS(Xt) and Fpeak-to-RMS ratio(Xt) at each t from the time series of the braking event. Rather than use the whole series, we selected intervals of the series. For the features related to maximum values of variables during the braking event, to consider the temporal dynamic behavior of the variables, we obtained Maxt(Xt) computing the peak value of the last 40 ms (sliding window [tt-40ms, …, t]):
FMax(Xt) = Max(Xt-4, Xt-3, Xt-2, Xt-1, Xt) for a sampling rate of 10 ms.
For the RMS value at each instant t, RMS was calculated using intervals of the series corresponding to the time window [tpreBrake, tpreBrake +1,…, t-1, t], where tpreBrake is the instant corresponding to 500 ms before the start of the first brake activation (tpreBrake = tBrakeOnset – 500ms).
                  F R M S ( X t ) =   1 N     i = t p r e B r a k e t X i 2
where N is number of samples in the time window [tpreBrake - t]
F p e a k   t o   R M S   r a t i o ( Xt )   =   F Max ( Xt ) F RMS ( Xt ) .
The two models were compared in terms of accuracy and capacity to detect the loss of control in the shortest time. A repeated measures ANOVA was conducted to compare the effect of the type of model on detection time, and related to that on the PTW speed at which loss of control was detected.

3. Results

3.1. Consistency of the Loss of Control Rating

From the final 11 cases of the sample identified as loss of control, two cases correspond to the reference cases used to train the additional three coders and nine cases were identified by the multiple coders in the subset selected to analyse the consistency of the ratings. The resulting ICC with the subset of 45 trials was 0.783 for single and 0.913 for average (excellent agreement is considered for 0.90 and above and fair agreement in the range 0.70–0.79 [22]), indicating that coders had a high degree of agreement and suggesting that loss of control was rated similarly across coders. The high ICC suggests that a minimal amount of identification error was introduced by the average-rating and the independent coders. Thus, loss of control ratings were considered to be suitable for use in the supervised model of loss of control prediction of the present study.

3.2. Selection of Input Features

3.2.1. Preliminary Analysis

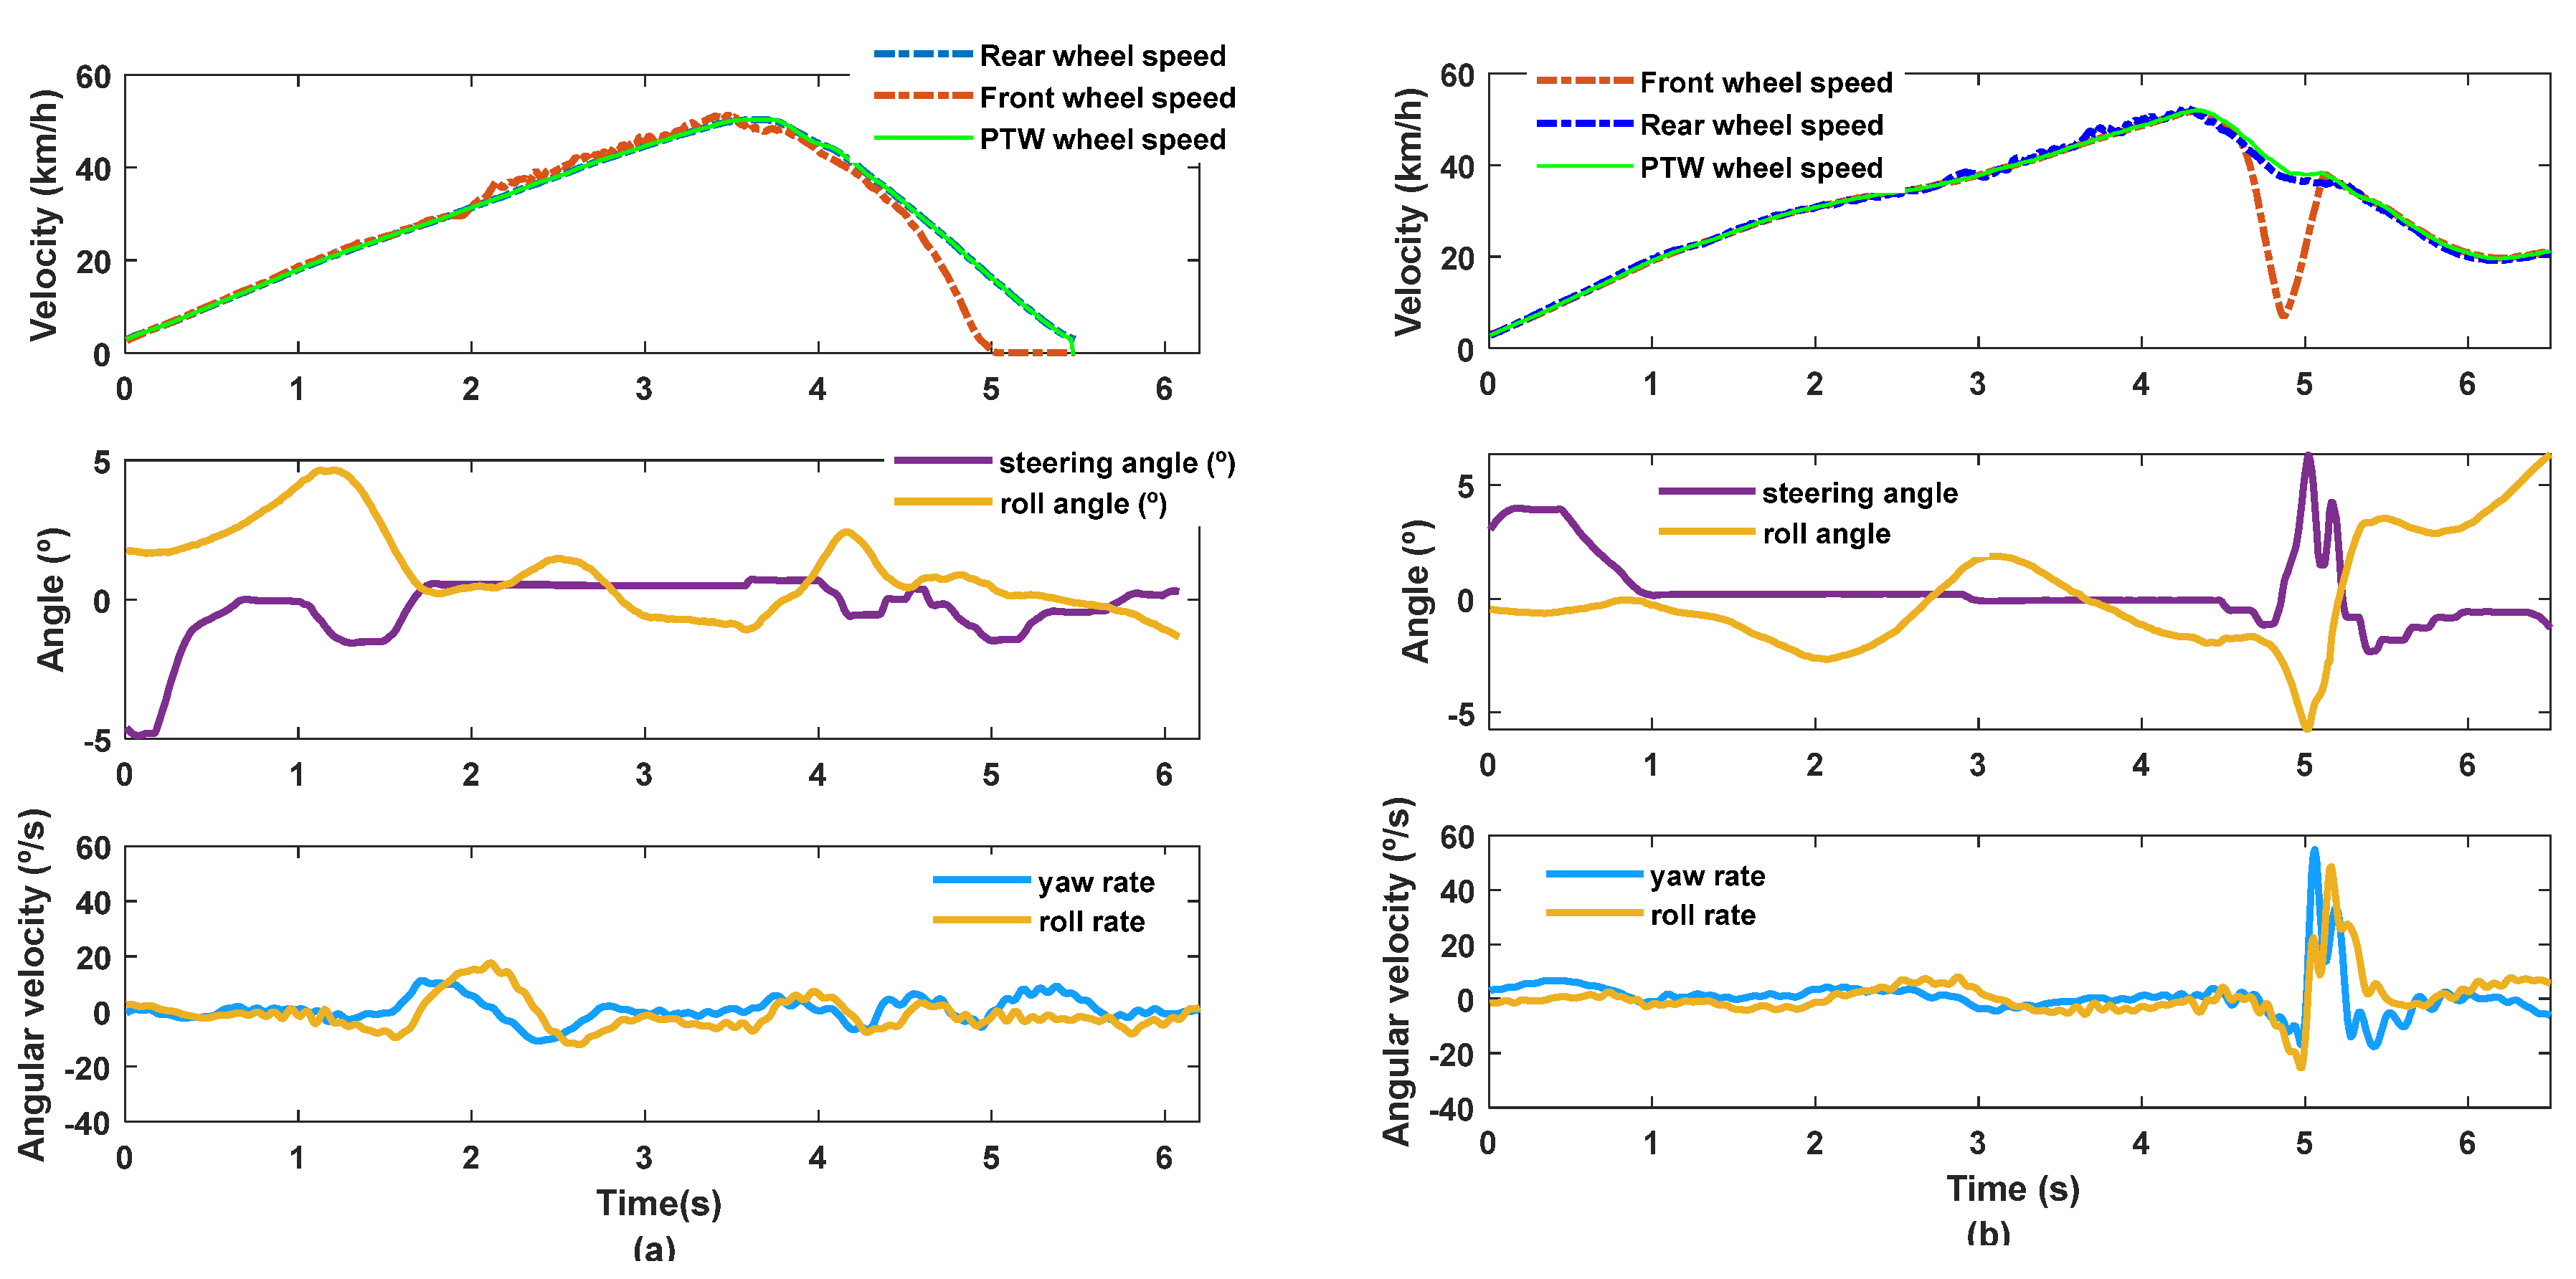
After a preliminary analysis of the dynamics of the time-series data with a subsample of full control and loss of control braking trials, we decided to include the differential of the collected signals roll rate, yaw rate and steering angle (i.e., roll and yaw acceleration and steering rate), as input features of the model. Figure 3 shows two examples of both full control and loss of control emergency braking representing the speed, the steering and roll angle and the yaw and roll rate.

3.2.2. Descriptive Analysis

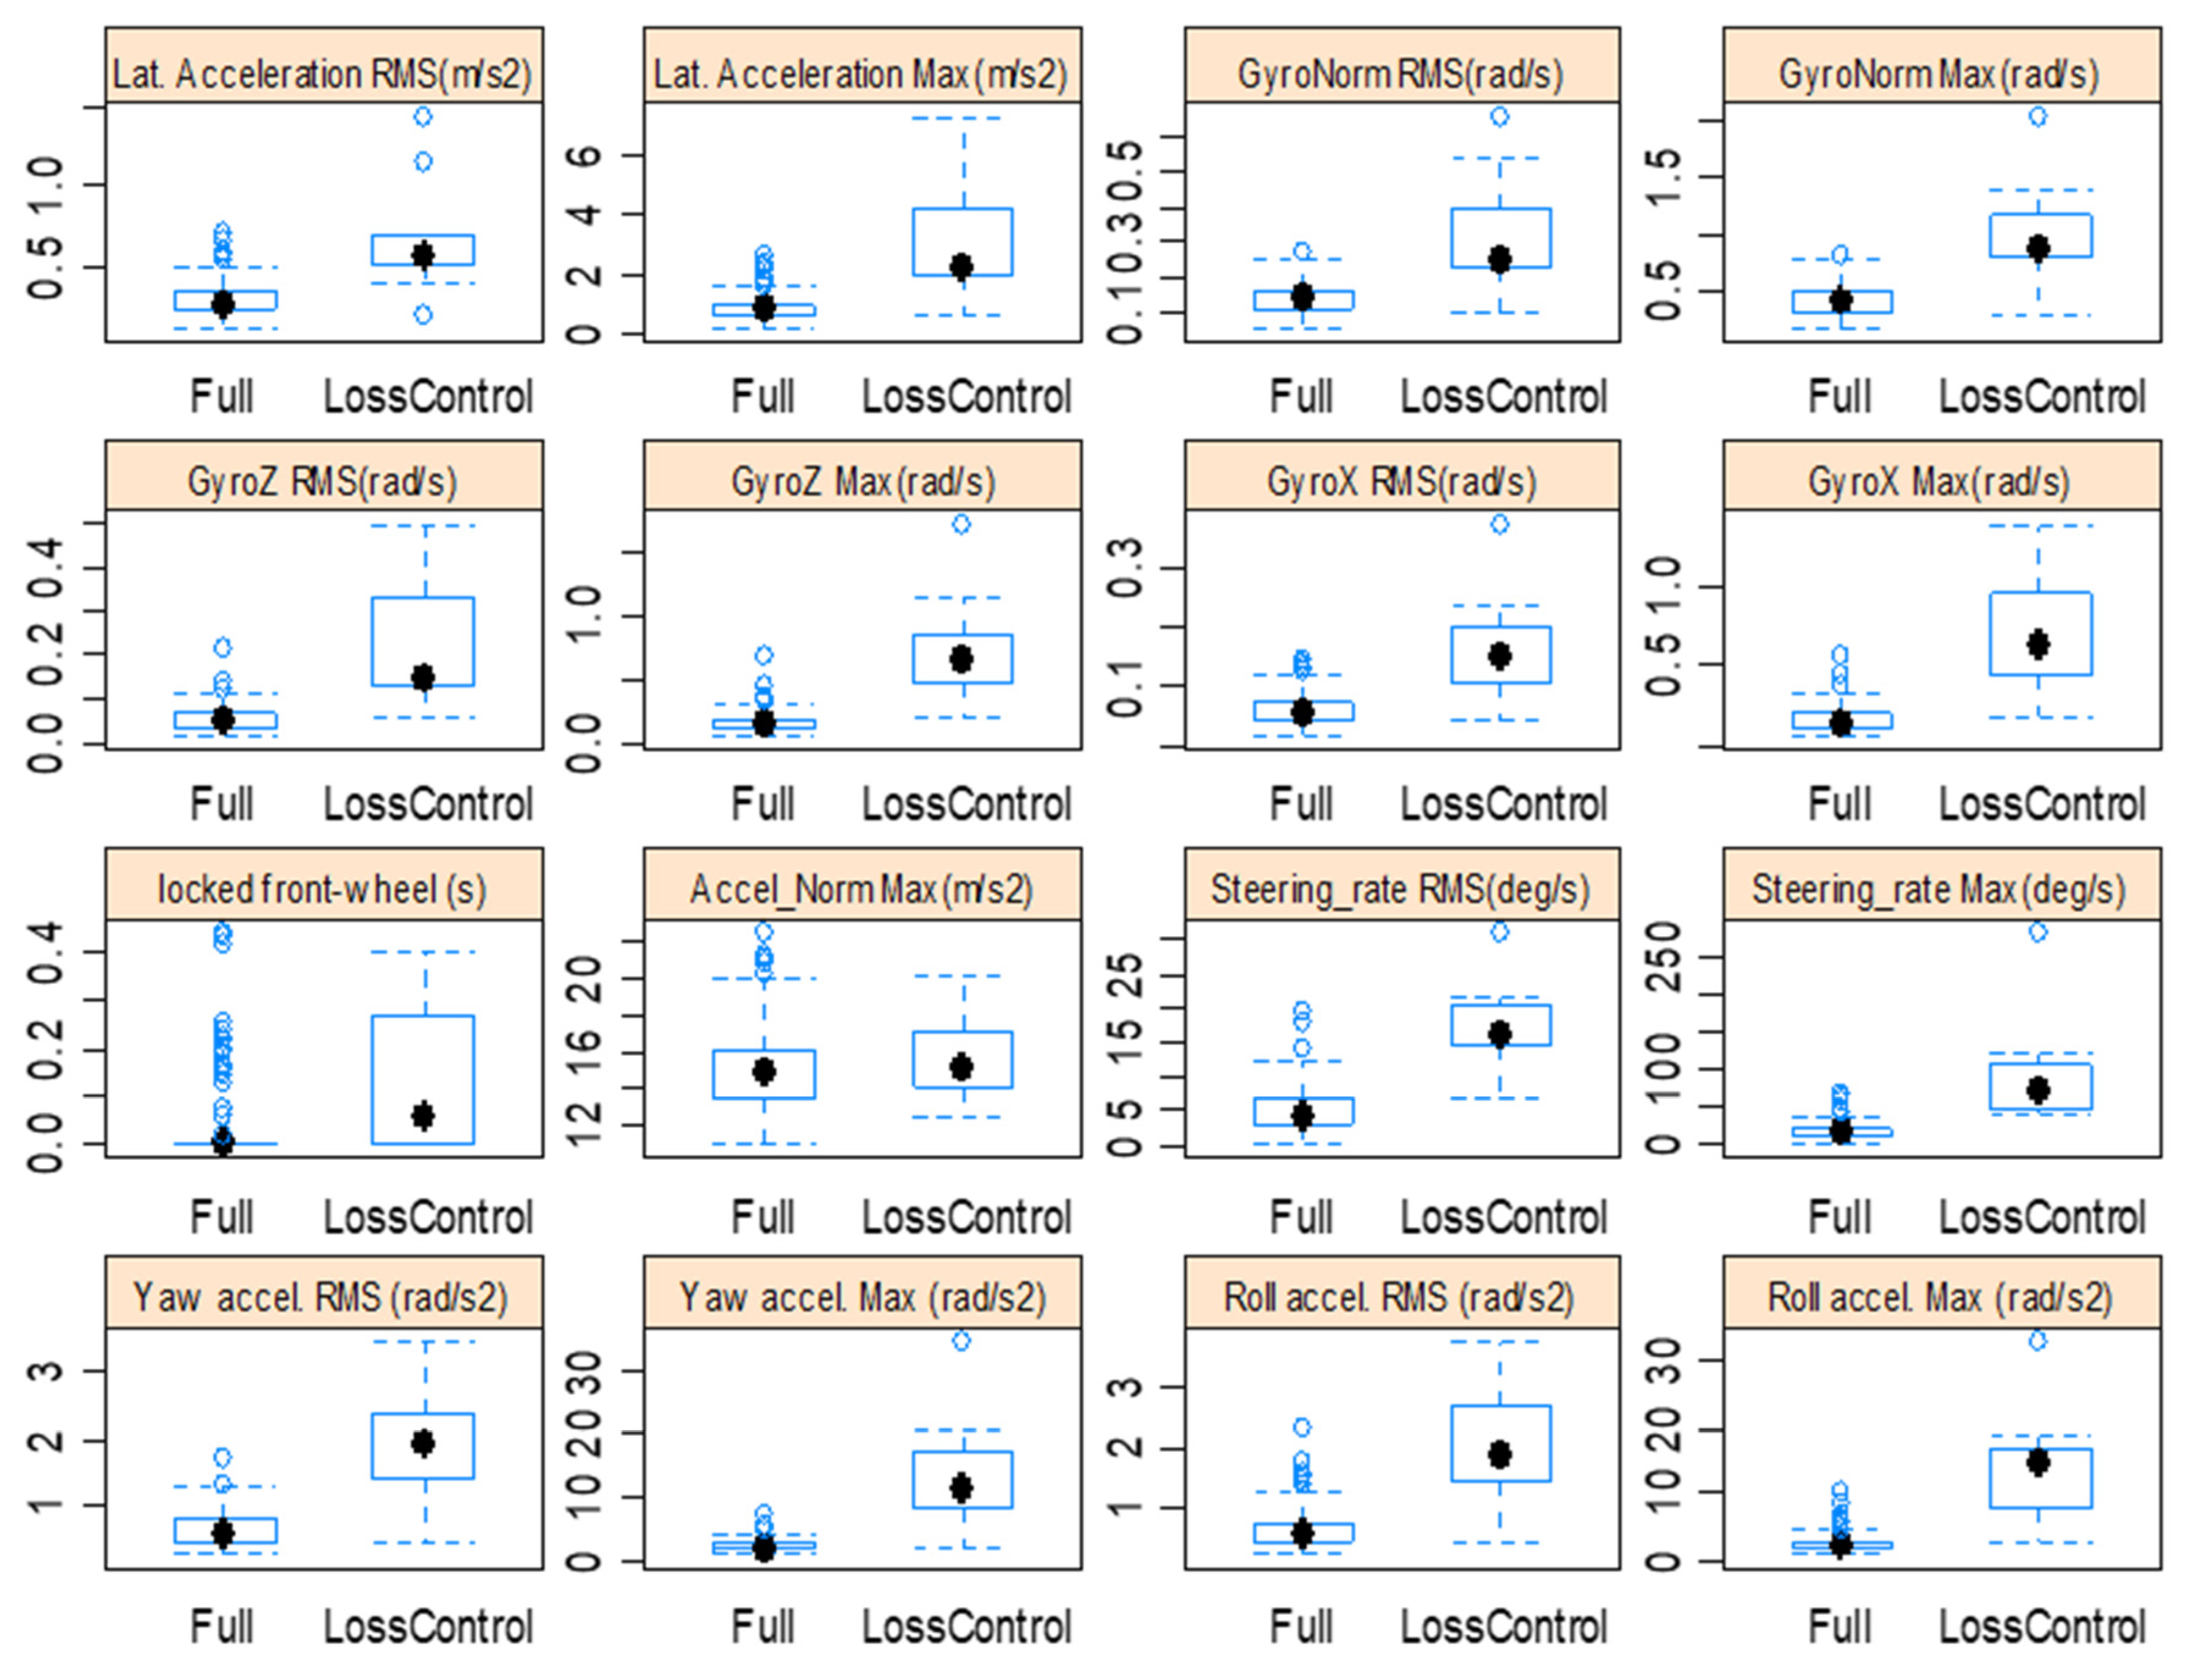
A descriptive analysis across controllability classes (full control vs. loss of control) was conducted to identify typical ranges, to search for evident kinematic thresholds and to assess the relevance of the predictors of the models. Boxplots of Figure 4 display the interquartile range of the data set, the median accuracy and possible outliers. Results showed that despite the different distributions by controllability levels, there are no evident thresholds for any variable, able to classify without errors. Thus, it was necessary to explore machine learning methods with multiple variables to predict actual loss of control of the riders with maximum accuracy.
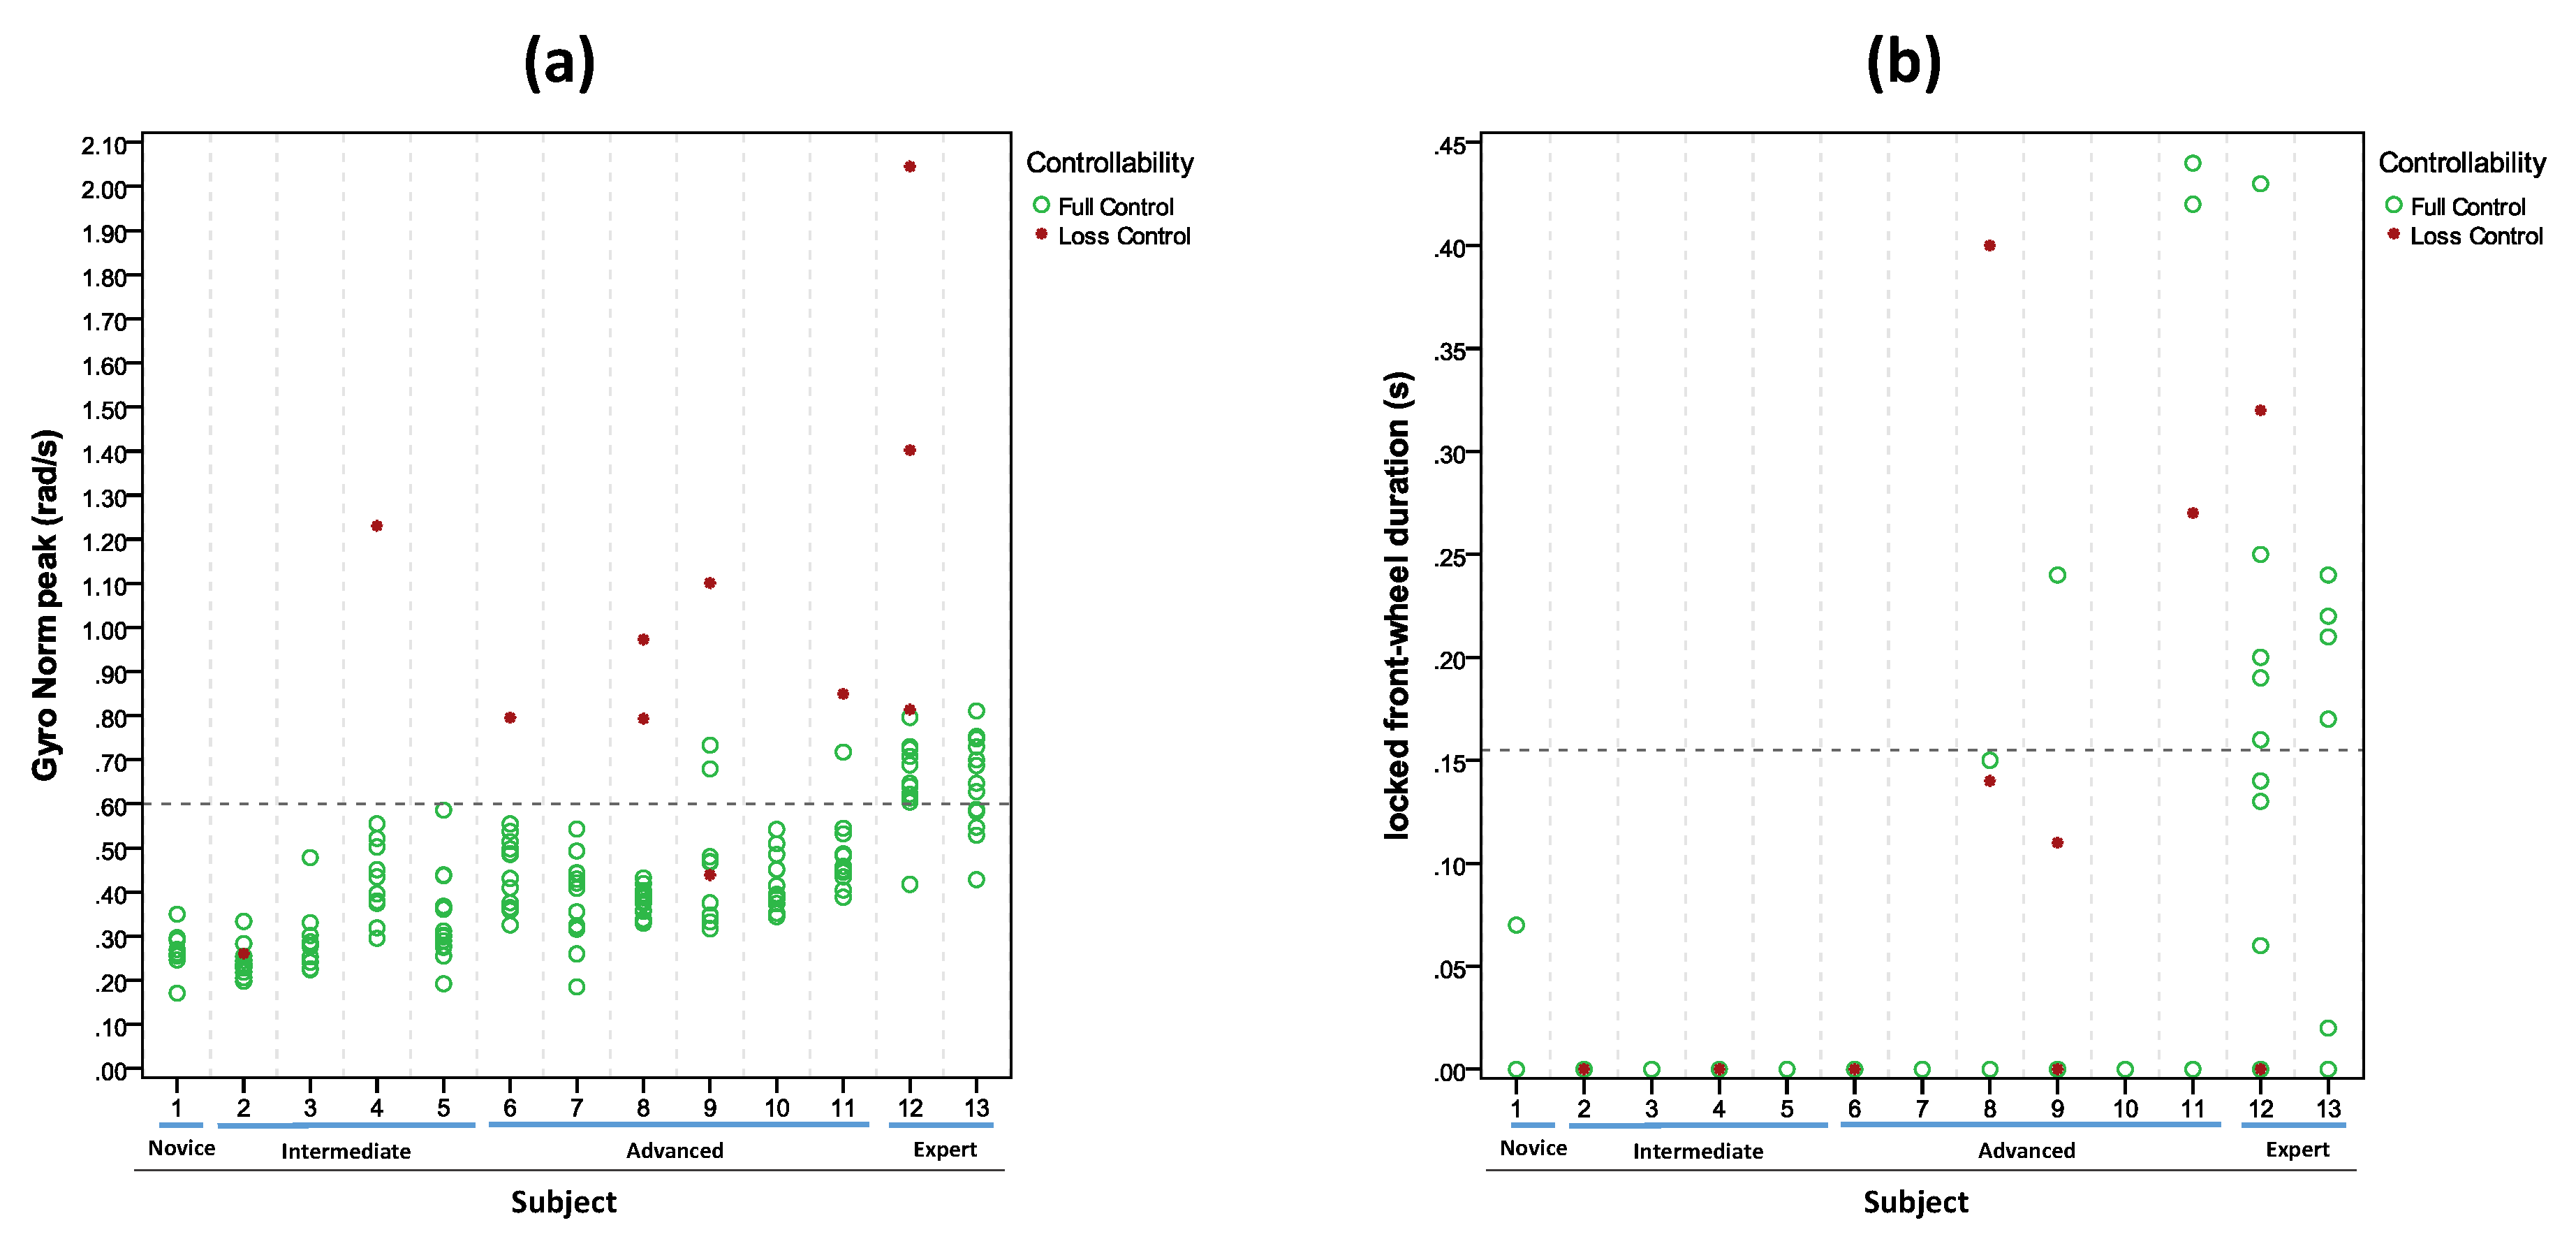
Descriptive analysis of the variable by rider (see examples in Figure 5) showed that expert riders performing the straight emergency braking trials were able to manage extreme kinematics (i.e., Gyro Norm Max higher than 0.6 rad/s, and front wheel locking events longer than 0.15 seconds) without evident signs of losing control.

3.3. Predictive Models

Results of the three logistic regressions models indicated that there was a significant association between kinematic parameters of the PTW vehicle and the likelihood of loss of control (Model-1: χ2(3) = 62.256; p < 0.001, Nagelkerke R2 = 0.812; Model-2: χ2(2) = 72.090; p < 0.001, Nagelkerke R2 = 0.914; Model- 3 ^ : χ2(2) = 80.827; p < 0.001, Nagelkerke R2 = 1.00). Table 1 includes the test of significance for each of the coefficients in the logistic regression models. As we can see, the two predictors are not significant in Model 3.
The expressions of the predictive models developed at this stage are shown in Equations (6)–(8). The probability of loss of control event (P) predicted by the models is computed following Equation (2).
Y ( M o d e l _ 1 ) = 6.3 + ( 36.9 )   G y r o   N o r m   R M S ( r a d s ) + ( 20.6 )   G y r o   Z   M a x ( r a d s ) + ( 2.8 )   L a t   A c c e l   M a x   ( m s 2 )
Y ( M o d e l _ 2 ) = 5.7 + (   29.3 ) R o l l   A c c   R M S ( r a d s 2 ) + ( 6.9 ) R o l l   A c c   M a x ( r a d s 2 )
Y ( M o d e l _ 3 ^ ) = 1147.9   + ( 203.5 )   R o l l   A c c   r a t i o ( p e a k r m s ) + ( 24.6 )   Y a w   A c c   M a x     ( r a d s 2 )   .
In Model-1 and Model-2, the negative coefficient for Gyro Norm RMS and Roll Acc RMS indicates that for a fixed value of the rest of predictors, a braking trial with higher Gyro Norm RMS (in Model-1) and trial with a higher Roll Acc RMS (in Model-2) is less likely to have a loss of control event than a lower value. This is due to the fact that RMS are linked to the skill level of the riders, and expert riders can handle control under high demanding dynamic behavior that could cause a loss of control for less skill riders. In average RMS values of Gyro for expert riders are higher than for less skilled riders. As an example, the average Gyro Norm RMS for expert riders was 0.23 rad/s (SD = 0.11) compared to the average of 0.12 rad/s for intermediate riders (SD = 0.05). The increase of the rest of predictors is positively related to a higher probability of loss of control.
The large coefficients of Model- 3 ^ together with the high p-values presented are signs of risk of collinearity and overfitting. The presence of collinearity does not affect the reliability of the prediction model, but does affect the assessment of the actual contribution of each variable as predictor. Lasso regularization of Model- 3 ^ using 10-fold cross-validation was done to limit the magnitude of the estimated coefficients and to reduce their variability.
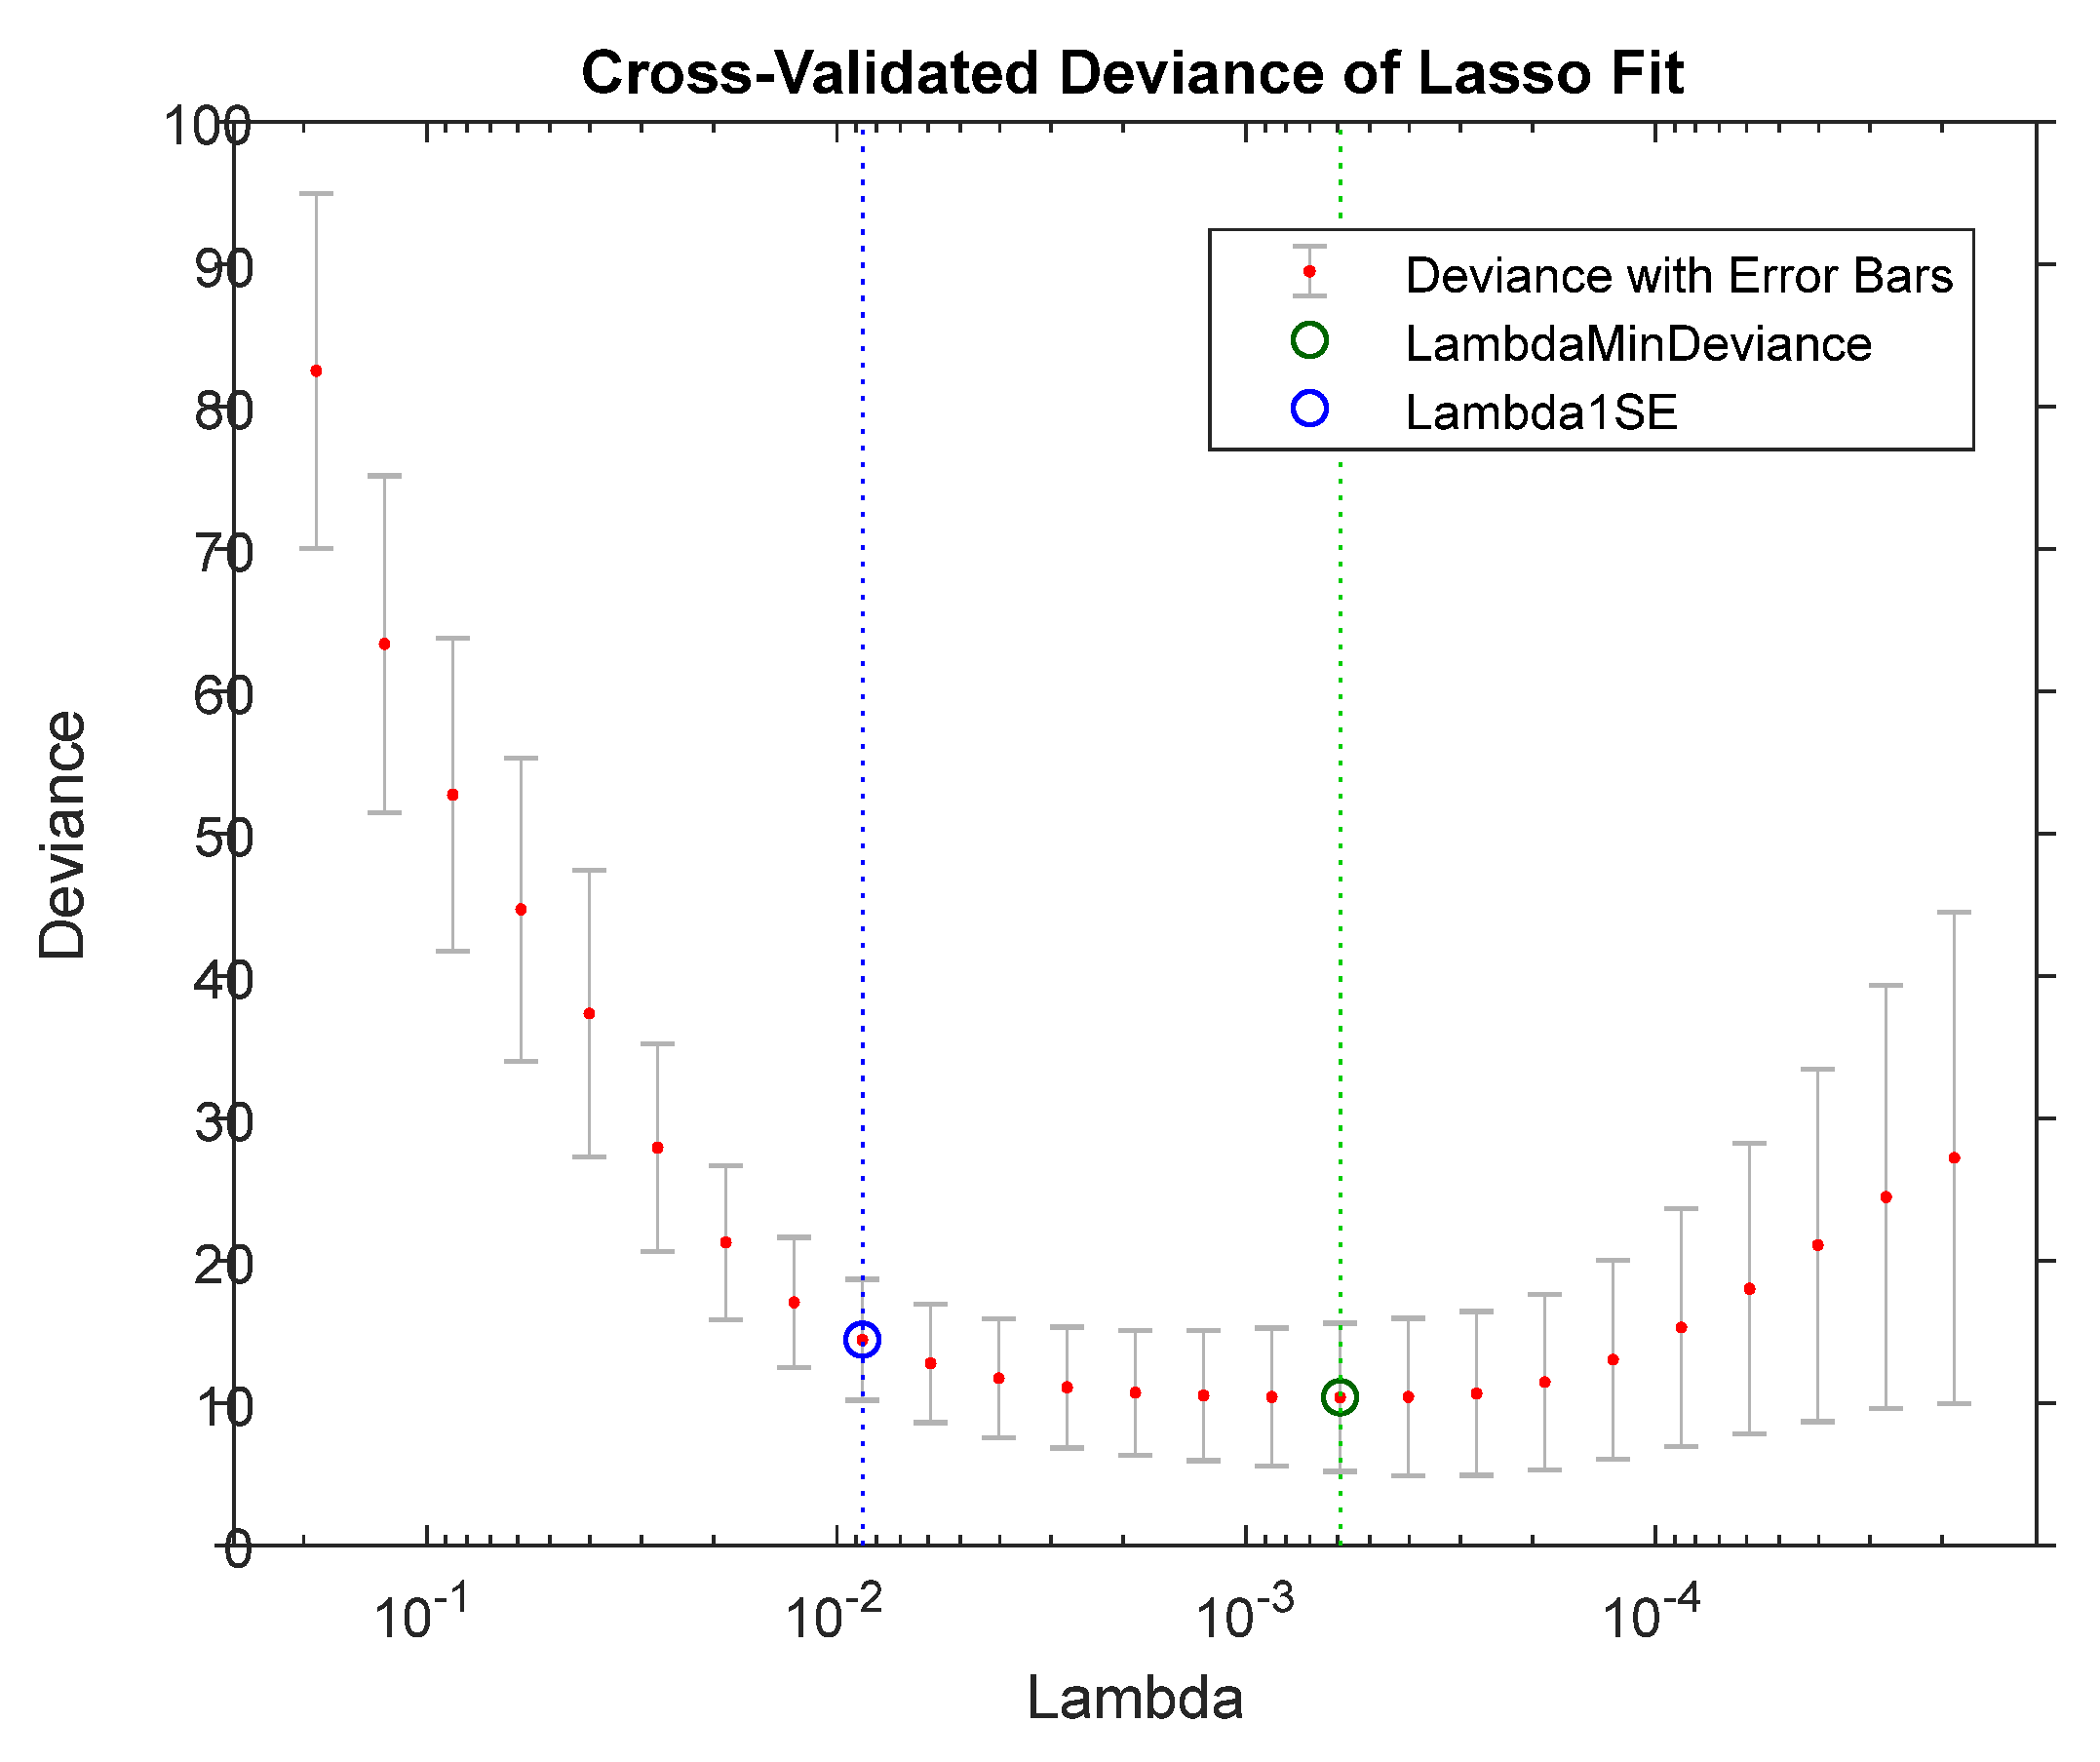
Figure 6 shows cross-validated deviance of various levels of regularization. As λ increases (moving from right to left on the x-axis), the coefficients shrink towards zero. The green and blue circle indicate the value of λ (lambda) at the minimum cross-validated deviance and the point with minimum cross-validated deviance plus one standard deviation. The values of the coefficients selected for the final Model-3 (see Equation (6)) corresponds with the λ with minimum cross-validated deviance plus one standard deviation (λ =0.0087; deviance = 14.45; SE = 4.25).
Y ( M o d e l _ 3 ) = 12.37   +   1.99   R o l l   A c c   r a t i o ( p e a k r m s ) +   0.32   Y a w   A c c   M a x     ( r a d s 2 )
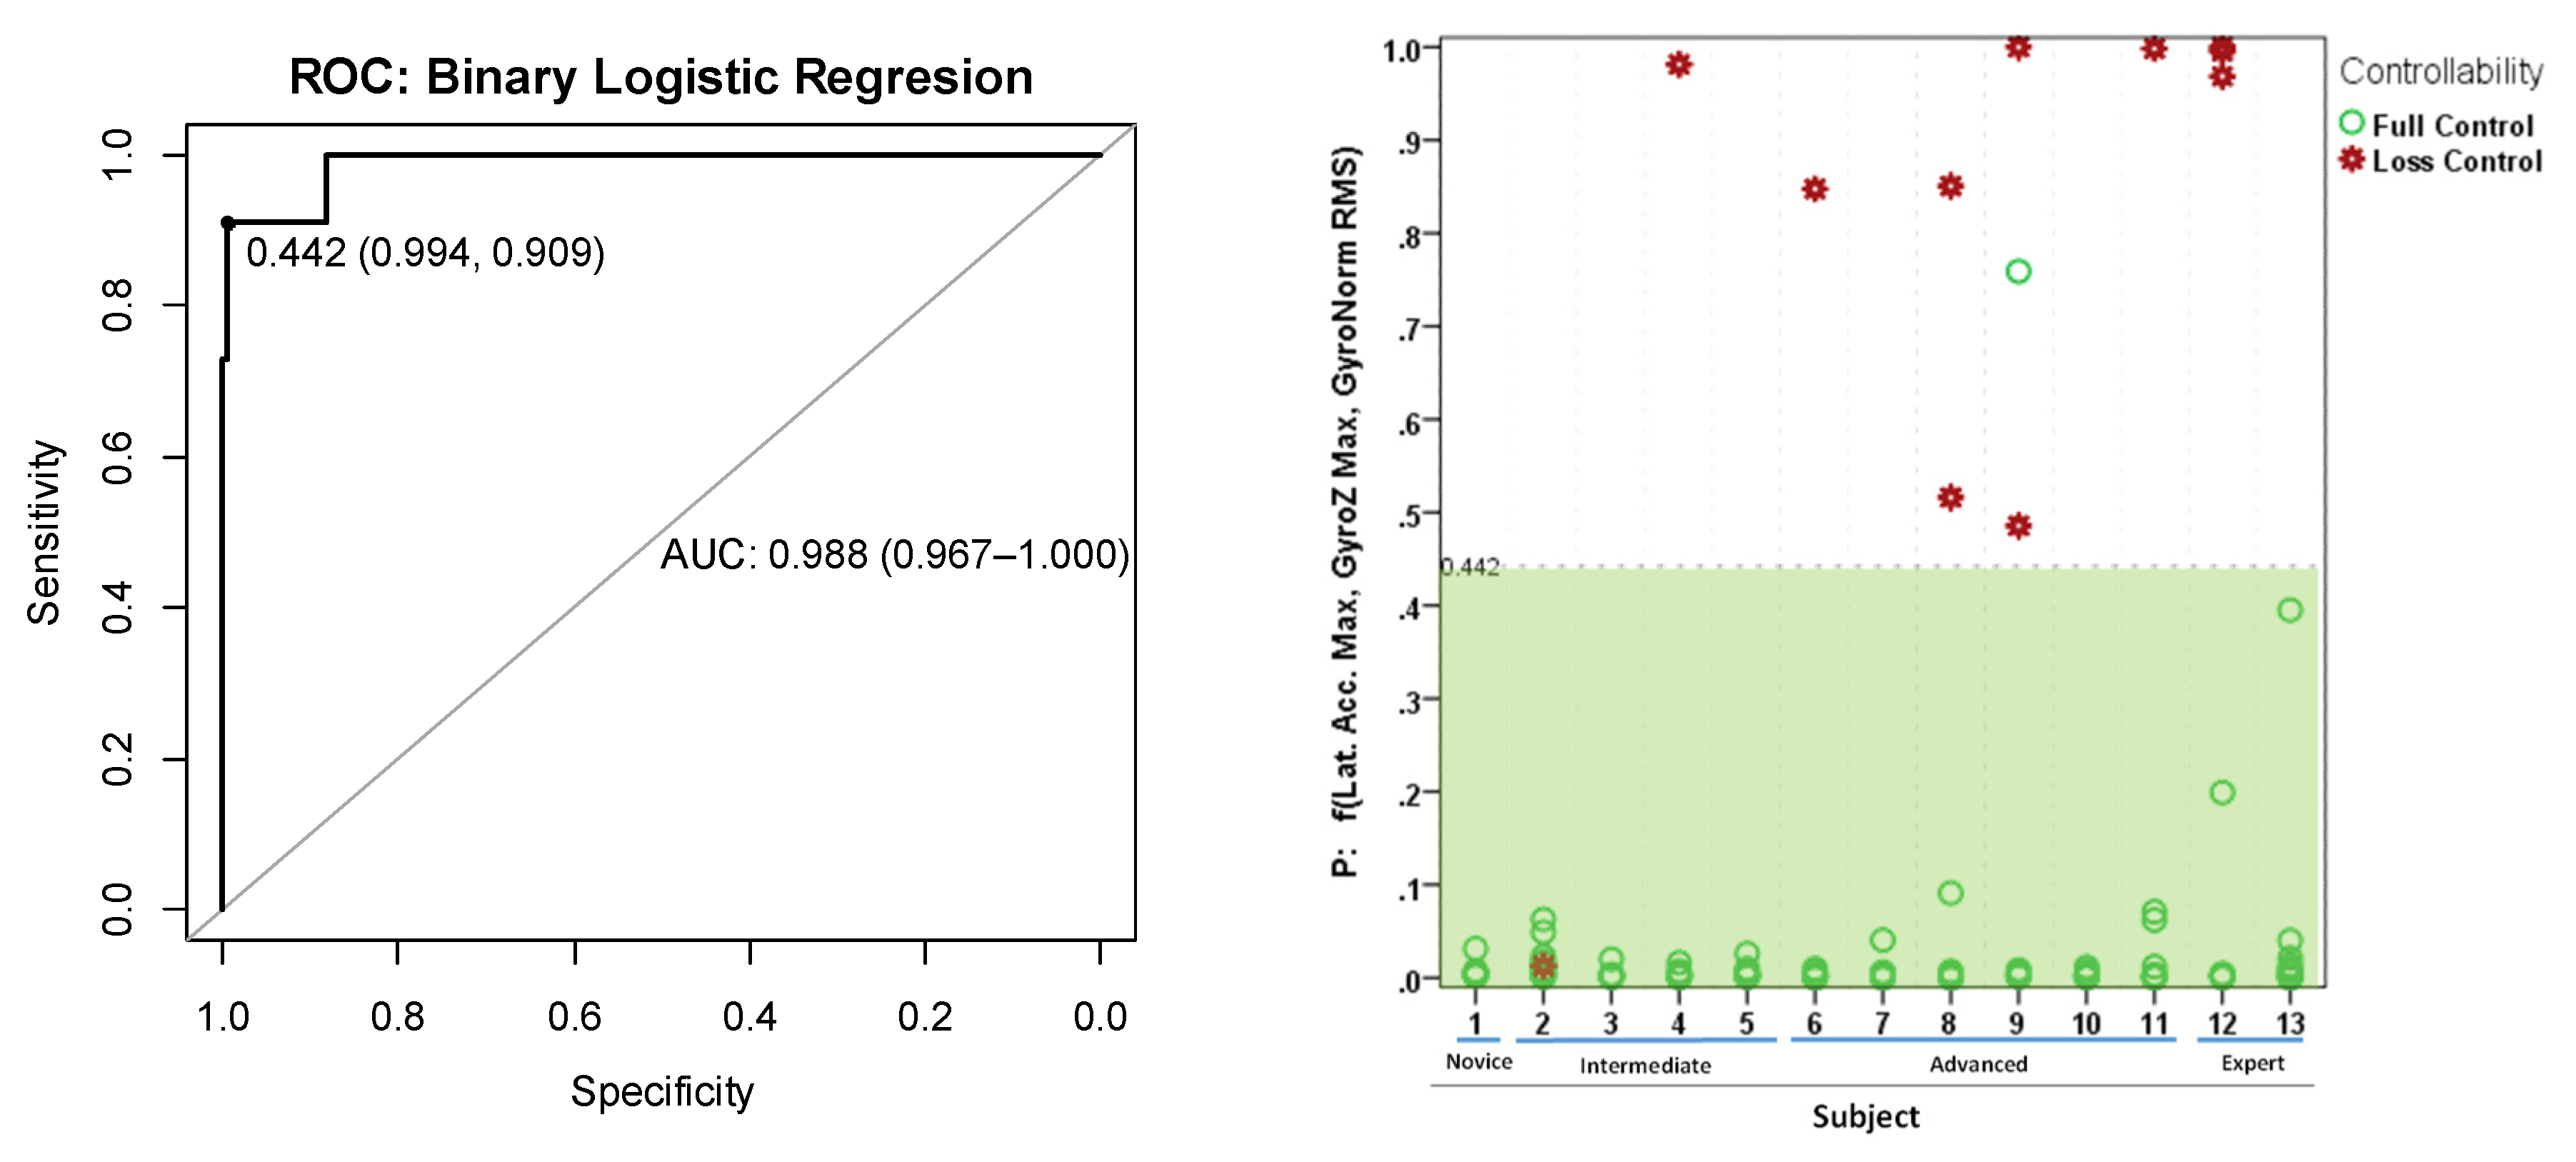
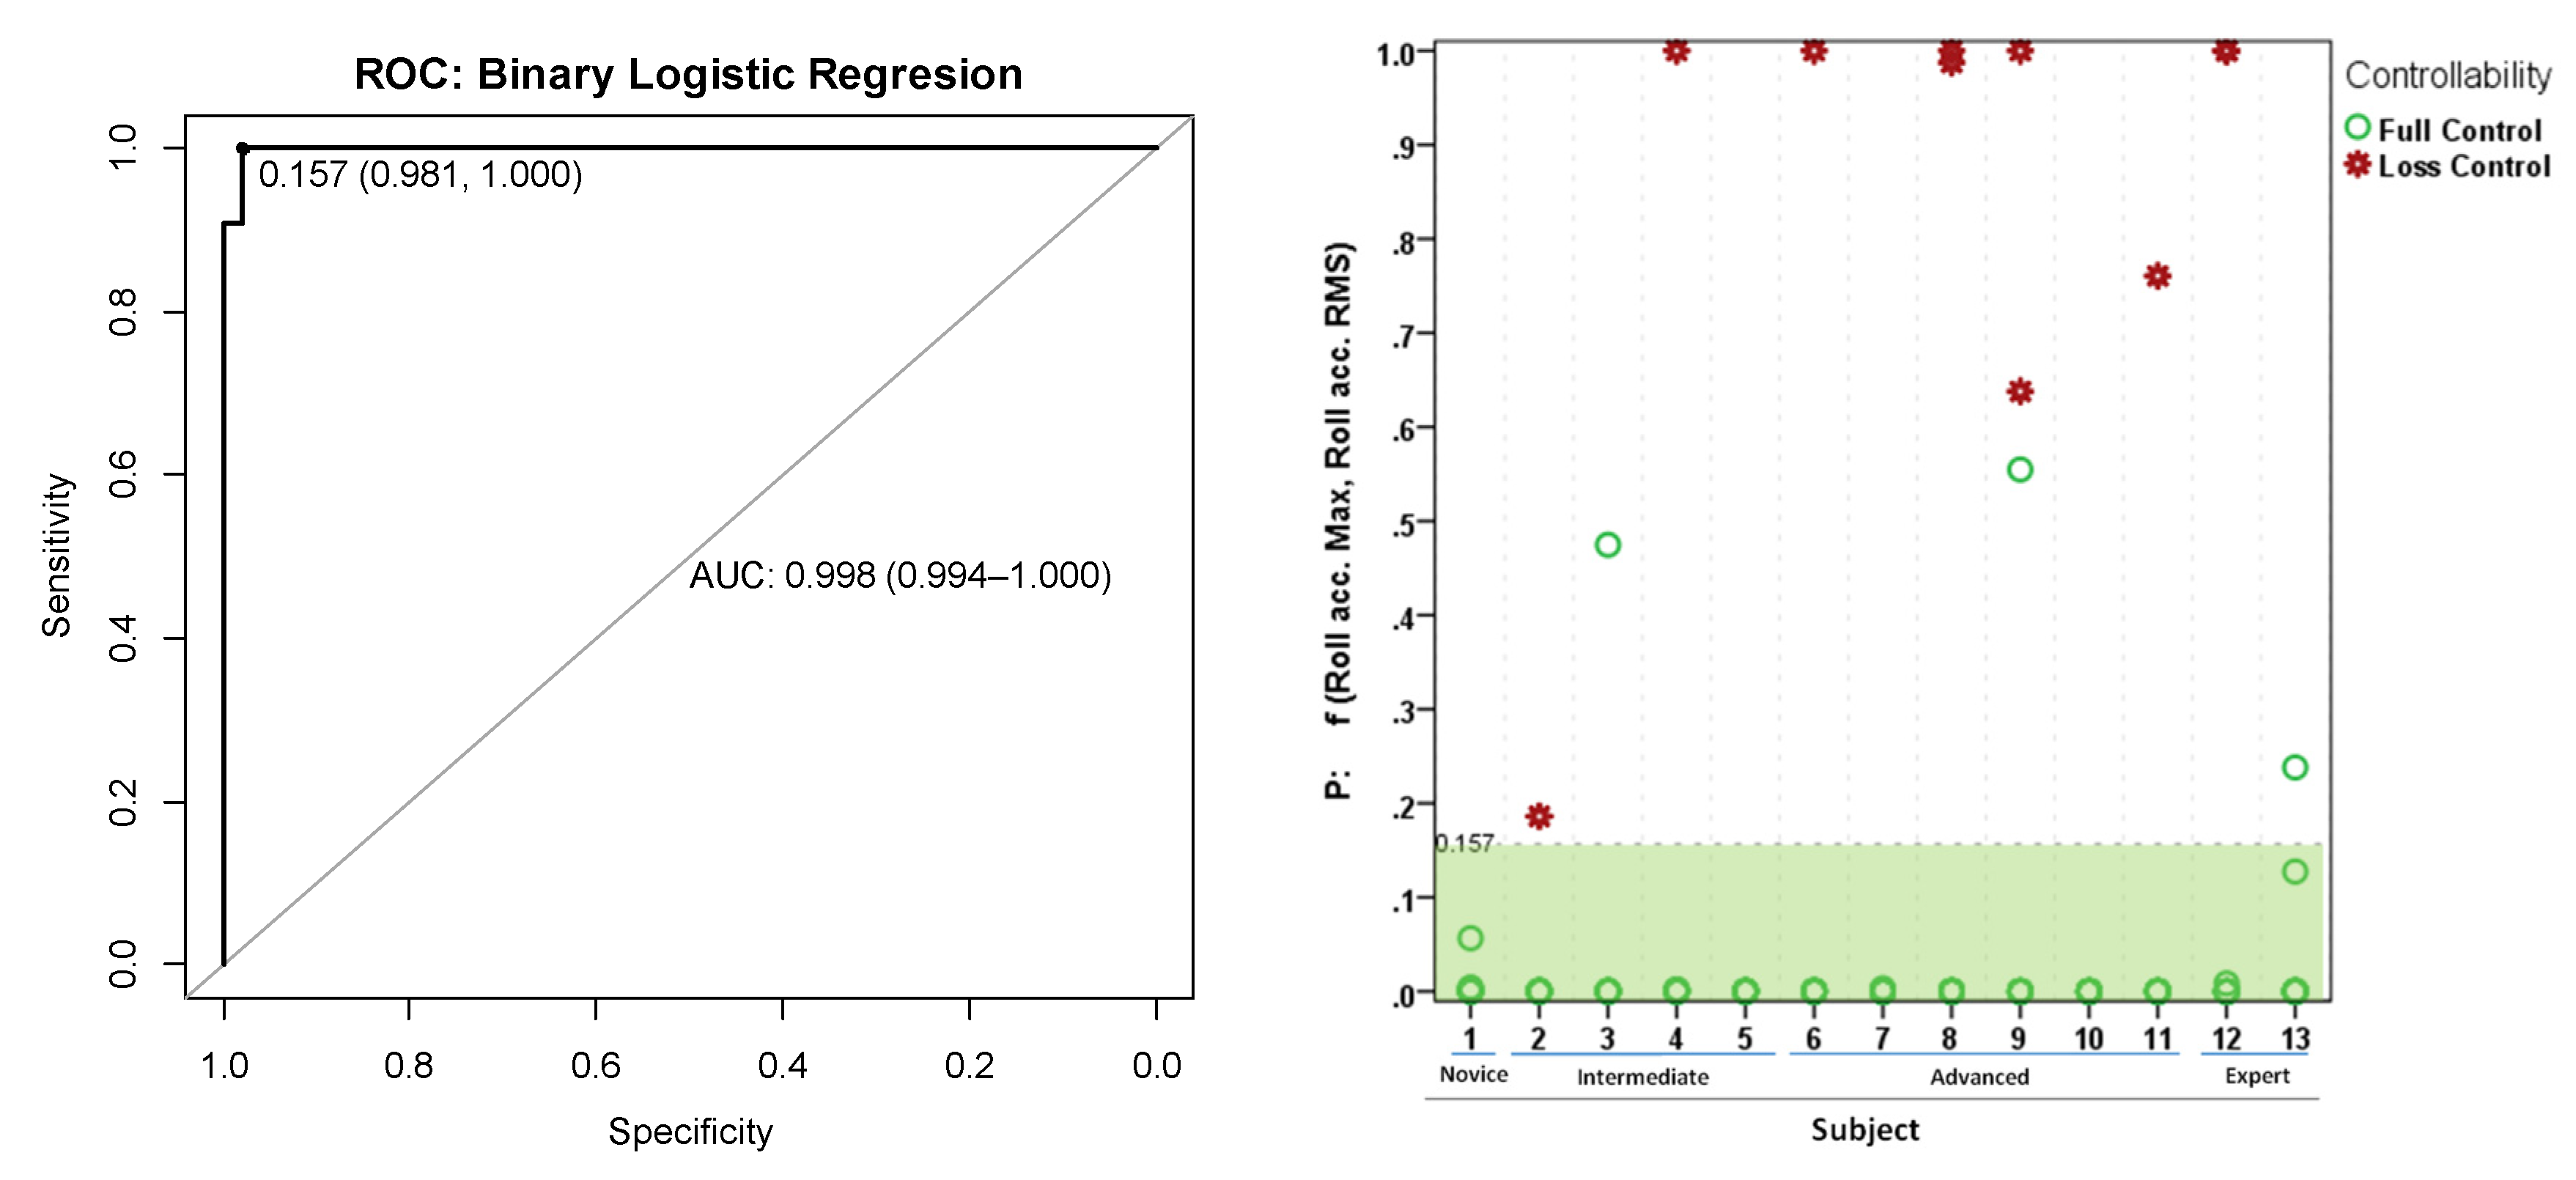
The classification accuracies achieved by the three models for identifying cases of loss of control are showed in Table 2. The ‘advanced’ model Model-3 was found to be the best model (AUC = 1.00), predicting correctly 100% (n = 11) and 100% (n = 154) of loss of control and full control cases, respectively. The ‘basic’ and ‘extended’ models obtained very high accuracy (AUC = 0.988 for Model-1 and AUC = 0.998 for Model-2), correctly predicting 90.9% and 100% of loss of control cases and 99.4% and 98.1% of full control cases, respectively. The p-values for the Hosmer-Lemeshow tests (ranged between 0.648 to 1.00) also indicated good fit of all models. Table 2 also shows the best decision threshold determined by the Youden index for each model, e.g., for Model-1, a probability higher than 0.442 will classify the braking case as loss of control.
Figure 7, Figure 8 and Figure 9 show the ROC curve and the scatter plot of loss of control probability by subject and skill level for the 165 braking trials in each the three models; the green area of the scatter plots corresponds to the values considered by each respective model as full control and the controllability markers (green and red) the binary rating of the coders (full control and loss of control).

3.4. Performance of the Single Predictors

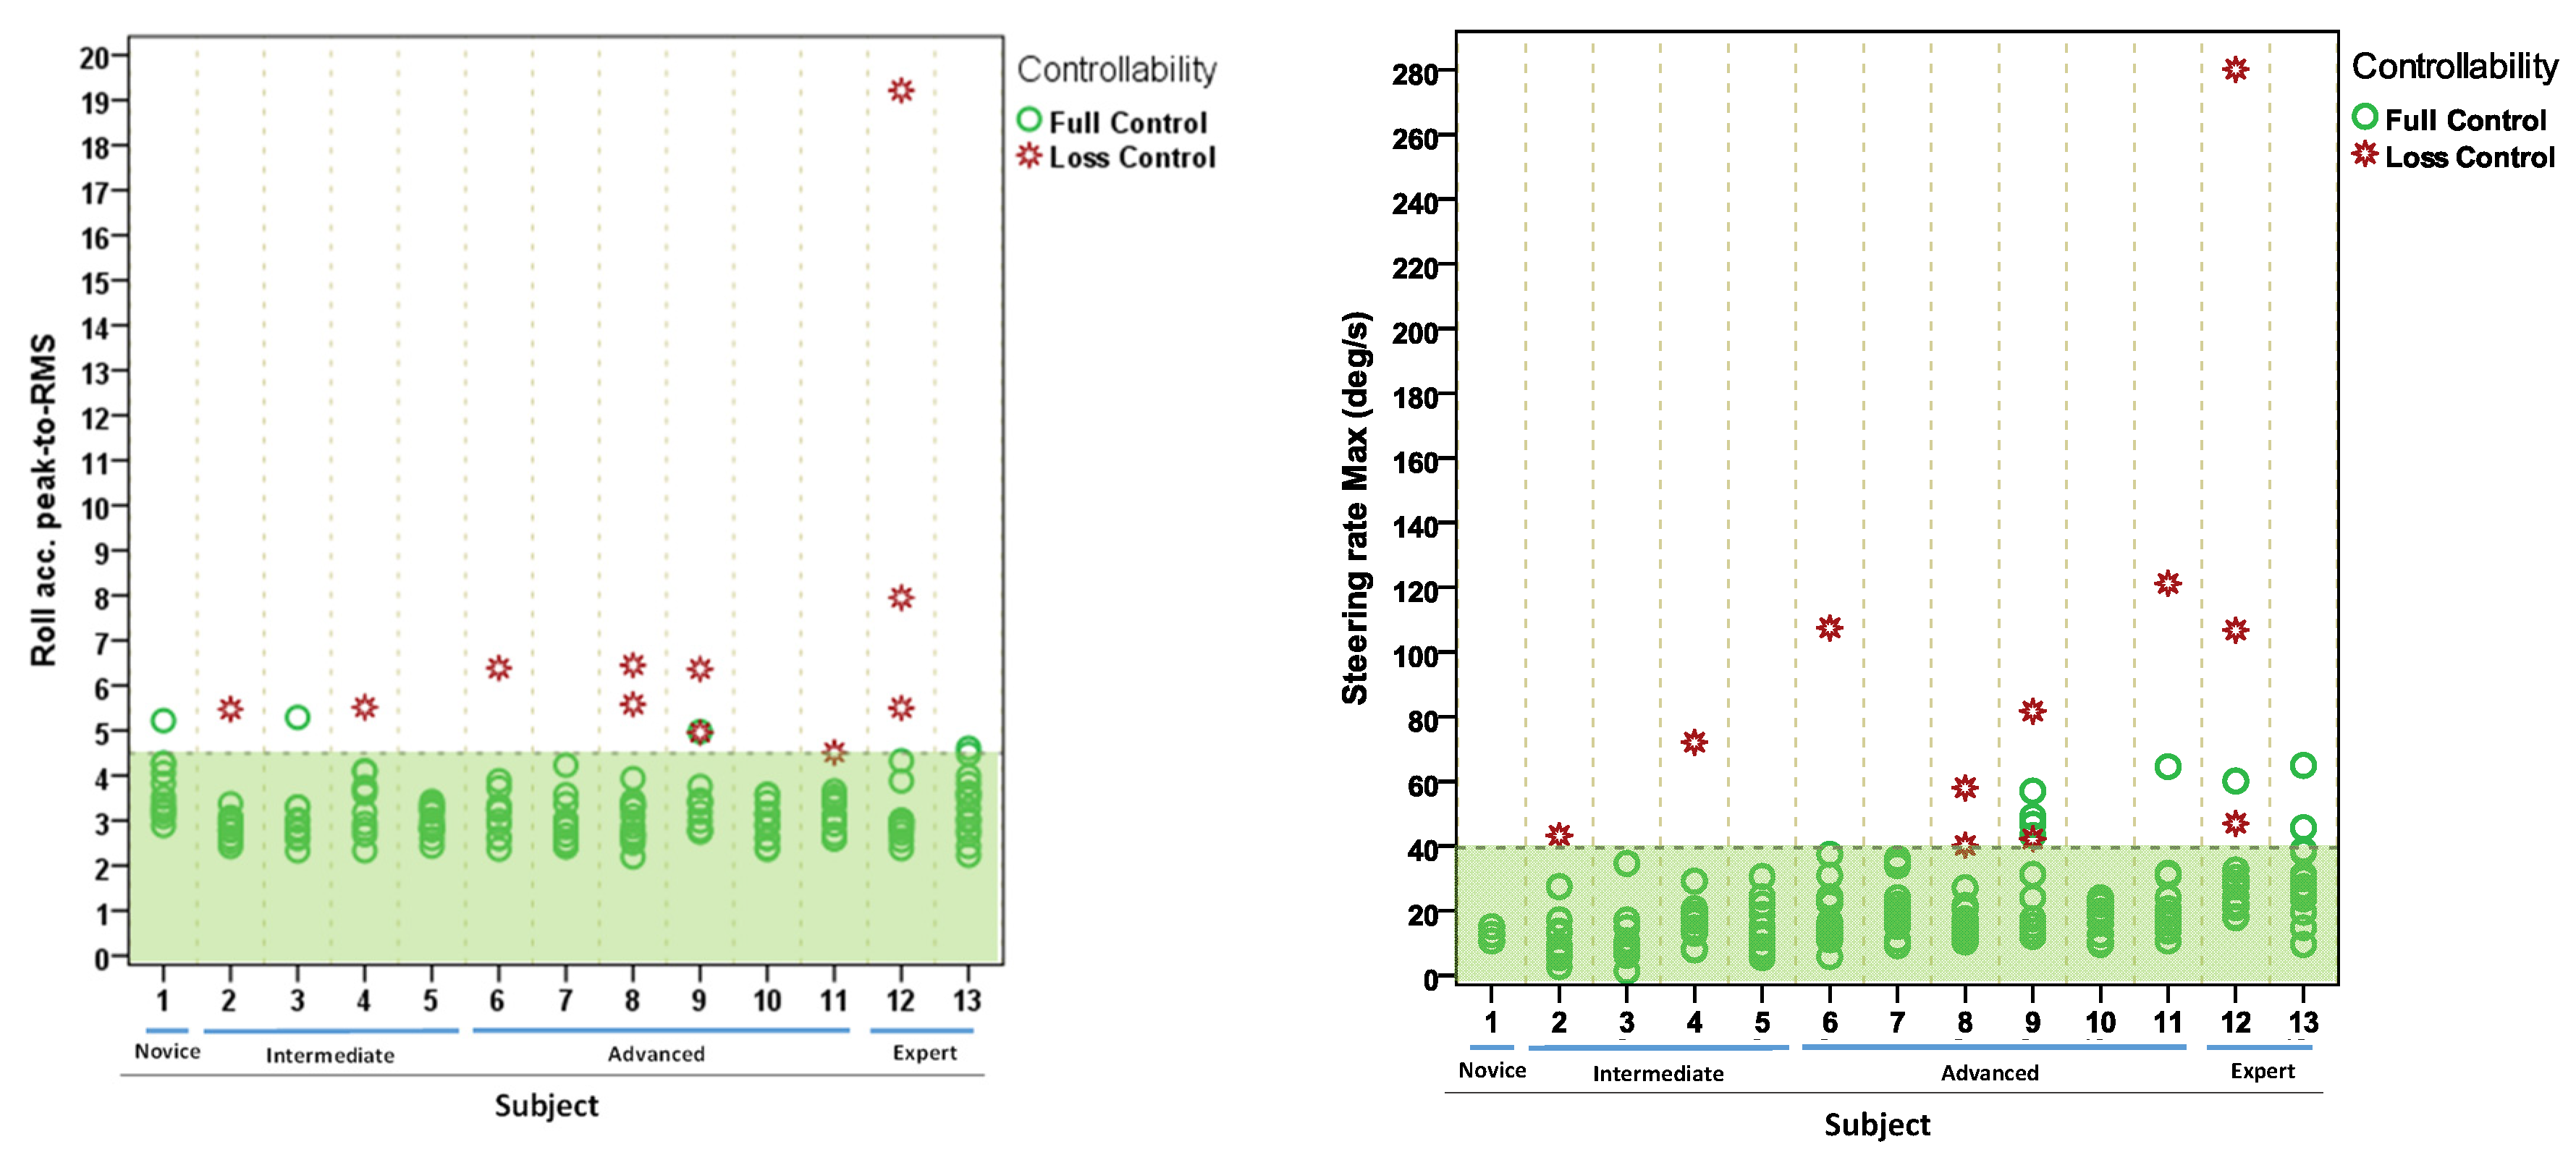
In order to understand the prediction capabilities of the different kinematic parameters, we defined the best threshold to detect loss of control and computed the performance (Table 3). Figure 10 shows how the best predictor (peak-to-RMS ratio of roll acceleration) with the best AUC performance and with the 100% of sensitivity may be a robust indicator independent of the rider skill effect.

3.5. Loss of Control Predictive Model for Time Series data

Equations (3) and (6), respectively for Model-1 (simplest model) and Model-3 (best performance) were applied to each instant to predict the time series loss of control probability (see Equations (6) and (9) with the functions FMax(Xt), FRMS(Xt) and Fpeak-to-RMS ratio (Xt) defined in Section 2.5.
Yt (model-1) = μ0 + μ1* FRMS(Gyro Normt) + μ2* FMax(Gyro Zt) + μ3* FMax (Lat Accelt)
Yt (model-3) = β0 + β1* FMax(Yaw_Acct) + β2* Fpeak-to-RMS ratio(Roll_Acct)
where μk and βk are the coefficients estimated previously for the Model-1 and Model-3, respectively.
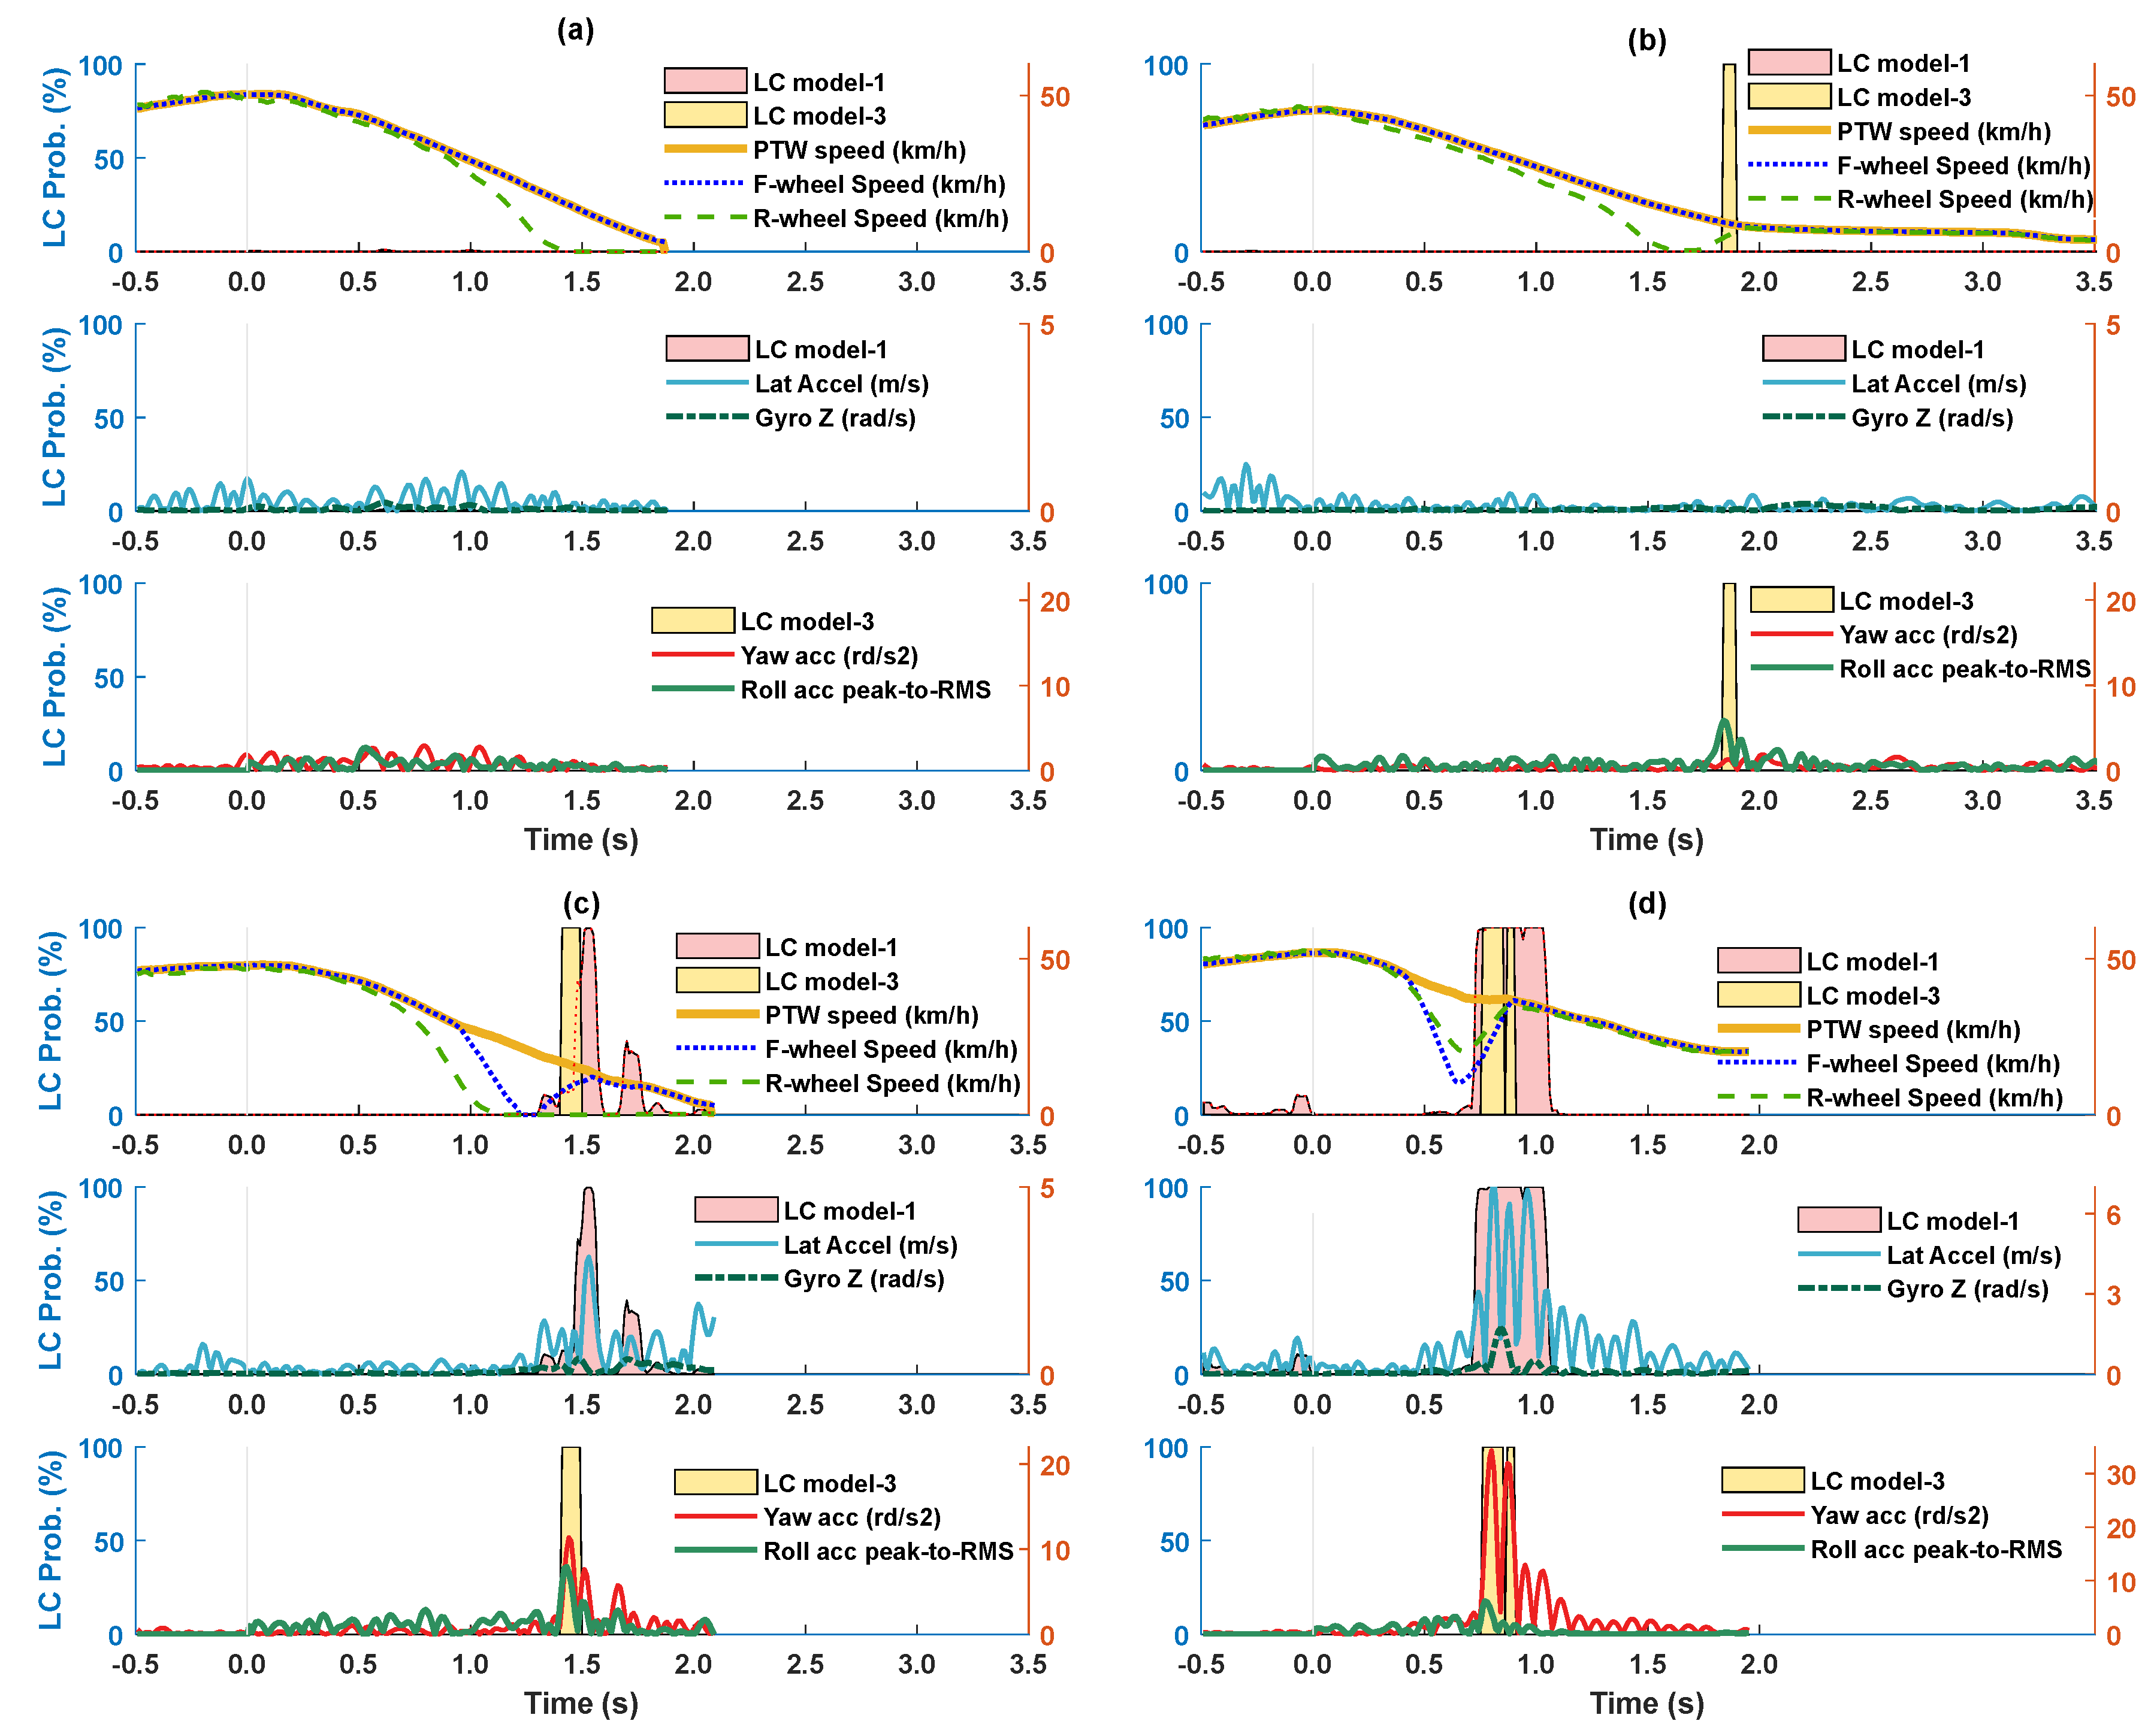
Time series predictive model based on ‘advanced’ model Model-3 predicted all 11 loss of control cases (100% accuracy) and the model based on ‘basic’ model Model-1 predicted 10 cases (90.9%), corresponding to the same performance achieved off-line. Model-3 detected loss of control cases 19 ms earlier than Model-1 in average (SD = 93 ms), but no significant differences were found (Wilks’ Lambda = 0.992, F(1,9) = 0.072, p = 0.561). No differences were found in the vehicle speed at which loss of control was detected for each model (mean of 21.3 and 21.1 km/h for Model-1 and Model-3, respectively; Wilks’ Lambda = 0.995, F(1,9) = 0.047, p = 0.833). Figure 11 shows examples of four riders performing braking trials with the real-time loss of control predictors adapted from Model-1 and Model-3. Each example of Figure 11 from (a) to (d) includes three plots: the upper plot shows the loss of control (LC) probability for Model-1 and Model-3 and the vehicle and wheel speed; the middle plot shows the LC probability for Model-1 and its two most significant predictor variables; the lower plot shows the LC probability for Model-3 and its two predictor variables. The left y-axis represents the LC probability defined by the models and right y-axis represents the magnitude of speed for the upper plot and of the predictor variables for the rest.

4. Discussion

This study aimed to provide a method to identify loss of control events in braking maneuvers on a straight line before they become irreversibly unstable to support motorcycle crash reduction through active systems developments and training initiatives. Using experimental data, we analyzed hard braking maneuvers in an emergency scenario to identify loss of control conditions during the braking performance with riders from low to high braking skill levels. The results provide a measure of the motorcycle dynamics variability in emergency braking maneuvers associated with riders of different skill levels.
Three predictive models with 100%, 99.8% and 98.8% of area under the ROC curve (AUC) were developed using the kinematics of the vehicle as an input. The effectiveness of the supervised models for real-time applications, adapted for times series of data as input, was satisfactory in all two of the tested models. The study also revealed that the thresholds based on typical parameters characterizing the kinematics of the vehicle (maximum or RMS) to predict loss of control are dependent of the rider skill levels. Expert riders may maintain stability (i.e., handle the controllability) under dynamic conditions that would normally bring less skilled riders to loss of control or falling events.
The results of our study are comparable with the work in Reference [6] and Reference [13], which defined threshold for the lock front-wheel duration and the maximum of the gyro norm (Gyro Norm Max) respectively as predictors of falling events. Gail et al. [6] determined that after 0.4 seconds of front wheel locked, the instability conditions lead to a fall. Our tests were performed with standard brakes (no ABS), and in many trials during the hard braking, the tires started to lock. We found that for less skilled riders, front wheel locking longer than 0.1s is linked to some kind of loss of control. Yet the two expert skilled riders in three trials were able to keep stability with front wheel lock events lasting more than 0.4s. Boubezoul et al. [13] in their test performing falls with a stunt defined a threshold of Gyro Norm Max of 2 rad/s to identify falling events. Our study, focused on loss of control events not necessarily leading to falls, set the threshold for the best AUC performance to a lower level (0.77 rad/s). However, we also found that in one case, expert riders avoided the falling (not the loss of control) with an absolute gyro rate slightly higher than those 2 rad/s. Our results, presenting Gyro-Z (yaw rate) as one of the predictors of loss of control, are consistent with [10], which found correlation between low-side fall and high yaw rate. However, our study revealed that the peak-to-RMS ratio of roll acceleration is the most robust parameter for identifying loss of control for braking maneuvers performed by riders of every skill levels. Results from previous studies aiming to detect falling events after loss detection were focused on passive safety applications. The present study, which proposed predictive models to detect loss of control events before they irreversibly lead to a fall, has applications for active safety technologies. Additionally, our findings indicate that previous falling detection algorithms (typically linked to activation of passive safety systems, e.g., airbags) may produce false positive cases for highly skilled riders who can handle the vehicle in extreme conditions.
Some limitations have to be considered. Predictive models defined based on a small sample of loss of control cases have the risk of overfitting. The most important predictor (peak-to-RMS ratio of roll acceleration) is computed with the differential of a collected measure (Gyro-X), so the values may be sensitive to noise and the filter methods applied to reduce it. Additionally, the high accuracy achieved by the proposed models applies to braking events in specific conditions on a straight line and velocities of around 50 km/h using a 300 cc scooter. To reduce overfitting, we adopted the following measures: we developed three different models with low complexity (logistic regression models); we reduced the number of predictors to a maximum of three; we selected our data in order to consider loss of control cases with riders of different skills and finally, when required, using regularization methods to make decision boundaries smoother to reduce coefficient variability. Despite this, the 100% accuracy obtained with Model-3 is expected to decrease for a broad sample of cases at the limit of loss of control (close to the decision boundaries of the model). Further research is warranted to confirm the accuracy of the proposed models, using these models on loss of control scenarios due to braking events that are different from those analyzed in this experiment such as naturalistic near-crash events or the more common straight line hard braking without an opponent vehicle. It would also be important to assess the effectiveness of the proposed approach for braking maneuvers under a broader set of conditions.
The study presented provides valuable information on the stability capabilities of the riders under a braking maneuver close to emergency scenarios and help to understand the process and the motion conditions that lead rider to start losing control. The loss of control predictive models developed may provide support to: (a) active safety systems developments; and (b) training actions aiming to improve rider’s skills with objective indicators of the controllability of the braking maneuver. The new development of active safety technologies are rider-in-the-loop-systems whose efficiency depends on understanding the response of the riders. The predictive models and kinematic thresholds identified in this work can be used in cases of emergency braking to improve the triggering algorithms used by active stability control systems (e.g., cable steering systems [23] or gyro-stabilization systems [24]). Furthermore, the models can also be applied for acceptance assessment of new advanced riding assistance systems such as motorcycle autonomous emergency braking system [25] by classifying the riding controllability/instability during the activation of these systems and providing information about the riders’ performance capabilities. Regarding the actions to improve the riders’ braking skills, our predictive models may be a helpful tool for rider instructors to understand and assess the trainee performance limits using indicators. This may support training programs for assigning the appropriate level of demand for improvement without exceeding the safety limits. The findings of this study contribute to a better understanding of the riding responses for the development of future countermeasures to reduce motorcycle crashes.

Author Contributions

“conceptualization, P.H.-L., G.S., N.B. and M.P.; methodology, P.H.-L., G.S., N.B. and M.P.; software, P.H.-L.; validation, P.H.-L., G.S., N.B. and M.P.; formal analysis, P.H.-L.; investigation, P.H.-L.; resources, M.P., P.H.-L. and G.S.; data curation, P.H.-L.; writing—original draft preparation, P.H.-L.; writing—review and editing, P.H.-L.; G.S. and N.B.; visualization, P.H.-L.; supervision, N.B. and G.S.; project administration, M.P., G.S. and P.H.-L.; funding acquisition, M.P. and G.S. All authors have read and agreed to the published version of the manuscript.

Funding

This research was funded by the 7th Framework Program of the European Commission within the Marie Curie Actions (MOTOrcycle Rider Integrated SafeTy, grant number 608092).

Acknowledgments

We thank Simon Rosalie, Marilee Nugent and Cosimo Lucci (Università degli Studi di Firenze) for their support in the development of the experimental tests.

Conflicts of Interest

The authors declare no conflict of interest.

References

  1. Cossalter, V.; Lot, R.; Maggio, F. On the braking behavior of motorcycles. SAE Trans. 2004, 18, 2004. [Google Scholar]
  2. Fredriksson, R.; Sui, B. Powered two-Wheeler accidents in Germany with severe injury outcome-Accident scenarios, injury sources and potential countermeasures. In Proceedings of the IRCOBI Conference, Malaga, Spain, 14–16 September 2016; Available online: http://www.ircobi.org/wordpress/downloads/irc16/pdf-files/11.pdf (accessed on 2 March 2020).
  3. Corno, M.; Savaresi, S.M.; Tanelli, M.; Fabbri, L. On optimal motorcycle braking. Control. Eng. Pract. 2008, 16, 644–657. [Google Scholar] [CrossRef]
  4. Sharp, R.S. Limit braking of a high-performance motorcycle. Veh. Syst. Dyn. 2009, 47, 613–625. [Google Scholar] [CrossRef]
  5. Baldanzini, N.; Huertas-Leyva, P.; Savino, G.; Pierini, M. Rider Behavioral Patterns in Braking Maneuvers. Transp. Res. Procedia. 2016, 14, 4374–4383. [Google Scholar] [CrossRef] [Green Version]
  6. Gail, J.; Funke, J.; Seiniger, P.; Westerkamp, U. Anti Lock Braking And Vehicle Stability Control For Motorcycles-Why or Why Not? In Proceedings of the 21st ESV Conference, Stuttgart, Germany, 15–18 June 2009. [Google Scholar]
  7. Seiniger, P.; Schröter, K.; Gail, J. Perspectives for motorcycle stability control systems. Accid. Anal. Prev. 2012, 44, 74–81. [Google Scholar] [CrossRef] [PubMed]
  8. Symeonidis, I.; Kavadarli, G.; Erich, S.; Graw, M.; Peldschus, S. Analysis of the stability of PTW riders in autonomous braking scenarios. Accid. Anal. Prev. 2012, 49, 212–222. [Google Scholar] [CrossRef] [PubMed]
  9. Savino, G.; Pierini, M.; Thompson, J.; Fitzharris, M.; Lenné, M.G. Exploratory field trial of motorcycle autonomous emergency braking (MAEB): Considerations on the acceptability of unexpected automatic decelerations. Traffic Inj. Prev. 2016, 17, 855–862. [Google Scholar] [CrossRef] [PubMed]
  10. Bellati, A.; Cossalter, V.; Lot, R.; Ambrogi, A. Preliminary investigation on the dynamics of motorcycle fall behavior: Influence of a simple airbag jacket system on rider safety. In Proceedings of the 6th International Motorcycle Conference, IFZ Institute for Motorcycle Safety, Cologne, Germany, 9–10 October 2006. [Google Scholar]
  11. Cossalter, V.; Aguggiaro, A.; Debus, D.; Bellati, A.; Ambrogi, A. Real cases motorcycle and rider race data investigation: Fall behavior analysis. In Proceedings of the International Technical Conference on the Enhanced Safety of Vehicles (ESV) National Highway Traffic Safety Administration (No. 07-0342), Lyon, France, 18–21 June 2007. [Google Scholar]
  12. Attal, F.; Boubezoul, A.; Oukhellou, L.; Cheifetz, N.; Espie, S. The Powered Two Wheelers fall detection using Multivariate CUmulative SUM (MCUSUM) control charts. In Proceedings of the 17th International IEEE Conference on Intelligent Transportation Systems (ITSC), Qingdao, China, 8–11 October 2014. [Google Scholar]
  13. Boubezoul, A.; Espié, S.; Larnaudie, B.; Bouaziz, S. A simple fall detection algorithm for powered two wheelers. Control. Eng. Pract. 2013, 21, 286–297. [Google Scholar] [CrossRef]
  14. Shinar, D. Traffic Safety and Human Behavior; Elsevier: Oxford, UK, 2007. [Google Scholar]
  15. Giovannini, F.; Baldanzini, N.; Pierini, M. Development of a Fall Detection Algorithm for Powered Two Wheelers Application. SAE Tech. Pap. 2014. [Google Scholar] [CrossRef]
  16. Huertas-Leyva, P.; Nugent, M.; Savino, G.; Pierini, M.; Baldanzini, N.; Rosalie, S. Emergency braking performance of motorcycle riders: Skill identification in a real-life perception-action task designed for training purposes. Transp. Res. Part. F Traffic Psychol. Behav. 2019, 63, 93–107. [Google Scholar] [CrossRef]
  17. Hallgren, K.A. Computing Inter-Rater Reliability for Observational Data: An Overview and Tutorial. Tutor. Quant. Methods Psychol. 2012, 8, 23–34. [Google Scholar] [CrossRef] [PubMed] [Green Version]
  18. Mcgraw, K.O.; Wong, S.P. Forming inferences about some intraclass correlation coefficients. Psychol. Methods 1996, 1, 30–46. [Google Scholar] [CrossRef]
  19. Bursac, Z.; Gauss, C.H.; Williams, D.K.; Hosmer, D.W. Purposeful selection of variables in logistic regression. Source Code Biol. Med. 2008, 3, 1–8. [Google Scholar] [CrossRef] [PubMed] [Green Version]
  20. Krzanowski, W.J.; Hand, D.J. ROC Curves for Continuous Data; Chapman and Hall/CRC: New York, NY, USA, 2009. [Google Scholar]
  21. Fawcett, T. An introduction to ROC analysis. Pattern Recognit. Lett. 2006, 27, 861–874. [Google Scholar] [CrossRef]
  22. Cicchetti, D.V. Guidelines, criteria, and rules of thumb for evaluating normed and standardized assessment instruments in psychology. Psychol. Assess. 1994, 6, 284–290. [Google Scholar] [CrossRef]
  23. Marumo, Y.; Katagiri, N. Control effects of steer-by-wire system for motorcycles on lane-keeping performance. Veh. Syst. Dyn. 2011, 49, 1283–1298. [Google Scholar] [CrossRef]
  24. Lot, R.; Fleming, J. Gyroscopic stabilisers for powered two-wheeled vehicles. Veh. Syst. Dyn. 2019, 5, 1381–1406. [Google Scholar] [CrossRef]
  25. Savino, G.; Giovannini, F.; Baldanzini, N.; Pierini, M.; Rizzi, M. Assessing the potential benefits of the motorcycle autonomous emergency braking using detailed crash reconstructions. Traffic Inj. Prev. 2013, 14, S40–S49. [Google Scholar] [CrossRef] [PubMed] [Green Version]
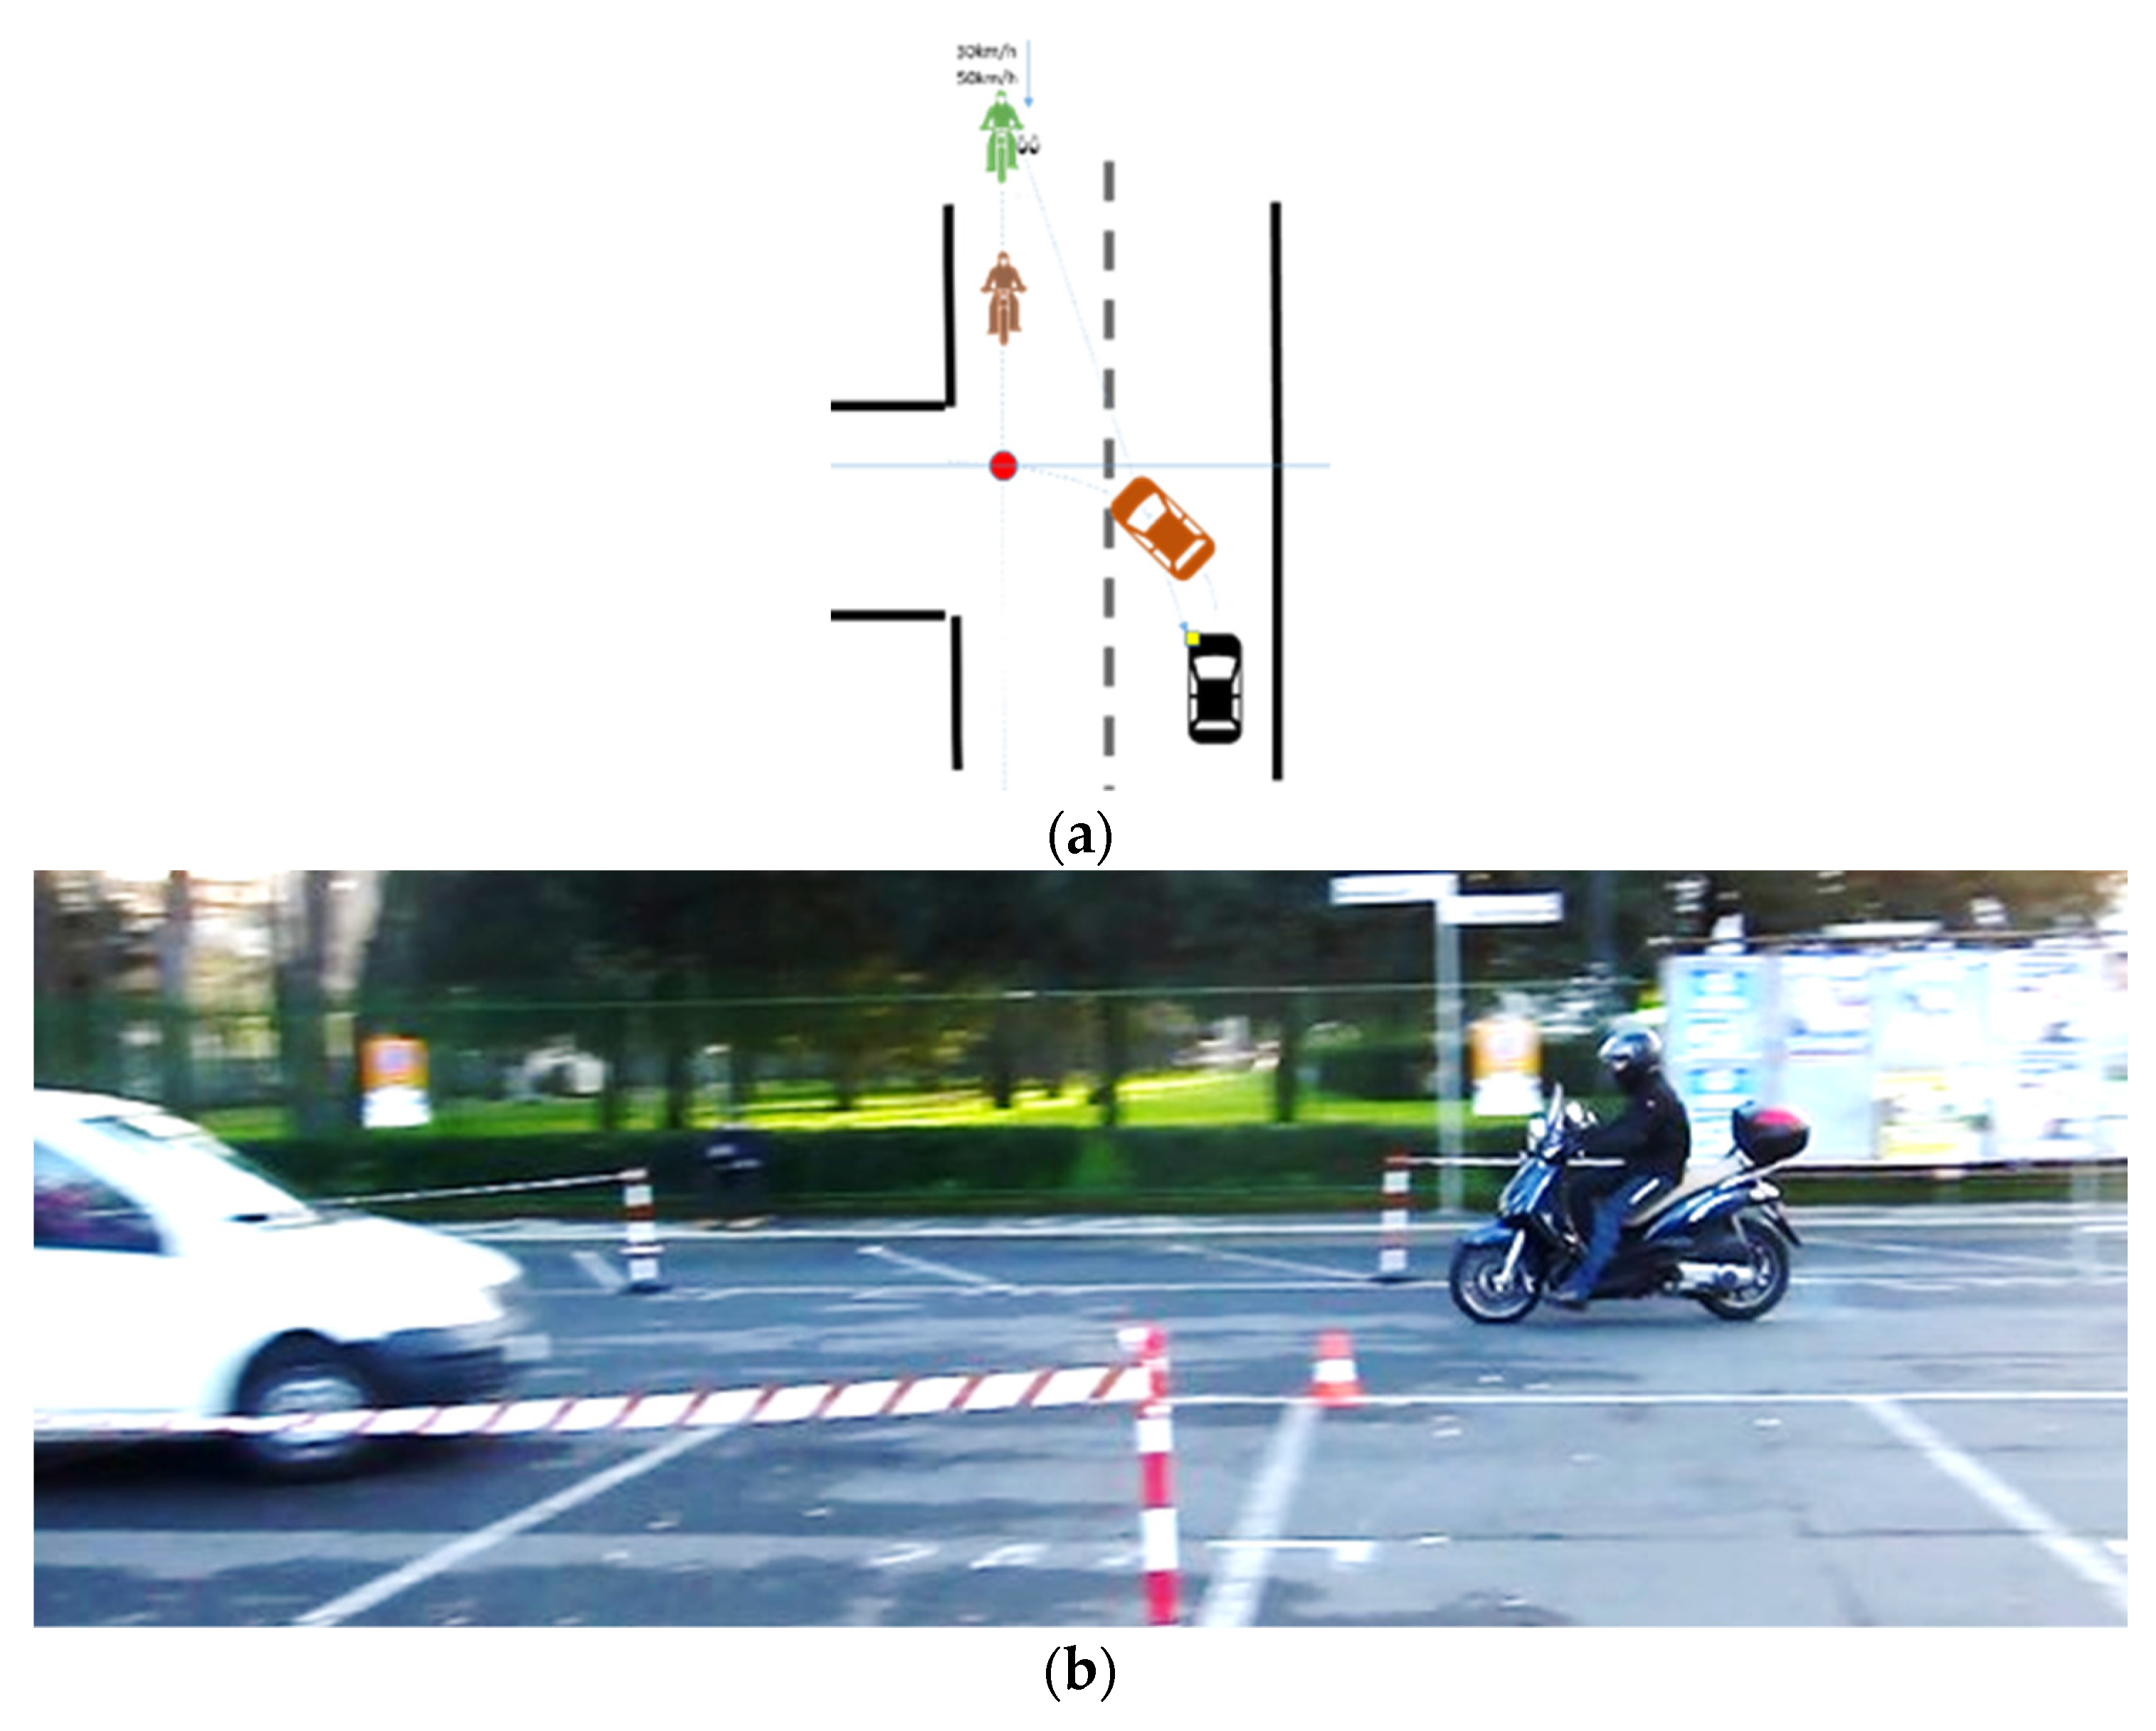
Figure 1. (a) Mock intersection; (b) Trial with car initiating a LTAP/OD maneuver.
Applsci 10 01754 g001
Figure 2. Example of a loss of control case after locking the front wheel.
Applsci 10 01754 g002
Figure 3. Example of braking trials: (a) full control case; (b) loss of control case.
Applsci 10 01754 g003
Figure 4. Box plot distribution of the predictors by Controllability level for 165 braking trials.
Applsci 10 01754 g004
Figure 5. Scatter plot by skill level (dotted line sets the threshold for less skilled riders): (a) Gyro Norm Max and (b) locked front-wheel duration.
Applsci 10 01754 g005
Figure 6. Ten-fold cross-validation on the simulated data sets. Red line: mean deviance; Blue line: bounds for deviances within one standard error.
Applsci 10 01754 g006
Figure 7. Model-1: ROC and scatter plot of loss of control probability by subject for the 165 braking trials.
Applsci 10 01754 g007
Figure 8. Model-2: ROC and scatter plot of loss of control probability by subject for the 165 braking trials.
Applsci 10 01754 g008
Figure 9. Model-3: ROC and scatter plot of loss of control probability by subject for the 165 braking trials.
Applsci 10 01754 g009
Figure 10. Scatter plot of loss of control probability by subject for the 165 braking trials for peak-to-RMS ratio of roll acceleration and “steering rate” (best decision threshold in dotted line).
Applsci 10 01754 g010
Figure 11. (a) full control braking trial with 0% of LC probability for Model-1 and Model-3; (b) loss of control detected only by Model-3 (LC probability for Model-1 = 0%); (c) loss of control detected earlier by Model-3; (d) loss of control detected earlier by Model-1.
Applsci 10 01754 g011
Table 1. Logistic Regression Analysis of 165 braking trials for loss of control cases classification.
β Coeff.Std. ErrorWaldp-Values
MODEL-1
Gyro Norm RMS−36.919.23.6190.057
Lat Accel Max2.81.16.4200.011
Gyro-Z_Max20.67.96.5950.010
Intercept−6.32.1529.1100.003
MODEL-2
Roll Acc Max6.94.42.7100.100
Roll Acc RMS−29.319.02.6130.106
Intercept−5.73.33.2870.070
MODEL- 3 ^
Roll Acc peak-to-RMS203.53356.00.0040.952
Yaw Acc Max24.6504.80.0020.961
Intercept−1147.919010.40.0040.952
Table 2. Prediction Performance and best thresholds for the models.
PredictorThresholdSpecificitySensitivityAUC (CI)Hosmer-Lemeshow Test
Model-1 0.4420.9940.9090.988 (0.968–1.00)χ2(8) = 5.991; p = 0.648
Model-20.1570.98110.998 (0.994–1.00)χ2(8) = 0.449; p = 1.00;
Model-30.275111.00 (1.00–1.00)χ2(8) = 0.000; p = 1.00
Table 3. Prediction Performance and best thresholds for the feature input.
PredictorThresholdSpecificitySensitivityAUC (CI)
Roll Acc peak-to-RMS 4.490.97410.996 (0.989–1.00)
Steering rate Max (°/s)39.50.94510.980 (0.960–1.00)
Gyro-Z Max (rad/s)0.2690.9220.9090.970 (0.930–1.00)
Yaw Acc Max (rad/s2)5.60.9940.8180.943 (0.859–1.00)
Lat Accel Max (m/s2)1.850.9550.9090.911 (0.766–1.00)
Gyro Norm Max (rad/s)0.7730.9870.8180.887 (0.728–1.00)
Lock front-wheel (s)0.090.9030.4550.673 (0.513–0.833)