Article

Preformed Pd-Based Nanoparticles for the Liquid Phase Decomposition of Formic Acid: Effect of Stabiliser, Support and Au–Pd Ratio

1
Cardiff Catalysis Institute, School of Chemistry, Cardiff University, Main Building, Park Place, Cardiff CF10 3AT, UK
2
Dipartimento di Chimica Industriale “Toso Montanari”, Alma Mater Studiorum, University of Bologna, Viale Risorgimento 4, 40136 Bologna, Italy
3
Dipartimento di Chimica, Università degli Studi di Milano, Via Golgi 19, I-20133 Milano, Italy
*
Authors to whom correspondence should be addressed.
Appl. Sci. 2020, 10(5), 1752; https://doi.org/10.3390/app10051752
Submission received: 11 December 2019 / Revised: 26 February 2020 / Accepted: 28 February 2020 / Published: 4 March 2020
(This article belongs to the Special Issue Support Effect in Liquid Phase Reactions)

Abstract

:
Hydrogen is one of the most promising energy carriers for the production of electricity based on fuel cell hydrogen technology. Recently, hydrogen storage chemicals, such as formic acid, have been proposed to be part of the long-term solution towards hydrogen economy for the future of our planet. Herein we report the synthesis of preformed Pd nanoparticles using colloidal methodology varying a range of specific experimental parameters, such as the amount of the stabiliser and reducing agent, nature of support and Pd loading of the support. The aforementioned parameters have shown to affect mean Pd particle size, Pd oxidation, atomic content of Pd on the surface as well as on the catalytic performance towards formic acid decomposition. Reusability studies were carried out using the most active monometallic Pd material with a small loss of activity after five uses. The catalytic performance based on the Au–Pd atomic ratio was evaluated and the optimum catalytic performance was found to be with the Au/Pd atomic ratio of 1/3, indicating that the presence of a small amount of Pd is essential to promote significantly Au activity for the liquid phase decomposition of formic acid. Thorough characterisation has been carried out by means of XPS, SEM-EDX, TEM and BET. The observed catalytic performance is discussed in terms of the structure/morphology and composition of the supported Pd and Au–Pd nanoparticles.

Graphical Abstract

1. Introduction

Hydrogen is considered as one of the most promising energy sources in the near future since it is globally accepted as a promising energy carrier for producing electricity in a fuel cell using a sustainable generation pathway, taking into consideration that the only by-product of its reaction with oxygen is water, therefore a green process [1]. Moreover, hydrogen can be one of the alternative energy sources for fuel cell vehicles and portable electronic devices [2,3]. However, one of the main limitations of hydrogen storage technologies is at this moment related to (i) the capacity hydrogen storage devices and the safety hazards regarding hydrogen storage (transportation and flammability). To overcome these challenges, a range of technological approaches has been reported. Either physical or chemical storage of hydrogen is considered as alternative solutions. In the former case, hydrogen is preferentially adsorbed into materials with high surface area and porosity, such as carbon materials [4], metal-organic frameworks [5] or zeolites [6] and in the latter case, a hydrogen-rich material could be efficiently decomposed via a catalytic chemical process. Examples of these liquid-phase carriers are alcohols [7], hydrazine [8], ammonia [9] and formic acid (HCOOH) [10].
Formic acid is an important chemical product synthesised by means of biomass process. It has been reported as a safe and convenient potential storage material of hydrogen under mild conditions due to the following properties: high volumetric hydrogen content (4.4%), liquid state at room temperature, high stability, environmental benignity and nontoxicity. The decomposition of formic acid follows two main pathways, (i) dehydrogenation (HCOOH → CO2 + H2, ∆G = −48.4 kJmol−1) and (ii) dehydration (HCOOH → CO + H2O, ∆G = −28.5 kJmol−1), being the dehydration pathway promoted by acidity or heating.
Formic acid decomposition in the liquid phase has been studied using a range of either homogeneous or heterogeneous catalysts [11]. Homogeneous catalysts have shown promising high catalytic performance, however, issues such as separation from the reaction mixture and recycling, have not been overcome yet and therefore, to achieve scaling up for commercial applications. Heterogeneous catalysts, based on supported metal nanoparticles, such as Pd, Au or Ag and their alloys have been reported in both the past and recent years [5,12,13,14,15,16,17,18,19,20,21,22,23,24,25]. Several supports have been used for studying the nature and influence of support, i.e., activated carbon [22,23,24], TiO2 [26], zeolites [25], macroreticular resin [13], amines [14] and MOFs [5,15,16].
One of the typical methods used widely for the synthesis and deposition of metal nanoparticles is based on colloidal methods. Immobilisation of metal colloids offers the following advantages: namely, precise control of nanoparticle size and shape, narrow particle size distribution and the ability to regulate surface active sites by the choice and nature of the stabiliser/ligand [27,28,29,30,31,32,33,34,35]. We have shown previously that by choosing the appropriate ligand, varying the concentration of the precursor, amount of the ligand, reducing agent, temperature of the colloidal reduction, nature of the ligand and reducing agent can affect the final morphology and structure of synthesised nanoparticles [36,37,38]. In the present work, we report that by varying specific parameters of a typical sol immobilisation method we can tune the morphology of supported Pd monometallic catalysts and therefore catalytic performance. We focus on the variation of the following parameters: amount of stabiliser, Pd loading, reducing agent concentration, choice of support (activated charcoal and TiO2) and Au–Pd atomic ratio. The catalyst performance was evaluated using liquid phase formic acid decomposition as a model surface sensitive catalytic reaction for hydrogen production at mild reaction conditions. The characterisation of the supported catalysts was performed by means of X-ray photoelectron spectroscopy (XPS), transmission electron microscopy (TEM), scanning electron microscopy (SEM) with energy dispersive X-ray (EDX) and BET (Brunauer–Emmett–Teller) surface area.

2. Materials and Methods

2.1. Materials and Chemicals

Formic acid (≥95%) was obtained from Sigma Aldrich (Dorset, UK). Succinic acid (99%) from Sigma Aldrich (Cat. S3674-100G). NaBH4 (granular, 99.99% purity) and polyvinyl alcohol (PVA, Mw = 9000–10,000, 80% hydrolysed) from Sigma-Aldrich were used for the catalysts preparation. HAuCl4·H2O (99.9% purity) and K2PdCl4 (99.99% purity) were purchased from Alfa-Aesar and used as metal precursors. Activated charcoal (Fisher Scientific (Loughborough, UK): C/4010/60) and TiO2 (P25, Aeroxide (Essen, Germany) were used as supports. Deionised water was used as the preferred reaction solvent.

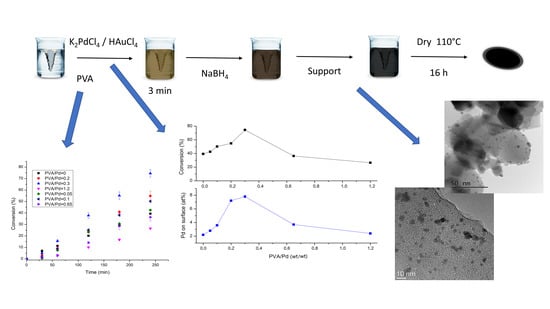
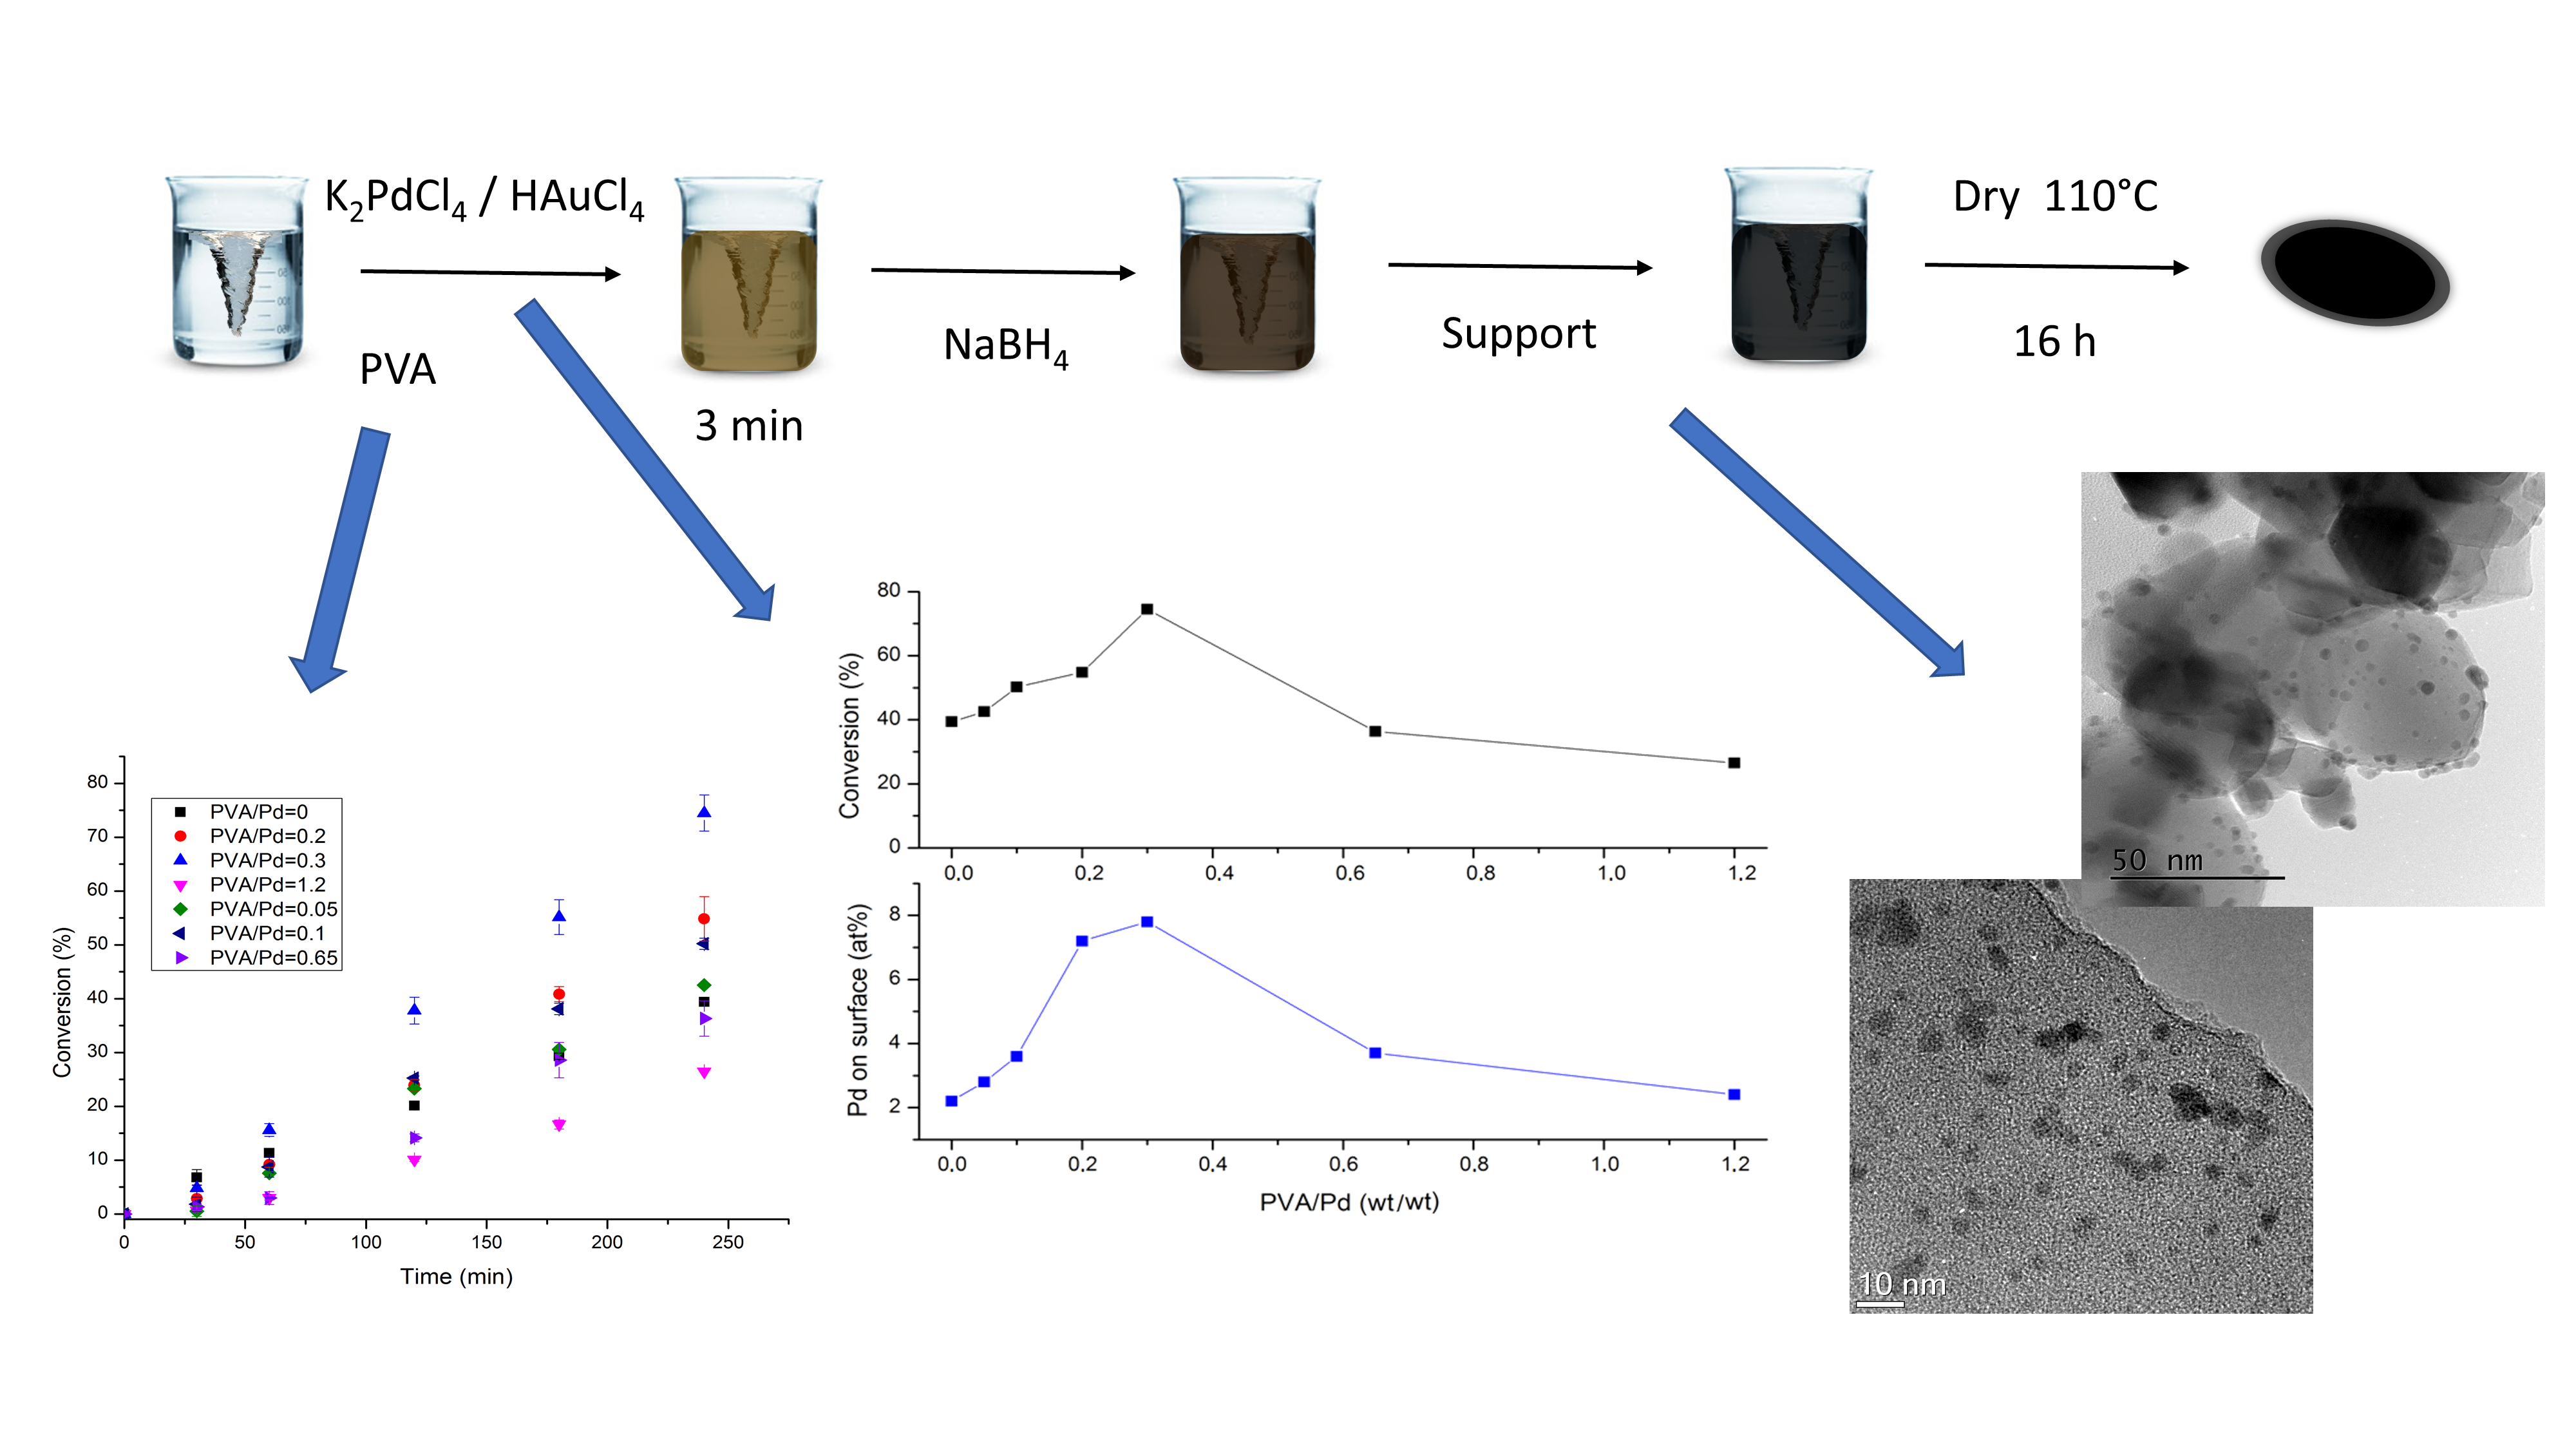
2.2. Catalyst Preparation

The technique of sol-immobilisation described has been presented in many reports previously [28,29,39,40]. Either K2PdCl4 or HAuCl4 (or a combination with the desired ratio depending if our aim is the bimetallic) and freshly prepared PVA solution (1 wt %, PVA/M = 0–1.2 weight ratio) were added to 400 mL of H2O. After 3 min, a freshly prepared aqueous solution of NaBH4 (0.1 M NaBH4/M = 5–10 molar ratio) as a reducing agent was added to the solution under vigorous magnetic stirring. The brown Pd0 sol or red for Au0 was immediately formed. Within a few minutes from its generation, the suspension was acidified at pH 2 by sulphuric acid and the support (activated charcoal or titania) was added under vigorous stirring. The amount of support was calculated to obtain a final metal loading of 1 wt %. The catalyst was filtered and washed several times with distilled water, recovered by filtration, and finally dried in an oven for 16 h at 110 °C. Table S1 displays the properties of the as-synthesised catalysts and parameters used during the sol-immobilisation.

2.3. Catalyst Characterisation

X-ray photoelectron spectroscopy (XPS) was performed on a Thermo Scientific K-alpha+ spectrometer. Samples were analysed using a monochromatic Al X-ray source operating at 72 W (6 mA × 12 kV), with the signal averaged over an oval-shaped area of approximately 600 microns × 400 microns. Data was recorded at pass energies of 150 eV for survey scans and 40 eV for high resolution scan with a 1 eV and 0.1 eV step size respectively. Charge neutralisation of the sample was achieved using a combination of both low energy electrons and argon ions (less than 1 eV), which gave a C(1s) binding energy of 284.8 eV. All data were analysed using CasaXPS (v2.3.17 PR1.1) using Scofield sensitivity factors and an energy exponent of −0.6. Particle size distributions and mean particle size were obtained by means of transmission electron microscopy (TEM) using a JEOL JEM 2100 TEM operating at 200 kV. Samples for examination were prepared by dispersing the catalyst in high purity ethanol. A drop of the suspension was allowed to evaporate on a holey carbon film supported by a 300-mesh copper TEM grid. Samples were subjected to bright field diffraction contrast imaging experiments. Mean particle sizes and particle size distributions were determined by measuring the size of over 200 particles from different selected areas. Scanning electron microscope (SEM) images were taken on Hitachi TM3030PLUS equipped with a Quantax70 energy-dispersive X-ray spectroscope (EDX) in order to study the morphology and determine the palladium content of the samples (fresh and used catalysts). BET surface area was determined from the N2 adsorption–desorption at liquid nitrogen at 77 K using a Quantachrome NOVA 2200e instrument. Samples were outgassed for 3 h under vacuum at 227 °C. Total surface area was determined using the BET (Brunauer–Emmett–Teller) equation and the multi-point method.

2.4. Catalytic Decomposition of Formic Acid and Analytical Methods

Liquid-phase formic acid decomposition is performed in batch conditions in a two-necked 100 mL round bottom flask with a reflux condenser and a magnetic stirrer. Of a 0.5 M HCOOH solution 10 mL was placed into the reactor under vigorous stirring. The screening temperature used was 50 °C. The temperature was monitored and controlled by a thermocouple immersed in an oil bath. Once it reached the desired temperature, the reaction was initiated by adding the catalyst. Typically, the reaction is carried out for 4 h. TOF (turnover frequency number: moles of reactant converted per mole of metal per time) was used for evaluating and comparing the activity of different catalysts.

2.5. Product Analysis

HPLC (high-performance liquid chromatography) was used to analyse the concentration of formic acid and therefore its conversion during the reaction progress. Liquid samples of the reaction mixture were withdrawn regularly, diluted with deionised water and analysed by HPLC Agilent 1220 Infinity LC using a column MetaCarb 87H 250 mm × 4.6 mm, Agilent, at 60 °C and a flow rate of 0.4 mL min−1. The instrument is equipped with a variable wavelength (VW) detector pre-set at 210 nm. The eluent was an aqueous solution of phosphoric acid (0.1 wt %). Succinic acid was used as external standard for the quantification of formic acid. Gas analysis from previous studies and at the same reaction conditions has verified that the typical ratios for H2/CO2 were from 0.94 to 1.09 and the selectivity toward H2 is higher than 99.9%. Therefore, in these studies, we focused on the activity of Pd catalysts based on formic acid conversion.

2.6. Reusability Tests

The reusability tests were carried out at 50 °C and using an aqueous solution of HCOOH (0.5 M). After a typical experiment, the reaction was stopped, the catalyst filtered at ambient temperature and pressure and without further washing, it was used in a new consecutive reaction under the same experimental conditions. The reaction was started again by initiating the stirring. This cycle was repeated five times.

3. Results

3.1. Optimisation of the Synthesis of Monometallic Pd Catalysts-Catalyst Characterisation

Table S2 presents elemental chemical composition and surface area analysis of the catalysts studied during the optimisation of the colloidal preparation method. SEM-EDX analysis was performed confirming the presence of Pd and quantifying the Pd loading. Pd metal loading of the as-synthesised Pd catalysts is in good agreement to the nominal value of 1 wt %. Taking into account that the support materials used, activated charcoal and TiO2 (commercial P25), presented a value of surface area of 64 and 63 m2/g respectively, we could conclude that a slight decrease in the surface area for the preformed Pd colloidal nanoparticles supported on activated charcoal was found, probably due to an obstruction of the pores (average pore size: 3.7–3.8 nm) since it is similar to the mean Pd particle size as presented in the next paragraphs. On the other hand, the Pd preformed colloidal nanoparticles supported on TiO2 did not present this decrease since the pore size is approximately 28 nm and the Pd particle size distribution between 2 and 8 nm (Figure S1). Mean particle size and particle size distributions of the catalysts were analysed by TEM (Table 1) and representative bright field TEM micrographs are shown in Figure S1. Variation of the PVA amount used during the synthesis of the catalysts showed a significant influence in terms of mean Pd particle size, particle size distribution and agglomeration of Pd particles on the surface. At the lowest PVA/Pd weight ratio (PVA/Pd = 0, 0.05 and 0.1) agglomeration of Pd nanoparticles and the presence of larger Pd nanoparticles were observed. Increasing the PVA/Pd weight ratio to 0.3 a lower degree of Pd particle agglomeration was observed and the mean Pd particle size was 4.8 nm. Further increase of PVA/Pd weight ratio to 0.65 and 1.2 led to a smaller and similar mean Pd particle size (3.0 and 3.1 nm, respectively). These results indicate that by using a PVA/Pd weight ratio of 0.3, the synthesis of small Pd nanoparticles with narrow particle size distribution is achievable without the necessity to use a higher amount of PVA to further synthesise smaller Pd nanoparticles. Moreover, a lower amount of PVA used during the synthesis is expected to facilitate catalytic activity, since a higher amount of Pd free active sites will be accessible due to the lower amount of PVA that may block Pd active sites, as we have been previously shown [41]. Increasing NaBH4/Pd molar ratio from 5 to 10 we observed a narrower particle size distribution for both supports (Pd/C-h, Pd/TiO2-f, PVA/Pd = 0.65 and NaBH4/Pd = 10) in the range of 2–6 nm. XPS analysis of the as-synthesised catalysts was performed to quantify the surface atomic percentage of Pd and identify Pd electronic states in the catalysts. A representative XPS survey of Pd/C-e (PVA/Pd weight ratio = 0.3) is presented in Figure S2. XPS spectra of Pd(3d) of the as-synthesised catalysts (when varying NaBH4/Pd molar ratio) are presented in Figure 1. Pd atomic content, percentage of Pd0 and mean particle size are shown in Table 1. The presence of two peaks corresponding to the Pd 3d5/2 and 3d3/2 transitions was observed. Each peak can be deconvoluted into two different peaks according to its oxidation number. In the following section, we will refer to the Pd 3d5/2 components when discussing peak positions and assignments. The peak at 335 eV approximately was assigned to the presence of metallic Pd [42] and the peak at approximately 337 eV, to the presence of PdII species, mainly present as PdO nanoparticles [43].
Table 1 and Figure 1 show the surface atomic percentage of Pd (exposure of Pd on the surface) for both activated charcoal and titania supported Pd catalysts. It has been shown from previous catalytic studies that the amount of metal on the surface can significantly influence catalytic performance [44,45]. A volcano plot illustrates how the PVA/Pd weight ratio can influence the exposure of Pd on the surface (Figure 1, Table 1). An increase of PVA/Pd weight ratio up to 0.3 was accompanied by an increase of surface Pd content, from 2.3 (for PVA/Pd = 0) to 8.2 (PVA/Pd = 0.3, (Table 1). At a higher PVA/Pd weight ratio a sequential decrease was observed. It is expected, as it has been shown from previous studies that the amount of Pd exposure on the surface could be affected by (i) particle size of Pd [46,47,48,49,50], (ii) amount and presence of PVA and (iii) nature of the support [51]. Taking into account the average pore diameter of the support is around 3.7 nm, smaller Pd nanoparticles than 3.7 nm could lay deeper in the internal surface of the activated charcoal support, explaining the trend observed when PVA/Pd ratio was above 0.3. In the case of using a PVA/Pd weight ratio lower than 0.3, the mean Pd particle size was higher than 4.8 nm and it is expected the main dominant factor for Pd exposure on the surface to be influenced by particle size effects; a large Pd particle size could lead to lower surface Pd exposure. It is difficult to quantify the amount of PVA present around the Pd nanoparticles and how it will affect the deposition of the Pd preformed metal nanoparticles. Nevertheless, it is expected that the presence of PVA could partially facilitate the increase of the number of Pd nanoparticles on the surface due to the possibility of blocking pores of the support based on the hydrodynamic radius of the stabiliser. This observation has an effect on the catalyst activity and it will be discussed in the following sections.
The oxidized Pd species are presented in low content in the samples (19%–38%) and the presence of oxidized Pd species is mainly due to the facile surface oxidation of metallic Pd with atmospheric O2. In general, a decrease in %Pd(0) content was observed with a decrease of Pd particle size (Table 1). These results are in good agreement with what is reported in the literature, where larger Pd particles are less prone to react with O2 than smaller ones [52]. On TiO2, Pd tends to be immobilised inside the pores in an equal or a higher degree than on the external surface explaining the low Pd content on the surface, due to the bigger pore size. Increasing NaBH4/Pd molar ratio from 5 to 10 slightly increases the amount of metallic Pd due to the presence of a higher amount of adsorbed hydride, regardless of the support (Table 1).

3.2. Catalytic Activity of the as Synthesised Monometallic Pd Catalysts for the Formic Acid Decomposition

The catalytic performance of the Pd catalysts prepared by sol-immobilisation was evaluated in the liquid-phase decomposition of formic acid as a model reaction for hydrogen generation. It was evaluated at 50 °C, 750 rpm, 0.5 M HCOOH, substrate/metal molar ratio of 2000 and 4 h reaction time, typical reaction conditions we had optimised in previous reports and showing the reaction is taking place in chemical kinetic regime [10]. Figure 2 illustrates the catalytic performance of the catalysts prepared by varying the PVA/Pd weight ratio from 0 to 1.2. The highest catalytic performance in terms of conversion was obtained with the catalyst Pd/C-e (PVA/Pd weight ratio = 0.3). As previously commented, this catalyst presents the highest atomic content of Pd on the surface, increasing the probability of formic acid to reach the active sites. Comparing the final conversion achieved and the Pd content on the surface versus the PVA/Pd weight ratio it is possible to observe the typical volcano trend (Figure 3).
Regarding particle size influence, the catalyst presenting the higher activity (Pd/C-e) had an mean particle size of 4.8 nm, while catalysts with smaller mean particle size (approximately 3.0 nm) as observed in the catalysts with PVA/Pd weight ratio of 0.65 and 1.2 presented a much lower catalyst activity. For this reason, the influence of particle size in catalyst activity for this series of catalysts was negligible compared to that of Pd exposure on the surface.
We could conclude that equilibrium must be reached. TEM micrographs presented zones with a high agglomeration of particles when the stabiliser was not present. On the contrary, when PVA/Pd is increased above a certain ratio, it probably tends to form a thick layer around the nanoparticle occupying active sites. Regarding NaBH4/Pd molar ratio, an increment in the catalytic activity was observed when it increased from 5 to 10 (Figure 4). This change can be explained by both the higher content of Pd on the surface and the higher percentage of Pd0 species for the catalysts synthesised using NaBH4/Pd molar ratio of 10.
When comparing the activity observing the used support, a slight increment was observed for the catalysts supported on activated charcoal. As previously explained, activated charcoal has a smaller pore size than titania. This could prevent nanoparticles from entering into the pores in activated charcoal, being those preferentially deposited on the external surface of the catalyst. Moreover, The amount of PVA (stabiliser used during the preparation method), that can block active sites, and the time requested to be removed from the surface during reaction, since it is soluble in water and during the progress of the reaction it can be removed from the surface can explain the induction-like trend observed. Furthermore, typically nanoparticles supported on TiO2 are hemispherical due to the wetting effect of the metal nanoparticle onto metal oxide. Therefore, reducing the active surface area and decreasing catalyst activity.

3.3. Effect of Pd Loading on Monometallic Pd/AC Catalysts

Five catalysts have been prepared in order to study the effect of Pd loading on the reaction. Table 2 presents the characterisation data of the as-synthesised samples and the TOF achieved after 4 h of reaction. A loading of 1 wt % produces the highest catalyst activity of this series of catalysts. The theoretical amount of metal was confirmed experimentally by EDX analyses. The samples have been also characterised by means of TEM analysis. TEM micrographs and particle size distributions of these catalysts are presented in Figure S3. As observed, even though the catalyst with the highest loading has the lower mean particle size and narrower distribution, the effects of agglomeration are perceptible (as observed in the EDX mapping presented in Figure S4), explaining the decrease in activity. XPS analysis reveals the most probable explanation for the behaviour of the observed catalysts activity. Although the percentage of metallic Pd is similar for the whole series of catalysts, the presence of Pd on the surface shows as well, a remarkable volcano plot where activity and amount of Pd on the surface reach the maximum for the 1 wt % loading, providing an explanation for the maximum of activity produced by this catalyst as shown in Table 2.

3.4. Reusability Tests

Reusability of the Pd/C-e (Figure 5) was studied at 50 °C and 0.5 M formic acid for five subsequent catalytic cycles. The reusability test was carried out by filtrating the catalyst at ambient temperature and atmospheric pressure without further washing and using it for a new reaction under the same reaction conditions. The as-synthesised catalysts exhibited a certain loss in catalytic activity, however reaching stabilisation after the third run preserving 69% of its initial activity after the fifth use. This decrease may be attributed to (i) increment in particle size or agglomeration, (ii) decrease of Pd loading by leaching, (iii) poisoning from CO, (iv) strong adsorption and poisoning of formate species and (v) formation of the Pd-H species. Representative images of the used catalyst after five runs and particle size distribution are reported in Figure S5. As previously presented, mean Pd particle size of the fresh catalyst was 4.8 ± 2.0 nm, however, for the catalyst after the fifth run, it increased to 6.9 ± 3.1 nm and the particle size distribution was broader: 50% of the particles were in the range 6–11 nm. Sintering phenomena were visible from the snapshots. Regarding XPS analysis of the used samples, a decrease of the metal content on the surface was observed. The fresh catalyst presents a 7.8%, however, it decreased to 2.3% after the fifth use. Since XPS is surface sensitive, the drop of Pd metal content for the used catalyst could be partially explained (i) by leaching, (ii) by a migration of the Pd nanoparticles from the external surface to the pores and (iii) by an increase in Pd mean particle size as previously observed. This is a possible reason for the decrease in catalytic activity for the reused catalysts, however, there could be a sum of factors. For example, adsorption of formate species and formation of Pd-H could be other factors that could elucidate the observed decrease in terms of catalytic activity. For this purpose, Density functional theory (DFT) studies could shed some light.

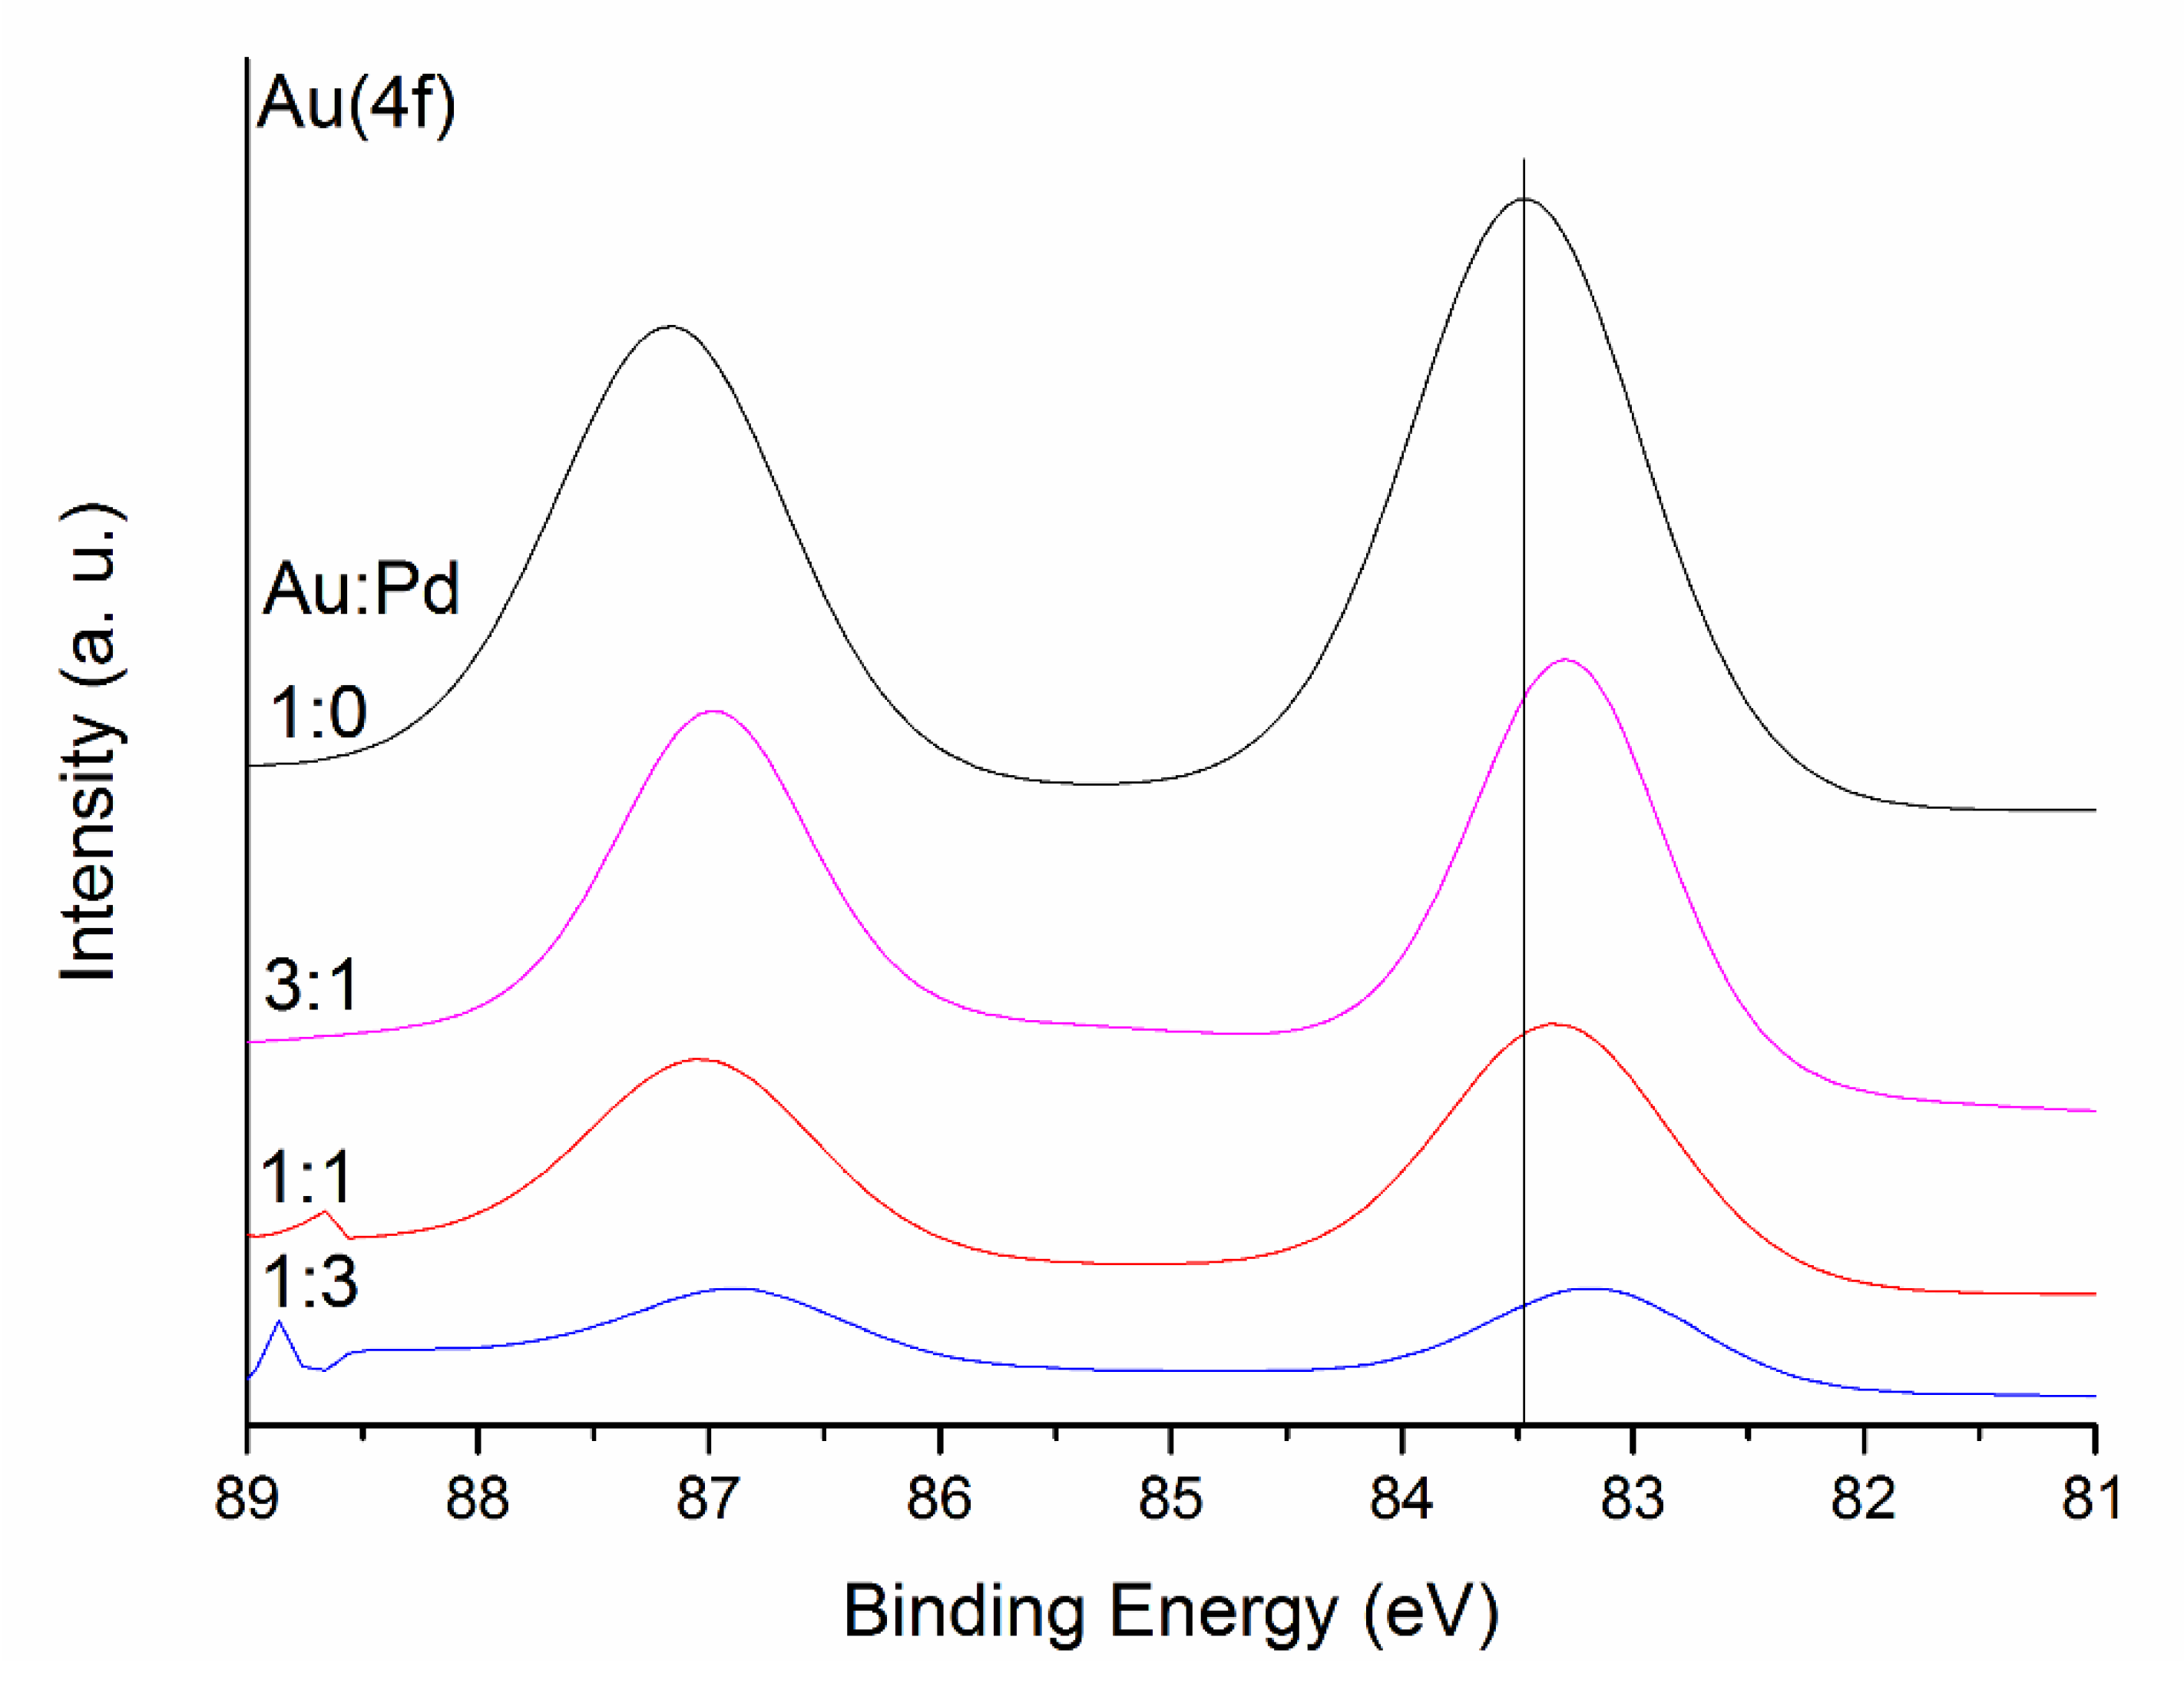
3.5. Characterisation and Catalytic Performance of AuxPdy/TiO2 for Formic Acid Decomposition

In the previous section, we showed the promising catalytic activity of monometallic Pd nanoparticles supported on activated charcoal and TiO2. In previous studies, many research groups have reported that the combination of Au and Pd could enhance significantly catalytic activity in a range of catalytic reactions, including oxidation of alkanes, alcohols and polyols, hydrogenation of aldehydes and in situ hydrogen peroxide synthesis [53,54]. Therefore, we investigated the catalytic activity of AuxPdy ratio for TiO2-supported nanoparticles for the liquid phase decomposition of formic acid. These catalysts have been prepared using the optimised synthesis procedure reported for the supported monometallic Pd catalysts (PVA/M weight ratio = 0.3 and NaBH4/M molar ratio = 10). Titania was used as support instead of activated charcoal. The main reason for this choice was that the catalytic performance of the Pd/TiO2 was similar to the analogous Pd/AC catalyst and further spectroscopic characterisation could be carried out in terms of CO-DRIFTS and FTIR when the choice of support is TiO2. In Table 3 the theoretical composition and characterisation data of the as-prepared catalysts are summarised.
All samples were analysed by SEM-EDX mapping to confirm the loading of Pd and provide information regarding metal dispersion. SEM-EDX mapping (Figure S6) showed that Au–Pd nanoparticles were well dispersed in all the as-prepared catalysts, no areas with high nanoparticle density/agglomeration were evidenced. The calculated metal loading approached the theoretical values expected within experimental error.
Mean particle size and particle size distribution were calculated by TEM analysis. Figure 6 displays representative TEM images and particle size distribution of the as-synthesised catalysts. TEM analysis confirmed a good level of dispersion of the supported nanoparticles in agreement with SEM-EDX mapping. The monometallic Pd/TiO2 and Au/TiO2 catalysts had slightly larger mean particle size (3.6–4 nm range; Table 3) compared to the bimetallic counterparts AuxPdy/TiO2 (3–3.4 nm range), suggesting that the co-reduction of Au and Pd facilitates a smaller mean particle size and in agreement with previous reports. In previous studies, we have shown by using Scanning Transmission Electron Microscope-High Angle Annular Dark Field Imaging (STEM-HAADF) and EDX analysis of individual nanoparticles that the simultaneous chemical reduction of Au and Pd in the aforementioned AuxPdy ratio produced random homogeneous Au–Pd alloys with a face-centred cubic (fcc) structure and with the smallest nanoparticles to be Au-rich, whereas the largest ones to be Pd-rich [54]. Moreover, in previous studies, a decrease of Pd or Au/Pd mean particle size has shown a positive catalytic influence for the effective decomposition of formic acid [55,56,57,58].
Regarding XPS analyses, Au(4f) and Au(4d) + Pd(3d) spectra are shown in Figure 7 and Figure 8. The peaks at 83–84 eV and 87 eV associated with Au4f7/2 and Au4f5/2 respectively are related to Au foil. The shifts observed in the binding energy of the peaks have been previously studied [59]. Table S3 presents the binding energy shifts when forming the alloy. As demonstrated by Radnik et al. [47], the relative binding energy of Au4f7/2 shifts at 83.4 eV, thus we concluded that the gold in the as synthesised catalysts is in the metallic state. In the bimetallic catalysts, there is an overlap of the peak Au4d5/2 with the Pd3d5/2 peak, therefore, only Pd3d3/2 will be used to analyse the binding energy shifts [60,61,62]. As previously presented, XPS gives information about the net electron transfer during bimetallic alloying however, caution has to be taken due to the complicated combination of initial and final state effects [63]. Observing Pauling electronegativities of gold (2.54) and palladium (2.20), it suggests that there may be a slight electron transfer from palladium to gold. Regarding previous studies [60,64,65], the binding energy of both Pd and Au tends to decrease when forming the alloy. Furthermore, particle size can have an effect as well on the binding energy of metals [66]. As observed in Figure 7, for Au, the peaks associated with Au4f7/2 shift to lower energy (83.4 eV for Au monometallic, and between 83.1 and 83.3 eV for the alloys), in agreement to previous studies. Moreover, we can explain this shift considering the particle size variation. For pure gold, mean particle size is 4 nm, while, for the alloys, it decreases to a range between 3 and 3.4 nm. Whilst this is a small decrease in particle size, the electronic structure of the atoms can be modified to a large extent. The same explanation applies to Pd (Pd3d3/2 core level). Observing the data presented in Table 3 and the binding energy shifts reported in Table S3 and Figure 8, there is a shift to lower binding energies as expected when forming the alloy (it decreases from 340.46 eV for monometallic Pd, to approximately 340.3 eV) and in agreement with previous reports [65], but in the case of Au:Pd 3:1, binding energy shifts to a higher value (340.47 eV), again explained with the decrease of mean particle size to 3 nm for this catalyst. We could conclude that the Pd3d3/2 and the Au4f7/2 core levels shift to lower binding energies upon alloying and results were in good agreement with the core level shifts of Au4f7/2 and Pd3d3/2 reported in the literature.
Regarding the oxidation state of Pd, a volcano plot was observed when modifying Au content. Pd0 species slightly increased until the ratio Pd/Au was 1 and decreased for higher Au content. Representative PdII/Pd0 atomic ratio calculated from XPS spectra for the catalysts is shown in Table 3. The surface area of the support (63 m2/g) decreased approximately 20% when supporting the catalyst either due to the coverage of PVA or the intrinsic error of the system.
The catalytic performance of the AuxPdy-TiO2 catalysts for the formic acid decomposition at 50 °C is presented in Figure 9. As observed, Au presents very low activity towards the decomposition of formic acid. On the other hand, a small amount of Pd with Au (Au3Pd1-TiO2) produced a synergistic effect exhibiting a high catalytic activity with a TOF of 627 h−1 at 50 °C after 5 min. The observed catalytic behaviour has been extensively studied before and reported [67,68]. The narrow particle size distribution of the supported preformed colloidal Au–Pd nanoparticles could be one of the most plausible reasons for this increment in activity.

4. Conclusions

A series of preformed Pd colloidal nanoparticles were synthesised by varying the amount of stabiliser (PVA/Pd weight ratio) and supported on activated charcoal to study the effect of stabiliser in terms of influencing the final morphology of the supported nanoparticle (Pd particle size, particle size distribution, Pd oxidation state and surface exposure of Pd). Moreover, the influence of Pd nominal loading and the choice of support were investigated. In the case of activated charcoal, the general trend for the mean Pd particle size with the variation of PVA amount was that by increasing the PVA/Pd weight ratio a progressive decrease in the mean Pd particle size was observed and above the PVA/Pd weight ratio of 0.65 a plateau was reached. In terms of Pd loading the mean Pd particle size was in a similar range 3.9–4.8 nm and did not appreciably alter at lower Pd loading. In the case of TiO2 and using the optimised experimental conditions a similar particle size was observed with a higher percentage of metallic Pd species than the analogous Pd/AC sample. The catalytic performance of the synthesised catalysts was evaluated for the formic acid decomposition as a model reaction for the production of hydrogen under mild conditions.
In terms of catalytic activity, a volcano type diagram was found when Pd/PVA ratio was altered. TEM and XPS analysis showed that the observed catalytic activity could be attributed to (i) the surface Pd exposure, (ii) Pd sites accessibility (coverage of the active sites) and (iii) mean Pd particle size. The effect of the Pd loading was investigated from 0.2 to 1.2 wt %, showing the highest activity for the catalysts with 1 wt % Pd loading. The major cause for the observed trend in terms of catalysis was attributed to the atomic content of Pd on the surface.
In the case of the nature of support (activated charcoal versus TiO2), activated charcoal-supported Pd nanoparticles showed higher catalytic performance. This difference was attributed to (i) the higher surface percentage of metallic Pd for the Pd nanoparticles supported on activated charcoal and (ii) to the shape of the supported Pd nanoparticles: on activated charcoal Pd nanoparticles were spherical whereas hemispherical Pd nanoparticles were observed on titania, therefore decreasing the accessible active surface area exposed and subsequently, the observed catalytic activity. Reusability tests were performed for the most active monometallic Pd catalyst (Pd/PVA = 0.3 weight ratio) showing a loss of 31% of its initial activity after five uses, probably caused by the growth of Pd nanoparticles.

Supplementary Materials

The following are available online at https://www.mdpi.com/2076-3417/10/5/1752/s1, Figure S1: Bright field TEM micrographs and corresponding histograms of the particle size distributions of the catalysts. Unless stated, NaBH4/Pd = 5. (A): Pd/AC-a (PVA/Pd = 0), (B): Pd/AC-b (PVA/Pd = 0.05), (C): Pd/AC-c (PVA/Pd = 0.1), (D): Pd/AC-d (PVA/Pd = 0.2), (E): Pd/AC-e (PVA/Pd = 0.3), (F): Pd/AC-f (PVA/Pd = 0.65), (G): Pd/AC-g (PVA/Pd = 1.2), (H): Pd/AC-h (PVA/Pd = 0.65, NaBH4/Pd = 10), (I): Pd/TiO2-f (PVA/Pd = 0.65) and (J): Pd/TiO2-h (PVA/Pd = 0.65, NaBH4/Pd = 10), Figure S2: Representative XPS survey of Pd/AC-e (PVA/Pd = 0.3) and quantification of the elements present on the surface. Figure S3: Bright field TEM micrographs and corresponding histograms of the particle size distributions of the Pd/AC catalysts as a function of Pd loading. (A): 0.2 wt % Pd/AC-e, (B): 0.5 wt % Pd/AC-e, (C): 0.7 wt % Pd/AC-e and (D): 1.2 wt % Pd/AC-e, Figure S4: EDX mapping of Pd/AC catalysts as a function of Pd loading. (A): loading 0.2 wt %, (B): loading 0.7 wt %, (C): loading 1 wt %, (D): loading 1.2 wt %, Figure S5: Bright field TEM micrograph and histogram of the particle size distribution of the Pd/AC-e after 5 cycles of use, Figure S6: SEM-EDX mapping. (1) Pd-TiO2, (2a) Pd in Au1Pd3-TiO2, (2b) Au in Au1Pd3-TiO2, (3a) Pd in Au1Pd1-TiO2, (3b) Au in Au1Pd1-TiO2, (4a) Pd in Au3Pd1-TiO2, (4b) Au in Au3Pd1-TiO2, (5) Au-TiO2, Table S1: Palladium atomic content and % Pd0 on the surface from XPS, Table S2: Pd elemental chemical composition and surface area analysis of the catalysts studied during optimisation of the sol-immobilisation method, Table S3: Binding energy and binding energy shifts of the monometallic-bimetallic studies.

Author Contributions

F.S. and L.B. synthesized the catalysts and carried out catalytic evaluation. F.S., L.B., and D.M. carried out XPS, SEM, BET, and TEM analysis and helped with the interpretation. N.D., S.A. and A.V. designed the experiments and were involved in the writing and editing of the manuscript. All authors have read and agreed to the published version of the manuscript.

Funding

This research received no external funding.

Acknowledgments

The authors would like to express gratitude for the financial support, ESPRC (research council). FS would like to thank Cardiff University for the PhD scholarship. LB would like to thank the Erasmus Programme Agreement for her visit at Cardiff University (Bologna-Cardiff Erasmus agreement). DM wishes to thank THE Catalysis CDT scheme (EPSRC) for providing the PhD scholarship.

Conflicts of Interest

The authors declare no conflict of interest.

References

  1. Park, S.; Vohs, J.M.; Gorte, R.J. Direct oxidation of hydrocarbons in a solid-oxide fuel cell. Nature 2000, 404, 265–267. [Google Scholar] [CrossRef]
  2. Jiang, H.L.; Singh, S.K.; Yan, J.M.; Zhang, X.B.; Xu, Q. Liquid-Phase chemical hydrogen storage: Catalytic hydrogen generation under ambient conditions. ChemSusChem 2010, 3, 541–549. [Google Scholar] [CrossRef] [PubMed]
  3. Grasemann, M.; Laurenczy, G. Formic acid as a hydrogen source – recent developments and future trends. Energy Environ. Sci. 2012, 5, 8171–8181. [Google Scholar] [CrossRef]
  4. Yang, Z.; Xia, Y.; Mokaya, R. Enhanced hydrogen storage capacity of high surface area zeolite-like carbon materials. J. Am. Chem. Soc. 2007, 129, 1673–1679. [Google Scholar] [CrossRef]
  5. Dai, H.; Xia, B.; Wen, L.; Du, C.; Su, J.; Luo, W.; Cheng, G. Synergistic catalysis of AgPd@ZIF-8 on dehydrogenation of formic acid. Appl. Catal. B Environ. 2015, 165, 57–62. [Google Scholar] [CrossRef]
  6. Bae, D.; Park, H.; Kim, J.S.; Lee, J.; Kwon, O.Y.; Kim, K.Y.; Song, M.K.; No, K.T. Hydrogen adsorption in organic ion-exchanged zeolites. J. Phys. Chem. Solids 2008, 69, 1152–1154. [Google Scholar] [CrossRef]
  7. Rodríguez-Lugo, R.E.; Trincado, M.; Vogt, M.; Tewes, F.; Santiso-Quinones, G.; Grützmacher, H. A homogeneous transition metal complex for clean hydrogen production from methanol–water mixtures. Nat. Chem. 2013, 5, 342–347. [Google Scholar] [CrossRef] [PubMed]
  8. Zheng, M.; Cheng, R.; Chen, X.; Li, N.; Li, L.; Wang, X.; Zhang, T. A novel approach for CO-free H2 production via catalytic decomposition of hydrazine. Int. J. Hydrog. Energy 2005, 30, 1081–1089. [Google Scholar] [CrossRef]
  9. Klerke, A.; Christensen, C.H.; Nørskov, J.K.; Vegge, T. Ammonia for hydrogen storage: Challenges and opportunities. J. Mater. Chem. 2008, 18, 2304–2310. [Google Scholar] [CrossRef]
  10. Sanchez, F.; Motta, D.; Roldan, A.; Hammond, C.; Villa, A.; Dimitratos, N. Hydrogen Generation from Additive-Free Formic Acid Decomposition Under Mild Conditions by Pd/C: Experimental and DFT Studies. Top. Catal. 2018, 61, 254–266. [Google Scholar] [CrossRef] [Green Version]
  11. Sánchez, F.; Motta, D.; Dimitratos, N. Catalytic decomposition of carbon-based liquid-phase chemical hydrogen storage materials for hydrogen generation under mild conditions. Appl. Petrochem. Res. 2016, 6, 1–9. [Google Scholar] [CrossRef] [Green Version]
  12. Metin, Ö.; Sun, X.; Sun, S. Monodisperse gold-palladium alloy nanoparticles and their composition-controlled catalysis in formic acid dehydrogenation under mild conditions. Nanoscale 2013, 5, 910–912. [Google Scholar] [CrossRef] [PubMed] [Green Version]
  13. Mori, K.; Dojo, M.; Yamashita, H. Pd and Pd−Ag Nanoparticles within a Macroreticular Basic Resin: An Efficient Catalyst for Hydrogen Production from Formic Acid Decomposition. ACS Catal. 2013, 3, 1114–1119. [Google Scholar] [CrossRef]
  14. Sponholz, P.; Mellmann, D.; Junge, H.; Beller, M. Towards a practical setup for hydrogen production from formic acid. ChemSusChem 2013, 6, 1172–1176. [Google Scholar] [CrossRef]
  15. Dai, H.; Cao, N.; Yang, L.; Su, J.; Luo, W.; Cheng, G. AgPd nanoparticles supported on MIL-101 as high performance catalysts for catalytic dehydrogenation of formic acid. J. Mater. Chem. A 2014, 2, 11060–11064. [Google Scholar] [CrossRef]
  16. Gao, S.-T.; Liu, W.; Feng, C.; Shang, N.-Z.; Wang, C. A Ag–Pd alloy supported on an amine-functionalized UiO-66 as an efficient synergetic catalyst for the dehydrogenation of formic acid at room temperature. Catal. Sci. Technol. 2016, 6, 869–874. [Google Scholar] [CrossRef]
  17. Song, F.Z.; Zhu, Q.L.; Tsumori, N.; Xu, Q. Diamine-Alkalized Reduced Graphene Oxide: Immobilization of Sub-2 nm Palladium Nanoparticles and Optimization of Catalytic Activity for Dehydrogenation of Formic Acid. ACS Catal. 2015, 5, 5141–5144. [Google Scholar] [CrossRef]
  18. Tedsree, K.; Li, T.; Jones, S.; Chan, C.W.A.; Yu, K.M.K.; Bagot, P.A.J.; Marquis, E.A.; Smith, G.D.W.; Tsang, S.C.E. Hydrogen production from formic acid decomposition at room temperature using a Ag-Pd core-shell nanocatalyst. Nat. Nanotechnol. 2011, 6, 302–307. [Google Scholar] [CrossRef]
  19. Ojeda, M.; Iglesia, E. Formic acid dehydrogenation on Au-based catalysts at near-ambient temperatures. Ang. Chem. Int. Ed. 2009, 48, 4800–4803. [Google Scholar] [CrossRef] [Green Version]
  20. Zhou, X.; Huang, Y.; Xing, W.; Liu, C.; Liao, J.; Lu, T. High-quality hydrogen from the catalyzed decomposition of formic acid by Pd-Au/C and Pd-Ag/C. Chem. Commun. 2008, 44, 3540–3542. [Google Scholar] [CrossRef]
  21. Yang, L.; Hua, X.; Su, J.; Luo, W.; Chen, S.; Cheng, G. Highly efficient hydrogen generation from formic acid-sodium formate over monodisperse AgPd nanoparticles at room temperature. Appl. Catal. B Environ. 2015, 168–169, 423–428. [Google Scholar] [CrossRef]
  22. Lv, Q.; Feng, L.; Hu, C.; Liu, C.; Xing, W. High-quality hydrogen generated from formic acid triggered by in situ prepared Pd/C catalyst for fuel cells. Catal. Sci. Technol. 2015, 5, 2581–2584. [Google Scholar] [CrossRef]
  23. Wang, X.; Qi, G.W.; Tan, C.H.; Li, Y.P.; Guo, J.; Pang, X.J.; Zhang, S.Y. Pd/C nanocatalyst with high turnover frequency for hydrogen generation from the formic acid-formate mixtures. Int. J. Hydrog. Energy 2014, 39, 837–843. [Google Scholar] [CrossRef]
  24. Hu, C.; Pulleri, J.K.; Ting, S.W.; Chan, K.Y. Activity of Pd/C for hydrogen generation in aqueous formic acid solution. Int. J. Hydrog. Energy 2014, 39, 381–390. [Google Scholar] [CrossRef]
  25. Navlani-García, M.; Martis, M.; Lozano-Castelló, D.; Cazorla-Amorós, D.; Mori, K.; Yamashita, H. Investigation of Pd nanoparticles supported on zeolites for hydrogen production from formic acid dehydrogenation. Catal. Sci. Technol. 2015, 5, 364–371. [Google Scholar] [CrossRef] [Green Version]
  26. Bi, Q.Y.; Du, X.L.; Liu, Y.M.; Cao, Y.; He, H.Y.; Fan, K.N. Efficient subnanometric gold-catalyzed hydrogen generation via formic acid decomposition under ambient conditions. J. Am. Chem. Soc. 2012, 134, 8926–8933. [Google Scholar] [CrossRef] [PubMed]
  27. Villa, A.; Wang, D.; Su, D.S.; Prati, L. Gold sols as catalysts for glycerol oxidation: The role of stabilizer. ChemCatChem 2009, 1, 510–514. [Google Scholar] [CrossRef]
  28. Jia, C.-J.; Schüth, F. Colloidal metal nanoparticles as a component of designed catalyst. Phys. Chem. Chem. Phys. 2011, 13, 2457–2487. [Google Scholar] [CrossRef]
  29. Prati, L.; Villa, A. Gold colloids: From quasi-homogeneous to heterogeneous catalytic systems. Acc. Chem. Res. 2014, 47, 855–863. [Google Scholar] [CrossRef]
  30. Daniel, M.C.M.; Astruc, D. Gold Nanoparticles: Assembly, Supramolecular Chemistry, Quantum-Size Related Properties and Applications toward Biology, Catalysis and Nanotechnology. Chem. Rev. 2004, 104, 293–346. [Google Scholar] [CrossRef]
  31. Lopez-Sanchez, J.A.; Dimitratos, N.; Hammond, C.; Brett, G.L.; Kesavan, L.; White, S.; Miedziak, P.; Tiruvalam, R.; Jenkins, R.L.; Carley, A.F.; et al. Facile removal of stabilizer-ligands from supported gold nanoparticles. Nat. Chem. 2011, 3, 551–556. [Google Scholar] [CrossRef]
  32. García-Aguilar, J.; Navlani-García, M.; Berenguer-Murcia, Á.; Mori, K.; Kuwahara, Y.; Yamashita, H.; Cazorla-Amoros, D. Evolution of the PVP-Pd surface interaction in nanoparticles through the case study of formic acid decomposition. Langmuir 2016, 32, 12110–12118. [Google Scholar] [CrossRef]
  33. Zhao, Y.; Jia, L.; Medrano, J.A.; Ross, J.R.H.; Lefferts, L. Supported Pd Catalysts Prepared via Colloidal Method: The Effect of Acids. ACS Catal. 2013, 3, 2341–2352. [Google Scholar] [CrossRef]
  34. Agarwal, N.; Freakley, S.J.; Mcvicker, R.U.; Althahban, S.M.; Dimitratos, N.; He, Q.; Morgan, D.J.; Jenkins, R.L.; Willock, D.J.; Taylor, S.H.; et al. Aqueous Au-Pd colloids catalyze selective CH4 oxidation to CH3OH with O2 under mild conditions. Science 2017, 358, 223–227. [Google Scholar] [CrossRef] [PubMed] [Green Version]
  35. Cambisi, S.; Schiavoni, M.; Chan-Thaw, C.E.; Villa, A. Untangling the Role of the Capping Agent in Nanocatalysis: Recent Advances and Perspectives. Catalysts 2016, 6, 185. [Google Scholar] [CrossRef] [Green Version]
  36. Dimitratos, N.; Villa, A.; Prati, L.; Hammond, C.; Chan-Thaw, C.E.; Cookson, J.; Bishop, P.T. Effect of the preparation method of supported Au nanoparticles in the liquid phase oxidation of glycerol. Appl. Catal. A Gen. 2016, 514, 267–275. [Google Scholar] [CrossRef]
  37. Rogers, S.M.; Catlow, C.R.A.; Chan-Thaw, C.E.; Gianolio, D.; Gibson, E.K.; Gould, A.L.; Jian, N.; Logsdail, A.J.; Palmer, R.E.; Prati, L.; et al. Tailoring Gold Nanoparticle Characteristics and the Impact on Aqueous-Phase Oxidation of Glycerol. ACS Catal. 2015, 5, 4377–4384. [Google Scholar] [CrossRef]
  38. Rogers, S.M.; Catlow, C.R.A.; Chan-Thaw, C.E.; Chutia, A.; Jian, N.; Palmer, R.E.; Perdjon, M.; Thetford, A.; Dimitratos, N.; Villa, A.; et al. Tandem Site- and Size-Controlled Pd Nanoparticles for the Directed Hydrogenation of Furfural. ACS Catal. 2017, 7, 2266–2274. [Google Scholar] [CrossRef]
  39. Lopez-sanchez, J.A.; Dimitratos, N.; Glanville, N.; Kesavan, L.; Hammond, C.; Edwards, J.K.; Carley, A.F.; Kiely, C.J.; Hutchings, G.J. Reactivity studies of Au–Pd supported nanoparticles for catalytic applications. Appl. Catal. A Gen. 2011, 391, 400–406. [Google Scholar] [CrossRef]
  40. Lopez-sanchez, J.A.; Dimitratos, N.; Miedziak, P.; Ntainjua, E.; Edwards, J.K.; Morgan, D.; Carley, A.F.; Tiruvalam, R.; Kiely, C.J.; Hutchings, G.J. Au–Pd supported nanocrystals prepared by a sol immobilisation technique as catalysts for selective chemical synthesis. Phys. Chem. Chem. Phys. 2008, 10, 1921–1930. [Google Scholar] [CrossRef]
  41. Villa, A.; Wang, D.P.; Veith, G.M.; Vindigni, F.; Prati, L. Sol immobilization technique: A delicate balance between activity, selectivity and stability of gold catalysts. Catal. Sci. Technol. 2013, 3, 3036–3041. [Google Scholar] [CrossRef] [Green Version]
  42. Militello, M.C.; Simko, S.J. Elemental Palladium by XPS. Surf. Sci. Spectra 1994, 3, 387–394. [Google Scholar] [CrossRef]
  43. Militello, M.C.; Simko, S.J. Palladium Oxide (PdO) by XPS. Surf. Sci. Spectra 1994, 3, 395–401. [Google Scholar] [CrossRef]
  44. Bianchi, C.; Porta, F.; Prati, L.; Rossi, M. Selective liquid phase oxidation using gold catalysts. Top. Catal. 2000, 13, 231–236. [Google Scholar] [CrossRef]
  45. Porta, F.; Prati, L. Selective oxidation of glycerol to sodium glycerate with gold-on-carbon catalyst: An insight into reaction selectivity. J. Catal. 2004, 224, 397–403. [Google Scholar] [CrossRef]
  46. Zhou, W.P.; Lewera, A.; Larsen, R.; Masel, R.I.; Bagus, P.S.; Wieckowski, A. Size Effects in Electronic and Catalytic Properties of Unsupported Palladium Nanoparticles in Electrooxidation of Formic Acid. J. Phys. Chem. B 2006, 110, 13393–13398. [Google Scholar] [CrossRef]
  47. Radnik, J.; Mohr, C.; Claus, P. On the origin of binding energy shifts of core levels of supported gold nanoparticles and dependence of pretreatment and material synthesis. Phys. Chem. Chem. Phys. 2003, 5, 172–177. [Google Scholar] [CrossRef]
  48. Wojcieszak, R.; Genet, M.J.; Eloy, P.; Ruiz, P.; Gaigneaux, E.M. Determination of the Size of Supported Pd Nanoparticles by X-ray Photoelectron Spectroscopy. Comparison with X-ray Diffraction, Transmission Electron Microscopy, and H2 Chemisorption Methods. J. Phys. Chem. C 2010, 114, 16677–16684. [Google Scholar] [CrossRef]
  49. Smirnov, M.Y.; Kalinkin, A.V.; Bukhtiyarov, A.V.; Prosvirin, I.P.; Bukhtiyarov, V.I. Using X-ray Photoelectron Spectroscopy to Evaluate Size of Metal Nanoparticles in the Model Au/C Samples. J. Phys. Chem. C 2016, 120, 10419–10426. [Google Scholar] [CrossRef]
  50. Parker, S.F.; Walker, H.C.; Callear, S.K.; Grünewald, E.; Petzold, T.; Wolf, D.; Möbus, K.; Adam, J.; Wieland, S.D.; Jiménez-Ruizc, M.; et al. The effect of particle size, morphology and support on the formation of palladium hydride in commercial catalysts. Chem. Sci. 2019, 10, 480–489. [Google Scholar] [CrossRef] [Green Version]
  51. Mason, M.G. Electronic structure of supported small metal clusters. Phys. Rev. B 1983, 27, 748–762. [Google Scholar] [CrossRef]
  52. Nolte, P.; Stierle, A.; Kasper, N.; Jin-Phillipp, N.Y.; Reichert, H.; Rühm, A.; Okasinski, J.; Dosch, H. Combinatorial high-energy x-ray microbeam study of the size-dependent oxidation of Pd nanoparticles on MgO(100). Phys. Rev. B 2008, 77, 115444–115451. [Google Scholar] [CrossRef]
  53. Dimitratos, N.; Lopez-Sanchez, J.A.; Morgan, D.; Carley, A.F.; Tiruvalam, R.; Kiely, C.J.; Bethell, D.; Hutchings, G.J. Solvent-free oxidation of benzyl alcohol using Au-Pd catalysts prepared by sol immobilisation. Phys. Chem. Chem. Phys. 2009, 11, 5142–5153. [Google Scholar] [CrossRef] [PubMed]
  54. Pritchard, J.; Kesavan, L.; Piccinini, M.; He, Q.; Tiruvalam, R.; Dimitratos, N.; Lopez-Sanchez, J.A.; Carley, A.F.; Edwards, J.K.; Kiely, C.J.; et al. Direct synthesis of hydrogen peroxide and benzyl alcohol oxidation using Au-Pd catalysts prepared by sol immobilization. Langmuir 2010, 26, 16568–16577. [Google Scholar] [CrossRef]
  55. Songju, L.I.; Xin, Z.; Weiquan, T. Theoretical mechanism investigations on the HCOOH catalyzed by Pd cluster. J. Phys. Chem. A 2012, 116, 11745–11752. [Google Scholar]
  56. Wang, N.; Sun, Q.; Bai, R.; Li, X.; Guo, G.; Yu, J. In Situ Confinement of Ultrasmall Pd Clusters within Nanosized Silicalite-1 Zeolite for Highly Efficient Catalysis of Hydrogen Generation. J. Am. Chem. Soc. 2016, 138, 7484–7487. [Google Scholar] [CrossRef]
  57. Liu, D.; Gao, Z.Y.; Wang, X.C.; Zeng, J.; Li, Y.M. DFT study of hydrogen production from formic acid decomposition on Pd-Au alloy nanoclusters. Appl. Surf. Sci. 2017, 426, 194–205. [Google Scholar] [CrossRef]
  58. Bulushev, D.A.; Bulusheva, L.G.; Beloshapkin, S.; O’Connor, T.; Okotrub, A.V.; Ryan, K.M. Pd clusters supported on amorphous, low-porosity carbon spheres for hydrogen production from formic acid. ACS Appl. Mater. Interfaces 2015, 7, 8719–8726. [Google Scholar] [CrossRef]
  59. Villa, A.; Dimitratos, N.; Chan-Thaw, C.E.; Hammond, C.; Veith, G.M.; Wang, D.; Manzoli, M.; Prati, L.; Hutchings, G.J. Characterisation of gold catalysts. Chem. Soc. Rev. 2016, 45, 4953–4994. [Google Scholar] [CrossRef] [Green Version]
  60. Lee, Y.; Jeon, Y. Charge redistribution and electronic behavior in Pd-Au alloys. J. Korean Phys. Soc. 2000, 37, 451–455. [Google Scholar]
  61. Griffin, M.B.; Rodriguez, A.A.; Montemore, M.M.; Monnier, J.R.; Williams, C.T.; Medlin, J.W. The selective oxidation of ethylene glycol and 1,2-propanediol on Au, Pd, and Au-Pd bimetallic catalysts. J. Catal. 2013, 307, 111–120. [Google Scholar] [CrossRef]
  62. Nutt, M.O.; Heck, K.N.; Alvarez, P.; Wong, M.S. Improved Pd-on-Au bimetallic nanoparticle catalysts for aqueous-phase trichloroethene hydrodechlorination. Appl. Catal. B Environ. 2006, 69, 115–125. [Google Scholar] [CrossRef]
  63. Egelhoff, W.F. Core-level binding-energy shifts at surfaces and in solids. Surf. Sci. Rep. 1987, 6, 253–415. [Google Scholar] [CrossRef]
  64. Li, Z.; Gao, F.; Wang, Y.; Calaza, F.; Burkholder, L.; Tysoe, W.T. Formation and characterization of Au/Pd surface alloys on Pd(1 1 1). Surf. Sci. 2007, 601, 1898–1908. [Google Scholar] [CrossRef]
  65. Yi, C.W.; Luo, K.; Wei, T.; Goodman, D.W. The composition and structure of Pd -Au surfaces. J. Phys. Chem. B 2005, 109, 18535–18540. [Google Scholar] [CrossRef] [PubMed]
  66. Aruna, I.; Mehta, B.R.; Malhotra, L.K.; Shivaprasad, S.M. Size dependence of core and valence binding energies in Pd nanoparticles: Interplay of quantum confinement and coordination reduction. J. Appl. Phys. 2008, 104, 064308–064313. [Google Scholar] [CrossRef] [Green Version]
  67. Gu, X.; Lu, Z.; Jiang, H.; Akita, T.; Xu, Q. Synergistic Catalysis of Metal-Organic Framework-Immobilized Au-Pd nanoparticles in dehydrogenation of formic acid for chemical hydrogen storage. J. Am. Chem. Soc. 2011, 133, 11822–11825. [Google Scholar] [CrossRef]
  68. Chen, M.S.; Luo, K.; Wei, T.; Yan, Z.; Kumar, D.; Yi, C.W.; Goodman, D.W. The nature of the active site for vinyl acetate synthesis over Pd–Au. Catal. Today 2006, 117, 37–45. [Google Scholar] [CrossRef]
Figure 1. XPS spectra of (A): Pd/AC-f and Pd/AC-h and (B): Pd/TiO2-f and Pd/TiO2-h.
Applsci 10 01752 g001
Figure 2. Formic acid dehydrogenation reaction. Effect of the stabiliser. Reaction conditions: 0.5 M HCOOH, substrate/metal molar ratio: 2000:1, 50 °C, 750 rpm, 4 h reaction time.
Applsci 10 01752 g002
Figure 3. Effect of Pd sol preparation on the catalytic performance and on the Pd content on the surface obtained by XPS analysis.
Applsci 10 01752 g003
Figure 4. Effect of Pd sol preparation in the catalytic decomposition of formic acid as a function of the NaBH4/Pd molar ratio on AC and TiO2.
Applsci 10 01752 g004
Figure 5. Reusability of Pd/AC-e. Reaction conditions: substrate/metal molar ratio: 2000:1, 50 °C, 0.5 M HCOOH, 750 rpm.
Applsci 10 01752 g005
Figure 6. Bright field TEM micrographs and corresponding histograms of the particle size distributions of the catalysts. (A): Pd/TiO2, (B): Au1Pd3/TiO2 (C): Au1Pd1/TiO2 (D): Au3Pd1/TiO2 and (E): Au/TiO2.
Applsci 10 01752 g006aApplsci 10 01752 g006b
Figure 7. Au(4f) spectra for the series of AuxPdy-TiO2 catalyst.
Applsci 10 01752 g007
Figure 8. Au(4d) + Pd(3d) spectra for the series of AuxPdy-TiO2 catalysts.
Applsci 10 01752 g008
Figure 9. Conversion of formic acid after 4 h as a function of the Pd: Au molar ratio.
Applsci 10 01752 g009
Table 1. Palladium atomic content at the surface, % Pd0 and mean particle size.
CatalystPVA/Pd Weight RatioNaBH4/Pd Molar RatioAtomic % of Pd% Pd0Mean Particle Size (nm)
Calculated by XPSCalculated by TEM
Pd/AC-a052.362-
Pd/AC-b0.0553.1648.2 ± 3.0
Pd/AC-c0.153.8627.7 ± 2.7
Pd/AC-d0.255.3816.9 ± 2.2
Pd/AC-e0.358.2564.8 ± 2.0
Pd/AC-f0.6553.9573.0 ± 0.9
Pd/AC-g1.252.5533.1 ± 1.1
Pd/AC-h0.65104.3713.2 ± 0.9
Pd/TiO2-f0.6550.7435.0 ± 2.0
Pd/TiO2-h0.65101.0 b653.1 ± 0.9
Table 2. Structural and chemical composition of the catalysts studied during effect of loading investigation.
Loading Pd/CPd Loading (%) EDXMean Particle Size (nm)Surface Area (m2/g)% Pd0At. % PdTOF
(h −1)
0.2 wt %-Pd/AC-e0.203.9 ± 2.371551.9278
0.5 wt %-Pd/AC-e0.484.9 ± 1.360504.6272
0.7 wt %-Pd/AC-e0.684.9 ± 1.471504.8239
1 wt %-Pd/AC-e1.074.8 ± 2.050557.9366
1.2 wt %-Pd/AC-e1.253.8 ± 1.135446.9326
Table 3. Theoretical composition and characterisation data of the monometallic-bimetallic studies.
Sample% mol [Pd2+]% mol [Au3+]Loading
Pd
(wt %) from EDX
Loading Au
(wt %) from EDX
Mean
Particle Size (nm)
Surface Area (m2/g)%
Pd0
Pd-TiO2-i1-0.96-3.6 ± 1.95154
Au1Pd3-TiO20.750.250.800.133.2 ± 2.25156
Au1Pd1-TiO20.500.500.700.403.4 ± 1.14558
Au3Pd1-TiO20.250.750.300.703.0 ± 1.05056
Au-TiO2-1-1.004.0 ± 0.947-

