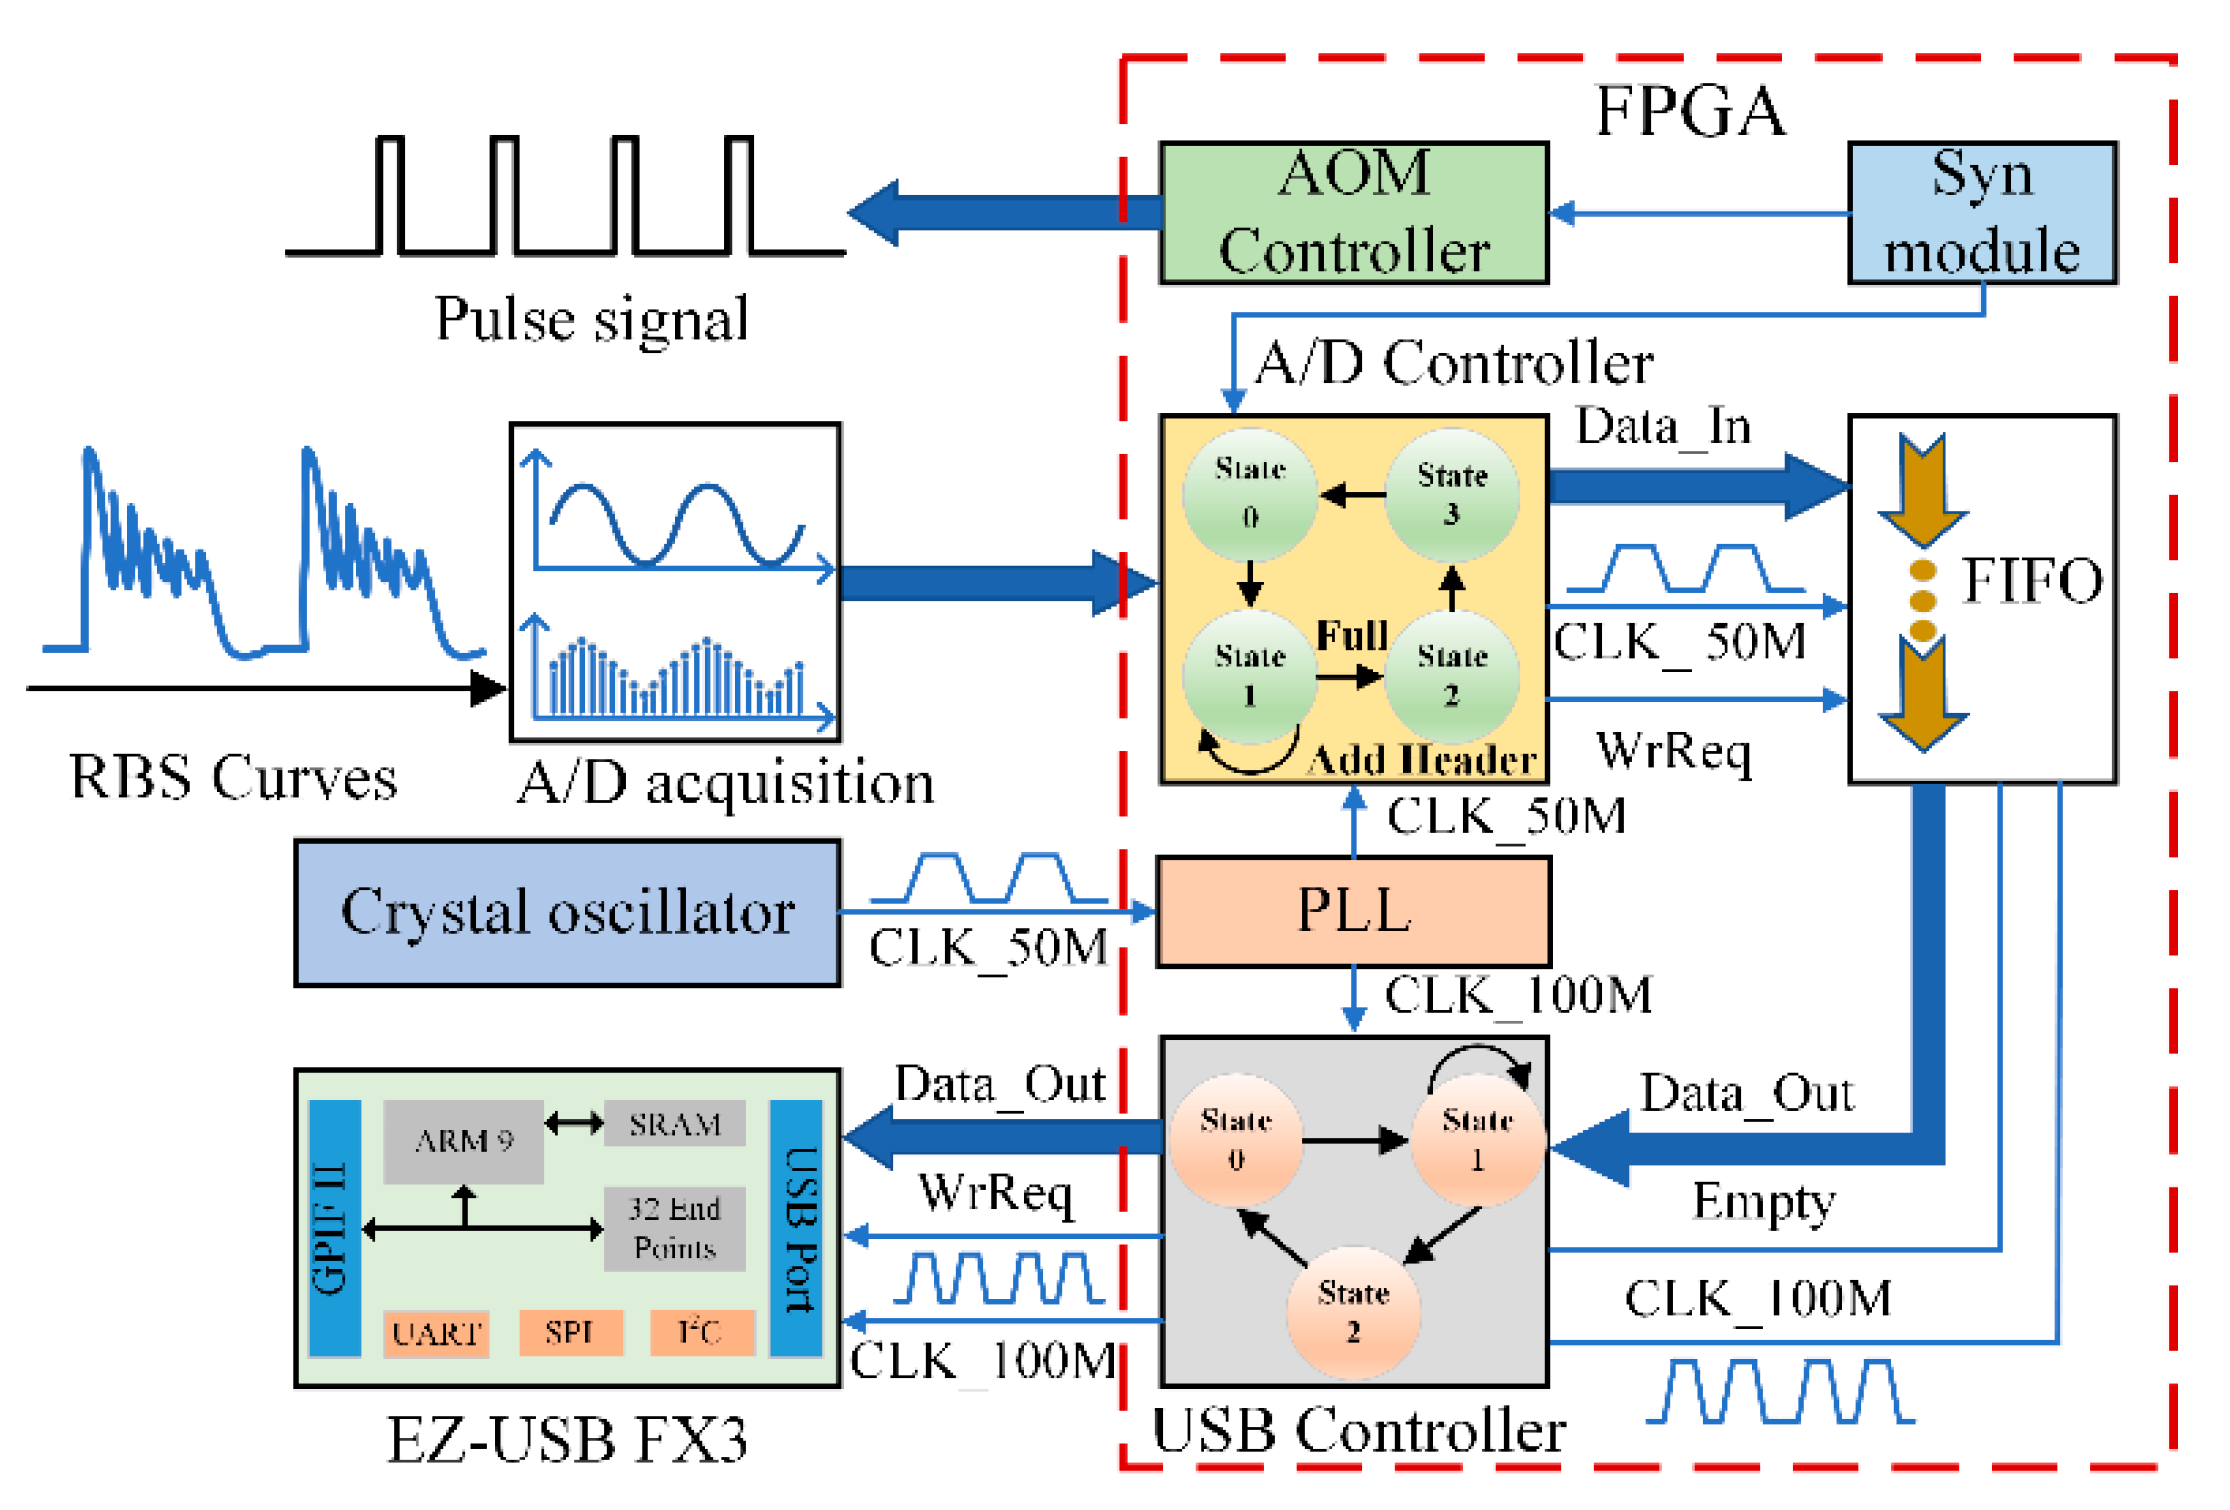
In our experiment, the external disturbance acting on the sensing optical fiber is simulated by a PZT phase modulator whose acting length is 1.5 m and driving voltage is 10 Vpp. The PZT phase modulator acts, at a position of 1000 m, as the single-point vibration source in sinusoidal form with a frequency of 100 Hz, while the total length of the optical fiber is 2020 m. Thus, the number of effective sampling points is reduced to 1010 for one RBS curve, and the data volume of each effective RBS curve is 1.01 kB. With the repetition frequency of optical pulses of 8 kHz, the total number of RBS curves is 8000 in 1 s, and the effective data volume is 8.08 MB during an acquisition time of 1 s. The data is then sent to the USB port of the upper computer via the USB 3.0 transmission bus at a speed of 100 MB/s, so the minimum data transmission time is about 80.8 ms. Moreover, in the interior of the upper computer, the USB port is connected with a south bridge USB I/O interface chip through the I/O bus, and the USB I/O interface chip is linked with a north bridge chipset via the Peripheral Component Interconnect (PCI) bus. The north bridge chipset is responsible for communication with the Dynamic Random Access Memory (DRAM), Cache and CPU through the memory bus and the front side bus. As a result, the data transmission time in the interior of the upper computer is hard to calculate accurately because of its complexity, but the data transmission time between the upper computer and lower computer could be considered as a fixed value if the experimental parameters do not change.
4.1. Differential Accumulation Algorithm
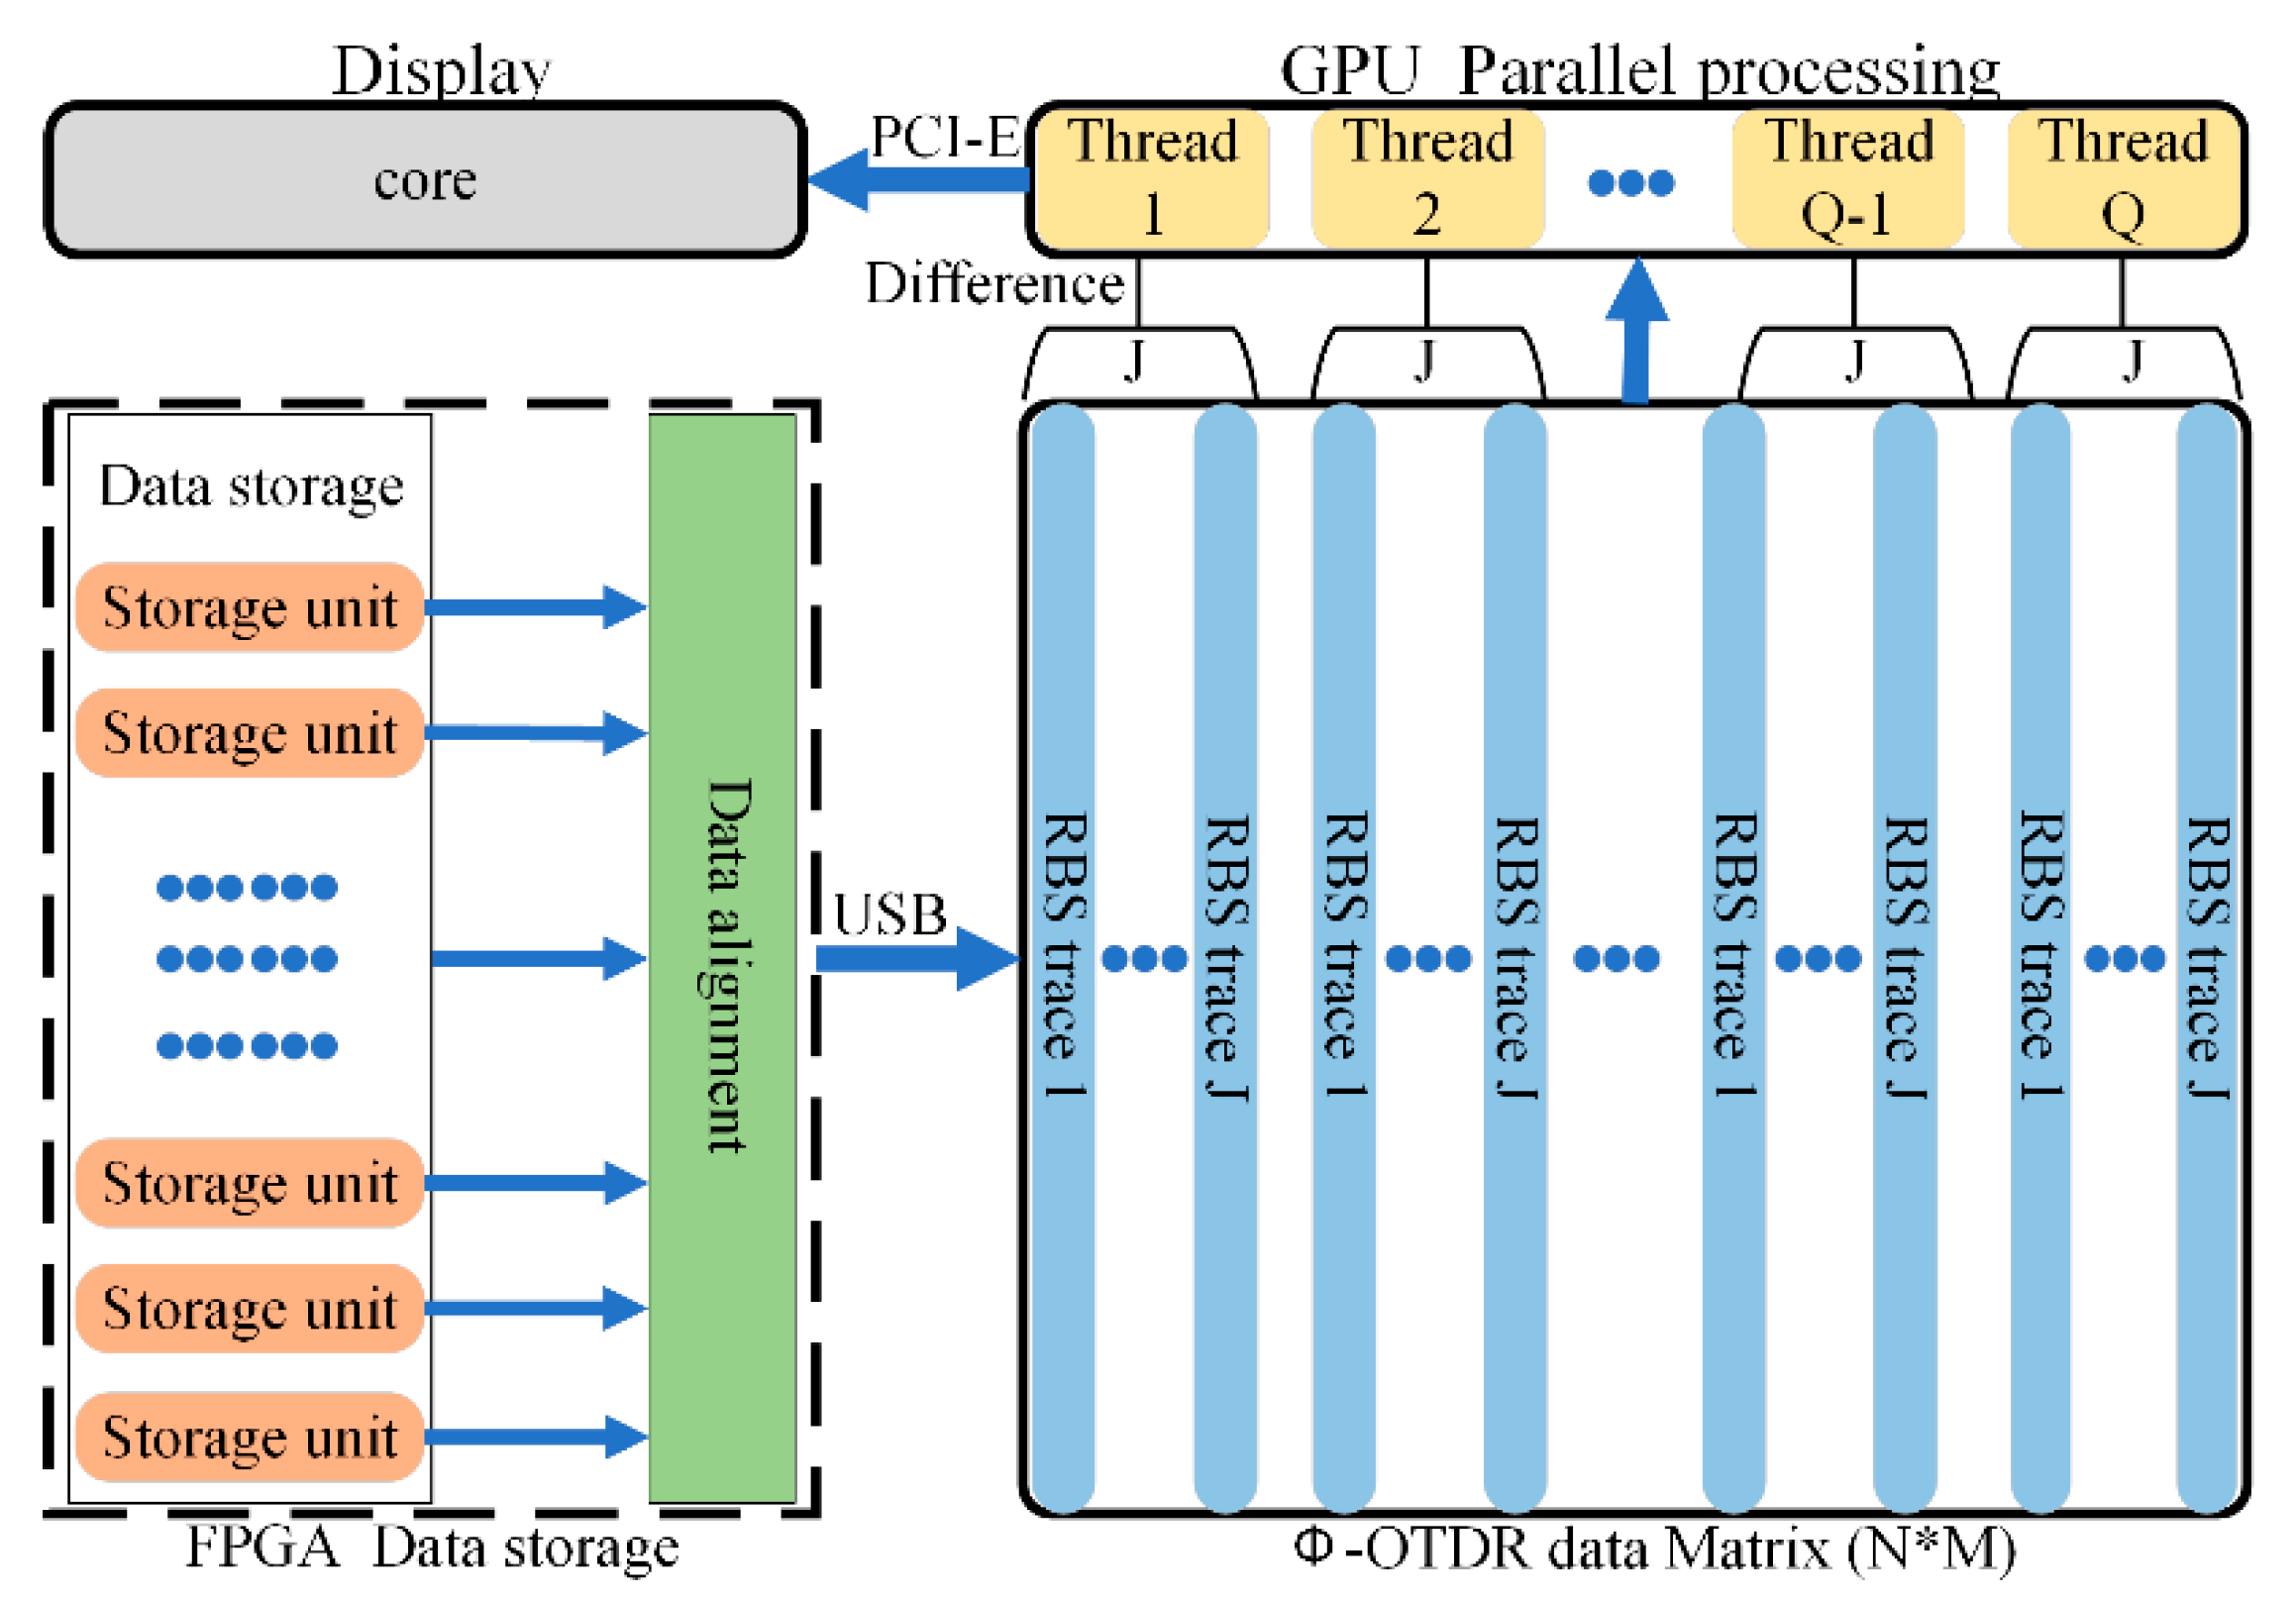
A differential accumulation algorithm is the conventional data processing method for a Φ-OTDR sensing system in order to realize the vibration location. It can remove the background noise and improve the signal-to-noise ratio (SNR). The cooperative data processing of differential accumulation algorithms with FPGA, CPU, and GPU is shown in
Figure 7. The collected data in the storage unit goes through data alignment by the FPGA, which adds the data header before each RBS data string, and is then sent to the host computer via the USB transmission bus.
The received data is stored as the N*M matrix in the RAM of the host computer, which can be read and modified by the CPU. More concretely, the data matrix has M RBS curves, and there are N points in each RBS trace. Then, the data should be transmitted to the GPU via the Peripheral Component Interconnect-Express (PCI-E) bus. The differential accumulation processing of RBS traces is executed in the form of multiple threads in the GPU. For a differential accumulation algorithm, this only involves the simple calculation, multiplication and division, addition and subtraction functions. Therefore, this algorithm complexity is O(1).
The algorithm with multiple threads is shown in equations as follows:
where the order number of curves is
j = 1, 2, 3, …,
J −
k,
J is the number of curves in a thread, and
k is the curve number between two subtractive curves. Then the order number of points in one curve is
n = 1, 2, 3, …,
N, and the length of each RBS curve is
N. Then, the order number of threads is marked as
threadi = 1, 2, 3, …,
Q, and the total number of threads is represented as
Q. Therefore,
Q multiplied by
J is
M.
Equation (3) means the subtraction of the RBS curves with an interval of k in one thread and the J − k curves could be thus obtained in one thread. Because of the function of parallel computing, each thread could execute the instruction of Equation (3) at the same time.
In Equation (4), the differential data in one thread is accumulated and averaged, and each thread performs this operation in parallel. Therefore, each thread generates an average curve which contains N points, and Q curves can be obtained in total. Then, these Q curves are accumulated and averaged again in one thread to obtain a final vibration positioning curve, which can be sent to the display unit controlled by the CPU.
Figure 8 demonstrates the positioning results of differential accumulation algorithm for 2000 RBS curves and the interval value of
k in Equations (3) and (4) is chosen as five in this experiment.
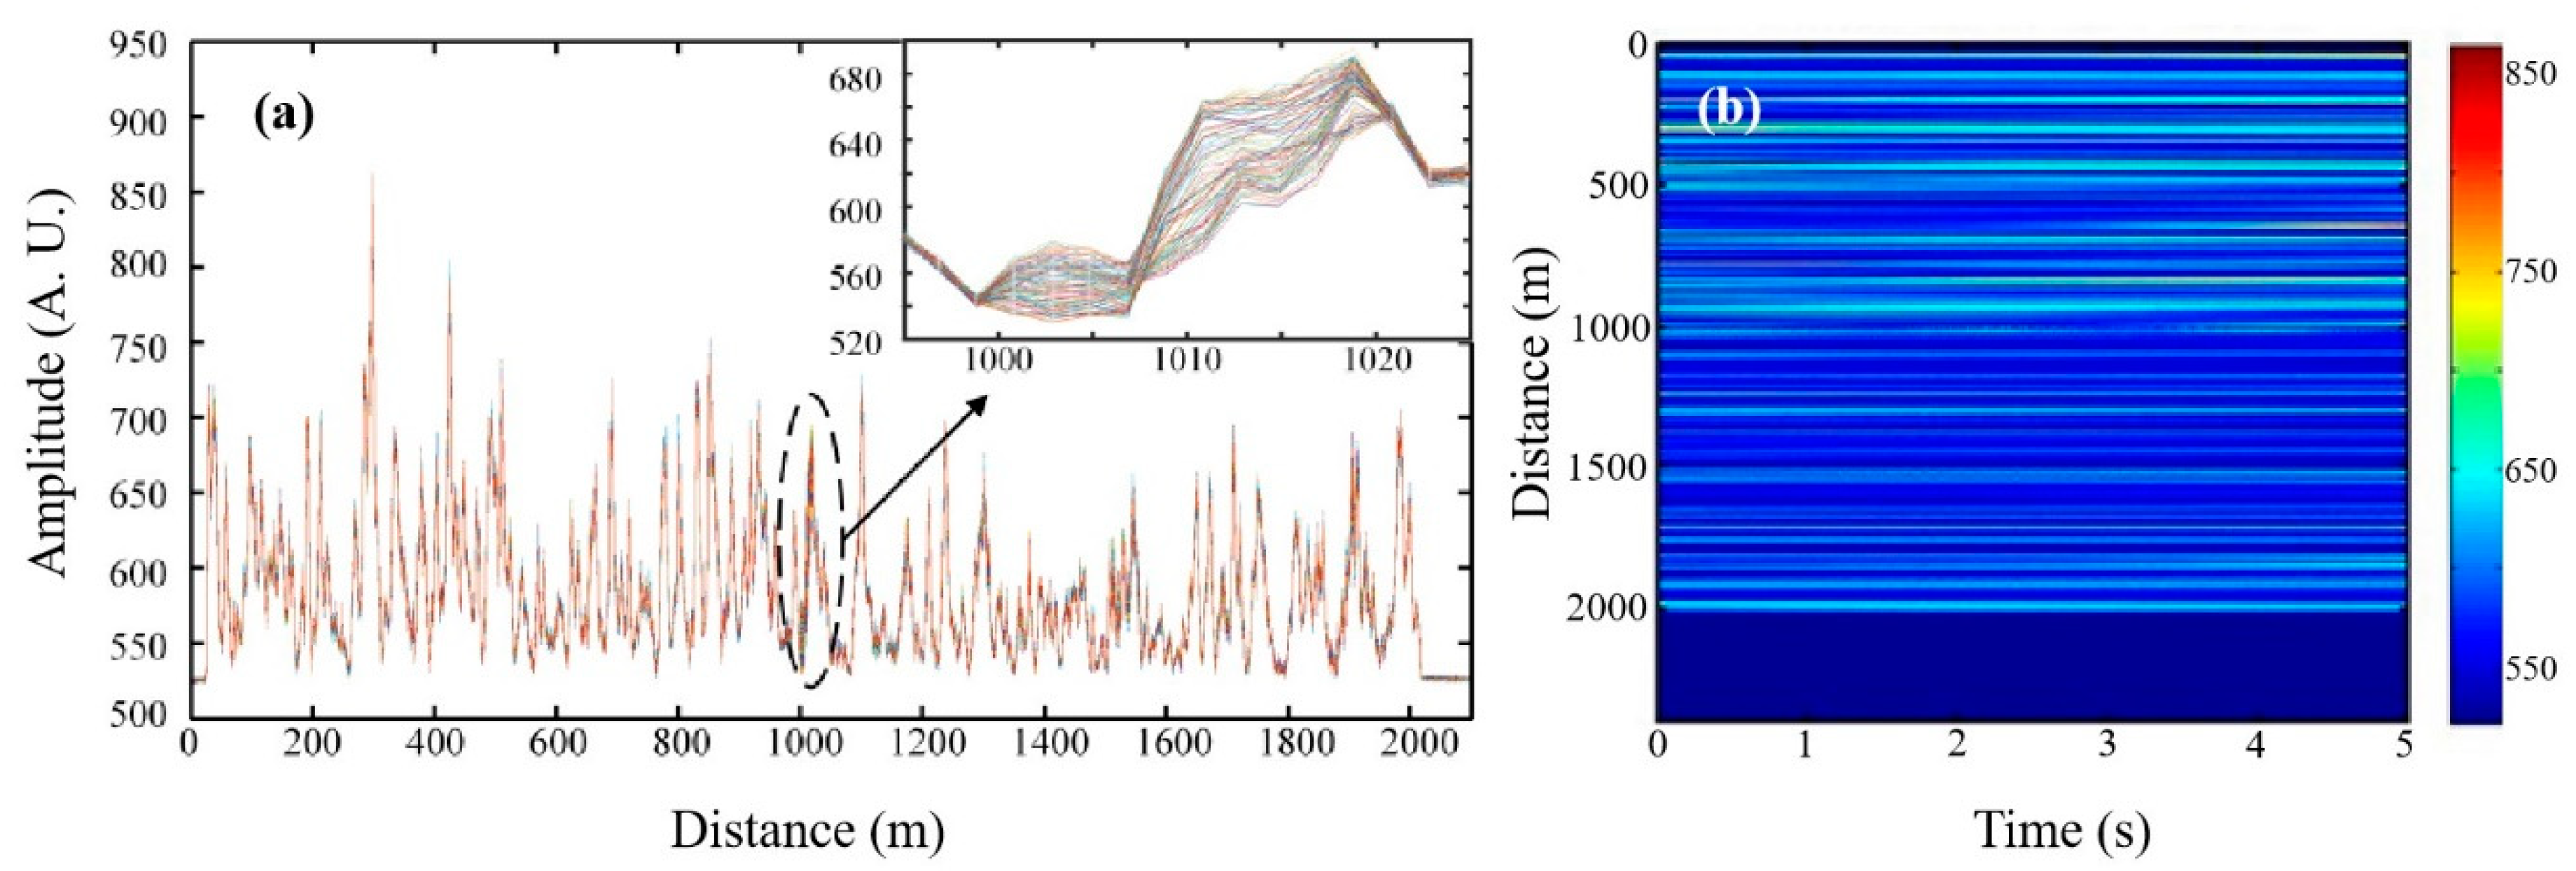
Figure 8a shows the single-point vibration positioning result. The external disturbance is located at 1012 m, with a positioning error of 12 m and SNR of 19.46 dB while the total length of optical fiber is 2020 m.
Figure 8b shows the multi-point vibration positioning result. The real disturbances are placed at 995 m and 1513 m away from the head of sensing optical fiber. The positioning results show that the first vibration position is at 985 m with an error of 10 m and SNR of 19.88 dB, and the second vibration position is at 1505 m with an error of 8 m and SNR of 15.02 dB, while the total length of optical fiber is 2036 m. So, the vibration position can be precisely located and has a high SNR by implementing a differential accumulation algorithm with the parallel computing of the GPU.
Furthermore,
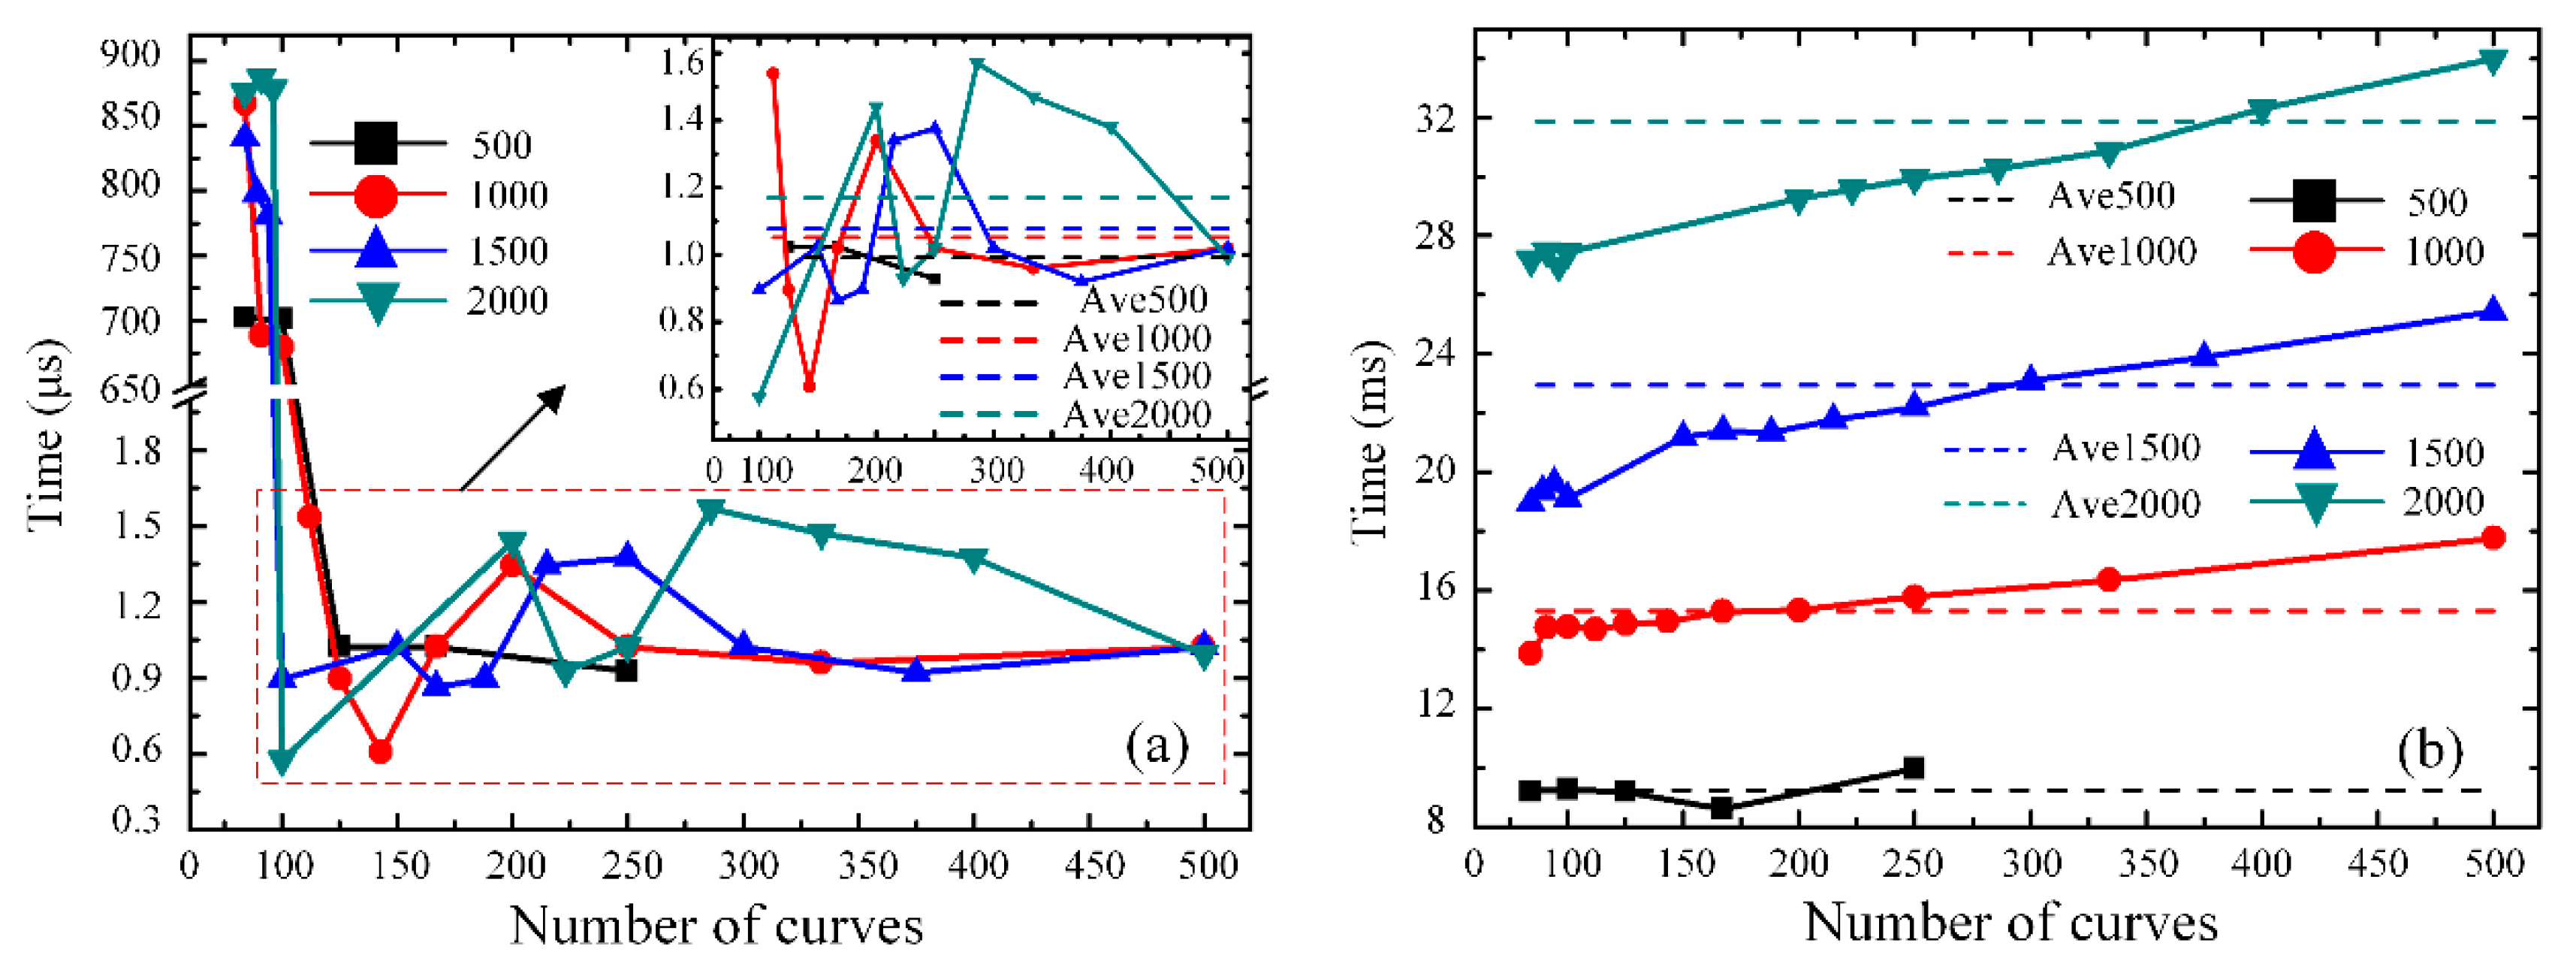
Figure 9 illustrates the time consumption comparison results for the differential accumulation processing of single-point vibration positioning between the GPU and CPU. The total number of RBS curves, which is denoted as
M, is chosen as 500 (marked in black), 1000 (marked in red), 1500 (marked in blue) and 2000 (marked in green) in the comparison analysis.
Figure 9a shows the variation in time consumption of the differential accumulation calculations with the augmentation of the number of RBS curves in one thread on the GPU, when the differential accumulation is executed on the parallel computing platform. The
X-axis represents the number of RBS curves in a thread (
J), for a fixed number of all RBS curves (
M = 500, 1000, 1500, 2000), the corresponding total number of threads (
Q) could be also obtained by
Q =
M/
J. For example, in
Figure 9a, when the number of all RBS curves (
M) is 2000, for the
X-axis value (
J) of 100, the total number of threads (
Q) is 20.
It can be concluded that, when the value of J is less than 100 (which means that Q is more than 20), the time consumption is longer than 650 μs. This phenomenon may be explained by thread synchronization in the operation process of the GPU. The smaller value of J means the greater number of threads, which will lead to frequent thread switching on the GPU. The process of thread switching will also consume time, thus slow down the calculation time of the threads.
When the value of J is greater than 100 (which means that Q is less than 20), the variation in time consumption is specifically shown in the enlarged plot. The time consumption is largely reduced to less than 2 μs. As the number of curves in one thread increases, the time consumption shows the trend of irregular fluctuation. It demonstrates that the time consumption of differential accumulation algorithm computed on the GPU may be limited by many factors, which are not only related to the number of RBS curves, but also may be influenced by the thread cache or the thread switch process.
Moreover, the change in the GPU type may increase the number of threads, but the number of threads is not the only factor affecting the computing capabilities of the system. The computing capability of the Φ-OTDR system depends not only on the number of allocated threads, but also on the amount of sensing data. Because of the thread cache allocation, or the thread switching process, in the GPU, these factors will also affect the computing capability of the system. Therefore, the algorithm complexity, the amount of sensing data and the number of threads all need to be considered for the system optimization.
Figure 9b illustrates the variation in time consumption of the differential accumulation algorithm with serial computing based on the CPU. When the total number of RBS curves is fixed, a conclusion can be drawn—that the time gradually increases with the rising number of curves in a serial computing process. In addition, when the total number of RBS curves increases, the average time rises correspondingly, which is also marked by the short straight lines.
By comparing
Figure 9a with
Figure 9b, when the total number of RBS curves is same, the processing time of parallel operations based on the GPU is far less than that of serial computations based on the CPU. For the differential accumulation algorithm, when the length of optical fiber is 2020 m and the number of processed curves is 2000, the time spent on the GPU is only 1.6 μs. Under the same conditions, the CPU takes about 34 ms to realize data processing. It can be demonstrated that the method of combining the GPU and CPU is faster than serial computing architecture based on the CPU in relation to the differential accumulation algorithm for a Φ-OTDR vibration sensing system. Therefore, GPU can speed up the data processing of a differential accumulation algorithm and improve the real-time performance of a Φ-OTDR sensing system.
4.2. FFT Analysis Processing
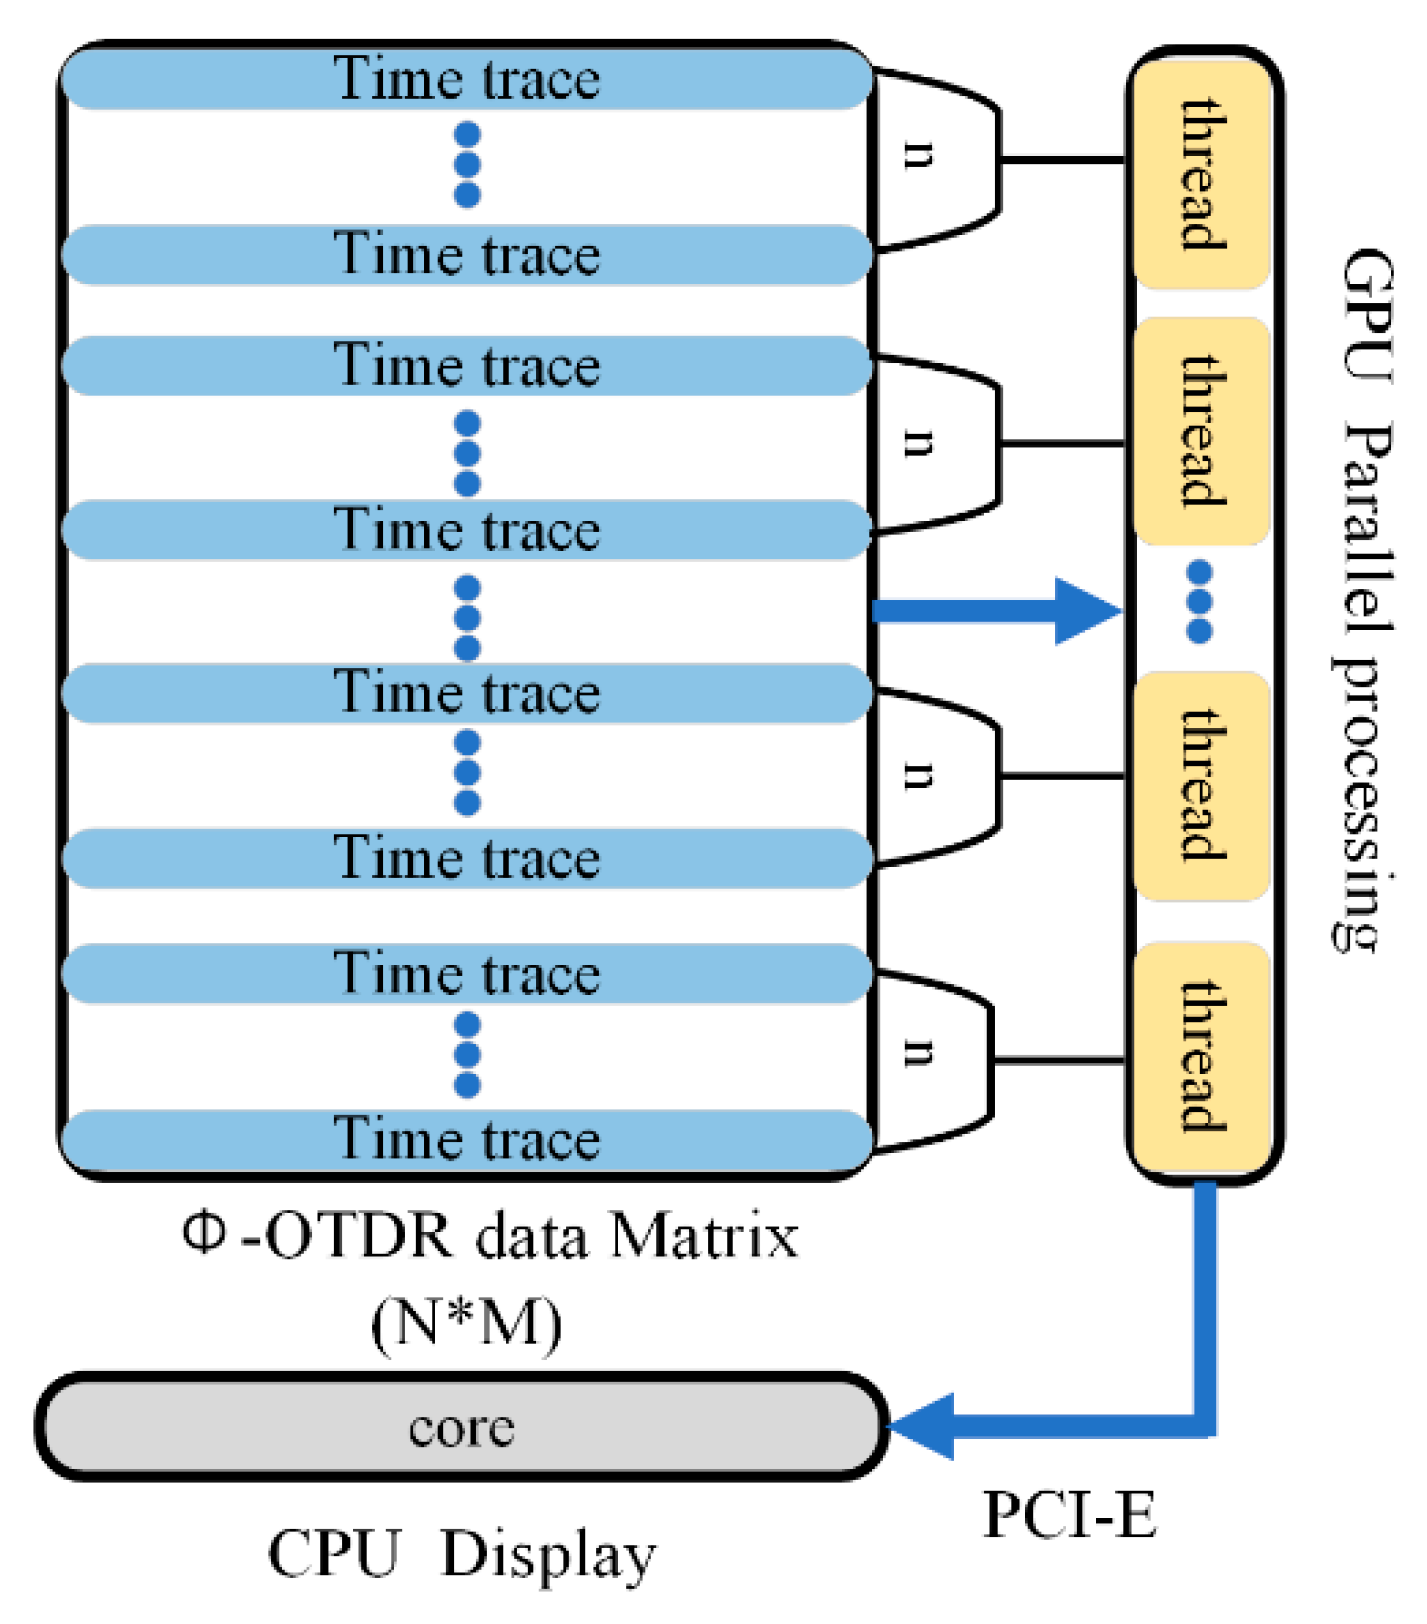
Figure 10 shows the cooperation process of the CPU and GPU to realize the spectrum analysis, which could be important for the position location and frequency component analysis of the external disturbance. Firstly, the original Φ-OTDR data acquired by FPGA is transferred into the RAM of the host computer via the USB bus, and can then be processed in the form of the Φ-OTDR data matrix (
N*
M), with
N time traces and
M sampling points in each time trace. Secondly, the CPU copies time traces into graphics memory, which can be read and modified by the GPU through the memory copy function. The GPU then allocates simultaneously numerous threads to achieve the one-dimensional FFT computation. In addition,
n represents the number of time traces in a thread on the GPU.
Finally, the processed result is sent back to the host computer via the PCI-E bus and is displayed on the screen. Thus, the frequency spectrum of temporal signal can be obtained, and it is beneficial to identify the external vibration position. In conclusion, this parallel operating method largely shortens the data processing time compared with the traditional serial computing method based on the CPU.
The process of FFT analysis based on the GPU mainly contains two parts, which are multiple curves parallel computation and the butterfly operation, which relies on the butterfly-shaped arithmetic unit. It can simultaneously provide the needed operands for many arithmetic units, owing to the advantages of its parallel structure and in-place calculation. Thus, this parallel operation structure improves the speed of FFT calculation and shortens the time noticeably. Because of the butterfly operation of FFT, when the number of calculation points is M in one curve, the algorithm complexity is O(M/2 × log2(M)).
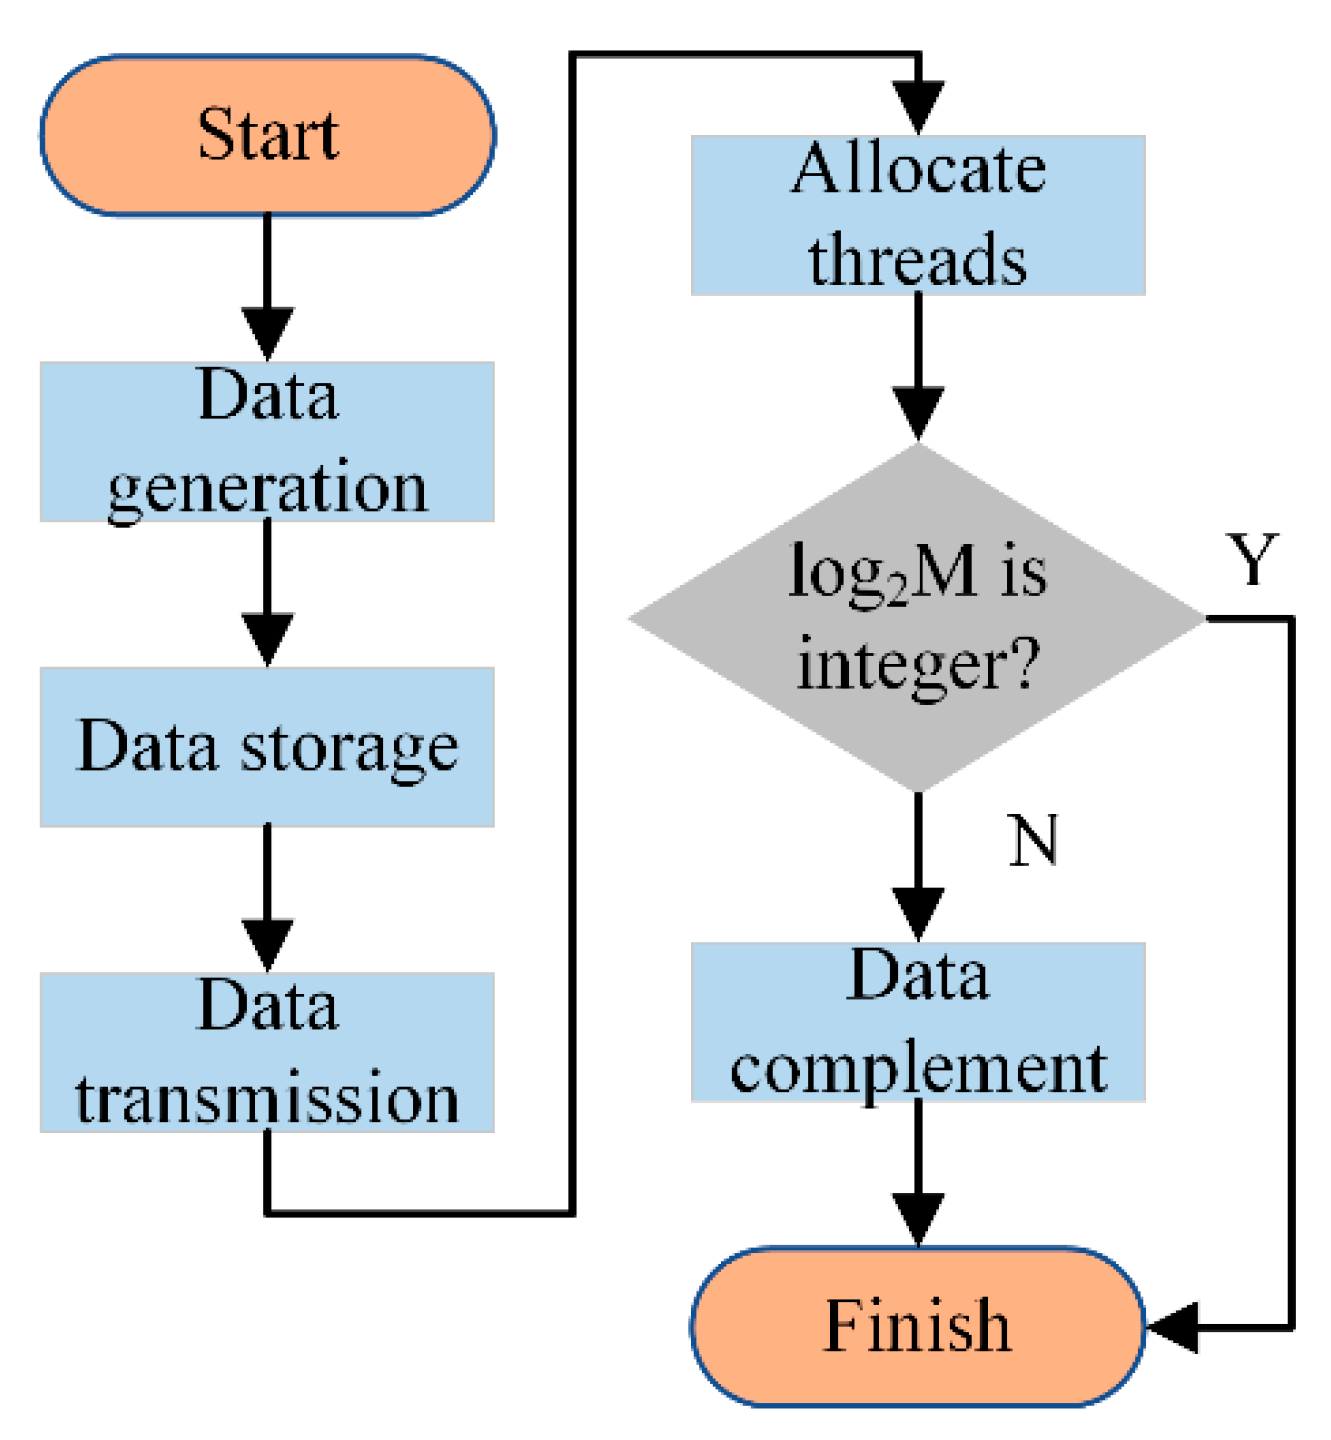
The process of the first part is shown in
Figure 11, the RBS data is generated and stored in the CPU and transmitted into the GPU. Then, the
N threads are allocated for the time traces, which means each time curve is processed by one thread. It is necessary to verify whether the length of the time trace (
M) is a power of two, owing to the existence of the butterfly operation. If the length is not a power of two, the data needs to be complemented by adding a zero value at the end of the data string. Each curve is processed by these steps on the GPU at the same time.
The second part is the butterfly operation of each time trace by using the butterfly arithmetic unit. This FFT analysis is called decimation in time (DIT) FFT. The process is shown in the equation as follows:
Equation (5) represents the computation process of conventional discrete Fourier transform (DFT). In Equation (5),
is the rotation factor which has features of symmetry and periodicity. This characteristic can decrease the computation time of FFT. The signal of the temporal domain (
x(
n)) could be decomposed into even and odd sequences, so the FFT of the even data sequence is called as
X1(
k) and the FFT of the odd data sequence is called as
X2(
k). It is shown in the equation as follows:
Therefore, Equation (5) could be developed as Equation (7).
Equation (7) expresses the principle of the butterfly operation in one thread. Xthreadi(k) indicates the frequency value of the first half of all points and Xthreadi (k + M/2) indicates the frequency value of the second half of all points. Then, the order of threads is marked as threadi = 1, 2, 3, …, Q, and the total number of threads is represented as Q.
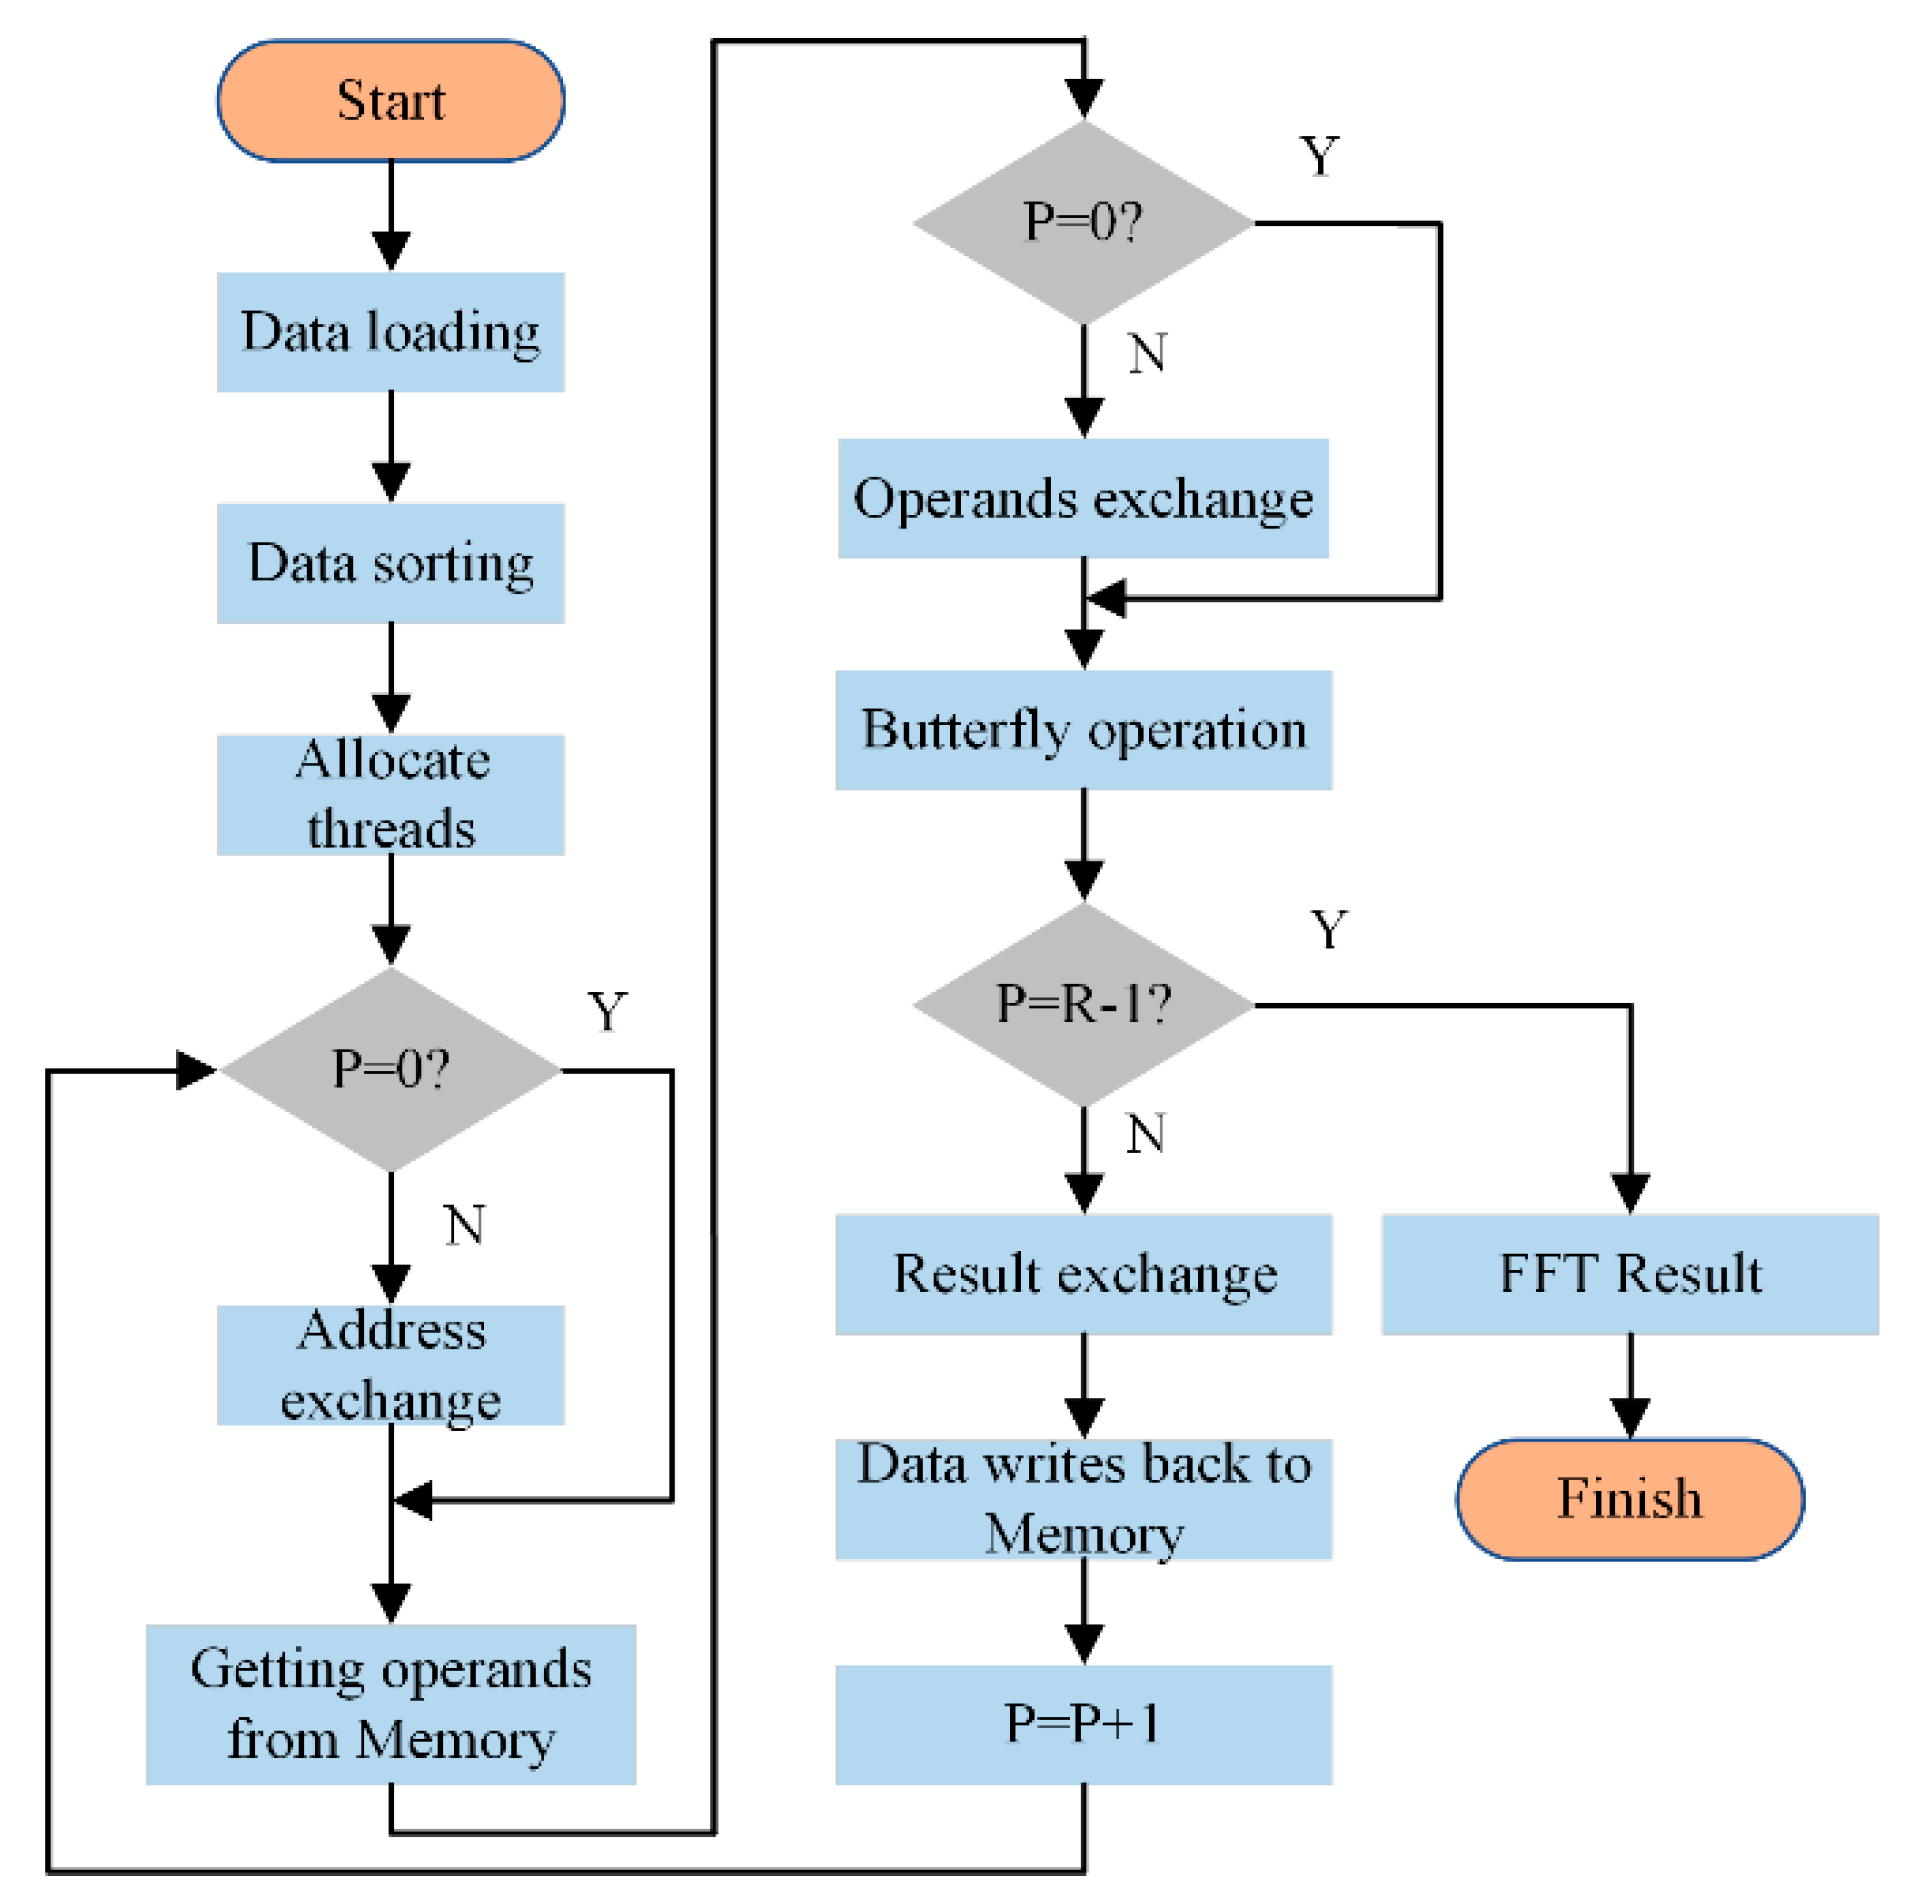
The FFT analysis process is shown in
Figure 12. The data value of each time trace is needs to be sorted before processing by the butterfly arithmetic unit. Firstly, the natural sequence number of
x(
n) in Equation (5) is transformed and expressed in the binary form. Then, the corresponding binary number is flipped. Afterwards, these sequence numbers are converted to the decimal label. Therefore,
x(n) is sorted and stored in the memory in the new numerical order.
FFT computation of M data points is achieved by using an R-level butterfly operation with R = log2M; each level has an M/2 arithmetic unit to perform the butterfly operation at the same time. The current level number of butterfly computation is denoted as P, P = 0, 1, 2, …, R − 1.
From
Figure 12, each butterfly computation is achieved by one thread, and
M/2 threads are allocated to a time trace which contains
M points. There are three kinds of exchange operations in the FFT process based on the principle of in-place computation, which are the address exchange, the operands exchange, and the results exchange after the butterfly operation. The zero-level butterfly computation only performed one exchange operation, which is the result exchange after a butterfly operation. When the value of
P is not equal to zero, the obtained frequency values will replace previous frequency values. However, the (
R − 1)-level butterfly computation only realizes two exchange operations, which are the address exchange and the operands exchange.
DIT FFT has the characteristic of in-place computation. It means that the output data of the same butterfly arithmetic unit will replace the position of the input data in the memory space. In addition, every butterfly arithmetic unit of same level operates independently, which provides the theory basis for the multi-thread processor on the GPU. Every thread executes a butterfly arithmetic unit, but the processing data in the thread will refresh with the growing number of butterfly operator levels. Therefore, it can largely decrease computational complexity and the storage space of data. Essentially, applying DIT FFT on the GPU can speed up data processing. Eventually, the real-time performance of the Φ-OTDR sensing system could be improved.
In our experiment system, a single-point vibration test at a position of 1000 m is applied, while the total length of optical fiber is 2020 m. A two-points vibration test at the positions of 995 m and 1513 m are applied, while the total length of optical fiber is 2036 m. Each time trace contains 1024 points. All time-series curves are dealt with FFT processing with a frequency resolution of 7.80 Hz on the GPU, and the obtained frequency–space waterfall map is shown in
Figure 13. From
Figure 13a, the exerted external vibration is detected and located at a position of 1012 m, and the location error is 12 m. From
Figure 13b, the vibration is exerted on two positions of 985 and 1505 m. The location errors are, thus, 10 and 8 m.
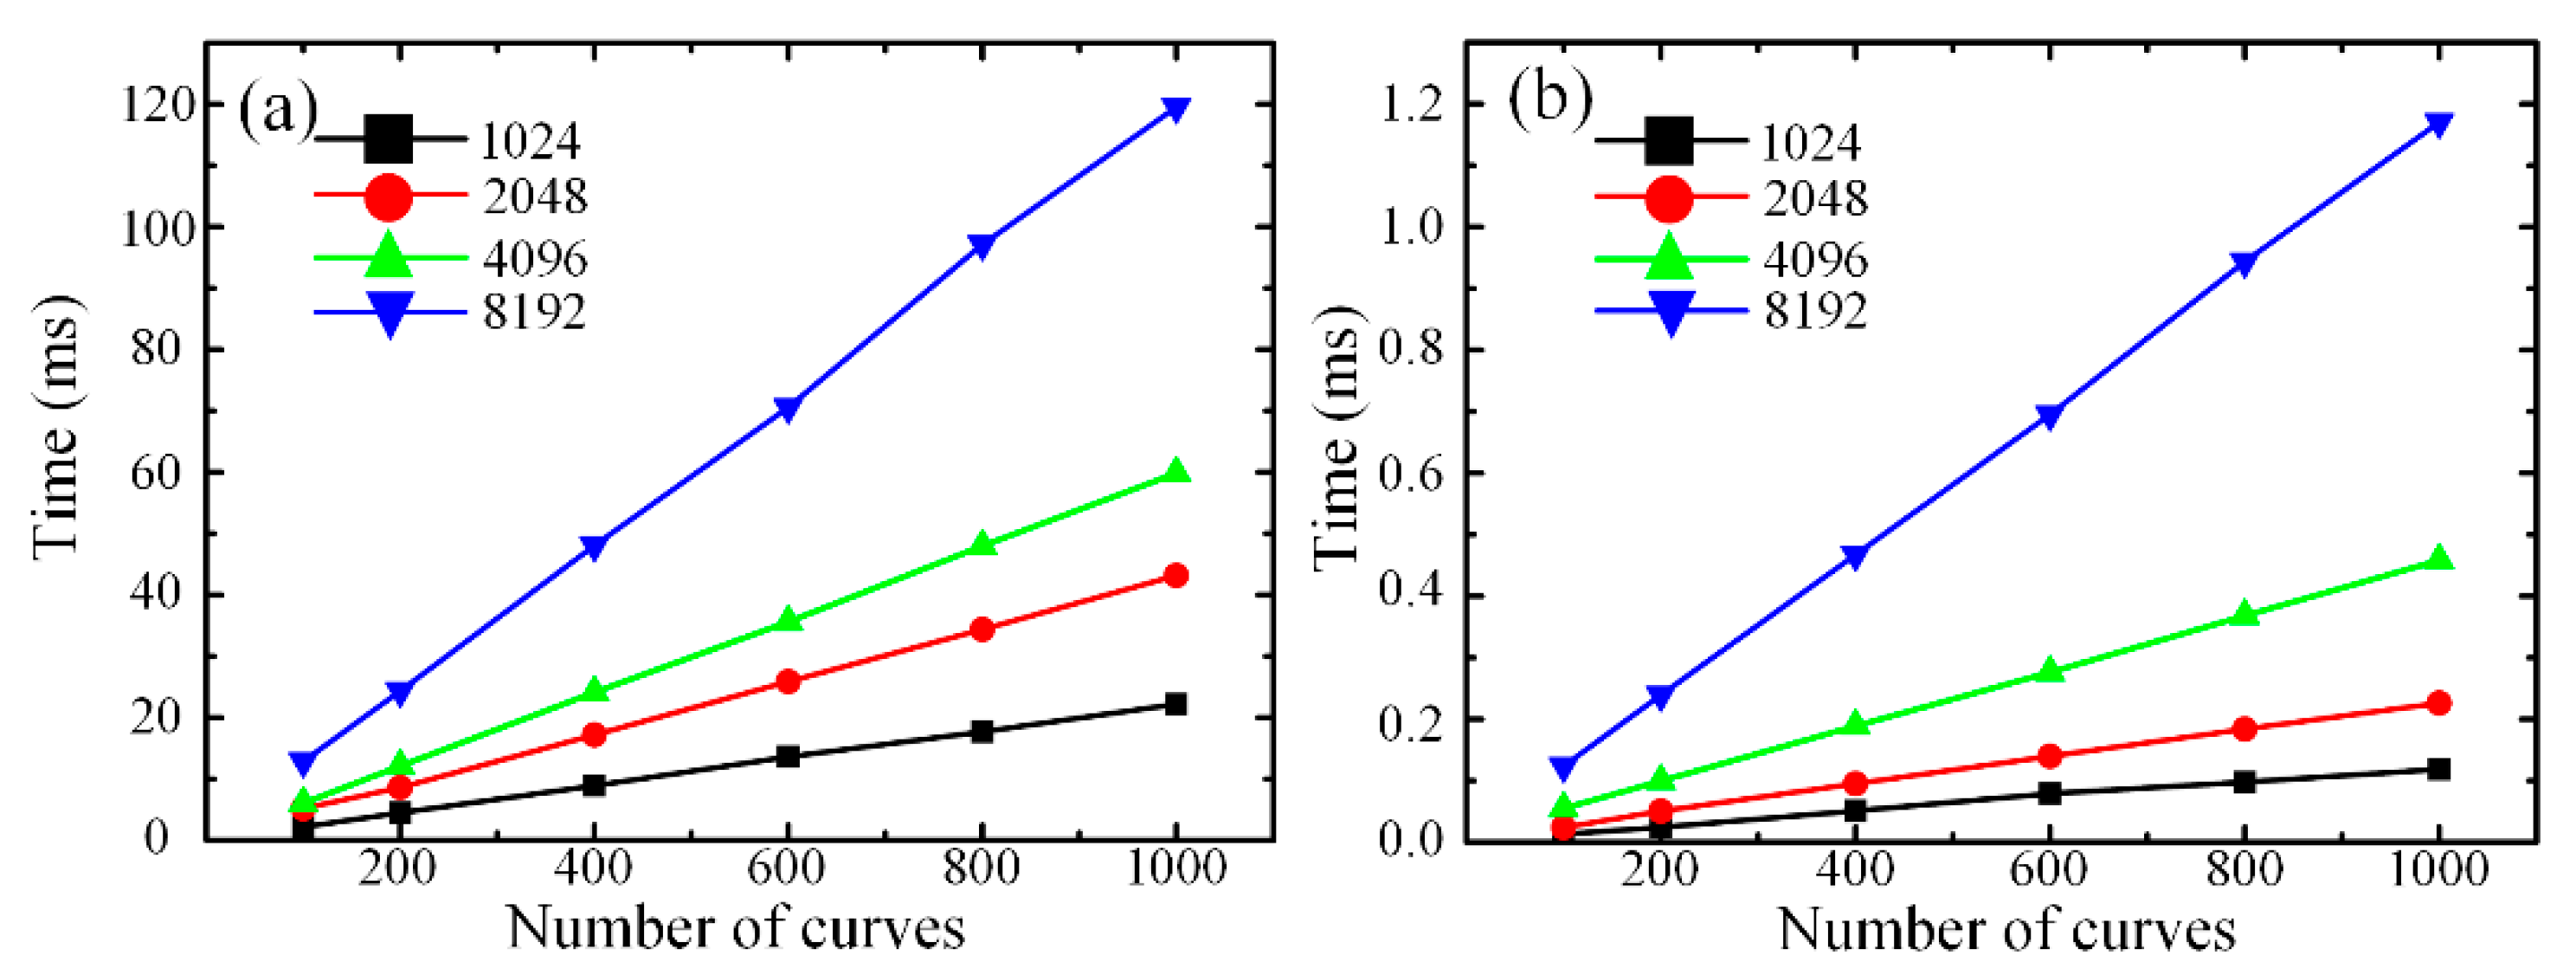
Figure 14 illustrates the computing time contrast of FFT analysis processing on the CPU and GPU. The abscissae of
Figure 14a,b represent the number of time curves, which positively correlate with the length of optical fiber. The ordinate means the computing time of the data analysis.
From
Figure 14a,b, when the length of optical fiber is changeless, with the growing number of points which needs to be executed for FFT analysis processing, the time increases gradually as well. When the number of points is constant, the time shows the trend linearly rising with the growing length of optical fiber. Comparing
Figure 14a with
Figure 14b, it can be concluded that the computing time of FFT operation based on the CPU is much longer than that based on the GPU when the point number of FFT analysis and the length of optical fiber is invariable. When the length of optical fiber is 2020 m and the point number of FFT is 8192, the consumption time is 1.17 ms with FFT analysis performed on the GPU. Under this experimental condition, it takes about 119.5 ms with FFT analysis performed on the CPU, so the speed of using GPU is approximately 140 times faster than that of traditional series computation based on a CPU in FFT analysis processing. It can be noted that a parallel computation method based on the GPU can shorten substantially the time of FFT analysis processing and optimize the real-time performance of the Φ-OTDR sensing system.
4.3. Extended Comparison Experiments and Discussions
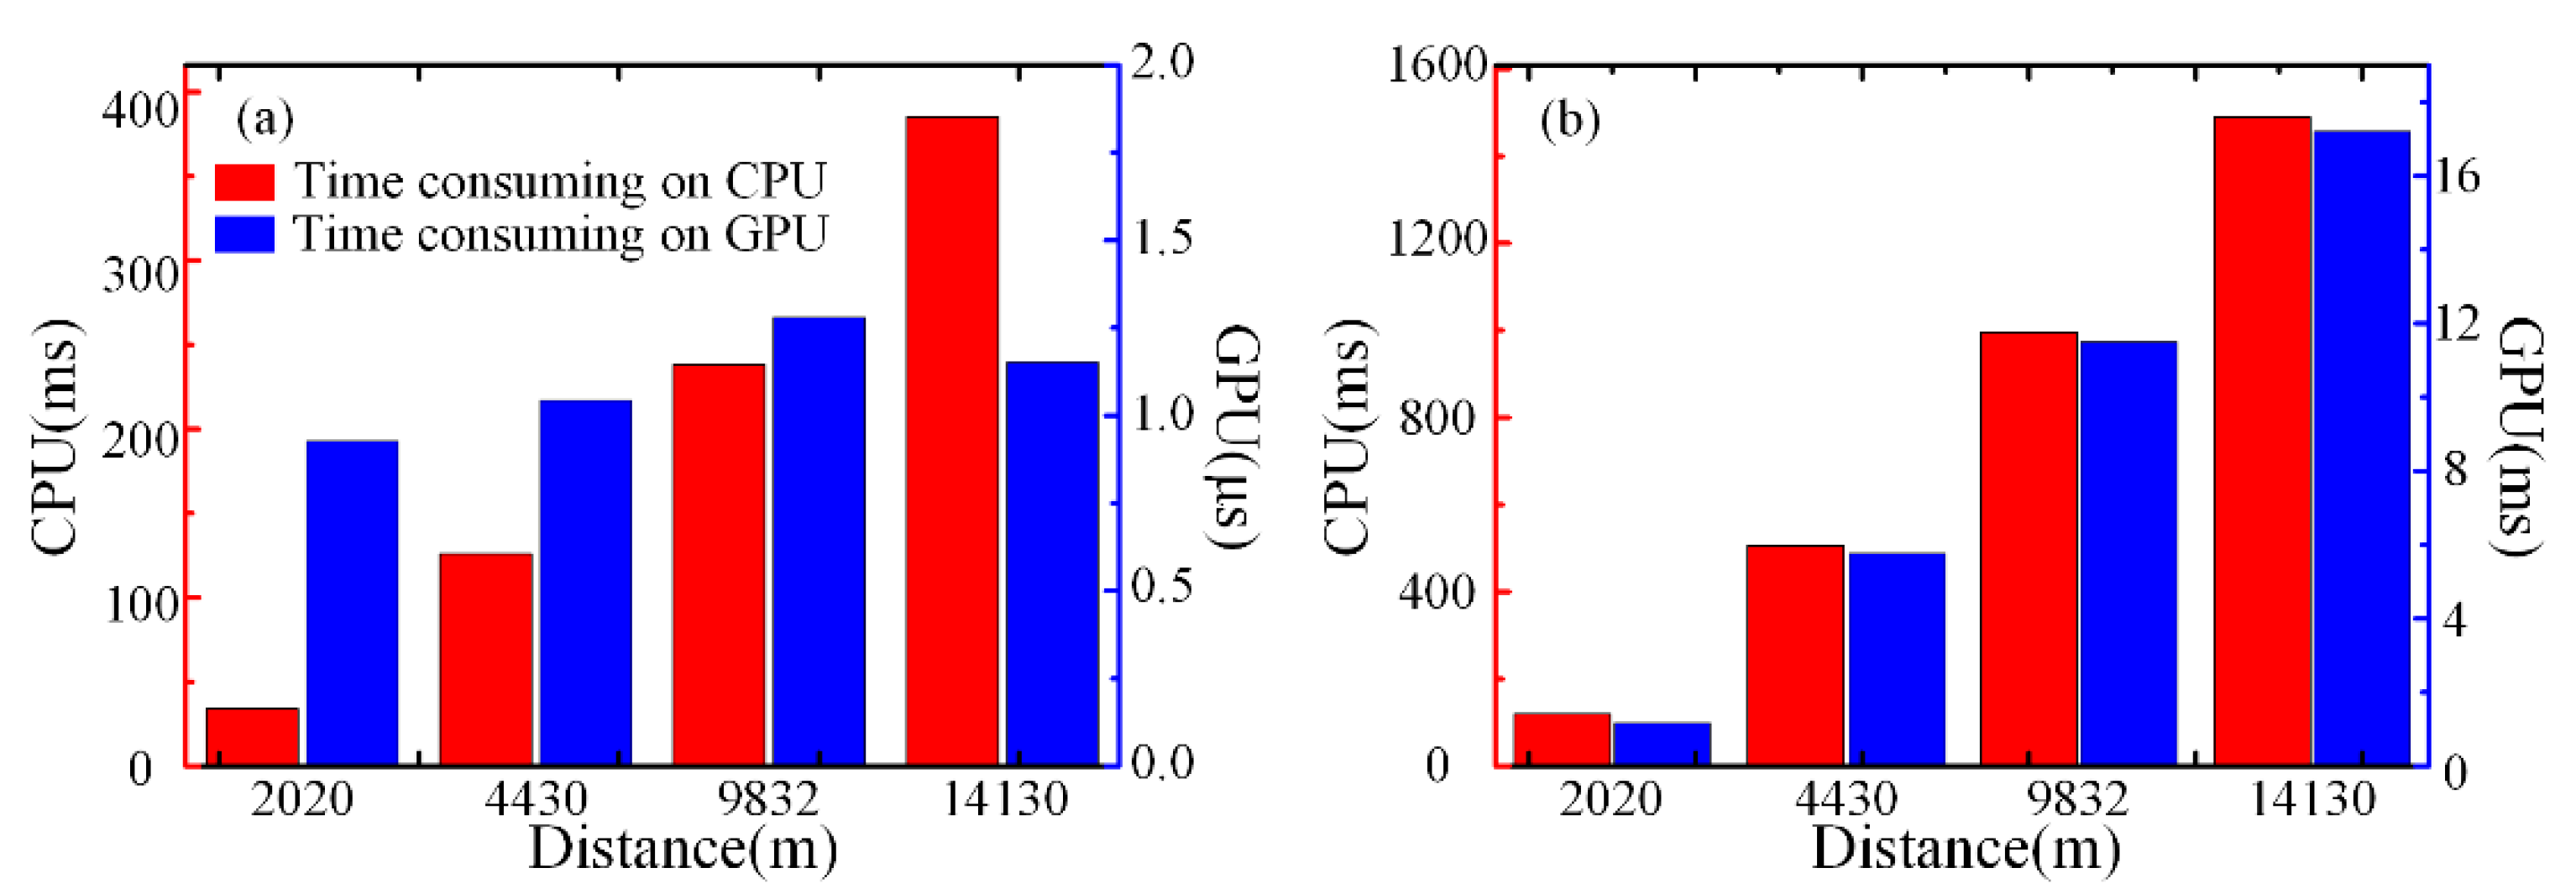
In addition, we also did the experiment in long distance conditions to verify the feasibility and effectiveness of our parallel computation method based on the GPU. The lengths of optical fiber are 2020, 4430, 9832 and 14,130 m, respectively. The differential accumulation algorithm and the FFT processing both are executed on the CPU and GPU. The experiment results are shown in
Figure 15.
The time contrast between the CPU and GPU for the differential accumulation algorithm is shown in
Figure 15a when the number of RBS curves is 2000. The red bar chart shows the time consumed on the CPU, and the longer the distance, the longer the time consumed. The blue bar chart shows the time consumed on the GPU. The changing trend of time is not regular, but floats up and down with the microsecond level. This phenomenon demonstrates that the time consumption of the differential accumulation algorithm on the GPU may be limited by many factors, which is not only related to the optical fiber distance, but also may be influenced by the thread cache allocation or the thread switching process in the GPU, which also has an uncertain time consumption less or close to one microsecond. In the condition of the same amount of data, the time spent on the GPU is far less than that of the CPU. It can be demonstrated that the method of combining the GPU and CPU can realize fast data processing in relation to the differential accumulation algorithm for a Φ-OTDR vibration sensing system.
The time contrast between the CPU and GPU for FFT processing is shown in
Figure 15b when the point number of FFT is 8192. The red and blue bar chart represents the time consumption of FFT processing on the CPU and GPU, respectively. With the increase in distance, both CPU and GPU show the same trend of growth. Moreover, in the condition of same amount of data, the time spent on the CPU is 100 times more than that of the GPU. It demonstrates that our parallel computation based on the GPU can shorten substantially the time of FFT analysis processing and optimize the real-time performance of the Φ-OTDR sensing system.
Evidently, the feasibility and validity of our parallel computation method based on the GPU are verified under long distance and large data volume conditions for the differential accumulation algorithm and FFT processing. Therefore, this paper verifies that the distributed optical fiber sensor is another example of a GPU application. Because of the large amount of sensing data and real-time performance requirement in practical applications of distributed optical fiber sensors, the GPU is used as an effective solution to improve the speed of data processing with a strong parallel computing capability.
Based on the above discussion, the differential accumulation algorithm and FFT processing on the GPU could lead to less time being consumed. However, the use of the GPU will also bring the problem of increasing cost. Therefore, the identification of when the GPU will be necessary for real-time operation could be our next research direction. In this study, we only put forward a preliminary mathematical criterion which could be optimized for real application in the GPU.
In the experimental setup, the maximum real-time data throughput is 100 MB/s and the data acquisition speed is 50 MSa/s. If each sampling point is set to be represented by 8 bits (1 Byte), the acquisition time (Ta) and the transmission time (Tt) could be simplified as Ta = 2 s and Tt = 1 s for the same data volume of 100 MB. Thus, the time consumed in the lower system (Tls), including the FPGA board and the PCI-E bus, could be considered as Tls = max(Ta, Tt) = 2 s.
Meanwhile, considering the complexity of the algorithm, FFT processing consumes more time. Based on the linear relationship in
Figure 14, the time consumed by FFT processing on the CPU (
TCPU) and GPU (
TGPU) is
TCPU = 120 ms and
TGPU = 1.2 ms while the point number of FFT processing is 8192 and the number of RBS curves is 1000. Thus, the time consumed could be calculated as
TCPU = 1920 ms and
TGPU = 19.2 ms if the number of RBS curves (
NRBS)
NRBS = 16,000 with the repetition frequency of optical pulses of 8kHz in our experimental setup. Considering that the CPU also needs memory allocation, reading and writing operations, the time consumed in the upper system (
Tus), including the CPU and internal bus, should be greater than
TCPU, which means that
Tus =
kTCPU with the coefficient
k > 1.
As a result, if Tus > Tls, which means kTCPU > max(Ta, Tt), it is recommended to use the GPU to optimize the execution time of the processing algorithm. By contrast, if Tus < Tls, which means kTCPU < max(Ta, Tt), the use of the CPU may be also acceptable.


