Article

Re-Defining, Analyzing and Predicting Persistence Using Student Events in Online Learning †

by
Pedro Manuel Moreno-Marcos
*,
Pedro J. Muñoz-Merino
,
Carlos Alario-Hoyos
and
Carlos Delgado Kloos
Department of Telematics Engineering, Universidad Carlos III de Madrid, E-28911 Leganés, Spain
*
Author to whom correspondence should be addressed.
This paper is an extended version of a paper published in Learning Analytics Summer Institute (LASI) Vigo, Spain, 27–28 June 2019.
Appl. Sci. 2020, 10(5), 1722; https://doi.org/10.3390/app10051722
Submission received: 31 December 2019 / Revised: 25 February 2020 / Accepted: 26 February 2020 / Published: 3 March 2020
(This article belongs to the Special Issue Smart Learning)

Abstract

:

Featured Application

This study analyzes students’ persistence using their interactions in online platforms. The analysis of persistence can be useful to gather information in order to better understand students’ abilities and their possible difficulties. This information can also be useful to provide personalized and adaptative feedback and contents to improve learning.

Abstract

In education, several studies have tried to track student persistence (i.e., students’ ability to keep on working on the assigned tasks) using different definitions and self-reported data. However, self-reported metrics may be limited, and currently, online courses allow collecting many low-level events to analyze student behaviors based on logs and using learning analytics. These analyses can be used to provide personalized and adaptative feedback in Smart Learning Environments. In this line, this work proposes the analysis and measurement of two types of persistence based on students’ interactions in online courses: (1) local persistence (based on the attempts used to solve an exercise when the student answers it incorrectly), and (2) global persistence (based on overall course activity/completion). Results show that there are different students’ profiles based on local persistence, although medium local persistence stands out. Moreover, local persistence is highly affected by course context and it can vary throughout the course. Furthermore, local persistence does not necessarily relate to global persistence or engagement with videos, although it is related to students’ average grade. Finally, predictive analysis shows that local persistence is not a strong predictor of global persistence and performance, although it can add some value to the predictive models.

1. Introduction

Smart Learning Environments (SLEs) [1] combine educational technologies, ubiquitous learning, and learning analytics, among others. One of the objectives of SLEs is to provide more information (e.g., through dashboards [2]) about students’ behaviors and performance, such as their progress in the course. With this information, it is possible to develop systems that can provide adaptative and personalized learning experiences (e.g., provide adaptable materials or scaffolding questions if needed, as in Intelligent Tutoring Systems [3]) and feedback/support [4,5]. Another possible use of SLEs is to detect situations in which to intervene (e.g., to detect students with difficulties, such as risk of dropout, failure, lack of engagement or motivation, etc.) [6]. Online and blended learning can also benefit from SLEs, as digital platforms can collect many information about students’ performance, behaviors and possible difficulties.
Among the possible student difficulties, low persistence can be an issue to pay attention to. Persistence is a personality feature [7], but it can be defined in different manners in different contexts even in the educational area. In the educational context, several articles consider persistence as the fact of staying/continuing a degree to complete it (e.g., [8,9]), thus close to be the opposite for the concept of dropout. For example, Kimbark et al. [10] considered students were persistent when they enrolled in the following spring semester. Whitehill et al. [11], in contrast, analyzed persistence at course level in an online context and they considered that students were persistent when they interacted with the course at least once a week. Similarly, Crues et al. [12] defined three levels of persistence (low, medium and high) depending on how many weeks students had worked in the course. Regardless of the scope of this definition of persistence (at the course or degree level), this definition of persistence aims to capture to what extent a student keeps on doing an activity in a long period (e.g., course/degree). This type of definition of persistence is related to activities that last for a long time and it does not explicitly consider the difficulties during the learning process (e.g., specific difficulties that occur throughout the course or degree). As this definition of persistence comprises a long period that can be subdivided for analyzing persistence (degrees can be subdivided in semesters and courses in weeks), we will refer to this definition as “global persistence”.
However, for many other authors (e.g., [13,14]), persistence is considered as a synonym of perseverance so that a student is considered persistent when s/he keeps on working on a task (e.g., an exercise) after trying to solve it incorrectly [13]. In this case, persistence can be measured using data from individual exercises. Because of that, we will refer to this type of persistence as “local persistence”. However, local persistence is not computed for each individual exercise, but an overall value of student persistence is computed for a set of exercises. Local persistence has not been addressed as many times as the “global persistence”, but it can also be relevant as some researchers have shown that being persistent at the local level can lead to better performance. For example, Muenks et al. [7] found that local persistence could be useful to predict grades, although self-regulated learning, which can also be related to local persistence [7], and engagement variables achieved higher predictive power. However, high values of local persistence are not necessarily good because if there is no reflection after trying to do a task incorrectly, learning might be only superficial [15]. Nevertheless, from an analytical point, a low local persistence can also be negative since it shows that students lack the ability to face the problems associated with the tasks they have to do.
In this context, the analysis of local persistence is important to know what the distribution of this feature among students is, its relationship with other variables or its predictive power with learning outcomes. Prior research work has mainly identified local persistence through self-reported data (e.g., [7,14]), but few models have been defined to measure local persistence from students’ events in a digital platform. This is important because self-reported data might sometimes not reflect the reality because students might not be aware of their local persistence or they might lie. In these cases, measurements from student’ events would be more accurate. In online or blended education, students’ interactions with the digital platforms can be used to collect data to measure persistence (global and local). Particularly, local persistence is measured using interactions with individual exercises in an online platform (Open edX). We consider that a student with high local persistence is a student who attempts exercises again and again until the correct solution is obtained. Similarly, we consider that a student with high global persistence is a student who regularly accesses the course and completes all the modules (or at least a minimum required). These considerations are used in this article to analyze different interesting aspects related to persistence.
Particularly, there is interest on analyzing the prevalence of local persistence (i.e., how persistence is distributed among learners). This is relevant to understand how local persistence vary among the students in a course, and to identify groups of students based on their local persistence. Moreover, timing considerations are also important, and the evolution of local persistence (i.e., how local persistence varies when it is computed based on the exercises carried out in different time periods, such as weeks) is useful to understand whether or not students’ behaviors towards attempting exercises remain, increase or decrease throughout the course. For example, if local persistence is lower at some stages of the course, it may mean that students engage later in a course or engage more with some activities. In this line, Chase [16] identified that local persistence could vary depending on the domain of expertise of students (e.g., students can be more persistent in tasks they find easier). However, low local persistence does not necessarily mean that exercises are difficult for the students because, according to Csikszentmihalyi [17], if exercises are too easy, students may feel bored (and conversely anxious if difficult), and that may also affect local persistence.
In addition, local persistence can affect or can be affected by other variables. In online courses, some hypotheses are that local persistence might affect academic achievement and engagement with videos. Moreover, global and local persistence may also be related to each other. The analysis of the relationship between local persistence and other variables serves not only to better understand students’ behaviors but can also contribute to the development of predictive models. These models can be useful to anticipate what will happen in the course and early predictions can enable timely interventions. However, for these models, it is important to know which variables influence the variable to be predicted. For example, if global persistence is predicted, it would be relevant to know if variables related to activity, videos, local persistence, etc. influence the predictive models.
Considering all the aforementioned issues, the focus of this paper is on the development of a model to determine local persistence, and the analysis of this local persistence with real data to determine if adaptation can make sense (based on the type of students and their evolution over time) and if persistence can be included in early-dropout prediction systems. With this aim, the main beneficiaries of this paper are researchers on educational technologies and designers of learning analytics systems who can benefit from the results to implement visual analytics systems, adaptation and prediction. Nevertheless, teachers and/or students would be indirect beneficiaries of this work as learning analytics systems would be designed from them.
The objectives of this work are the following:
O1.
Propose a model to measure students’ local persistence based on their interactions in a digital platform with online exercises.
O2.
Analyze the prevalence of the local persistence.
O3.
Analyze the evolution of local persistence over the time.
O4.
Analyze how local persistence is related to global persistence, and other variables about students’ performance and engagement with videos.
O5.
Analyze the predictive power of local persistence in predictive models to predict global persistence and students’ performance.
This paper is an extension of the paper “Analyzing Students’ Persistence using an Event-Based Model” [18], which was published in the Proceedings of the Learning Analytics Summer Institute Spain in Vigo, on June 27–28 2019. In that paper, we determined a model to define local persistence and analyzed the prevalence of local persistence and how local persistence was related to dropout, students’ performance and engagement with videos. In this paper, we have incorporated a redefinition of the concept of persistence (distinguishing between global and local persistence). With these definitions, we have included an analysis of local persistence over time, and we have developed predictive models in different stages of the course to forecast global persistence and students’ performance using local persistence. For these models, which represent a new contribution with respect to our previous work [18], several common variables in the literature and local persistence have also been used to analyze the effect of local persistence in predictive models. Therefore, we also contribute with the analysis of prediction in different stages of the course using local persistence as predictor.
The structure of the paper is as follows: Section 2 presents an overview of what has been researched on persistence (global and local); Section 3 describes the methodology of the paper, including the context and data collection techniques, the variables and measures, and analytical methods; Section 4 details the model to measure local persistence; the analysis and discussion of the results are provided in Section 5; finally, the main conclusions are detailed in Section 6.

2. Related Work

Persistence has been defined in different ways in educational settings. The main ones are those related to continue doing an activity in a long period (e.g., course), which is referred here as global persistence, and those related to the ability of continuing doing a (short-time) task (e.g., exercise) despite difficulties, which is referred here as local persistence. This section overviews the main contributions for both types of persistence.

2.1. Global Persistence

Global persistence, as it is understood here, is the ability to keep on working on a course/program in the long term. Following an educational experience has an implicit difficulty since the learning process usually requires some effort. However, global persistence does not usually take into account specific explicit difficulties. Global persistence can be related to dropout (e.g., a student who drops out a course is not persistent (at the global level) in the course, or a student who do not finish a degree). In fact, global persistence might be considered a binary variable, and in that case, a student who does not persist in a course or a degree is usually a dropout. Because of that, this article considers dropout and global persistence as similar terms. While there can be several specific definitions of dropout [19] (e.g., a student who drops out a course can be a student who fails a course, does not complete it, does not frequently interact with it, etc.), it can be said that dropout is related to the absence of certain actions that should be done in a course in order to complete it and/or succeed at it. Dropout is an important issue because its rates can sometimes be very high, both at course and academic (whole degree) level [20].
Several studies have tried to analyze the reasons behind low global persistence and dropout. Deschacht and Goeman [21] analyzed the effect of using blended learning and concluded that blended learning had a negative effect on student’s global persistence for adult learners, although it had an overall positive effect on the passing rates. In addition, Van Houtte and Demanet [22] concluded that teachers’ beliefs about students’ capability of being taught had a high impact on dropout rates. Furthermore, other articles, such as [23,24], also analyzed students’ emotions and found that pessimistic students were more likely to dropout, and anxiety, confusion and frustration were the most correlated emotions related to dropout.
Current research has also focused on developing predictive models. Forecasting global persistence and/or dropout is one of the main objectives of predictions in the literature, together with students’ performance [6]. Both dropout (and global persistence) and performance are very related, although being persistent at the global level does not mean success (good performance) because some students may engage with all course activities and complete them, but still fail. Burgos et al. [25] predicted dropout (considering those students who did not complete the activities of the course) using logistic regression with Moodle data. These authors also evaluated how interventions (send e-mails to and phone potential dropouts) could reduce dropout rate by 14%. In addition, Gašević et al. [26] also used Moodle logs to predict learners’ performance in nine undergraduate blended learning courses. Their analysis showed how important the course context is, as engagement with the Learning Management System (LMS) and the features used in it could differ between courses. This entails that some variables could be significant predictors for some courses but not in others because of the course context.
Despite this fact, research has analyzed the predictive power of different features in dropout to discover to what extent they can be good predictors in different contexts. Authors have mainly focused in variables related to activity in an online platform, students’ performance (scores on summative/formative tasks or courses), engagement with videos, forum activity, and demographics [6] (although not all variables are always available or analyzed). For example, Jiang and Li [27] predicted dropout using data from an online course and combining multiple information sources. Particularly, they considered variables related to engagement with course assignments, watching videos, accessing to course objects, wiki and forum. In addition, Márquez-Vera et al. [28] predicted dropout of high school students. In their case they used variables, such as the Grade Point Average (GPA), demographics variables, scores on specific subjects, variables taken from instructors’ observations (e.g., attendance, level of boredom during classes) and other factors, such as level of motivation number of friends, etc.
However, more variables can be introduced and analyzed to see if they can enhance the predictive power [6]. For example, Moreno-Marcos et al. [29] concluded that variables related to self-regulated learning could achieve accurate predictions when predicting dropout. In this line, this paper aims to contribute with the analysis of the predictive power of local persistence when predicting global persistence and students’ performance (objective O5). This analysis contributes in the analysis of the variables affecting predictions and in the analysis of how different definitions of persistence (global and local) are related.

2.2. Local Persistence

Many algorithms have identified variables related to students’ personality [30], sentiments [31] and problems [32], such as heavy work load, among others. One of these possible personality features is local persistence. Local persistence, sometimes also referred to as perseverance, is the students’ ability to keep on working with effort on a specific task (e.g., an exercise) after facing difficulties (e.g., after getting a wrong answer) [33]. As it is focused on a specific task that can be framed in a higher-level frame (e.g., course), we name this as local persistence. Depending on the specific task and context, the possible difficulties to address can be very diverse, thus enabling the definition of different ways to calculate persistence. Silvervarg et al. [13] carried out a study with 10-to-12-year-old students who used a digital educational game. The game was designed to make students face exercises that were unlikely to be solved, and each time the student failed a question, s/he was presented with different options, which were used to measure students’ local persistence (e.g., continue working, get an easier exercise, take a break to play a game, etc.). Their study showed that students with higher local persistence managed to solve tasks at higher difficulty levels. Moreover, Eley et al. [14] analyzed personality profiles from medical students and they found that 60% of them had a profile with high local persistence and low harm avoidance (personality trait with tendency towards pessimism, anxiety and worry about problems), which can be important to succeed in medicine.
Furthermore, research has also focused in the analysis of how local persistence can be related to other personality features and performance. For example, Scherer and Gustafsson [34] found that local persistence was positively related to openness, and both were useful skills towards creative problem solving. Furthermore, Chase [16] concluded that there are three motivational factors that lead to local persistence after failure: (1) have an ego-protective buffer (i.e., not perceiving a failure as a result of lack of ability or intelligence [13]) (2) accept responsibility of failures, and (3) have actionable paths for making progress (i.e., have tools/resources to continue taking the tasks after failure [13]).
In terms of performance, Scherer and Gustafsson [34] also analyzed the relationship between local persistence and performance using self-reported data from students in three countries (Australia, Norway, and Singapore). They found a positive correlation between local persistence and performance (about 0.3) with a minimal difference between countries. In addition, Farrington et al. [35] also concluded that local persistence had a direct relationship with grades. They also found differences in the relationship depending on the period of measurement, and the relationship between local persistence and grades was higher when both variables were measured concurrently.
Despite the fact that these contributions have analyzed local persistence and their relationship with other variables, one of the limitations of these contributions is that they usually analyze local persistence from self-reported data (e.g., [7,14,33,34]), and these data may be biased because of learners’ beliefs and motivations. Few contributions, such as [13,36], measured local persistence based on students’ events. For example, Ventura et al. [36] measured local persistence as the time spent on attempts where the exercises were not solved correctly. However, these few contributions are different from this work because the difficulties found when solving the tasks, the context, and the way to measure persistence are also different. Silvervarg et al. [13] measured local persistence in an educational game, while this work focuses on an online course hosted in an educational platform. Furthermore, Ventura et al. [36] measured local persistence based on time spent when solving riddles (not a course), and they did not focus on whether or not tasks where eventually solved. Taking this into consideration, in this article, we aim to contribute with the analysis of local persistence based on students’ interactions in a digital platform, and we focus on the attempts needed until the student correctly solves the exercise.
This paper innovates with a method to measure local persistence from students’ events collected from the digital platform based on exercises (objective O1). Moreover, the article also presents a novel analysis about the prevalence of local persistence (objective O2) and their temporal evolution (evolution of local persistence over time) (objective O3), the analysis of the relationship between persistence and other variables, such as global persistence and performance (objective O4) and their predictive power when forecasting the latter (objective O5).

3. Materials and Methods

This section presents the methodology used to conduct the analysis. First, the context of the courses taken for the study is described, together with the details of the data collection. Second, the variables used for the analysis are introduced and how they are measured. Finally, the methods to conduct the analysis are detailed.

3.1. Context and Data Collection

The analysis of students’ persistence (global and local) was carried out using data from Small Private Online Courses (SPOCs) [37], offered by Universidad Carlos III de Madrid and hosted on a local instance of Open edX. These SPOCs serve as a support of face-to-face course and three possible models of use are defined: (1) SPOCs needed to pass the course or with an important weight in the final grade, (2) SPOCs that are part of the course (often used to be combined with flipped classroom) but do not count for the summative evaluation, and (3) SPOCs that are only a recommended support for the course but that are not mandatory. In total, there are data available from 38 SPOCs, which comprise all the thematic areas of the studies the university offers, mainly Social Sciences, Formal Sciences and Engineering. However, the characteristics of each SPOC (e.g., syllabus, purpose, structure, etc.) are unknown for the purpose of this analysis.
As the SPOCs are hosted in Open edX, data format is defined by edX [38], and there are data about activity, videos and exercises (SPOCs are mainly designed with just videos and automatic correction exercises). For the analysis of local persistence, only information about exercises is considered as local persistence variable is focused on measuring whether or not students continue their exercises after getting incorrect answers. Thus, only the events produced when submitting the answers of exercises (“problem check”) are considered. Nevertheless, other events about video-related behaviors (play, pause and seek video) are considered to gather other variables that are also used in the analyses. In total, there are data from 38 SPOCs and 3598 students. However, some students were enrolled in more than one SPOCs, which entails that there are actually 4382 pairs of course-student and 270,182 interactions with exercises.
These exercises can be of many types, such as multiple choice, checkboxes, dropdown, numerical input ant text input problems. All these formats allow automatic grading, and grades from each exercise are continuously ranged between 0 to 100%. However, in 95% of cases, exercises are graded in a binary form (correct/incorrect), as most of the exercises can only accept binary values (e.g., multiple choice questions can only be correct or incorrect, while checkboxes can allow partial grades depending on the number of guesses). For the analysis, no information is known about the format of each exercises and the number of allowed attempts. This is a limitation because, for example, a student cannot be persistent if exercises only allow one attempt (which is typical in summative exercises), and a student is more likely to be persistent in true/false questions where the answer is known once getting feedback from the first attempt.

3.2. Variables and Measures

This section presents the variables used in the study and how they are measured. First, persistence in described. In this case, two definitions are used in the paper:
  • Global persistence: It is a binary variable to indicate whether or not a student has activity in the course and/or completes it. It is directly related with the term dropout, as students who do not complete the course (i.e., they are not persistent in a global sense) can count as a dropout. As dropout can be measured in many different ways and its definition may be sometimes difficult because some students can be inactive for a period and then continue the course [29], two measures are considered and discussed throughout the paper.
    Definition related to activity: Students are persistent at the global level if they engage with the course (i.e., by watching a video and/or attempting an exercise) at least once every fortnight. In other words, they are not persistent when they do not interact with the course for two consecutive weeks. As there can be periods where students do not necessarily need to interact (e.g., public holidays and/or periods where the instructor wants to focus in other activities different from the SPOCs), weeks where less than 10% of students interact are not considered towards the calculation of global persistence.
    Definition related to completion: Students are persistent at the global level when they complete most of the exercises, regardless when they complete them. In this case, 75% of activities need to be completed to be persistent at the global level, although this threshold could be adaptable in other contexts. In this case, it can be reasonable as it is used in other well-known platforms, such as MiríadaX (https://miriadax.net/en/faq?faqid=8635212), which requires completing 75% (and passing, which is not required here) of modules to get certification of participation. This definition differs the former (definition related to activity) because this definition focuses on students’ completion of activities (regardless the period), while the former focuses on accessing the SPOC (regardless activities are done or not).
  • Local persistence: It is a continuous variable that measures to what extent students continue attempting an exercise until getting the correct answer once they have answered it incorrectly. It is considered as “local” because it is focused on the atomic unit of an exercise, while global persistence focuses on the whole course. Section 4 provides more details about the computation of this variable. For computing this variable, all interactions with exercises are needed to know the outcome (correct/incorrect) for each attempt and students’ actions after incorrect attempts. However, lack of details about course context are an important limitation because some contexts do not allow computing local persistence (e.g., students cannot show persistence if only one attempt is allowed in the exercise).
In order to alleviate this limitation, the following filtering criterion was applied: exercises that were only attempted once or twice by all students are removed. Note that if one exercise is not excluded, there might be students (but not all) who got it right at first or second attempt. This rule serve to: (1) eliminate true/false exercise (or exercises with only two possible options), (2) eliminate easy exercises that are always solved correctly with few attempts (they are not useful to show local persistence), and (3) eliminate exercises where only 1–2 attempts are allowed (e.g., a typical policy is allowing one attempt for summative exercises). With these filtering, all exercises had a format and maximum number of attempts that allowed students showing local persistence. Using this criterion, 656 out of 3002 exercises (from 28 SPOCs) were included. If exercises with three attempts at most by all students are also excluded, this number is reduced to just 189, which serves to justify that a threshold of 2 (exercises are excluded if all students had two attempts at maximum) can be suitable for this context.
Apart from global and local persistence, other variables are considered for obtaining students’ profiles (see Section 5.1) and for the predictive analysis (related to O5) to predict global persistence and average grade, which is computed using all the activities of the SPOC. These variables are provided in Table 1, which provides a short list of variables to avoid losing the focus on local persistence, but heterogeneous enough (as it contains variables from activity and interactions with videos and exercises).

3.3. Analytical Methods

The analysis of persistence (global and local) is conducted using two types of analytical methods: descriptive models and predictive models. On the one hand, descriptive models are used to analyze the prevalence of the local persistence and its evolution over time, and to analyze the relationship between local persistence and other variables about students’ behavior and performance. On the other hand, predictive models are used to analyze the possible accuracy when predicting global persistence and students’ performance based on local persistence.
For both analytical methods, R is used, and libraries dplyr and ggplot2 are used for cleaning data and representing information, respectively. For the predictive models, caret library is also used to develop the models. Particularly, four well-known algorithms are used: Logistic Regression (LR), Random Forest (RF), Support Vector Machines (SVM) and Decision Trees (DT). These algorithms are used for two classification tasks: predicting the global persistence and whether the average grade of exercises is above a threshold (50% in this case, as it is a typical passing rate).
In order to select the best parameters for the models and evaluate the performance, 10-fold cross-validation is used. The metric used to evaluate the models is Area Under the Curve (AUC). This metric indicates the area of the Receive Operating Characteristic (ROC) curve, which shows the relationship between true positive and false positive rates using several threshold settings [6]. Predictive models work better when AUC is higher as AUC means the probability of ranking (i.e., give a probability of the positive class) a randomly positive instance higher than a randomly negative one [39]. AUC is used as is it a widely used metric, generally appropriate for classification problems involving students behaviors [40] and avoids some issues other metrics present in imbalanced datasets [41] (e.g., accuracy can be high even when the model is not good in imbalanced datasets).

4. Description of the Model to Identify Local Persistence

Local persistence in this analysis is related to the extent students keep on trying an exercise until they get it right after doing it wrong. This section focuses on identifying how to model local persistence based on students’ interactions with exercises. The aim is to define an overall indicator of local persistence, although this indicator can be based on the local persistence of individual exercises. A priori, it is possible to say that student local persistence is minimum if s/he never tries the exercise again when s/he gets it wrong (assuming there are no limits in the number of attempts). Similarly, local persistence is maximum if the student always ends up getting the right answer after trying the exercise several times. With this idea of local persistence, it does not matter how the student got the correct answer and/or whether local persistence is good or bad for learning. If a student gets the answers using a trial and error strategy, it will be probably bad for his learning process (learning will be probably superficial), but the student is considered to be persistent because s/he always gets the correct answer (which is our definition of local persistence).
Considering the previous ideas, it is easy to determine when a student is fully persistent at the local level or not. However, the difficulty is how to model the overall local persistence of a student who may sometimes be considered as persistent and sometimes not. For the computation of local persistence, the sequence of attempts and the associated results (grades) are considered. For this model, grades of an exercise can only be 0 or 1. This is because 95% of the rows with course-student-exercise in all the SPOCs analyzed here (see Section 3.1) are only graded with 0–1. This can also be generalizable to several learning environments. The remaining 5% (which can include, e.g., checkbox exercises) has been discretized in 0–1 to be consistent with the rest of the exercises by rounding grades down (e.g., 0.8 is converted to 0). Taking this into account, Table 2 shows some examples of sequences (separating grades of attempts by spaces) and the idea of associated local persistence.
Table 2 shows that although the outcome of the exercise may be the same, the local persistence the student shows in each case is different because in some cases the student tried to do the exercise more times and showed to be more persistent despite the difficulties. Considering this fact, the following assumptions have been made for the model:
  • If students get the answer right in the first attempt, no local persistence is shown because there is not a situation where an answer is incorrect (i.e., there is not a difficulty the student should address) and the student should decide whether attempting the exercise again or not (to show local persistence). However, this fact does not mean that students are not persistent. Therefore, events where the answer is correct in the first attempt are excluded. Similarly, re-attempts of correct exercises are excluded because the student already got the correct answer.
  • Students show more local persistence if they need more attempts to solve the exercise, but they should not be penalized if they solve the exercise with few attempts.
With these assumptions, the aim is to define an indicator of local persistence in the range 0–1 for the learner local persistence. One initial question is how to consider the sequence of attempts of each exercise for the overall value of local persistence. One possible approach is to compute a value of local persistence for each exercise and calculate the average for all of them. The limitation of this approach is that it does not allow weighting the exercises easily so that exercises where the students show more local persistence have a higher weight. For example, in Table 2, a student will get the maximum value of the maximum local persistence (1) in both cases 2 and 3 because s/he has attempted the exercises until getting the correct answer. However, the student “shows” more local persistence in case 3 because s/he needed more attempts and s/he has been persistent after incorrect answers more times. In order to weight the exercises depending on the local persistence showed, local persistence is computed as a single fraction, where the numerator and denominator increase every time the student shows local persistence in each exercise. If more local persistence is shown (e.g., case 3), more units will be added to both numerator and denominator to give more importance to the exercise. This way, this model will increment one unit in the numerator and denominator each time the student attempts an exercise once s/he has got the exercise incorrectly at least once. Equation (1) shows how to compute local persistence. Note that this equation computes the local persistence at student level considering the set of exercises s/he has done (pair “student-set of exercises”), but not for the pair “student-exercise” nor for the triple “student-exercise-attempt”. Thus, there are no values of persistence associated to each exercise, but only an overall local persistence for each student:
L o c a l   P e r s i s t e n c e = i = 1 i = n min ( a t t e m p t s i 1 ,   s t o p ) i = 1 i = n [ min ( a t t e m p t s i 1 , s t o p ) + p e n a l t y · ( 1 g r a d e i ) ]  
Equation (1) contains the following variables:
  • n: Indicates the number of exercises the student has attempted.
  • i: Represents a particular exercise the student has attempted. For example, i = 1 represents the first exercise the student took in the SPOC.
  • a t t e m p t s i : Indicates the total number of times the student tried exercise i. The equation has the term a t t e m p t s i 1 to exclude the first attempt, as no persistence is shown in that time (as the student does not decide whether continue or not after difficulties)
  • g r a d e i : Binary value which indicates whether the student managed to get the correct answer of exercise i ( g r a d e = 1 , the maximum grade) or not ( g r a d e = 0 ). For exercises which may admit partial grades (e.g., checkboxes), g r a d e = 1 if the exercise is totally correct and g r a d e = 0 otherwise.
  • penalty: Variable to penalize when students do not get the correct answer of the exercise. This way, when the answer is correct, the numerator is not changed, but the denominator is increased to decrease the overall value of local persistence. When the answer is correct, as g r a d e = 1 , the penalty is avoided.
  • stop: Represents the maximum number of attempts that can be summed for each exercise. This is used to avoid single exercises with many attempts have a huge weight that may make local persistence to be high even when students never attempt incorrect exercises.
In the equation, there are two values that need to be fixed beforehand, and their values may depend on the specific context. These variables are penalty and stop. The idea of the penalty is that it represents the number of attempts needed to compensate an event of non-persistence so as to make the overall local persistence 0.5. For example, if the penalty is 1, if one student gets 0 in one exercise and 1 in another one in the second attempt (sequence 0–1), local persistence would be 0.5. When choosing this value, one should think that low penalties allow overcoming non-persistent events easily while very high values would require showing very high local persistence to overcome those events. In this case, as most exercises with more than two options are answered with 3 (71%) or 4 (82%) attempts at most, a penalty of 4 was chosen so that non-persistent events are compensated with two exercises with three options at most where the students get the answer in the last attempt. Nevertheless, this value can be context and methodology dependent and can be adapted in each scenario.
With regard to stop, it is used to avoid single exercises having excessive weight in the equation, and it would represent the maximum local persistence that you can show in an exercise (e.g., if stop is 10, an exercise with 10 attempts will have the same contribution into the local persistence as an exercise with 11 attempts, same as with 12 attempts, etc.). In this scenario, stop is set as 10 although results barely affected since only 860 out of 58,217 (1.5%) of exercises have four or more attempts. Nevertheless, it is included as it may be relevant in other courses where there are more open exercises and students may need more attempts to solve the exercises.
Using Equation (1), Table 3 shows the values of accumulated local persistence for the sequences presented in Table 2, together with the attempts and grade for each exercise ( a t t e m p t s i and g r a d e i ). In this table, exercises are supposed to be taken sequentially (ID1, ID2, ID3 and ID4) and local persistence is updated with each exercise, as the set of exercises done is updated (i.e., local persistence in row 1 is computed when the student has only done exercise 1, in row 2 when s/he has done exercises 1 and 2, and so forth). Values show how local persistence is reasonably increased when students attempt incorrect exercises until getting the right answer and decreases when they give in.

5. Results

In this section, the analyses to achieve the objectives stated in Section 1 and the discussion of the results are presented. First, the analysis of the prevalence of local persistence is discussed. Afterwards, the analysis of the evolution of local persistence over time is provided. Next, the relationship between the local persistence and other variables is detailed. Finally, the predictive analysis of dropout and student performance is presented.

5.1. Analysis of Prevalence of Local Persistence

The first question is about how local persistence is distributed among the students in the SPOCs (i.e., prevalence). In order to evaluate this, the model to determine local persistence, presented in Section 4 has been used. Figure 1 provides the histogram of local persistence. This histogram reflects that most of the students had either a fair/moderate local persistence (between 0.3 and 0.7) or the maximum local persistence (local persistence above 0.9). Among the 3062 pairs of course-student where local persistence was considered after filtering exercises, there were 432 cases where the student always got the answer right and thus there was no information about local persistence. From the 2630 remaining cases, 1216 (33%) cases represented students who were occasionally persistent at the local level, i.e., their local persistence was between 0.3 and 0.7. Among those learners, most of them were between 0.4 and 0.5. Moreover, there were 988 (32%) with very high local persistence (above 0.9) while there were only 155 (5%) students with low local persistence (below 0.3). The mean of local persistence was 0.70, and the median was 0.67, which means that many students did not give up when they faced difficulties with an exercise and kept on trying the exercise. The high prevalence of local persistence might be due to the considered context since most exercises did not have many possible options so these types of exercises might have engaged students to make different attempts until they succeed since they knew they could get the correct answer with a relative low effort.
In order to delve into the prevalence of local persistence, several profiles of students were identified. These profiles were identified using the clustering algorithm K-Means and a merged dataset including variables related to interactions with exercises (per_attempt and avg_grade) and videos (per_videos). As not all students interacted with videos and exercises, the merged dataset had 2544 pairs or course-student (after removing the 432 cases with undefined local persistence). Particularly, five profiles (related to five clusters) were identified. The choice of five clusters was made empirically so as to obtain the most visible and clearly distinguishable student profiles. Table 4 provides the average value of the variables in each cluster, and the range between percentile 5 and 95 of local persistence (lp_5_95). The range of values and percentiles of local persistence for each profile can be observed in Figure 2. What follows is a description of each profile:
  • Profile 1 ( n = 307 ). They are the students who most complete videos and attempt exercises on average, and the grade of the exercises they attempt is 0.84 on average, which is good. However, their local persistence is 0.53 on average. This means that they have their exercises right at first attempt many often (67% of times) so their average grade is good, but they are not always persistent at the local level. In fact, from the 33% of exercises they have it wrong at first attempt, they eventually solve correctly 16%, which means that they are persistent at the local level about half of the times.
  • Profile 2 ( n = 594 ). They are students with very high local persistence and average grade in the exercises they try. This means that they want to complete what they start. However, they engage with few exercises and videos on average. Instructors should motivate these students to engage more with the SPOC.
  • Profile 3 ( n = 578 ): They are good students. They have very high local persistence and average grade, which means that they almost always complete the exercises they start. They also complete a significant part of the SPOC on average, although they could engage with more videos/exercises.
  • Profile 4 ( n = 604 ): They are students with medium local persistence (average is 0.52 and most values are between 0.32 a 0.71) and their average grade is 0.86, which is good. They engage with about 40% of videos and exercises. Therefore, this is a group of average students, which engage with parts of the SPOC and get many exercises right at first attempt (69% on average), but they may not care so much about getting everything correct if their average grade is high. They are similar to Profile 1, although they engage with less part of the SPOC on average.
  • Profile 5 ( n = 461 ): They are the most critical students. Their local persistence is relatively low on average (0.39), and the third quartile is only 0.5. Moreover, these students only engage with 16% of videos and exercises of the SPOC. Their average grade is the lowest among all profiles (0.76). These students get 58% of the exercises right at first attempt, but they only eventually complete 72% of the exercises (an additional 14%), which means that they do not usually keep on trying their exercises to get the correct answer. Instructors should try to motivate them to work harder on the SPOC to engage with more activities and complete the exercises they start.
These profiles show that there were very different behaviors in relation to the local persistence. This could motivate the design and development of adaptive tools depending on the different students’ profiles. Moreover, there was a considerable percentage of students with low interactions with very high/low local persistence (profiles 2 and 5). In those cases, local persistence was less significant, particularly for those learners with low local persistence, as they may have been sampling the exercises without the intention to complete them. For other profiles with low-medium local persistence, further work should be done to analyze what kind of interventions could be done to increase their local persistence.

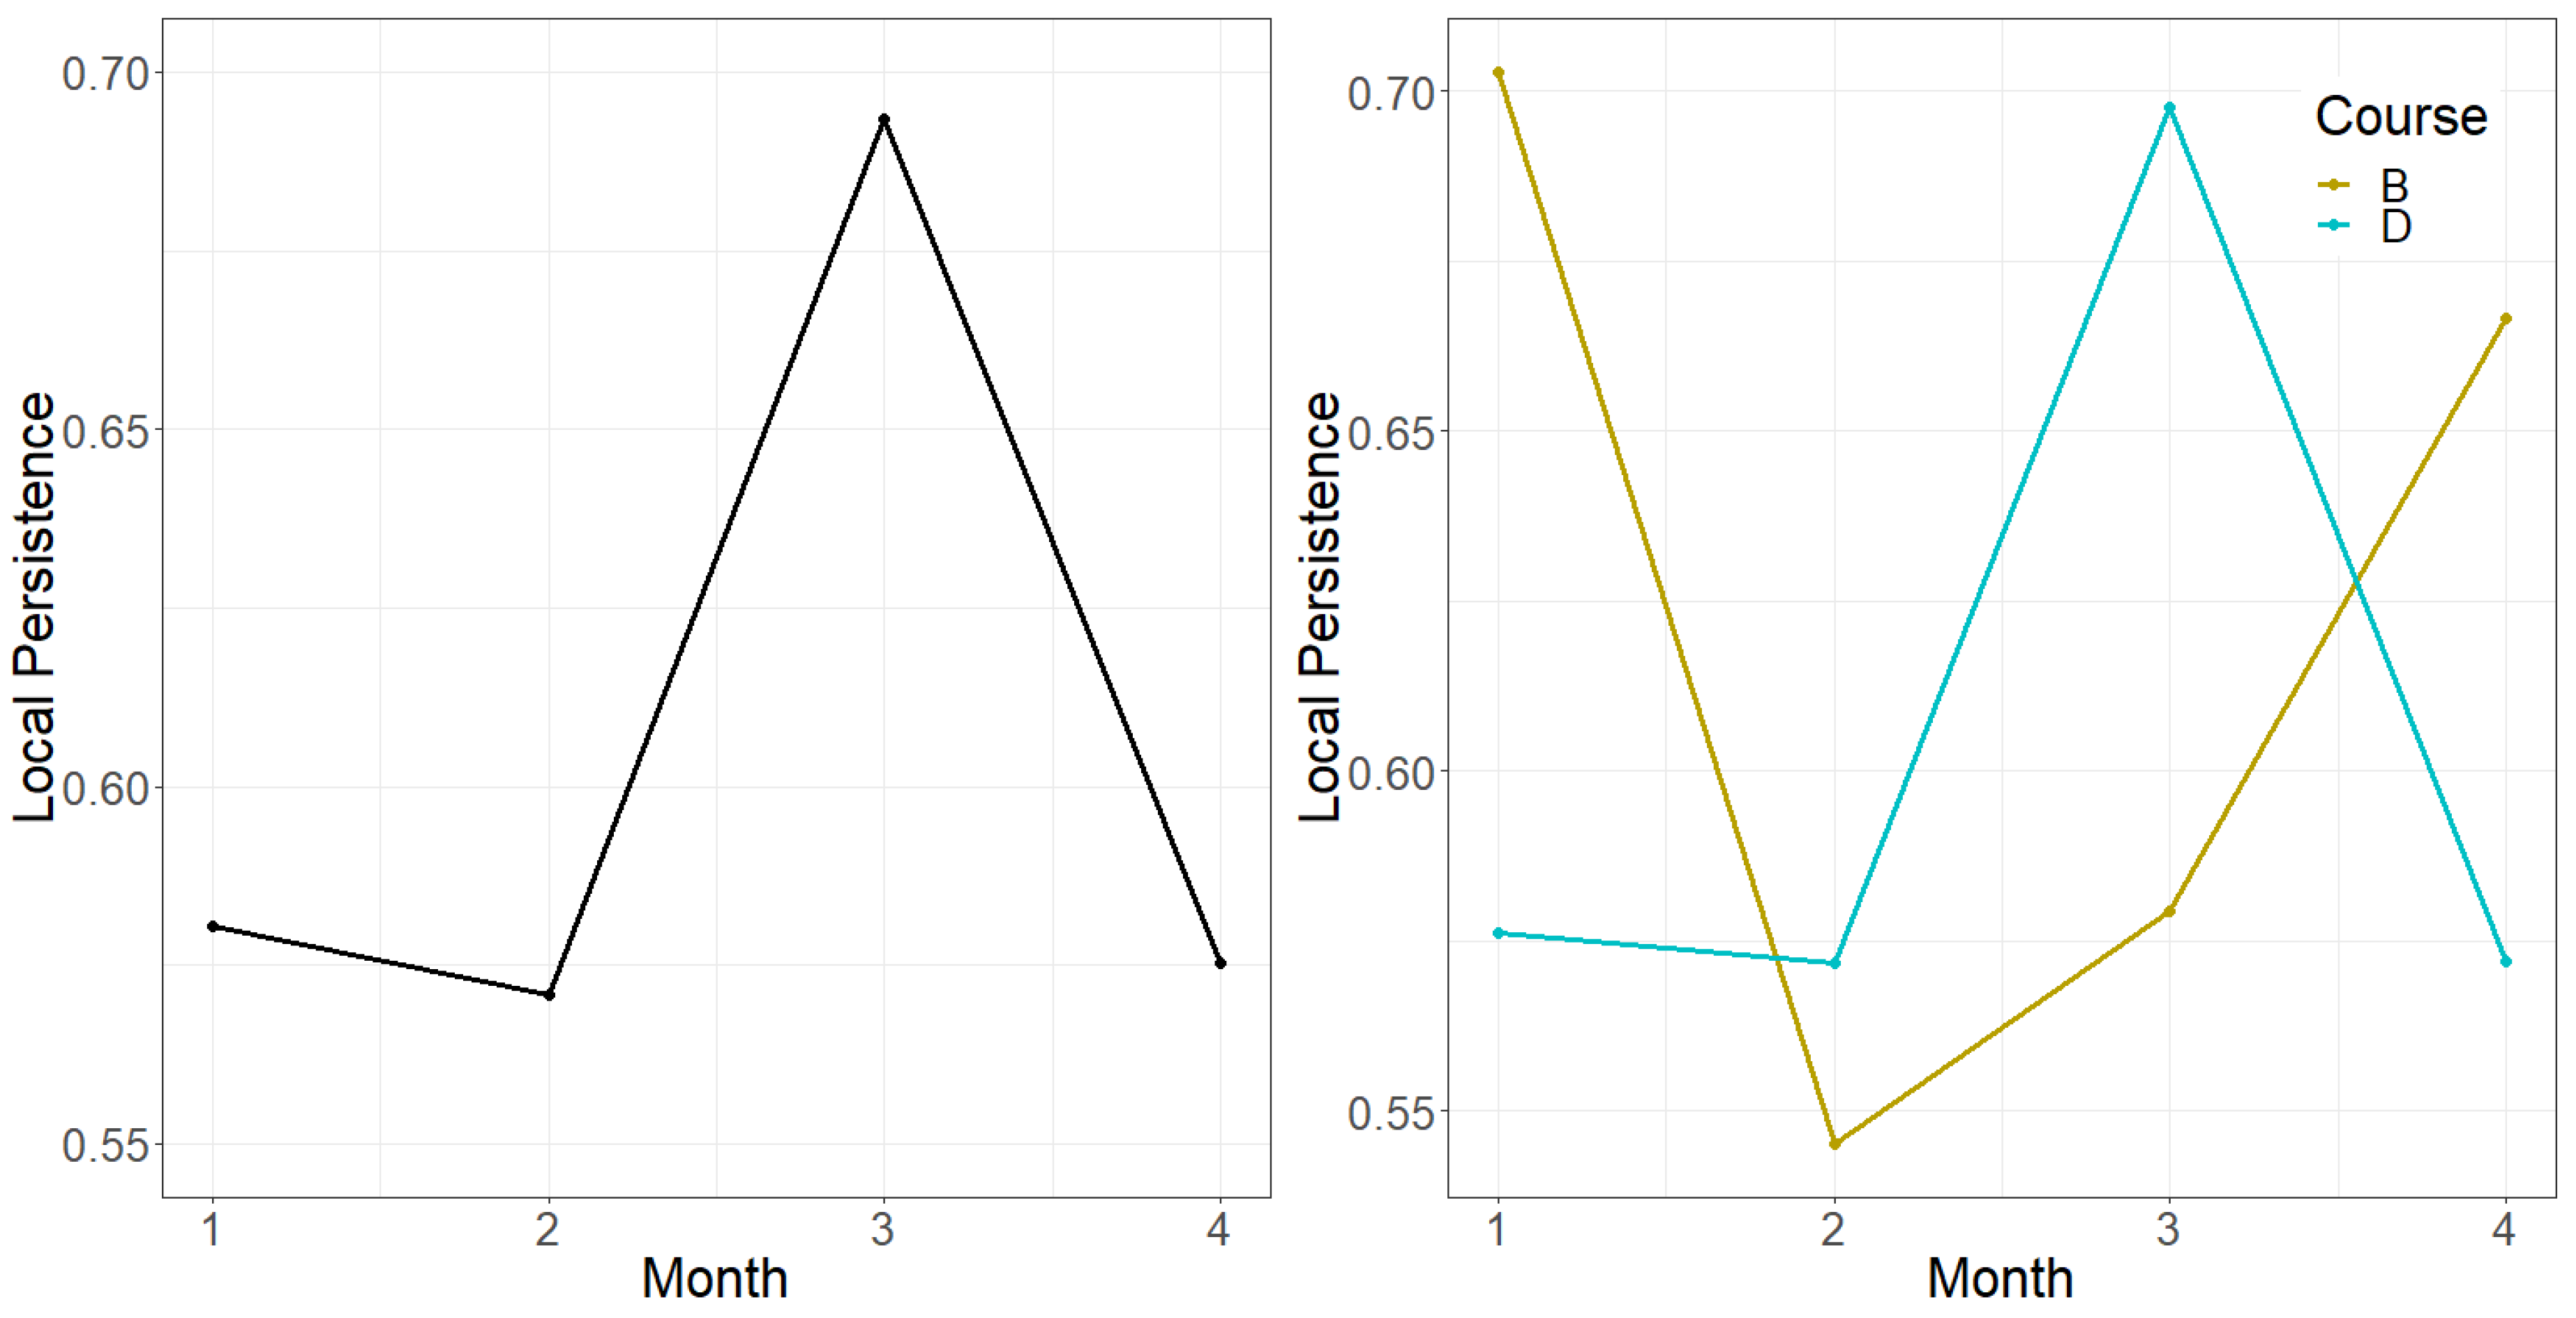
5.2. Analysis of the Evolution of Local Persistence over Time

In the previous section, local persistence was evaluated using all the available interactions. However, it is also relevant to discover whether or not students can be more/less persistent at the local level in some parts of the course. In order to delve into this issue, the evolution of local persistence over the time has been computed. Figure 3 shows the evolution of the local persistence over the 16 weeks of the SPOCs taken in the first semester in 2018/2019. From the 13 SPOCs taken in that semester, only the six in which there were interactions in the first two weeks and in the last two weeks are considered (i.e., SPOCs whose interactions do not comprise the whole semester are excluded), although there can be intermediate weeks where no student attempts the exercises. The rest of them are excluded for this analysis as they are probably designed for a specific part of the course and they do not allow evaluating local persistence during the whole semester.
Figure 3a shows that the local persistence evolves over the time. In fact, the mean of the standard deviation of students’ local persistence over time is 0.24, which implies that there are considerable variations over time. Figure 3 also shows that the local persistence was higher at the beginning of the course and around week 10, but there is not a clear trend of the evolution depending on the time. Moreover, Figure 3b indicates that local persistence can be highly course dependent as the evolution of the local persistence was highly affected by the course. This reinforces the idea that the course context is very important to understand students’ behaviors, as suggested in [26]. Nevertheless, some patterns were also identified. For example, local persistence decreases in most of the courses after the first week, as it also happens in Figure 3a. Furthermore, there were some courses (e.g., E, F) whose local persistence was 1 (or almost 1) for several weeks. In these cases, it may happen that either the exercises of certain modules had a limited number of options, so students eventually got the correct answer, or part of the SPOC was an important part of the evaluation, so students were extrinsically encouraged to be persistent.
Despite the evolution of local persistence seen in Figure 3b, Figure 3c shows that the number of learners interacting with the SPOC (and affecting the computation of local persistence) has significant changes over time. There are some weeks with many students interacting and others where no student interacts (they are represented with in logarithmic scale). This fact can be more related to global persistence, as it is shown that many students are not persistent in their use of the SPOC. While this issue would also require further analysis by instructors to ensure that students engage with the SPOC, this fact can also affect the evolution of local persistence over time as the number of students to compute the local persistence each week is different. In addition, the number of exercises involved in the computation of persistence (after filtering) each week is presented in Figure 3d. This figure also shows that there are significant differences on the number of exercises taken each week between the courses (because of the course design); this fact may also affect the computation of local persistence.
In order to alleviate the issue of different students interacting each week in the computation of weekly local persistence, we took the students who had engaged in all the periods during the semester to analyze the evolution of their local persistence over time. The analysis showed that not many students engaged with the SPOC at least once a month, as only 115 students from only two SPOCs (about 14% of students taking SPOCs in the first semester), B and D, did so. In the rest of the SPOCs, nobody engaged at least once in all months. In fact, out of the 901 students taking SPOCs in the first semester, only 334 engaged with the SPOC at least once in two months and 212 in three out of the four months of the course (September-December, both included). Considering the 115 students who interacted in all months (from courses B and D), Figure 4 shows the evolution of local persistence over months. Results show that even when the students are the same, there are significant changes in local persistence. Moreover, evolution of local persistence over time in course B is totally opposite from course D (which contains most of the 115 students taking either course B or D). These results have two implications: 1) students’ local persistence may evolve over the time, and 2) students’ local persistence can be highly course dependent (i.e., changes in the contents, materials, etc. can affect local persistence). Taking these findings into account, instructors should think about the best design for their courses to ensure that all activities are challenging and engaging enough so that students feel motivated to do their best to get the correct answers.

5.3. Relationship between Local Persistence and Global Persistence, Students’ Performance and Engagement with Videos

Many researchers have analyzed which variables affect dropout [6] and they have proposed predictive models to forecast which learners will drop out the course (e.g., Feng et al. [42]). This fact is particularly relevant because of the high dropout rates usually reported in the courses, or even in the academic programs [43]. The first part of the analysis in this subsection aims to discover if there is a relationship between local persistence and dropout (i.e., global persistence). In this case, dropout is analyzed following the definition of global persistence related to completion (a student has dropped out and s/he is not persistent at the global level if s/he has not completed at least 75% of the exercises of the SPOC). This way, the analysis serves to analyze the relationship between local and global persistence. For this analysis, only the first semester of the academic year 2018/2019 is considered. In order to analyze the relationship between local and global persistence/dropout, a boxplot was made using these two variables (see Figure 5). This figure shows that local persistence of students who do not drop out the course is similar to those who drop out. The mean of local persistence for both groups is 0.71 and 0.68, respectively. The difference of local persistence, evaluated through the Mann-Whitney test, was not statistically significant (p-value = 0.25). This implies that local and global persistence are not necessarily related, and local persistence does not mean completion. A possible reason is because local persistence is only measured with the attempted exercises, and students may try to complete the exercises they attempt (even using brute force if necessary) but they may stop using the SPOC at some point. Another possible reason is that exercises might not be discriminative enough in terms of local persistence because if they have few options to select, students can get the answers by using brute force. Other reasons may be due to the course context, as context can affect local persistence (as seen in Section 5.2, and it matches with Gašević et al. [26]). However, further research should be done to delve into the possible reasons.
After analyzing the relationship between local persistence and dropout, the relationship between the average grade (considering only attempted exercises and all the attempts) and local persistence is presented. Moreover, an analysis of the relationship between the percentage of completed videos and local persistence is presented to discover whether persistent students at the local level also complete the videos or not. In order to analyze these variables, plots were made to relate local persistence and the variables (see Figure 6).
Figure 6a illustrates that the average grade has clear positive relationship with local persistence as the average grade tends to be higher when local persistence is higher. In fact, the Pearson correlation coefficient is 0.55 (p-value <   10 3 , 95% confidence interval between 0.53 and 0.58), which is a moderate correlation, according to Dance and Reidy [44]. While average grade fluctuates more for students with low local persistence, i.e., there can be students with low local persistence with high grades and more variance is presented, students with high local persistence usually achieve good grades. Nevertheless, there are some cases of students with high local persistence but low grades. As the average grade is only computed with attempted exercises, this means that students had a very poor performance on exercises where the number of attempts is limited (which are excluded in the calculation of local persistence but not to compute the average grade). This implies that there may be cases where students can be persistent at the local level by using brute force to solve the exercises, but they are not actually learning, and grade may also not reflect learning. Thus, local persistence does not necessarily mean learning, although it means perseverance. However, the trend is that the average grade is more positive as local persistence increases. This suggests that while local persistence is not crucial for success, it can be beneficial for the student and having good local persistence can lead to high performance, provided that the student reflects on the questions and do not guess the answers to the exercises by brute force. In the latter case, persistence may not have effect on learning unless the student eventually understands why the solution is the option s/he eventually guessed. In order to analyze this issue, further work could be done. For example, a pre-test and post-test can be added to analyze how learning gains are related to persistence, and how possible patterns of using brute force to solve exercises are related to more or less increase in knowledge.
In contrast, when analyzing the relationship between local persistence and percentage of completed videos, Figure 6b show that there is no relationship between both variables, and the correlation is almost 0 (p-value = 0.42 , 95% confidence interval between −0.05 and 0.02), which implies there is no association between the variables. This means that although completing videos is an indicator of perseverance and work in the SPOC, it is not related to local persistence, as defined here in relation to attempts in exercises. There are students that can be very engaged in watching videos but they are not engaged with the exercises and they are not persistent enough (at the local level) to complete them (with correct answers), and there can be other students that use the SPOC to practice with exercises, but they are not interested in watching the videos. Thus, engagement with different course materials can be different, and instructors should highlight the importance of all the parts they want to ensure students actually cover in the SPOC.

5.4. Prediction of Global Persistence and Students’ Performance Using Local Persistence

In the previous section, local persistence was compared to global persistence and students’ performance in a descriptive way. However, it is also interesting to analyze whether or not local persistence can enhance predictive models. In order to solve this question, several predictive models are developed to predict the following dependent variables (see Section 3 for definitions): (1) dropout/global persistence related to activity, (2) dropout/global persistence related to completion, and (3) success, defined as obtaining a grade greater than or equal to 5.0 out of 10 (typical passing rate in Spain). For these dependent variables, three models are developed for each algorithm (from those presented in Section 3.3). The first one includes all the interactions except for local persistence (INT), the second one only includes local persistence (PER) and the third one includes all variables (ALL).
For the variable of local persistence, as it is not defined for all learners (because some students have only engaged in activities with two attempts at maximum and/or they have got all the exercises right), mean imputation with a dummy has been used [45], which is a simple well-known imputation technique (used in many articles, e.g., [45,46]). This consists of having a dummy variable containing 0 or 1 depending on if the local persistence is available, and a second variable with the value of local persistence. If the dummy variable is 0, the second variable contains the mean of local persistence among students. For the analysis, the 13 SPOCs from the first semester of the academic year 2018/2019 are considered. As the course has 16 weeks (from the beginning of September 2018 to mid-December 2018) and it is desirable to achieve the earliest predictions as possible, the analysis contains the evolution of the predictive powers over the 16 weeks of the course. Figure 7 presents the results of the predictive models. Results are presented using the variables introduced in Section 3.3 and algorithms DT and RF, which are the algorithms that achieve the worse and better predictive power (using all variables), respectively. LR and SVM are omitted to make Figure 7 easier to read, but their predictive power is between the ones achieved by DT and RF when using all variables, and it is similar to the one obtained with these algorithms when only persistence is included.
Results from Figure 7 show that it is possible to get accurate predictions (an AUC value over 0.8 can be considered as good [6]) of global persistence/dropout related to completion and success with just five variables (one representing each main category of variables). For these variables, Figure 7 also indicates that it is possible to get very early predictions. It is possible to forecast if students are going to complete 75% of the activities with an AUC over 0.8 (good) from week 3 and an AUC over 0.9 (excellent) from week 6 (Figure 7b). In terms of success, it is possible to predict with AUC over 0.8 from week 1 and over 0.9 from week 5 (Figure 7c). This means that it is possible to obtain early predictions so instructors can identify the problems and try to adapt the contents of the SPOC and/or motivate students to engage with the SPOC more often.
In contrast, the predictive power of the global persistence/dropout related to activity is worse (Figure 7a), and AUC is not even 0.8 at the end of the course. A possible reason lies on the course context. As the context of each course is unknown, there is no information about when students should engage with the SPOC. For example, it may be possible that a SPOC is designed for only a specific part of the course. In that case, students do not need to engage all the weeks and that may cause some students are considered dropouts because they do not engage with the course in the weeks when they do not really need to engage with. This fact entails that the definition of global persistence/dropout needs to be adapted to each context and in this case, a definition related to completion can be better as students should eventually do the activities even when the time framing can differ. Nevertheless, this definition may not be perfect if e.g., some exercises are optional and not all students should engage with them.
With regard to the local persistence, its predictive power by itself (i.e., using only this variable) for the three variables (dropout related to activity, dropout related to completion, and success) is low. It can add some information as the AUC is higher than 0.5 (except for the dropout related to completion) but local persistence is not a strong predictor. When comparing the model with and without local persistence, results show that local persistence only slightly improves the model in some cases (e.g., RF in dropout related to activity), but the improvement is low. However, it is possible that local persistence does not significantly enhance the models because other variables capture most of the information.
In order to analyze this issue, several models have been developed using local persistence with other single variables. These models have been developed using the Random Forest (RF) algorithm, as it the best and most consistent algorithm among the four algorithms when predicting the three dependent variables (according to the previous analysis) and it also outperforms other algorithms in other related papers (e.g., [29,47]). The variables used in each model are presented in Table 5. There is one model for each single variable plus local persistence (and the dummy variable used, as explained before), and a model including all variables. Models have been developed using the data until half of the course (week 8) since the predictive power is good enough at that moment and these models can be used for early predictions. Taking this into account, the importance of variables has been evaluated using the Mean Decrease Gini, which is often used to evaluate importance in RF [48]. The relative importance of each variable in each model for the three dependent variables is presented in Figure 8.
Results show that when predictive models are developed with local persistence plus another variable, local persistence has an important weight in the relative importance, which means that local persistence can be used to improve the predictive models with respect to models with single variables. The only exception is in the case of the models with local persistence and per_attempt (ATT), and particularly when predicting dropout related to completing and success. In these cases, it can be observed that local persistence has little importance (less than 13%, including the dummy variable) on the model. The percentage of attempted exercises is also the best predictor in all the models where it is used, and it has a high relative importance when predicting dropout related to completion and success. This means that completing activities is very important to be successful. In addition, given that these variables are measured in the first half of the course, the high importance of the per_attempt means that the interactions in the first weeks can be critical for the rest of the course, and students who do not interact in the first weeks may not engage in later stages.
However, the fact that per_attempt achieves a high predictive power by itself (e.g., this variable achieves a predictive power of 0.91 when predicting success and dropout related to completion in week 8 with just that variable) may entail that models barely improve when other variables are added to that variable (as happened in Figure 7 with local persistence). Nevertheless, when this variable is omitted (models DAY, VID and AVG), it can be seen that local persistence has a considerable importance, and it can add value to the models. The predictive power of local persistence is not high by itself, but local persistence can be useful when little information is available as it can improve the predictive power (e.g., the predictive power of per_days when predicting dropout related to completion in week 8 is 0.72 and it increases to 0.76 when adding local persistence, and the predictive power of avg_grade when predicting success in week 8 is 0.67 and it increases to 0.71 when adding local persistence), although the improvement is not very high.

6. Conclusions

This work introduces definitions of global and local persistence and presents a novel method to determine students’ local persistence using low-level events. This model can identify the local persistence of a student on the scale 0–1, taking into account if a student keeps on trying an exercise s/he failed until solving it correctly. The model could be used with several educational platforms provided that the number of exercises and attempts on them per student are available. However, this model could be customized if the educational context is known. This model was applied to compute students’ local persistence in 28 SPOC. The analysis of the prevalence of local persistence allows identifying several profiles. Most students have either a fair/moderate local persistence (between 0.3 and 0.7) or a high local persistence (above 0.9). Results allowed identifying two profiles of students with low engagement but with very different values (very high or relatively low) of local persistence. In both groups, students attempt very few exercises; however, in one group students almost always finish what they attempt, unlike in the other group. Instructors should try to motivate students that belong to these two groups so that they complete the activities they attempt. There are also groups in which students get high grades because they get many exercises correct at the first attempt, although they are not persistent at the local level.
The analysis of the evolution of local persistence over time shows that although local persistence is part of students’ personality, it can be highly affected by the course design (in line with what suggested [26,35]) and it can fluctuate over the weeks in a course. This suggests that instructors may need to reflect about the intended local persistence in their course design to try to motivate students to be more persistent, even when the exercises do not have limited options and students may need more effort to solve them.
When local persistence is compared to other variables, results also show that there is no statistically significant difference in terms of local persistence between persistent students at the global level and students who drop out the course. This can happen, e.g., when students attempt few exercises and/or use trial and error strategies. No relationship is found between watching videos and local persistence either. In contrast, the average grade is positively related with local persistence, as also found in [34,35]. However, there are cases where the average grade is low but the local persistence is high, which probably means that students are not learning, but getting the right answers by brute force instead. For those cases, educators should try make students reflect after each attempt so that they can learn from their mistakes and try to use these to get to the correct answer. For example, feedback messages could be provided after incorrect answers to make students reflect and/or the exercise could be blocked for a while (e.g., a few minutes) to give student time to think about how to solve the exercise. In any case, it would also be important that educators would encourage their students to complete all the exercises to grasp the course contents.
In addition, local persistence can slightly improve predictive models. When predicting global persistence/dropout and average grade, the percentage of attempted exercises is a prominent variable (as it also happened in [29]) and can achieve good results by itself. This limits the predictive power of other variables. However, when the percentage of attempted exercises is not used, local persistence can add certain value to the models. Predictive models also show that accurate early predictions can be achieved in the first weeks of the course. This would allow instructors to make decisions that can have an impact on learners. Global persistence related to activity is an exception for these early predictions.
The lessons learned from this research can be useful for educational technology researchers or designers of learning analytics solutions. These stakeholders will be able to use the definition of local persistence proposed in this paper (or an adapted version if needed) when they design a learning analytics dashboard to provide information to students and teachers (e.g., profiles based on local persistence) and can also make some personalization decisions based on the conducted analyses (e.g., personalizing depending on the clusters of students obtained). In addition, results of the predictive analysis can provide insights to be used when designing early warning systems to alert students at-risk of dropout or failure. While these results are directly applicable to learning analytics designers, they can also indirectly benefit teachers and students, as learning analytics systems will be designed targeting students (e.g., showing information about students’ behaviors and possible risks of dropout).
This research has also some limitations that are worth mentioning. First, the results obtained might be tied to the specific context. In our case, the typology and maximum number of attempts for each specific exercise are unknown. This is a very important limitation because for example, it is easier to be persistent (at the local level) when exercises have a limited set of answers (e.g., multiple-choice questions) than in open-ended questions (e.g., numeric answer). Indeed, in our case, most exercises have a limited number of answers so this could explain higher values of local persistence. For this analysis, some filters are included to alleviate this issue, but the ideal case would be having information about this. In addition, the limitation on the number of possible answers entailed that persistence could not be calculated for many of the learners, which limited the analysis and the use of local persistence in predictive models (as imputation had to be used for missing values in several students). Furthermore, another limitation is related to the way local persistence is computed. As local persistence is a subjective characteristic of students, several ways to measure it could be presented, and each one could have its advantages and disadvantages. The measure in this paper can give an idea of how persistent the student is in the exercises s/he has done, but for example, it does not consider what s/he has not done, and the model does not take into account how the exercises are solved (e.g., a trial and error strategy is a bad strategy). While the last limitation is out of the scope of this article, it would also be interesting to analyze it in future models.
As future work, in relation to the aforementioned limitations, it would be relevant to analyze local persistence in educational platforms where information about the context and methodology is known. Furthermore, it could be possible to add a corrective factor for non-attempted exercises and exercises where there is no reflection between attempts (e.g., elapsed time between attempts is very short). In addition, it would be relevant to use the model in courses where students may usually need more attempts and grades are not typically binary (0/1). Moreover, it would be interesting to delve into the profiles of local persistence. For example, it would be interesting to include other variables, such as the type of resources, in the clustering analysis to discover whether different students can be more persistent at the local level in different kinds of activities. In addition, the analysis of the evolution of local persistence of time could be extended by analyzing longer periods than a week and using sliding windows of time. Furthermore, a more detailed analysis could be done to explore the relationship between local persistence and other variables related to students’ behaviors and performance, and the types of exercises/resources. Finally, it would also be important to analyze which factors can increase/decrease persistence (at the global and at the local levels) and provide instructors information about the persistence so that they can analyze possible interventions that can enhance students’ persistence and see if that can have a positive effect on their overall learning.

Author Contributions

Conceptualization, P.M.M.-M., P.J.M.-M., C.A.H., and C.D.K.; methodology, P.M.M.-M., P.J.M.-M., and C.A.-H.; software, P.M.M.-M.; validation, P.M.M.-M., P.J.M.-M., and C.A.-H.; formal analysis, P.M.M.-M., P.J.M.-M., and C.A.-H.; investigation, P.M.M.-M., P.J.M.-M., and C.A.-H.; resources, P.M.M.-M.; data curation, P.M.M.M.; writing—original draft preparation, P.M.M.-M.; writing—review and editing, P.M.M.-M., P.J.M.-M., C.A.-H., and C.D.K.; visualization, P.M.M.-M.; supervision, P.J.M.-M., C.A.-H., and C.D.K..; project administration, P.M.M.-M, and P.J.M.-M..; funding acquisition, P.J.M.-M., and C.D.K. All authors have read and agreed to the published version of the manuscript.

Funding

This work was partially funded by FEDER/Ministerio de Ciencia, Innovación y Universidades – Agencia Estatal de Investigación/project Smartlet (TIN2017-85179-C3-1-R), and by the Madrid Regional Government, through the project e-Madrid-CM (S2018/TCS-4307). The latter is also co-financed by the Structural Funds (FSE and FEDER). This work received also partial support by Ministerio de Ciencia, Innovación y Universidades, under an FPU fellowship (FPU016/00526).

Conflicts of Interest

The authors declare no conflict of interest. The funders had no role in the design of the study; in the collection, analyses, or interpretation of data; in the writing of the manuscript, or in the decision to publish the results.

References

  1. Mikulecký, P. Smart Environments for Smart Learning. In Proceedings of the 9th International Scientific Conference on Distance Learning and Applied Informatics, Sturovo, Slovakia, 2–4 May 2012; pp. 213–222. [Google Scholar]
  2. Verbert, K.; Duval, E.; Klerkx, J.; Govaerts, S.; Santos, J.L. Learning Analytics Dashboard Applications. Am. Behav. Sci. 2013, 57, 1500–1509. [Google Scholar] [CrossRef] [Green Version]
  3. Feng, M.; Heffernan, N.; Koedinger, K. Student modeling in an intelligent tutoring system. In Intelligent Tutoring Systems in E-Learning Environment: Design Implementation and Evaluation, 1st ed.; Stankov, S., Glavinić, V., Rosić, M., Eds.; IGI Global: Hershey, PA, USA, 2011; pp. 208–236. [Google Scholar]
  4. Spector, J.M. Conceptualizing the emerging field of smart learning environments. Smart Learn. Environ. 2014, 1, 2. [Google Scholar] [CrossRef] [Green Version]
  5. Hwang, G.J. Definition, framework and research issues of smart learning environments-a context-aware ubiquitous learning perspective. Smart Learn. Environ. 2014, 1, 4. [Google Scholar] [CrossRef]
  6. Moreno-Marcos, P.M.; Alario-Hoyos, C.; Muñoz-Merino, P.J.; Delgado Kloos, C. Prediction in MOOCs: A review and future research directions. IEEE Trans. Learn. Technol. 2019, 12, 384–401. [Google Scholar] [CrossRef]
  7. Muenks, K.; Wigfield, A.; Yang, J.S.; O’Neal, C.R. How True is Grit? Assessing Its Relations to High School and College Students’ Personality Characteristics, Self—Regulation, Engagment, and Achievement. J. Educ. Psychol. 2017, 109, 599–620. [Google Scholar] [CrossRef]
  8. Kuh, G.D.; Crue, T.M.; Shoup, R.; Kinzie, J.; Gonyea, R.M. Unmasking the effects of student engagement on first-year college grades and persistence. J. High. Educ. 2008, 79, 540–563. [Google Scholar] [CrossRef]
  9. Tinto, V. Reflections on student persistence. Stud. Success 2017, 8, 1–8. [Google Scholar] [CrossRef] [Green Version]
  10. Kimbark, K.; Peters, M.L.; Richardson, T. Effectiveness of the student success course on persistence, retention, academic achievement, and student engagement. Community Coll. J. Res. Pract. 2017, 41, 124–138. [Google Scholar] [CrossRef]
  11. Whitehill, J.; Mohan, K.; Seaton, D.; Rosen, Y.; Tingley, D. Delving deeper into MOOC student dropout prediction. arXiv 2017, arXiv:1702.06404. Available online: https://arxiv.org/pdf/1702.06404.pdf (accessed on 28 February 2020).
  12. Crues, R.W.; Henricks, G.M.; Perry, M.; Bhat, S.; Anderson, C.J.; Shaik, N.; Angrave, L. How do gender, learning goals, and forum participation predict persistence in a computer science MOOC? ACM Trans. Comput. Educ. 2018, 18, 18. [Google Scholar] [CrossRef]
  13. Silvervarg, A.; Haake, M.; Gulz, A. Perseverance Is Crucial for Learning. “OK! But Can I Take a Break?”. In Proceedings of the 19th International Conference on Artificial Intelligence in Education, London, UK, 27–30 June 2018; pp. 532–544. [Google Scholar]
  14. Eley, D.S.; Leung, J.; Hong, B.A.; Cloninger, K.M.; Cloninger, C.R. Identifying the dominant profiles in medical students: Implications for their well-being and resilience. PLoS ONE 2016, 11, e0160028. [Google Scholar] [CrossRef] [Green Version]
  15. Young, M.R. The Motivational Effects of the Classroom Environment in Facilitating Self-Regulated Learning. J. Mark. Educ. 2005, 27, 25–40. [Google Scholar] [CrossRef]
  16. Chase, C.C. Motivating expertise: Equipping novices with the motivational tools to move beyond failure. In Expertise and Skill Acquisition: The Impact of William G Chase, 1st ed.; Staszewski, J.J., Ed.; Pshychology Press: New York, NY, USA, 2013; pp. 59–84. [Google Scholar]
  17. Csikszentmihalyi, M. Flow: The Psychology of Optimal Experience: Finding Flow, 1st ed.; Harper Collins: New York, NY, USA, 1990. [Google Scholar]
  18. Moreno-Marcos, P.M.; Muñoz-Merino, P.J.; Alario-Hoyos, C.; Delgado Kloos, C. Analyzing Students’ Persistence using an Event-Based Model. In Proceedings of the Learning Analytics Summer Institute Spain 2019, Vigo, Spain, 27–28 June 2019; pp. 56–70. [Google Scholar]
  19. Figueroa-Cañas, J.; Sancho-Vinuesa, T. Predicting Early Dropout Students is A Matter of Checking Completed Quizzes: The Case of An Online Statistics Module. In Proceedings of the Learning Analytics Summer Institute Spain 2019, Vigo, Spain, 27–28 June 2019; pp. 100–111. [Google Scholar]
  20. Kizilcec, R.F.; Cohen, G.L. Eight-minute self-regulation intervention raises educational attainment at scale in individualist but not collectivist cultures. Proc. Natl. Acad. Sci. USA 2017, 114, 4348–4353. [Google Scholar] [CrossRef] [PubMed] [Green Version]
  21. Deschacht, N.; Goeman, K. The effect of blended learning on course persistence and performance of adult learners: A difference-in-difference analysis. Comput. Educ. 2015, 87, 83–89. [Google Scholar] [CrossRef]
  22. Van Houtte, M.; Demanet, J. Teachers’ beliefs about students, and the intention of students to drop out of -secondary education in Flanders. Teach. Teach. Educ. 2016, 54, 117–127. [Google Scholar] [CrossRef]
  23. Roso-Bas, F.; Jiménez, A.P.; García-Buades, E. Emotional variables, dropout and academic performance in Spanish nursing students. Nurse Educ. Today 2016, 37, 53–58. [Google Scholar] [CrossRef]
  24. Dillon, J.; Bosch, N.; Chetlur, M.; Wanigasekara, N.; Ambrose, G.A.; Sengupta, B.; D’Mello, S.K. Student Emotion, Co-Ocurrence, and Dropout in a MOOC Context. In Proceedings of the 9th International Conference on Educational Data Mining, Raleigh, NC, USA, 29 June–2 July 2016; pp. 353–357. [Google Scholar]
  25. Burgos, C.; Campanario, M.L.; de la Pena, D.; Lara, J.A.; Lizcano, D.; Martínez, M.A. Data mining for modeling students’ performance: A tutoring action plan to prevent academic dropout. Comput. Electr. Eng. 2018, 66, 541–556. [Google Scholar] [CrossRef]
  26. Gašević, D.; Dawson, S.; Rogers, T.; Gasevic, D. Learning analytics should not promote one size fits all: The effects of instructional conditions in predicting academic success. Internet High. Educ. 2016, 28, 68–84. [Google Scholar] [CrossRef] [Green Version]
  27. Jiang, F.; Li, W. Who Will Be the Next to Drop Out? Anticipating Dropouts in MOOCs with Multi-View Features. Int. J. Perform. Eng. 2017, 13, 201–210. [Google Scholar] [CrossRef]
  28. Márquez-Vera, C.; Cano, A.; Romero, C.; Noarman, A.Y.M.; Mousa Fardoun, H.; Ventura, S. Early dropout prediction using data mining: A case study with high school students. Experts Syst. 2016, 33, 107–124. [Google Scholar] [CrossRef]
  29. Moreno-Marcos, P.M.; Muñoz-Merino, P.J.; Maldonado-Mahauad, J.; Pérez-Sanagustín, M.; Alario-Hoyos, C.; Delgado Kloos, C. Temporal analysis for dropout prediction using self-regulated learning strategies in self-paced MOOCs. Comput. Educ. 2020, 145, 103728. [Google Scholar] [CrossRef]
  30. Chen, G.; Davis, D.; Hauff, C.; Houben, G.J. On the Impact of Personality in Massive Open Online Learning. In Proceedings of the 24th Conference on User Modeling, Adaptation and Personalization, Halifax, Canada, 13–17 July 2016; pp. 121–130. [Google Scholar]
  31. Moreno-Marcos, P.M.; Alario-Hoyos, C.; Muñoz-Merino, P.J.; Estévez-Ayres, I.; Delgado Kloos, C. Sentiment Analysis in MOOCs: A Case Study. In Proceedings of the 2018 IEEE Global Engineering Education Conference, Santa Cruz de Tenerife, Spain, 17–20 April 2018; pp. 1489–1496. [Google Scholar]
  32. Chen, X.; Vorvoreanu, M.; Madhavan, K. Mining Social Media data for understanding students’ learning experiences. IEEE Trans. Learn. Technol. 2014, 7, 246–259. [Google Scholar] [CrossRef]
  33. Lufi, D.; Cohen, A. A scale for measuring persistence in children. J. Pers. Assess. 1987, 51, 178–185. [Google Scholar] [CrossRef] [PubMed]
  34. Scherer, R.; Gustafsson, J.E. The relations among openness, perseverance, and performance in creative problem solving: A substantive-methodological approach. Think. Ski. Creat. 2015, 18, 4–17. [Google Scholar] [CrossRef]
  35. Farrington, C.A.; Roderick, M.; Allensworth, E.; Nagaoka, J.; Keyes, T.S.; Johnson, D.W.; Beechum, N.O. Teaching Adolescents to Become Learners: The Role of Noncognitive Factors in Shaping School Performance—A Critical Literature Review, 1st ed.; The University of Chicago Consortium on Chicago School Research: Chicago, IL, USA, 2012. [Google Scholar]
  36. Ventura, M.; Shute, V.; Zhao, W. The relationship between video game use and a performance-based measure of persistence. Comput. Educ. 2013, 60, 52–58. [Google Scholar] [CrossRef]
  37. Fox, A. From MOOCs to SPOCs. Commun. ACM 2013, 56, 38–40. [Google Scholar] [CrossRef]
  38. EdX Research Guide. Available online: https://media.readthedocs.org/pdf/devdata/latest/devdata.pdf (accessed on 24 November 2019).
  39. Fawcett, T. An introduction to ROC analysis. Pattern Recognit. Lett. 2006, 27, 861–874. [Google Scholar] [CrossRef]
  40. Pelánek, R. Metrics for evaluation of student models. J. Educ. Data Min. 2015, 7, 1–19. [Google Scholar]
  41. Jeni, L.A.; Cohn, J.F.; De La Torre, F. Facing Imbalanced Data—Recommendations for the Use of Performance Metrics. In Proceedings of the 5th International Conference on Affective Computing and Intelligent Interaction, Geneva, Switzerland, 2–5 September 2013; pp. 245–251. [Google Scholar]
  42. Feng, W.; Tang, J.; Liu, T.X. Understanding Dropouts in MOOCs. In Proceedings of the 33rd AAAI Conference on Artificial Intelligence, Honolulu, HI, USA, 27 January–1 February 2019; pp. 517–524. [Google Scholar]
  43. Paura, L.; Arhipova, I. Cause analysis of students’ dropout rate in higher education study program. Procedia Soc. Behav. Sci. 2014, 109, 1282–1286. [Google Scholar] [CrossRef] [Green Version]
  44. Dancey, C.P.; Reidy, J. Statistics without Maths for Psychology, 7th ed.; Pearson Education: New York, NY, USA, 2017. [Google Scholar]
  45. Paul, C.; Mason, W.; McCaffrey, D.; Fox, S.A. What Should We Do About Missing Data? (A Case Study Using Logistic Regression with Missing Data on a Single Covariate). Available online: https://escholarship.org/uc/item/79q4m943 (accessed on 29 December 2019).
  46. Bjelland, I.; Krokstad, S.; Mykletun, A.; Dahl, A.A.; Tell, G.S.; Tambs, K. Does a higher educational level protect against anxiety and depression? The HUNT study. Soc. Sci. Med. 2008, 66, 1334–1345. [Google Scholar] [CrossRef]
  47. Moreno-Marcos, P.M.; De Laet, T.; Muñoz-Merino, P.J.; Van Soom, C.; Broos, T.; Verbert, K.; Delgado Kloos, C. Generalizing predictive models of admission test success based on online interactions. Sustainability 2019, 11, 4940. [Google Scholar] [CrossRef] [Green Version]
  48. Louppe, G.; Wehenkel, L.; Sutera, A.; Geurts, P. Understanding Variable Importances in Forests of Randomized Trees. In Proceedings of the 26th International Conference on Neural Information Processing Systems, Lake Tahoe, NV, USA, 5–10 December 2013; pp. 431–439. [Google Scholar]
Figure 1. Histogram with the prevalence of the local persistence.
Applsci 10 01722 g001
Figure 2. Boxplot of local persistence for each profile.
Applsci 10 01722 g002
Figure 3. (a: top-left) Evolution of the local persistence in the first semester using all the courses, (b: top-right) evolution of the local persistence in the first semester for each course, where each course is a different line, (c: bottom-left) number of students engaging with exercises in each week of the semester for each course, (d: bottom-right) number of exercises students have attempted in each week of the course. Note: Actual names of the courses are omitted for confidentiality reasons.
Applsci 10 01722 g003
Figure 4. (a: left) Evolution of the local persistence of students who engage all months for all courses together and (b: right) for each individual course.
Applsci 10 01722 g004
Figure 5. Boxplot with the relationship between local persistence and dropout.
Applsci 10 01722 g005
Figure 6. Relationship between local persistence and (a: left) average grade, (b: right) % of completed videos.
Applsci 10 01722 g006
Figure 7. Evolution of the predictive power when predicting (a: left) dropout related to activity, (b: middle) dropout related to completion and (c: right) success.
Applsci 10 01722 g007
Figure 8. Relative importance of variables when predicting (a: left) dropout related to activity, (b: middle) dropout related to completion and (c: right) success using different combinations of variables.
Applsci 10 01722 g008
Table 1. Features used in the predictive analysis.
CategoryVariableDescription
Activityper_daysPercentage of days the student has accessed to the platform
Videosper_videosPercentage of completed videos
Exercisesper_attemptPercentage of attempted exercises over the total available
Exercisesavg_gradeAverage grade of exercises (only using attempted exercises and all the attempts)
Persistencelocal_persLocal persistence (Section 4 gives details on how it is computed)
Table 2. Sequence of attempts of difference exercises.
IDSequenceIdea of Local Persistence
10The student is not persistent as s/he does not try the exercise again (after getting 0) in order to get correct answer.
20 1The student shows local persistence as s/he attempts the exercise again to get it right.
30 0 0 0 0 1The student shows local persistence and s/he shows more local persistence than in case 2 as s/he needed a lot of attempts until getting the answer right.
40 0 0 0 The student shows certain local persistence as s/he has tried the exercise several times, but s/he has not got the correct answer. Local persistence should be greater than in case 1 but smaller than in cases 2 and 3.
Table 3. Example of computation of local persistence.
IDSequenceAttemptsGradeLocal Persistence (Accumulated)
1010 0 / 4 = 0
20 121 ( 0 + 1 ) / ( 4 + 1 ) = 1 / 5   =   0.2
30 0 0 0 0 161 ( 0 + 1 + 5 ) / ( 4 + 1 + 5 )   =   6 / 10   =   0.6
40 0 0 0 40 ( 0 + 1 + 5 + 3 ) / ( 4 + 1 + 5 + 7 )   =   9 / 17   =   0.53
Table 4. Students’ profiles based on their local persistence and interactions with videos/exercises.
ProfileNo. Students (%)Local_PersPer_AttemptPer_VideosAvg_Gradelp_5_95
1307 (12%)0.530.620.620.840.33–0.77
2594 (23%)0.960.160.160.940.71–1.00
3578 (23%)0.950.500.500.960.73–1.00
4604 (24%)0.520.400.400.860.32–0.71
5461 (18%)0.390.160.160.760.00–0.60
Table 5. Models used in the predictive analysis.
NameVariables
ALLper_days/per_videos/avg_grade/per_attempt/local_pers (+dummy variable)
DAYper_days/local_pers (+dummy variable)
ATTper_attempt/local_pers (+dummy variable)
VIDper_videos/local_pers (+dummy variable)
AVGavg_grade/local_pers (+dummy variable)

