Shear Tests of Deep Hollow Core Slabs Strengthened by Core-Filling


Abstract
1. Introduction
- Investigating the shear reinforcing effect of core-filling concrete.
- Identifying the effects of shear reinforcement placed in core-filling concrete.
- Investigating the composite action between the PHCS unit and core-filling concrete by observing their shear crack patterns.
- Developing a simple equation to accurately estimate the shear strengths of PHCS reinforced by the core-filling method.
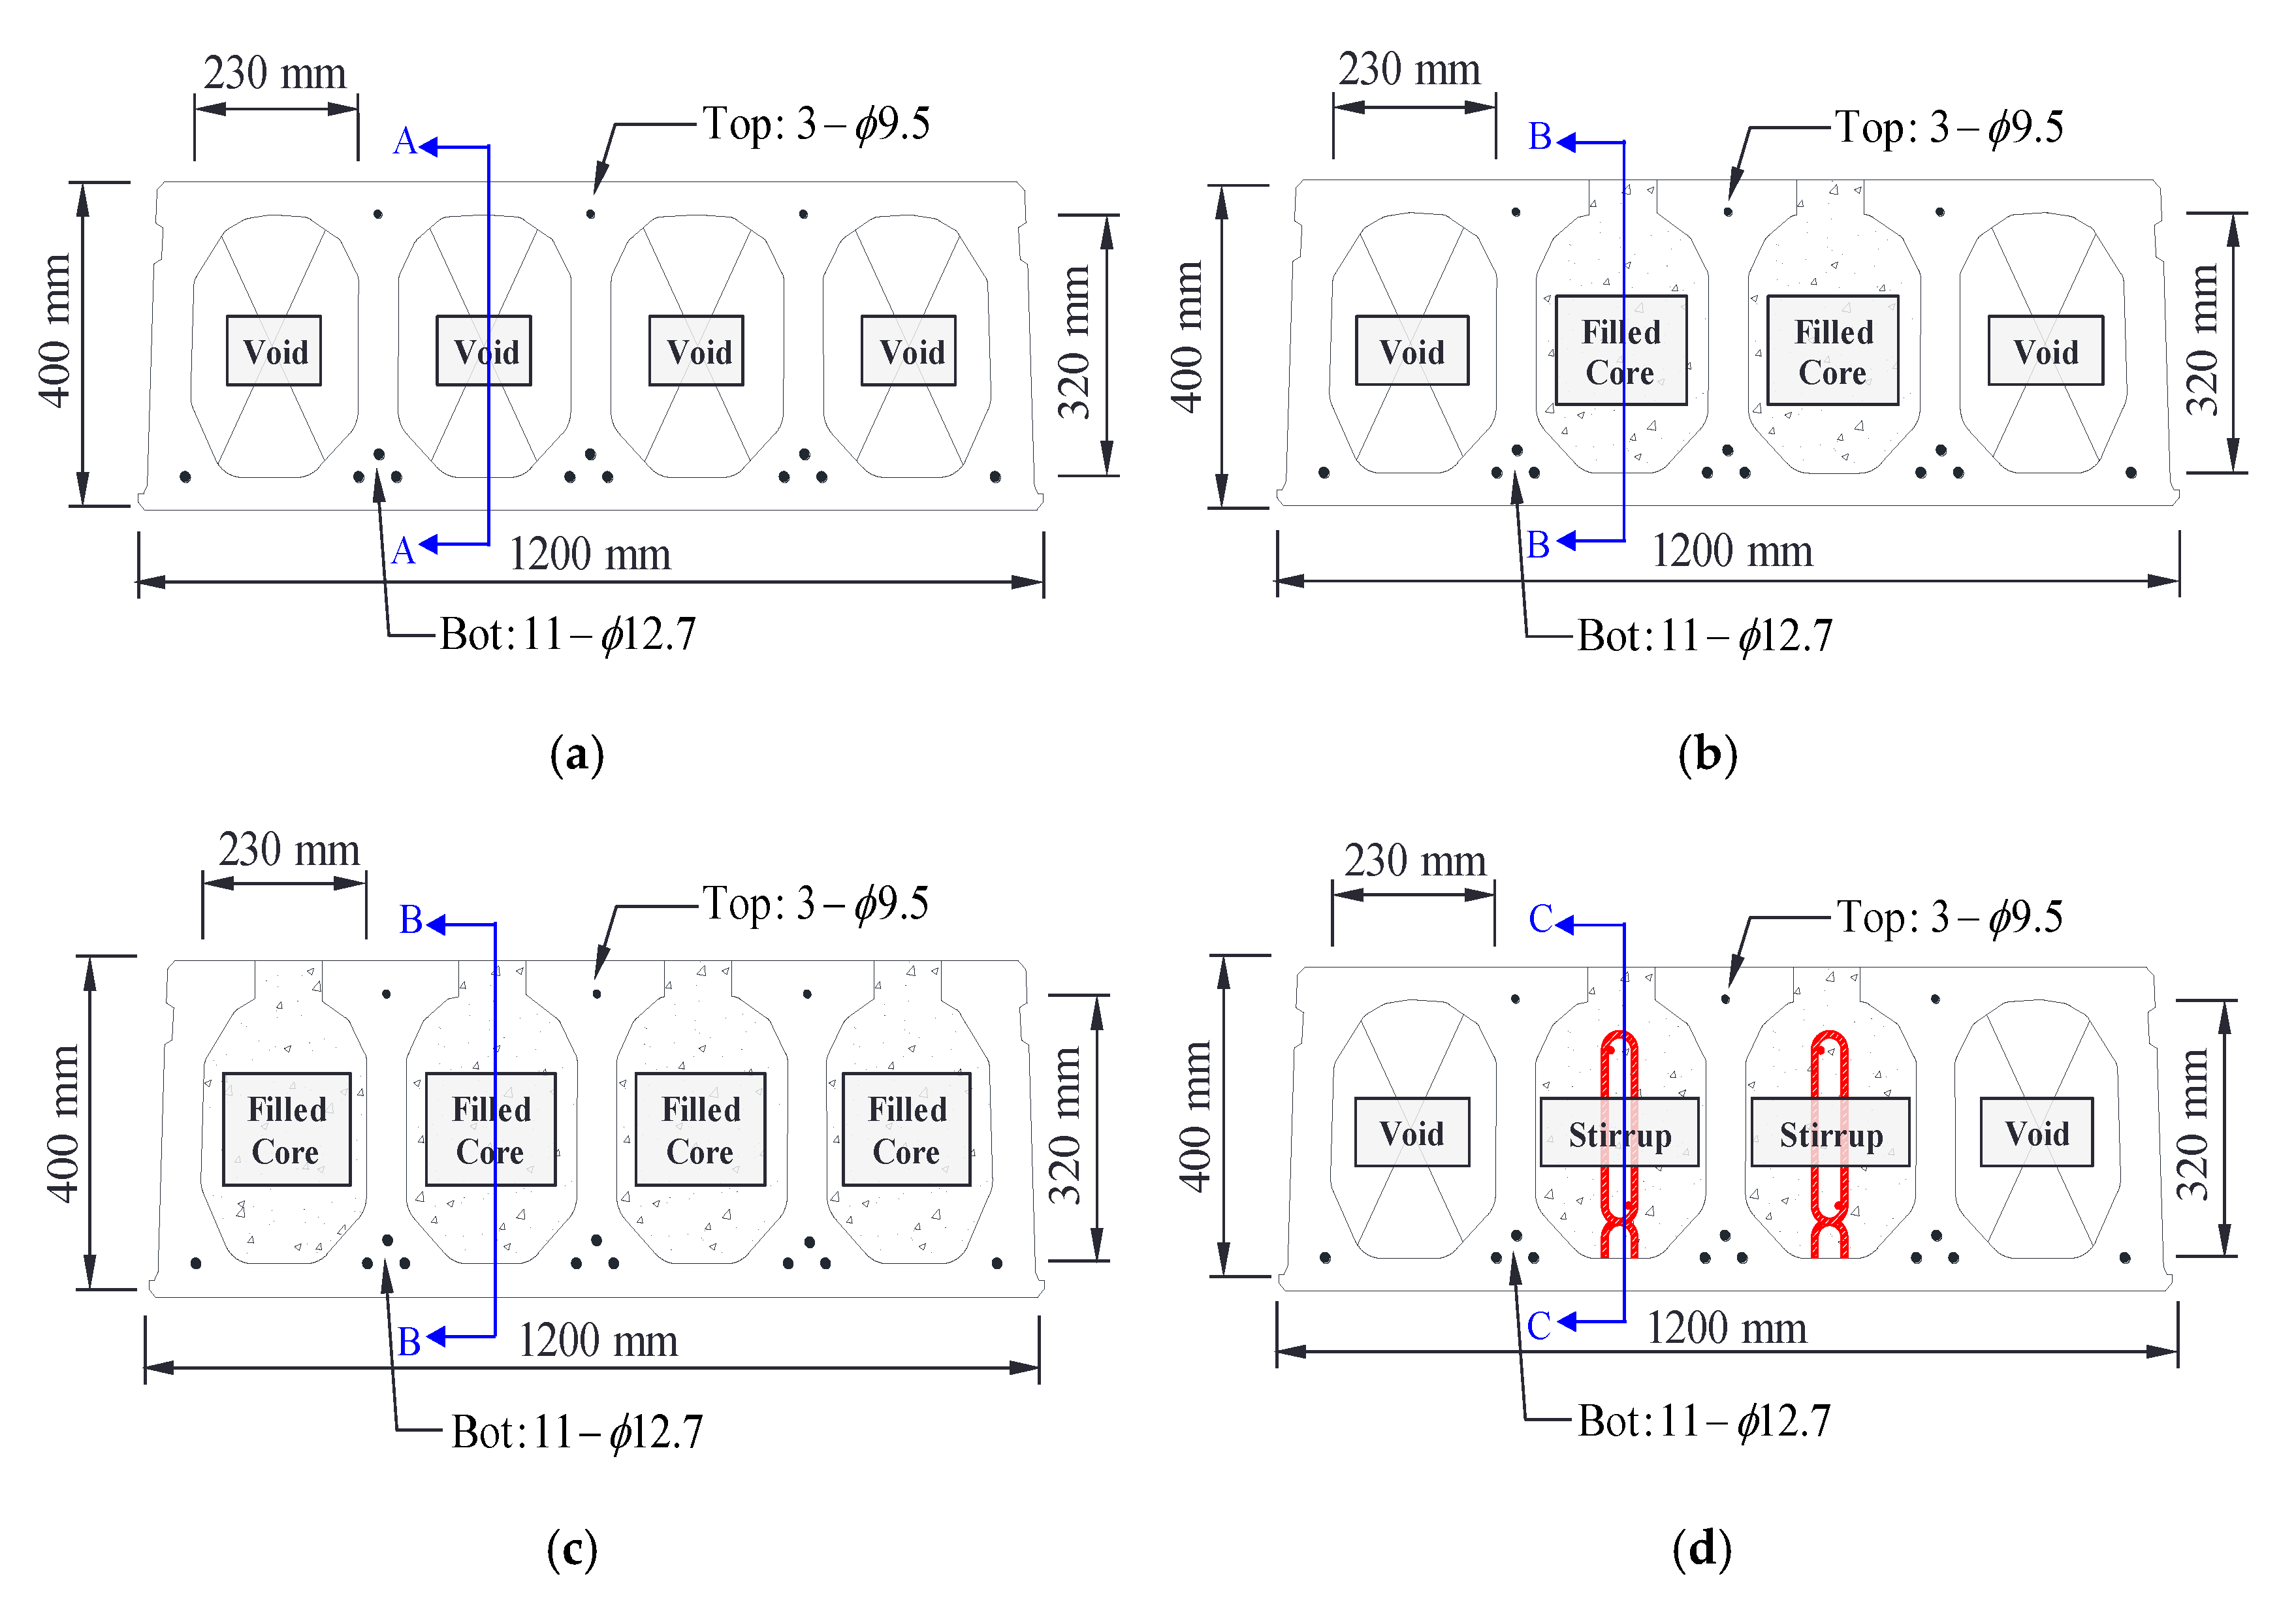
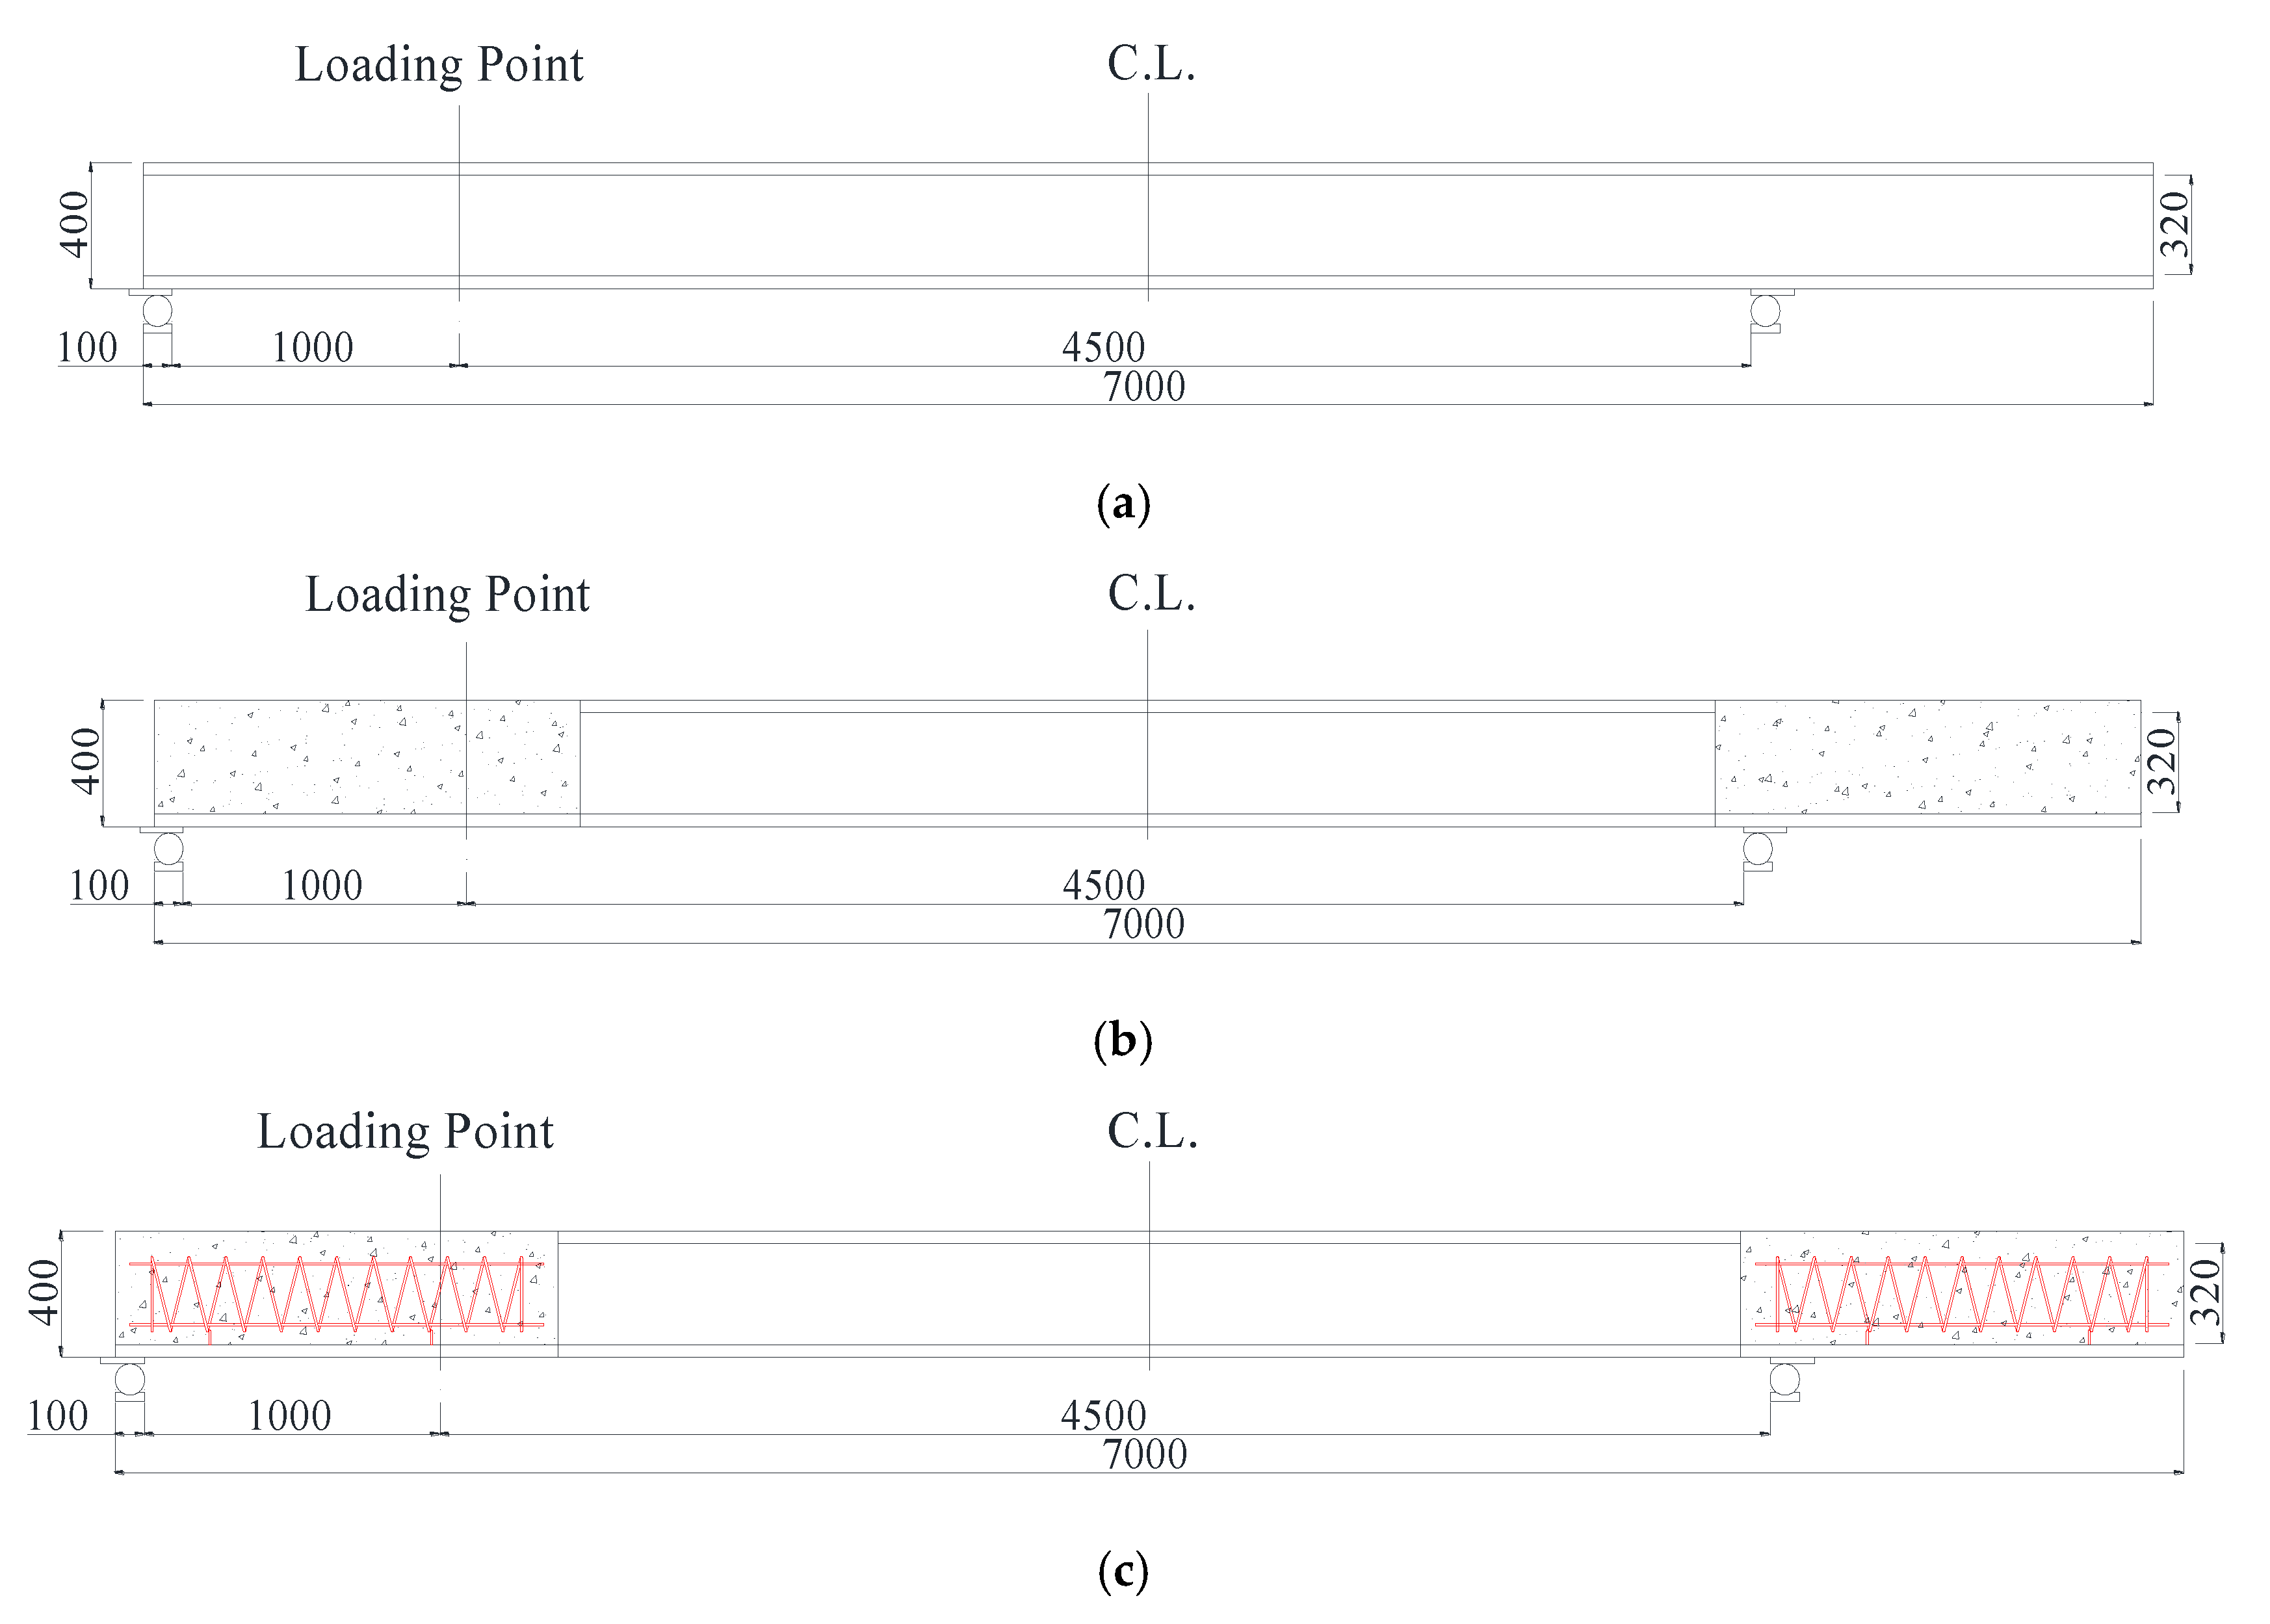
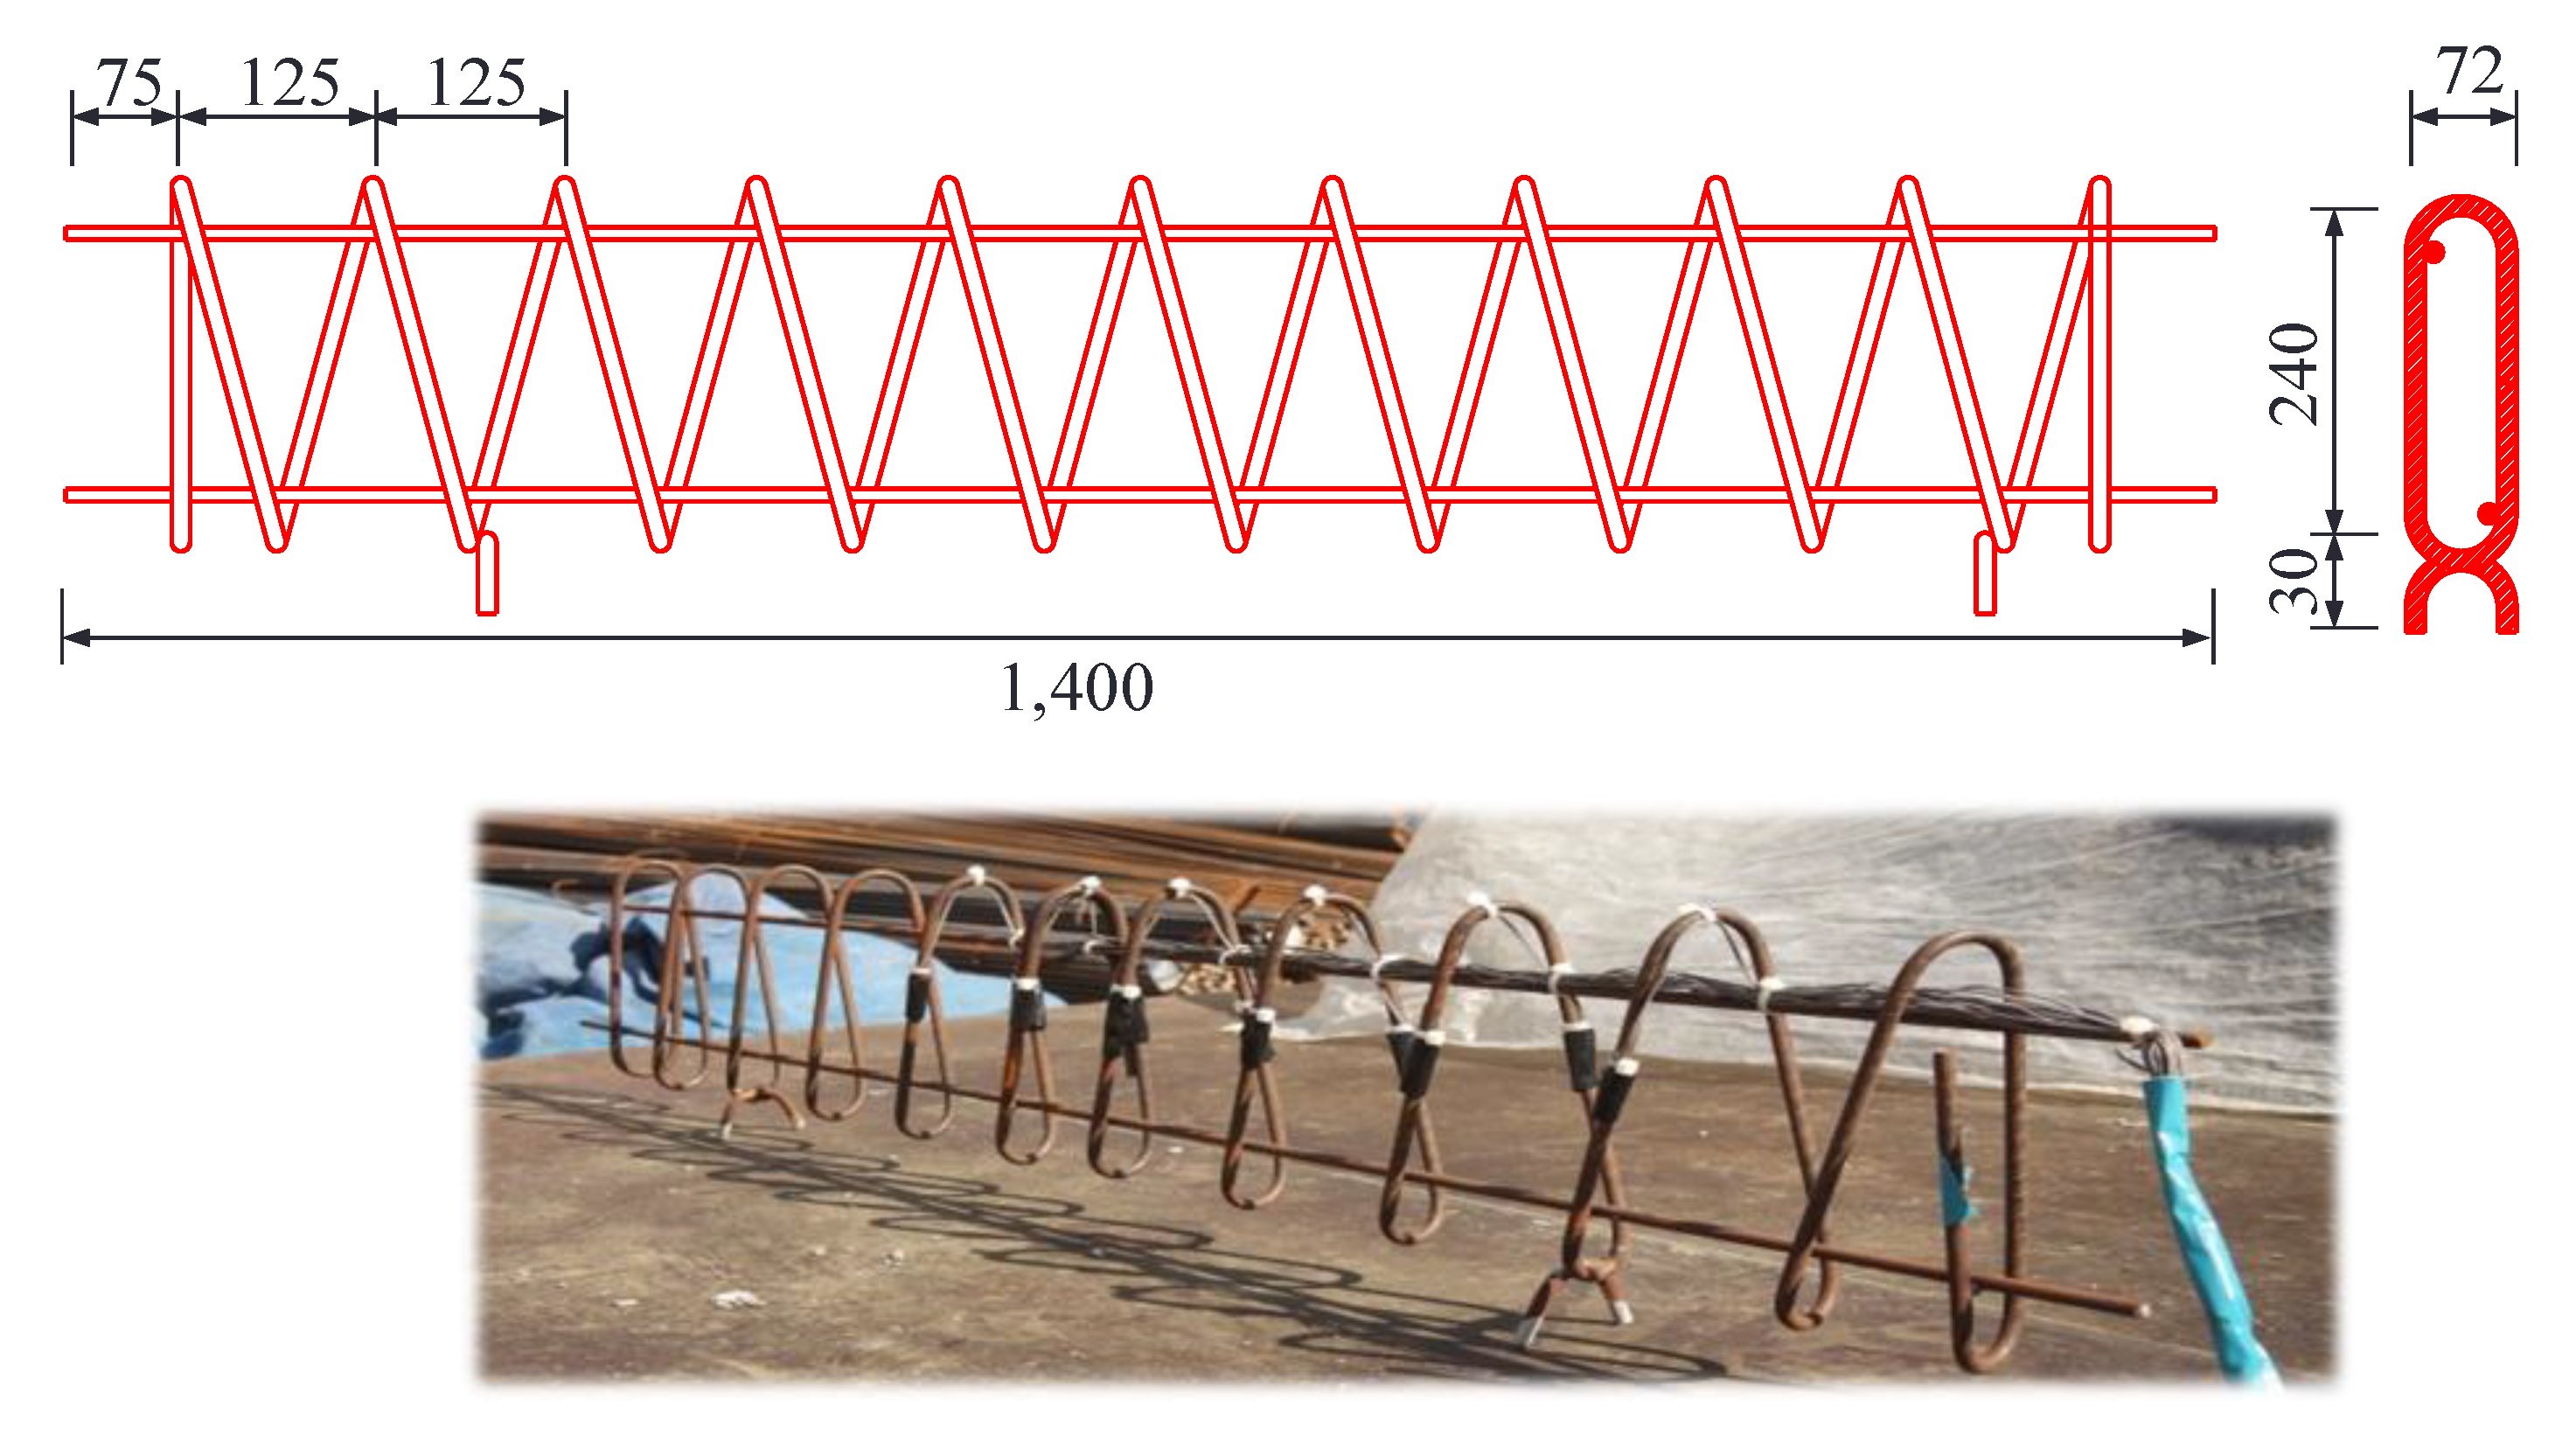
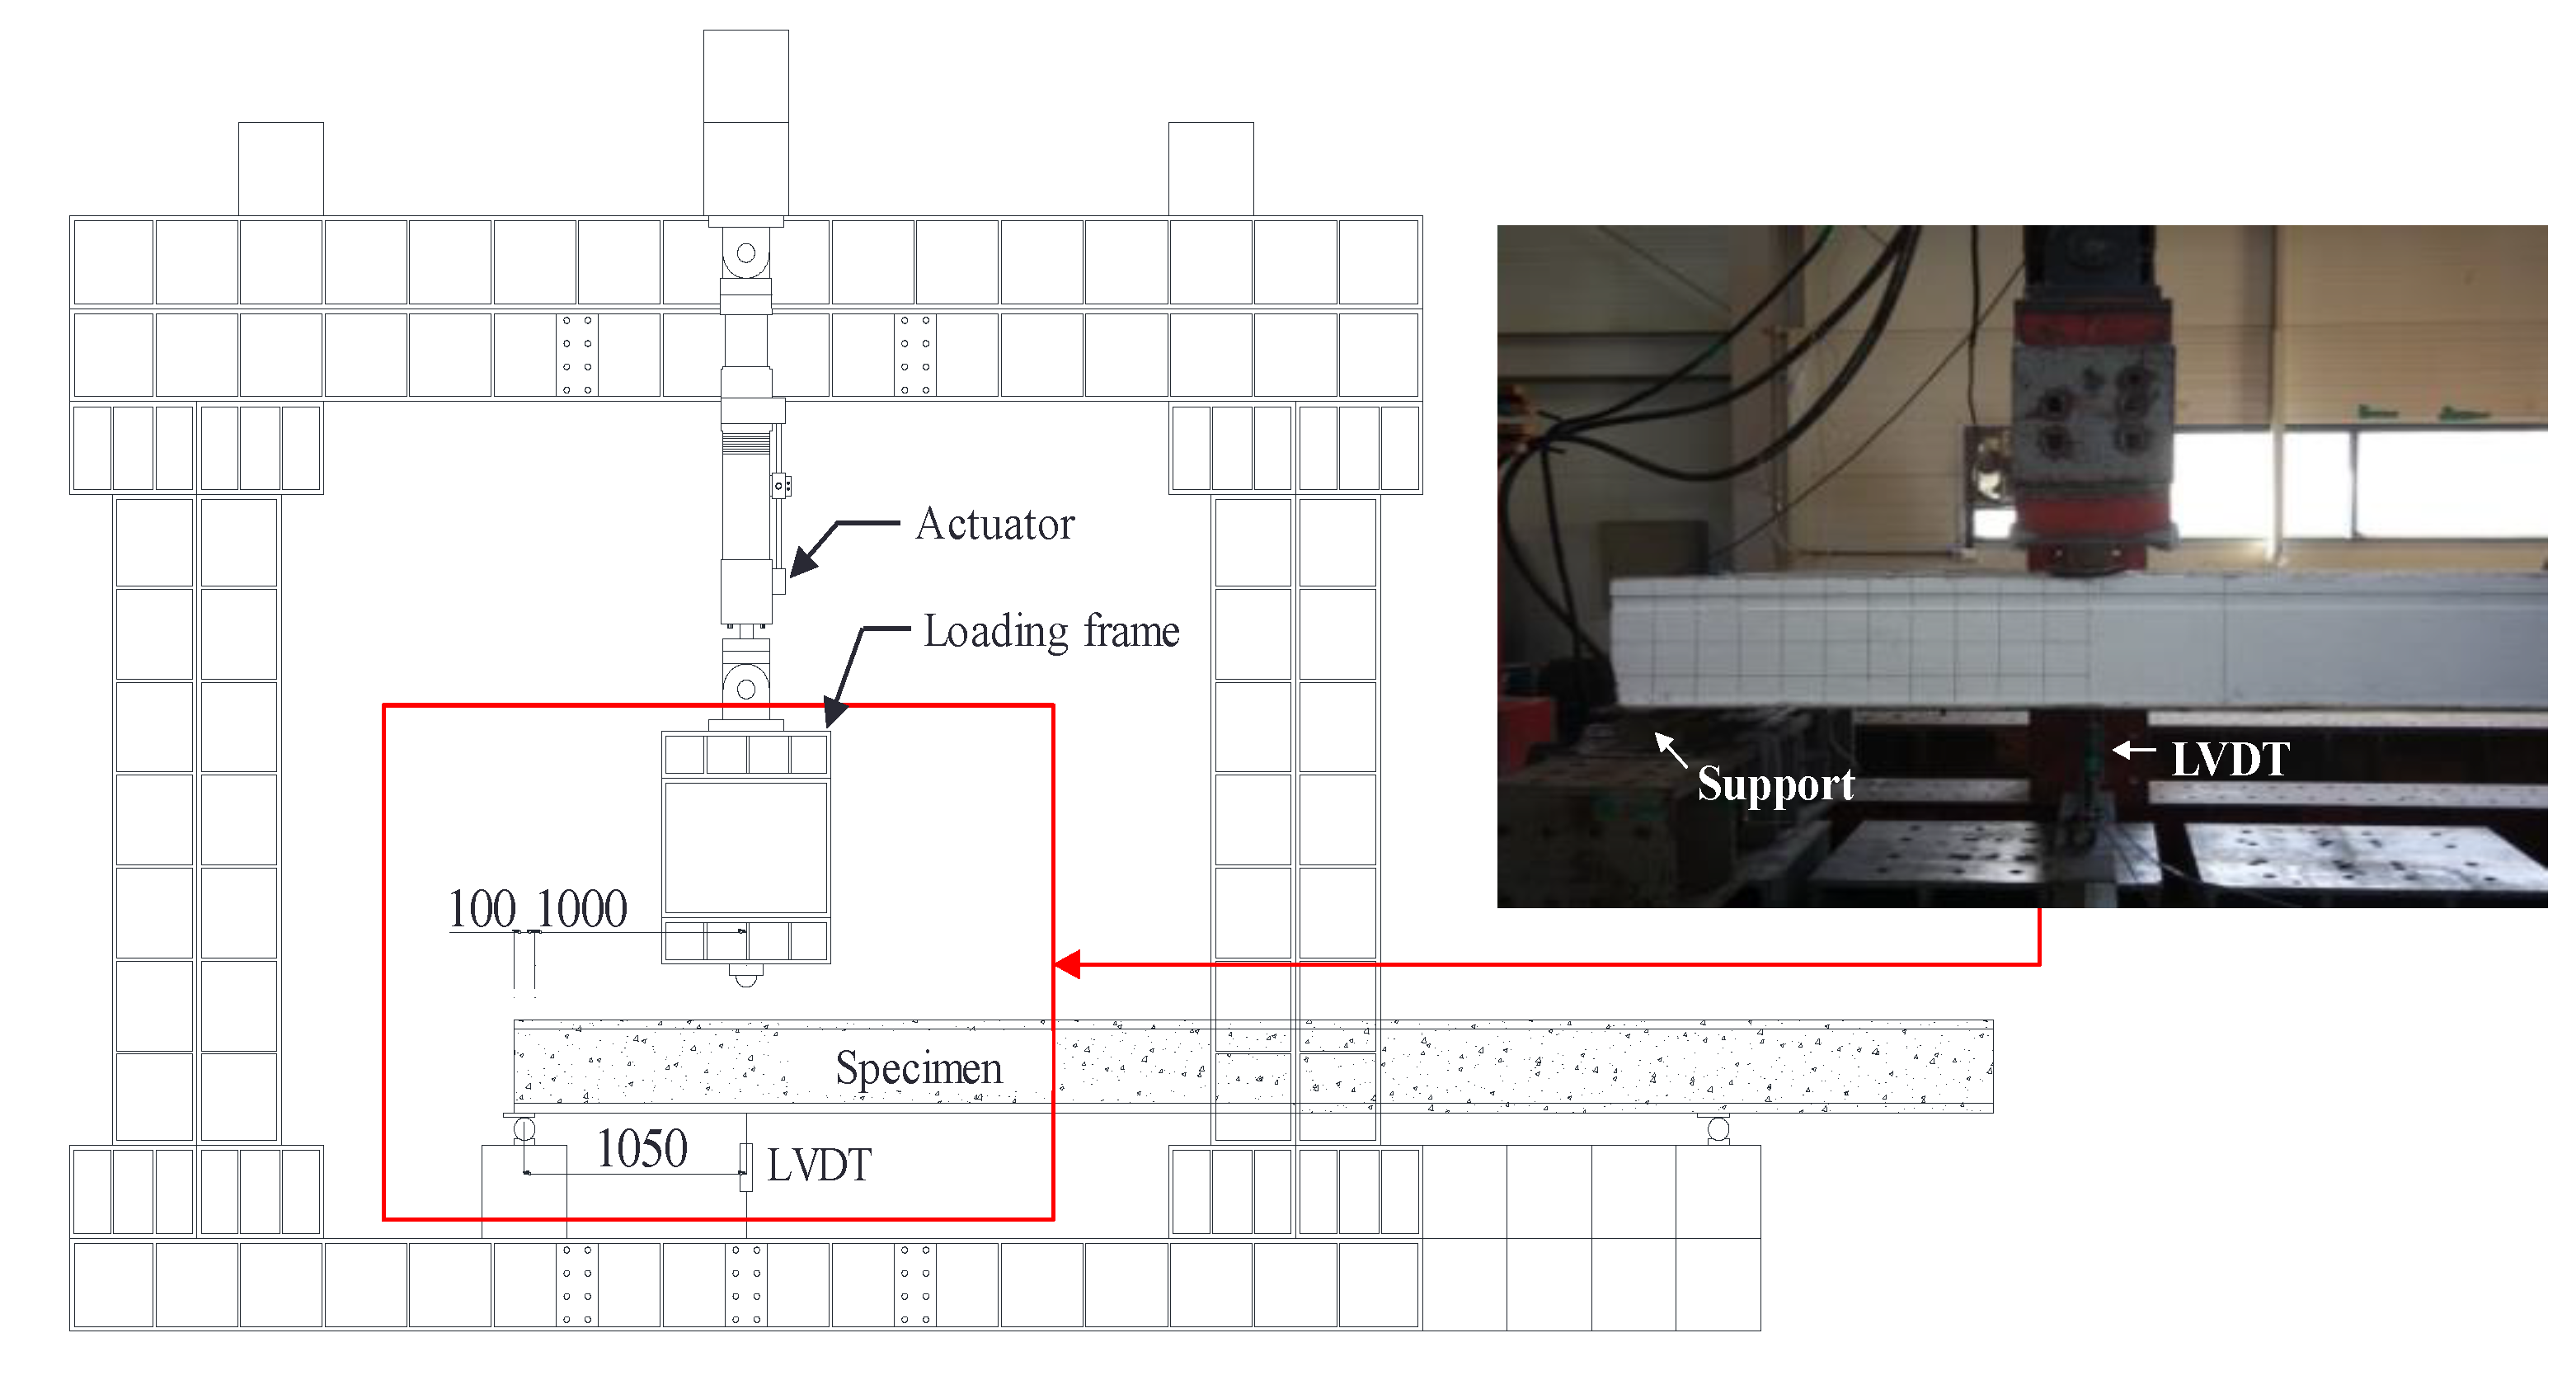
2. Test Program
3. Test Results
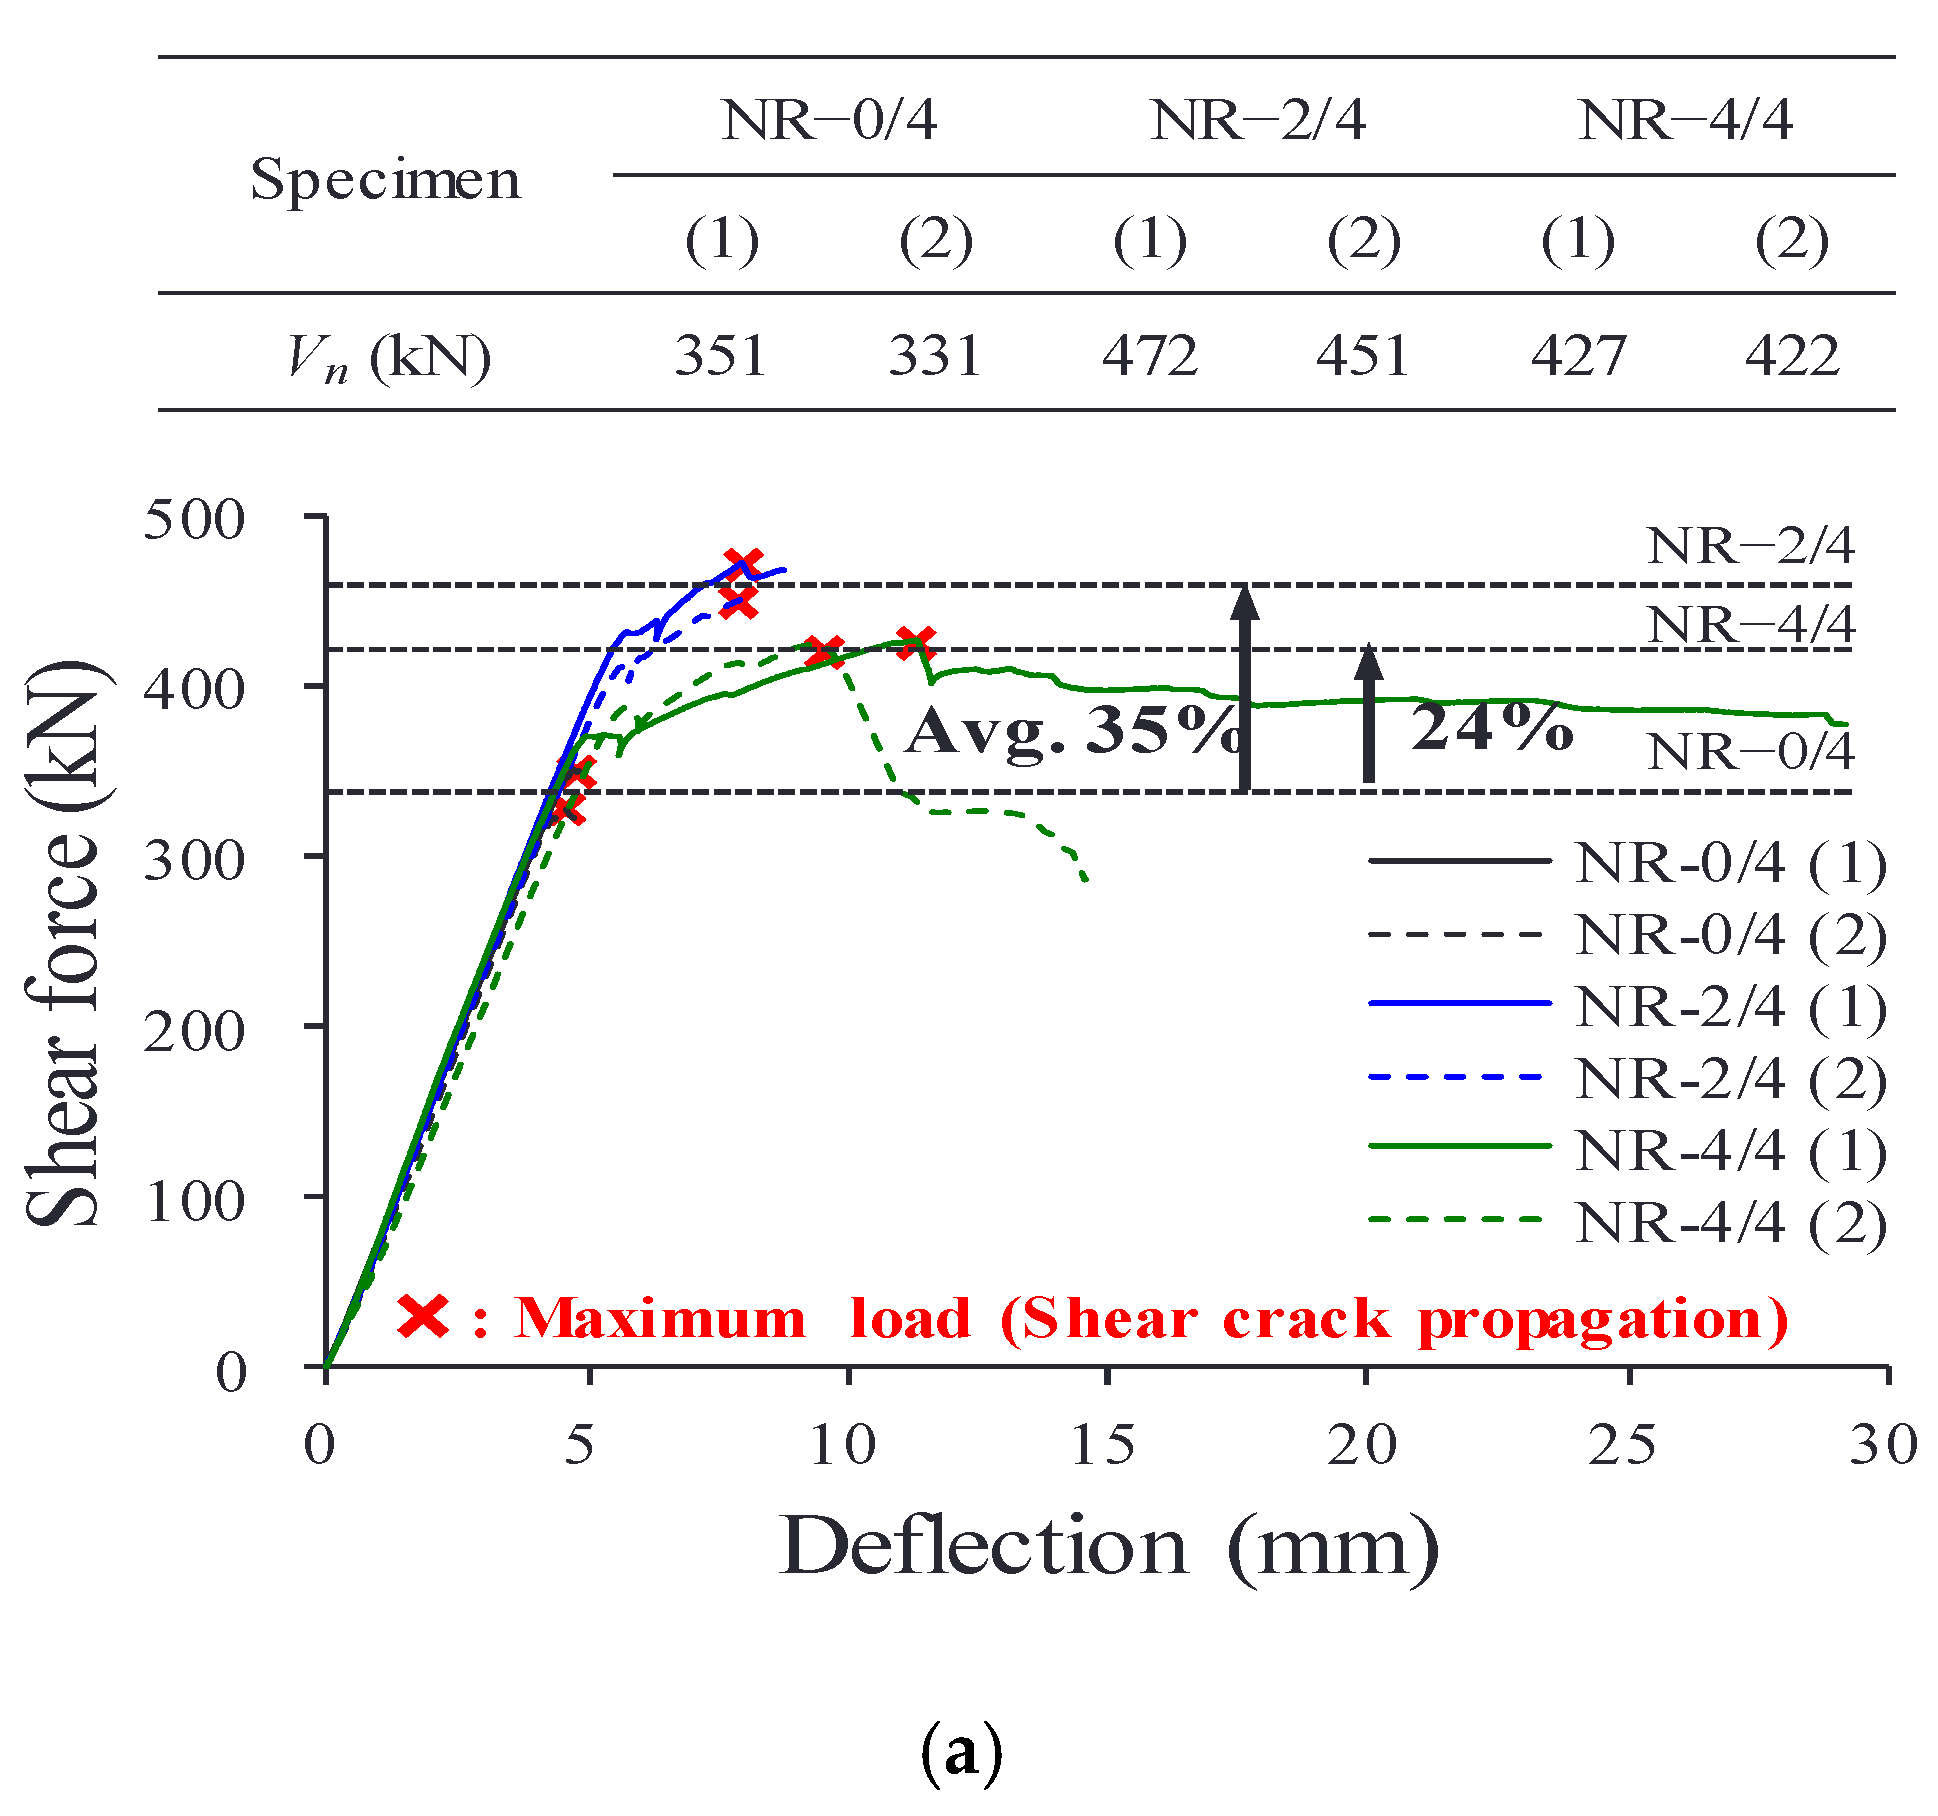
3.1. Load-Displacement Behavior and Shear Strengths of Test Specimens
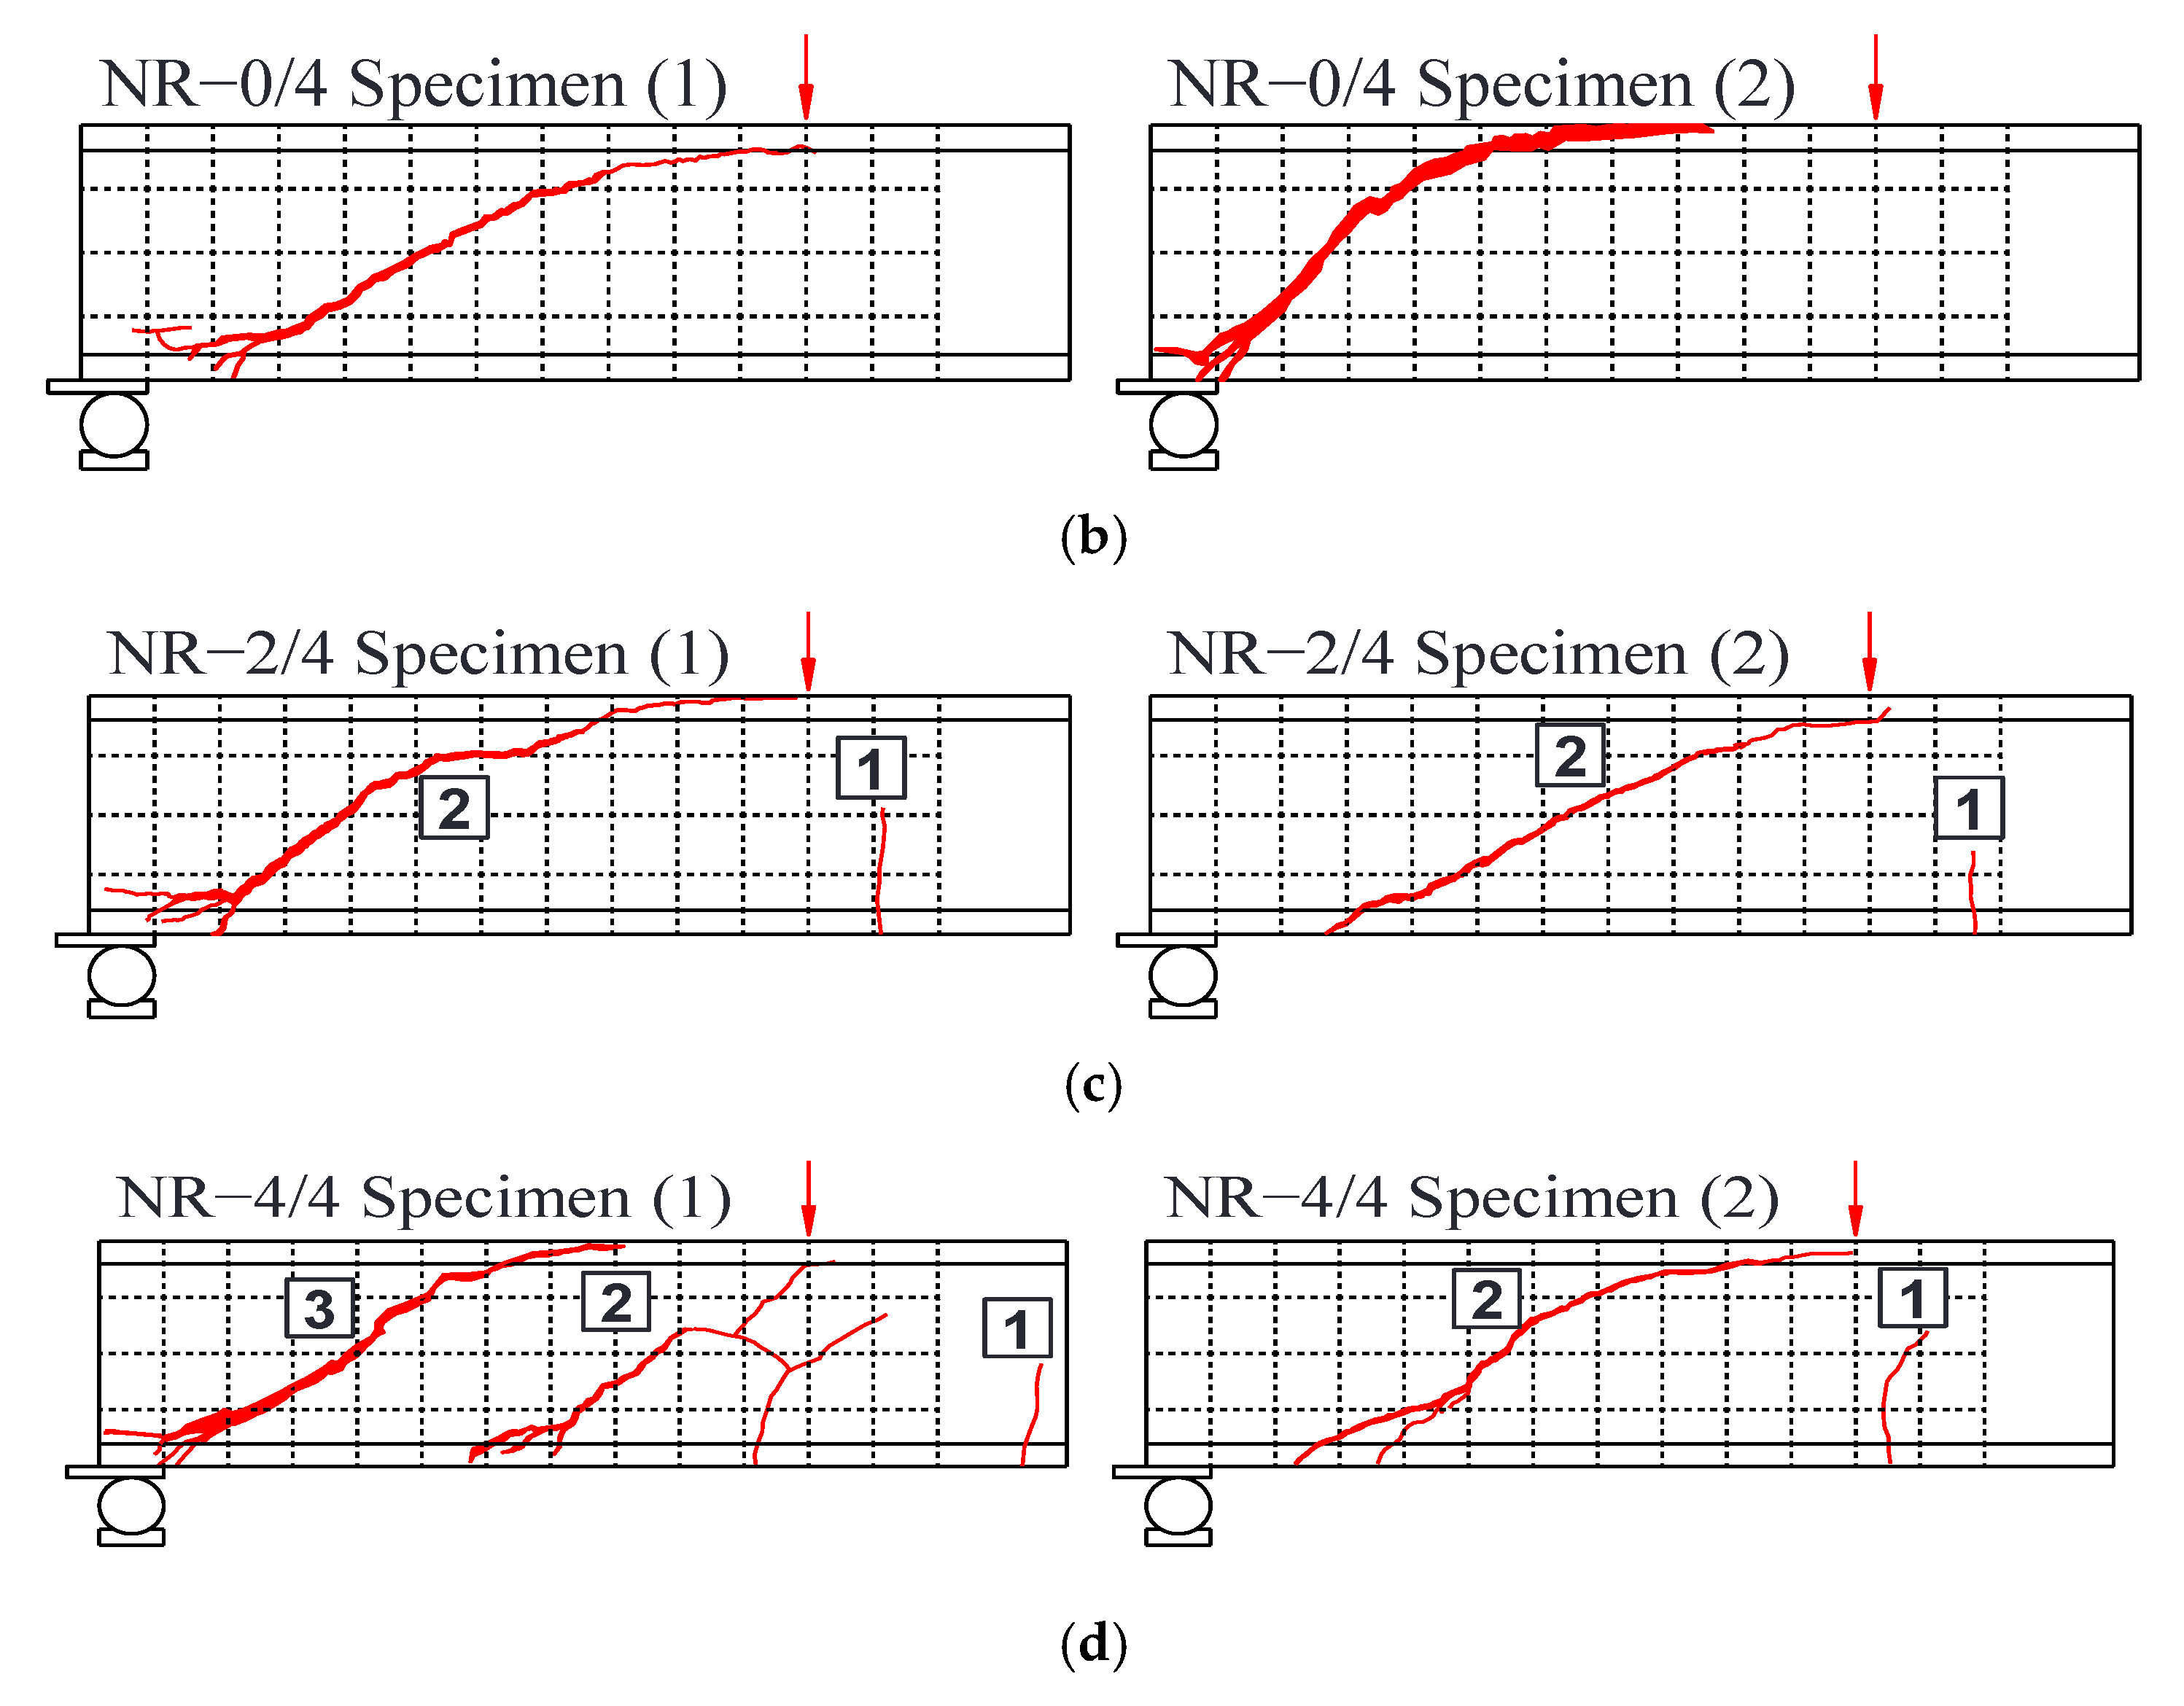
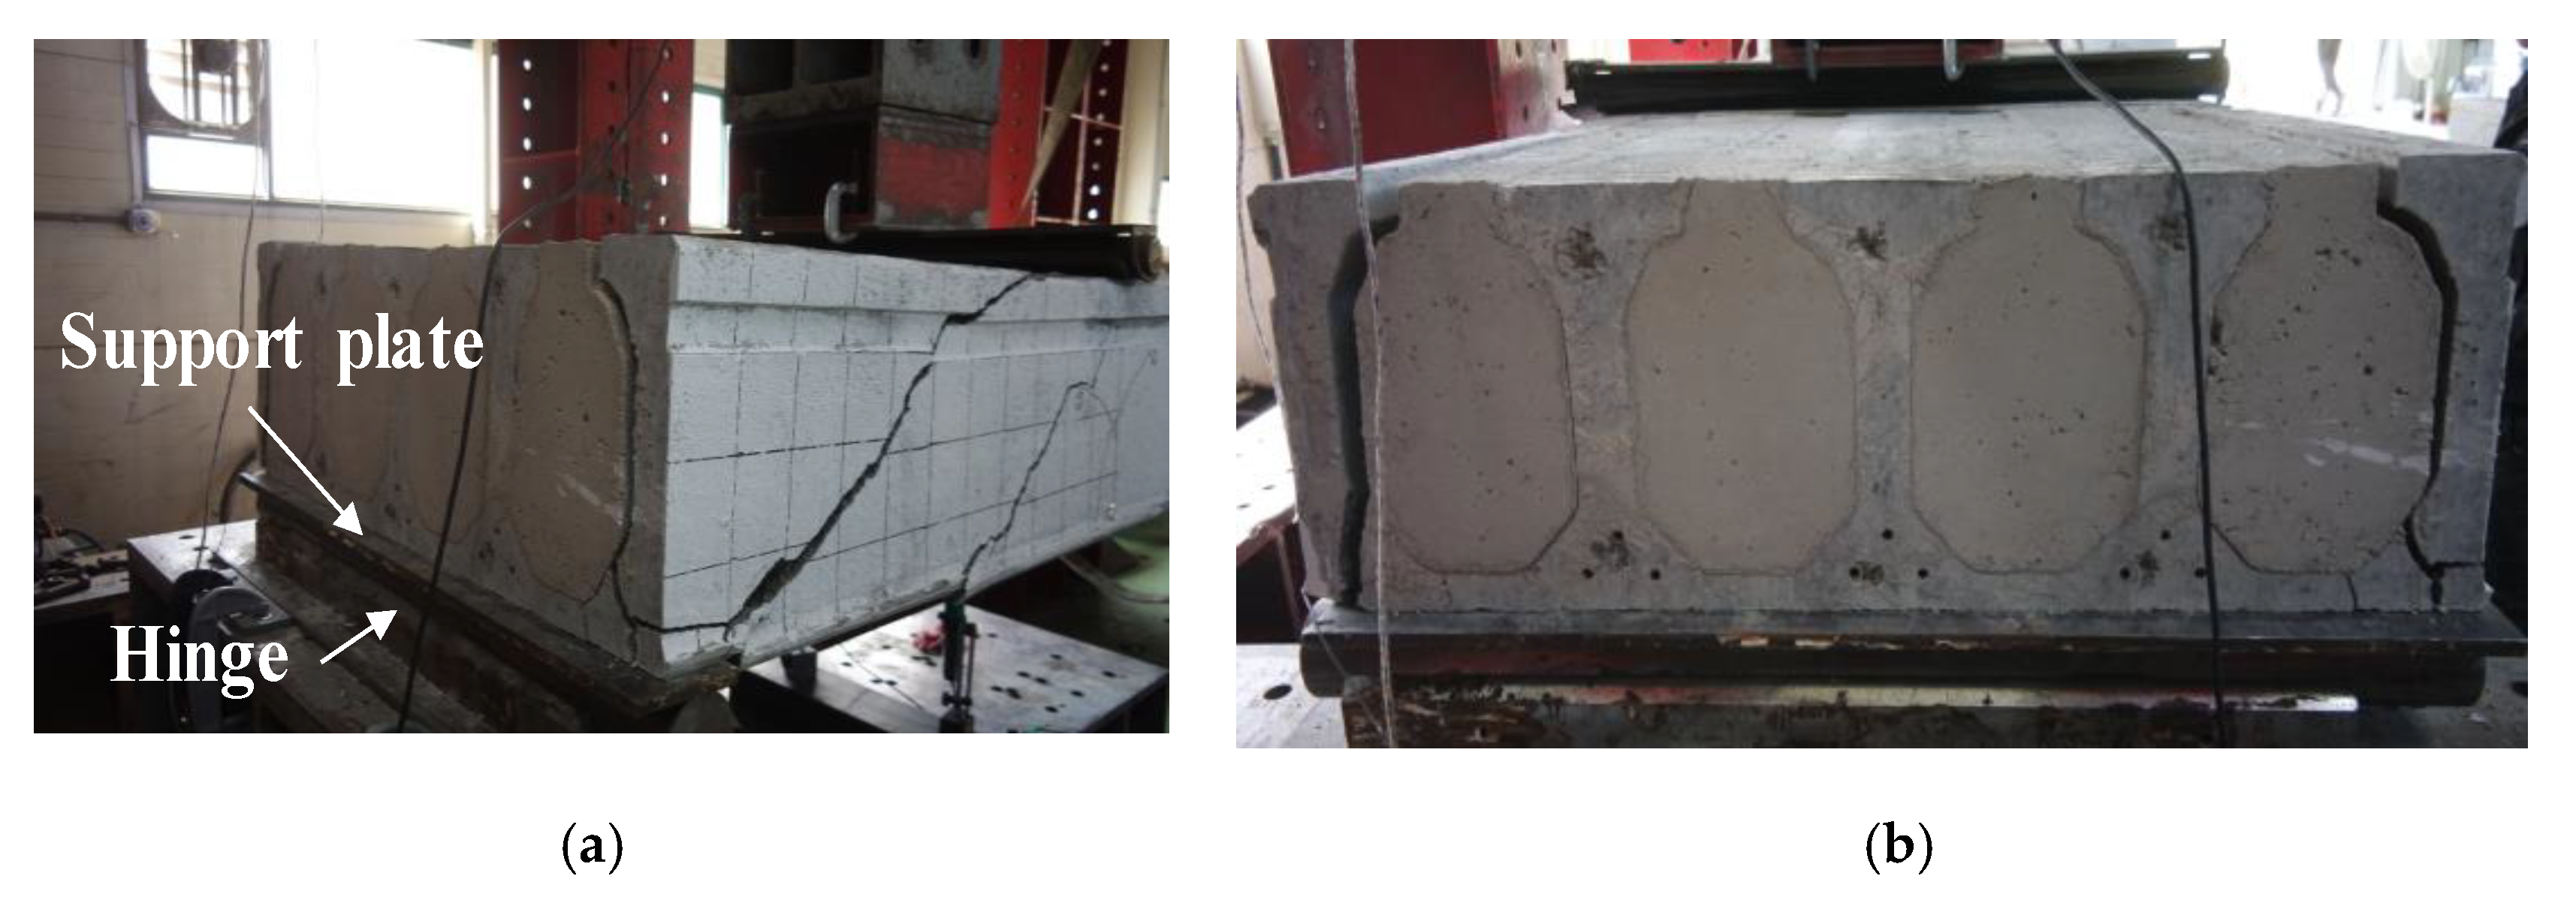
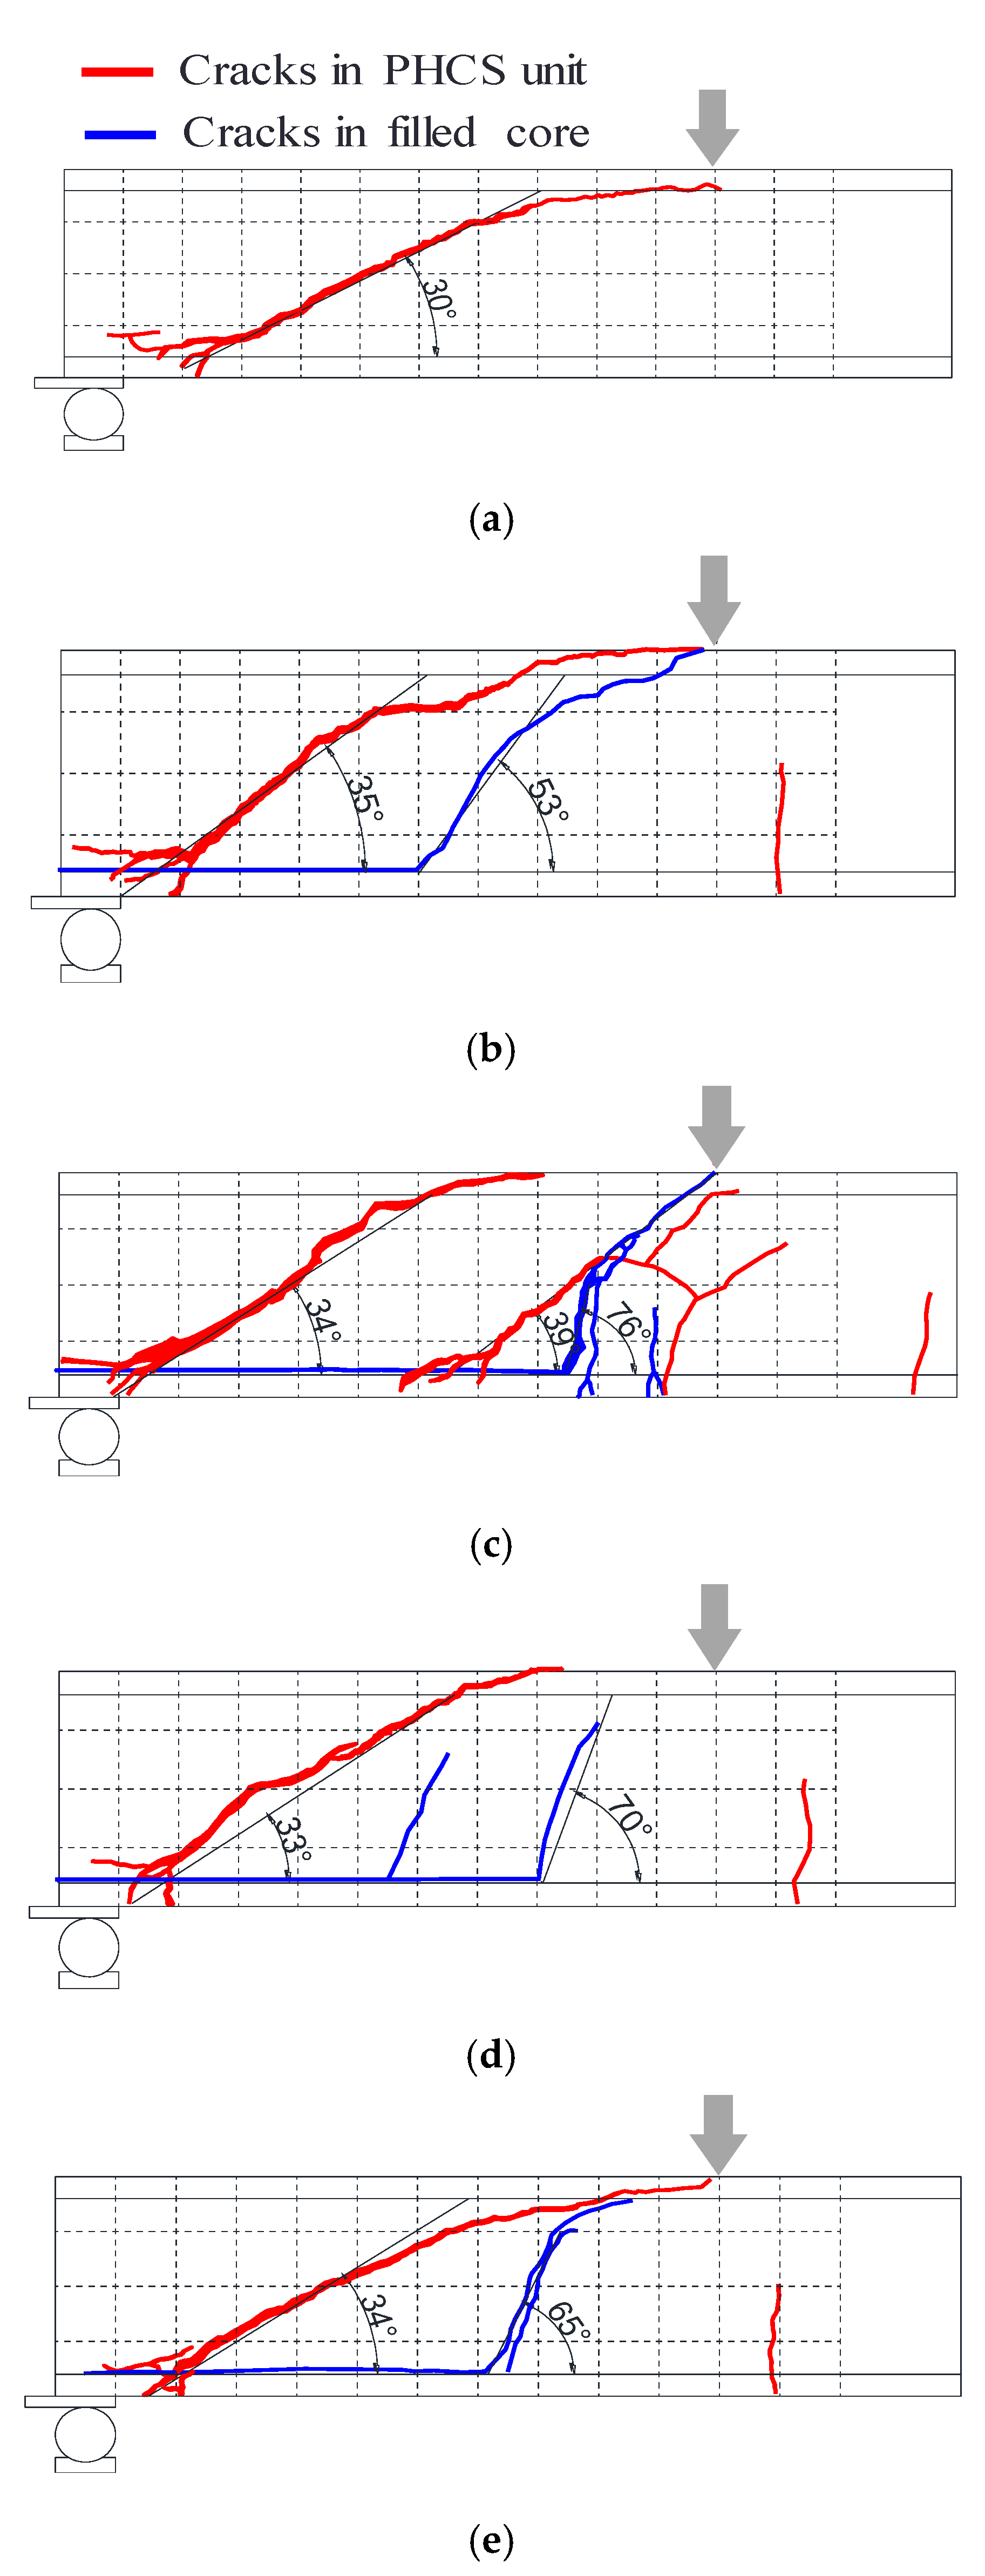
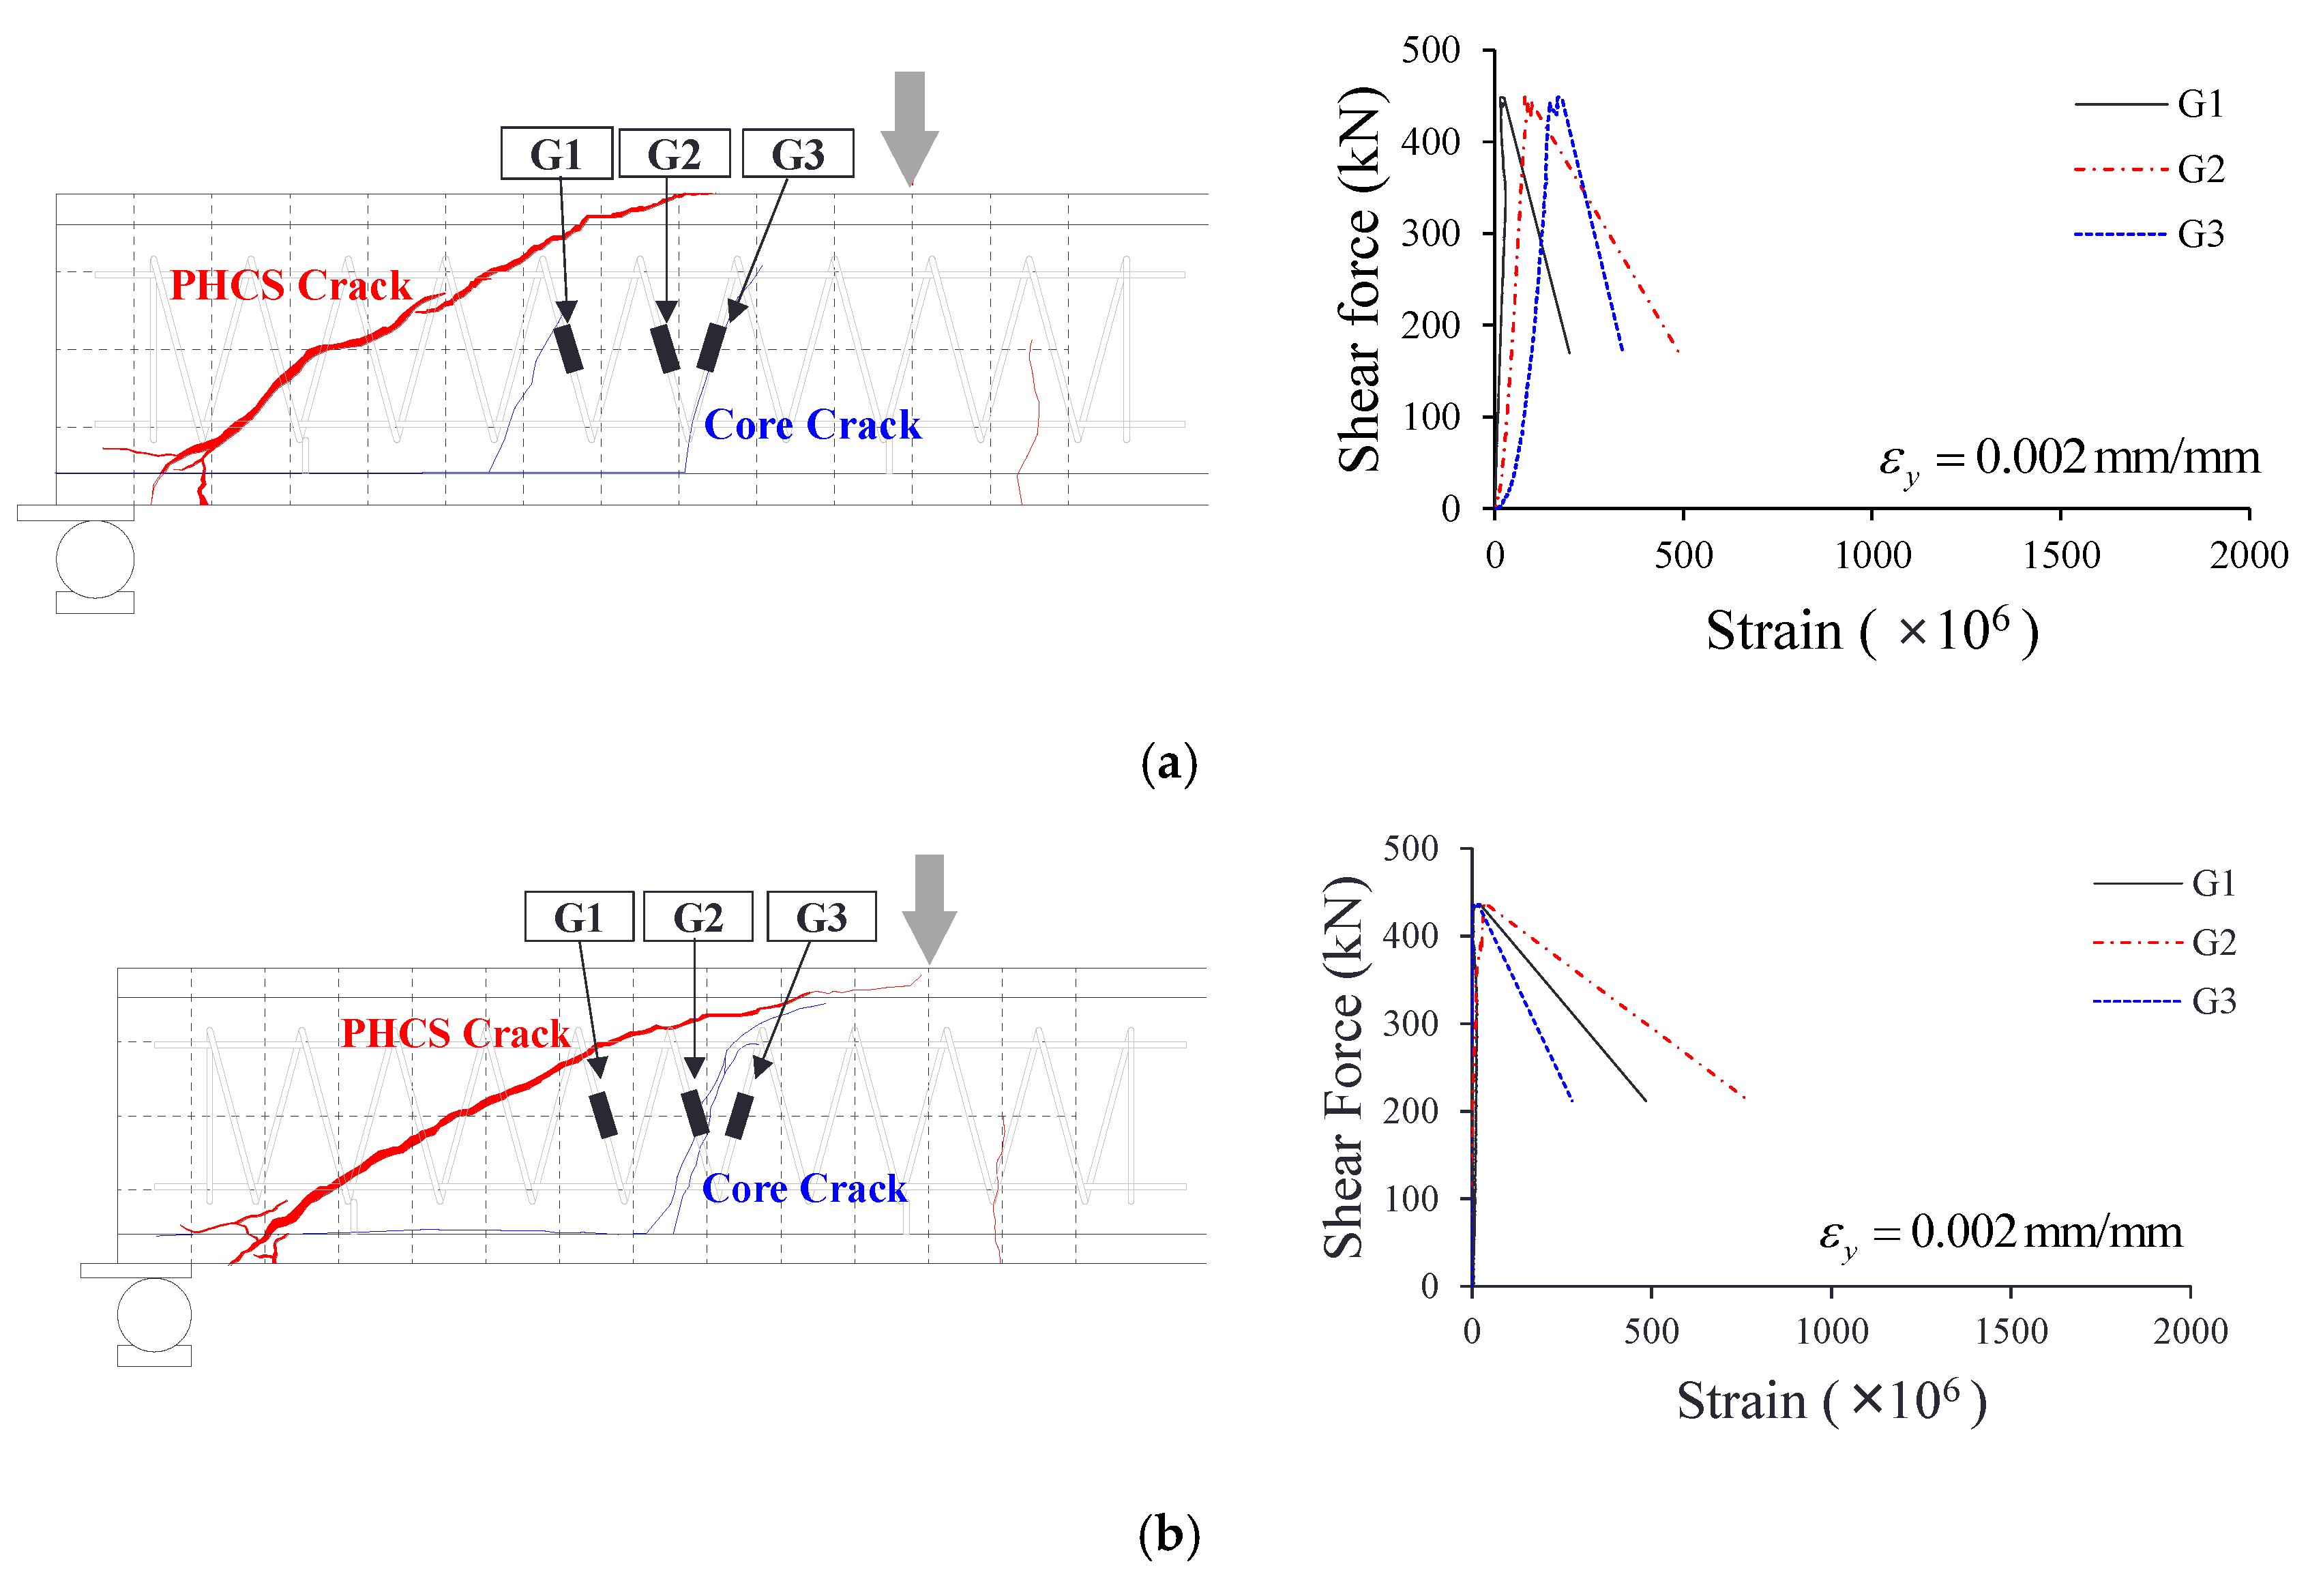
3.2. Crack Patterns of PHCS Unit and Filled Core
3.3. Discussions on the Web-Shear Strength of Prestressed hollow core slab (PHCS) Reinforced by the Core-Filling Method
4. Review of the Code Provisions and Recommendation
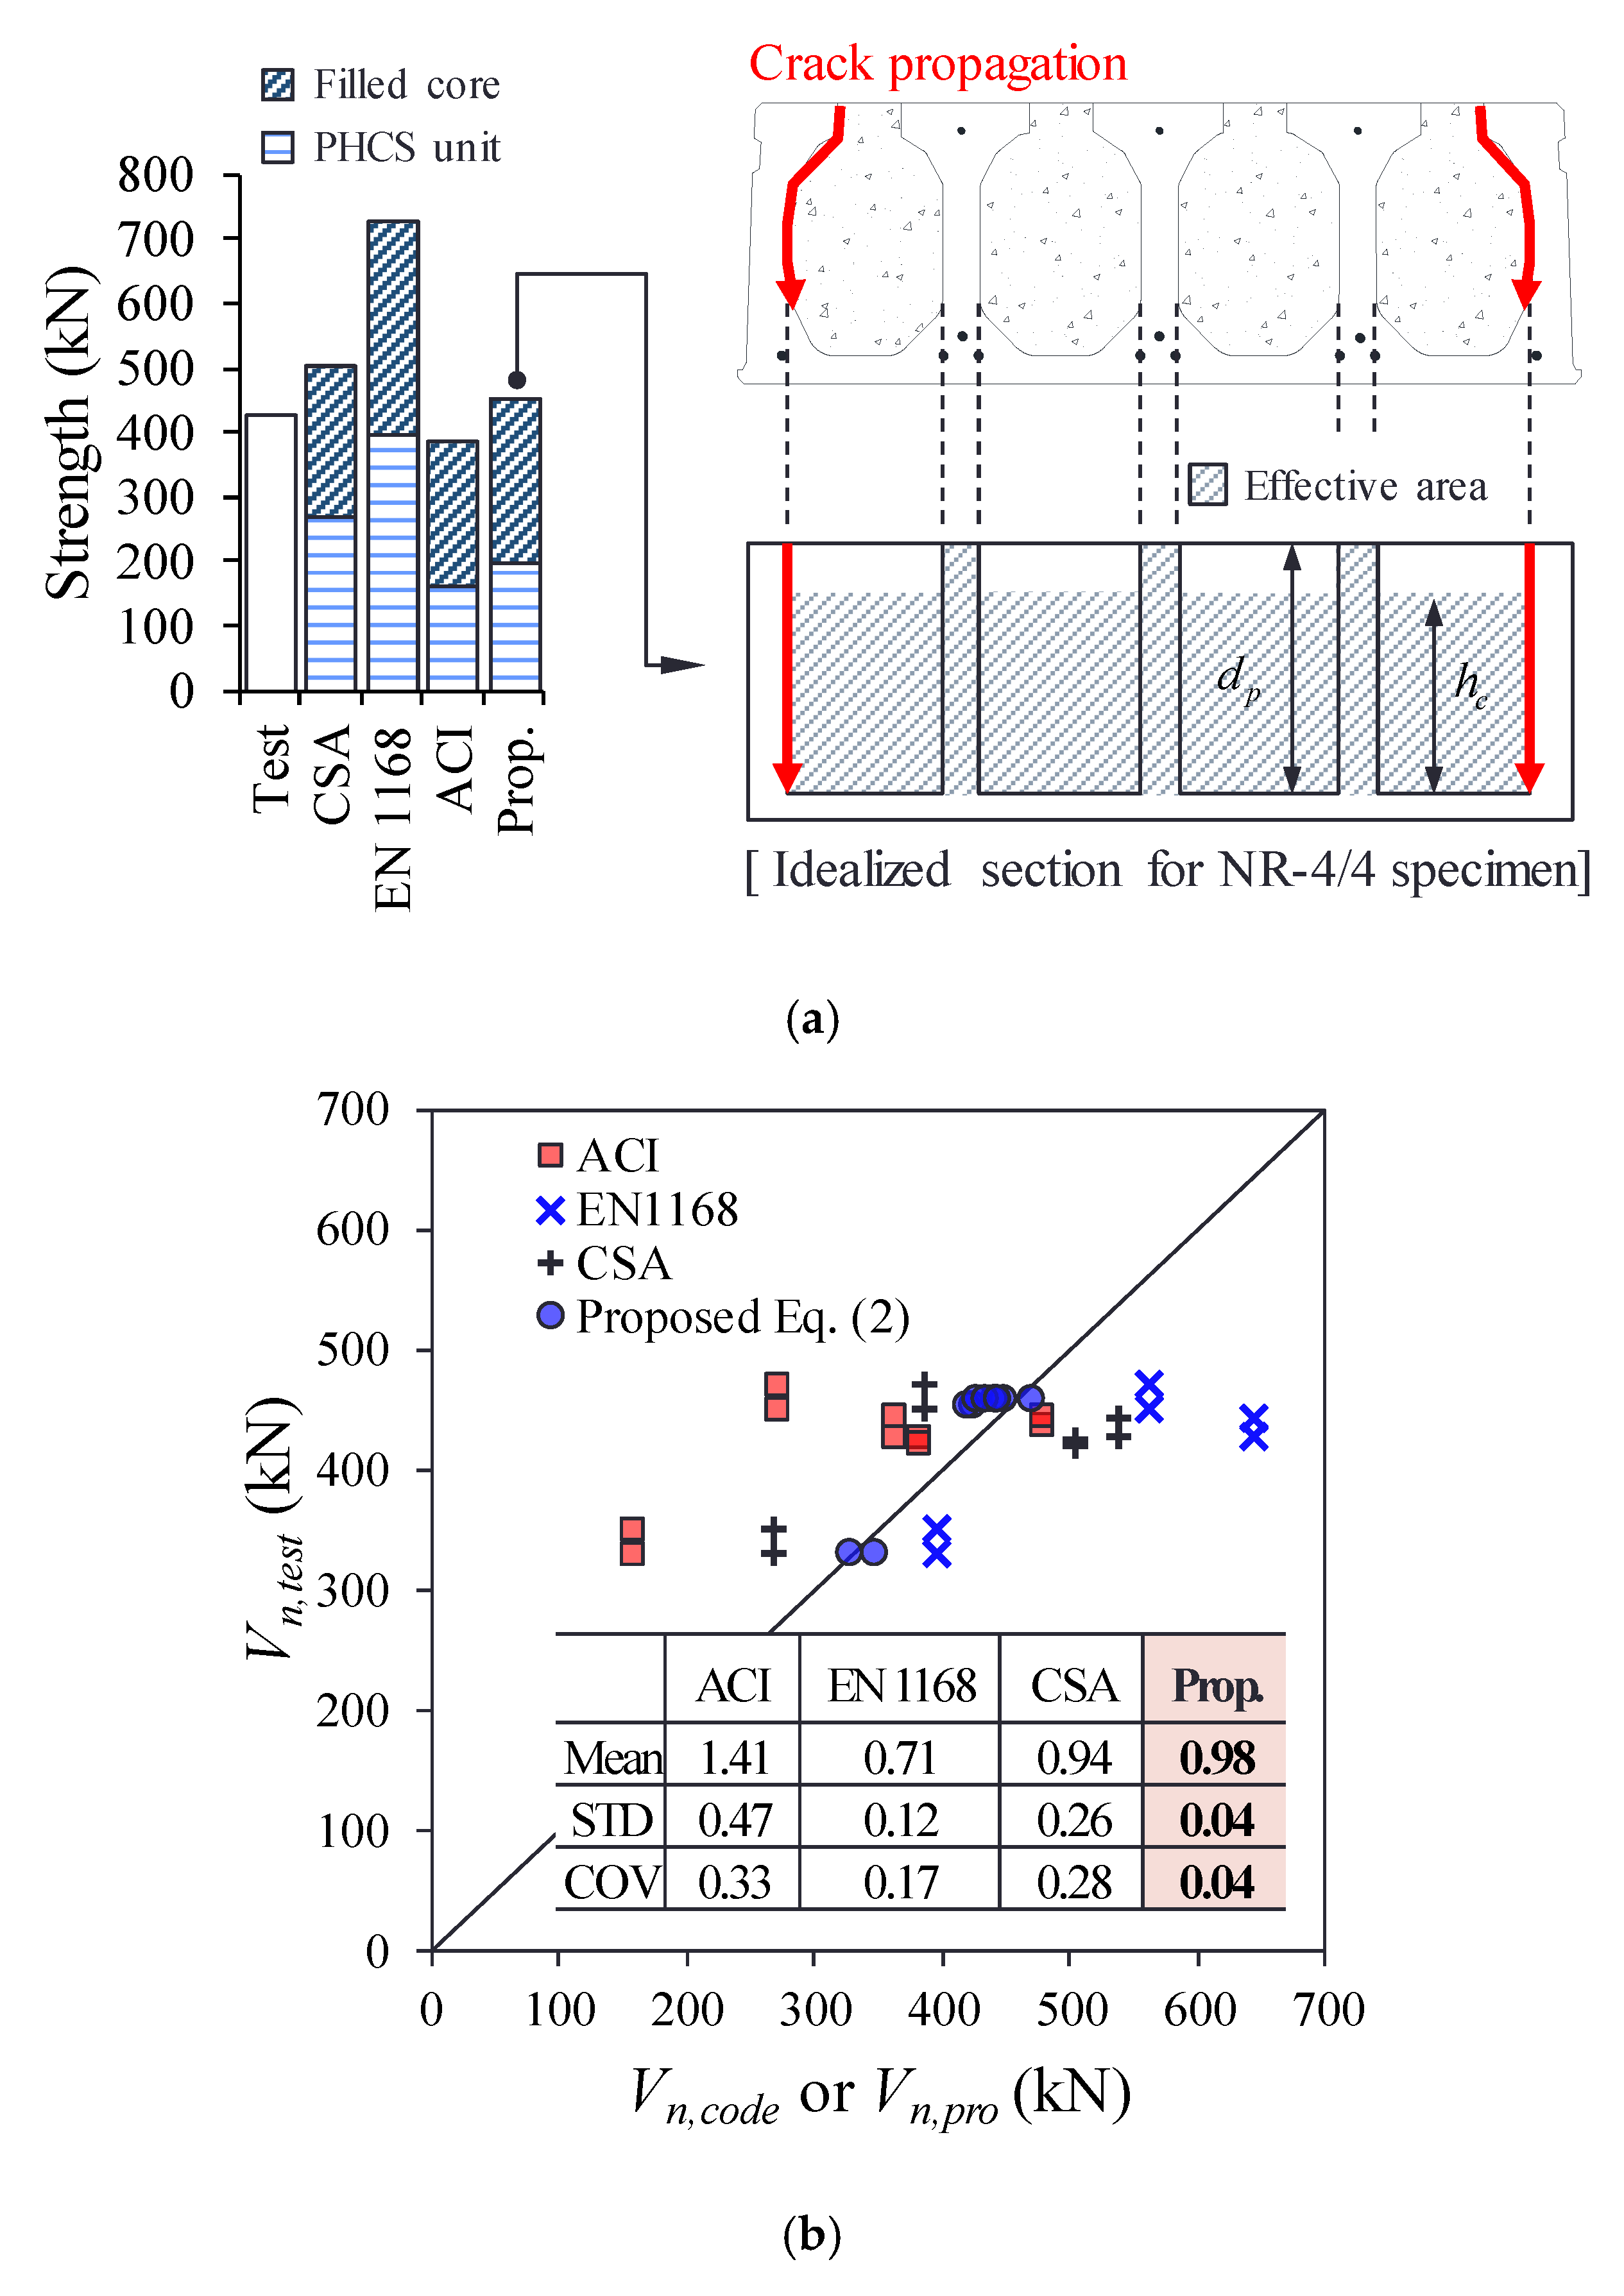
4.1. Considerations for Estimating the Web-Shear Strength of the PHCS with Filled Cores
4.2. Comparison of Shear Strengths by Testing and the Code Equations
4.3. Modified Shear Strength Equation for the PHCS with Filled Cores
5. Conclusions
- The NR-2/4 specimen which has two hollow cores filled with normal strength concrete, showed a 32%–38% increase in shear strength compared to the NR-0/4 specimen, while the shear strength of the NR-4/4 specimen with four hollow cores strengthened increased by only 24%–25%, compared to that of the NR-0/4 specimen. This is because the web of the PHCS unit at the edge of the NR-4/4 specimen was separated from the filled core before reaching the ultimate load, and thus the edge web failed to exert effective shear resistance.
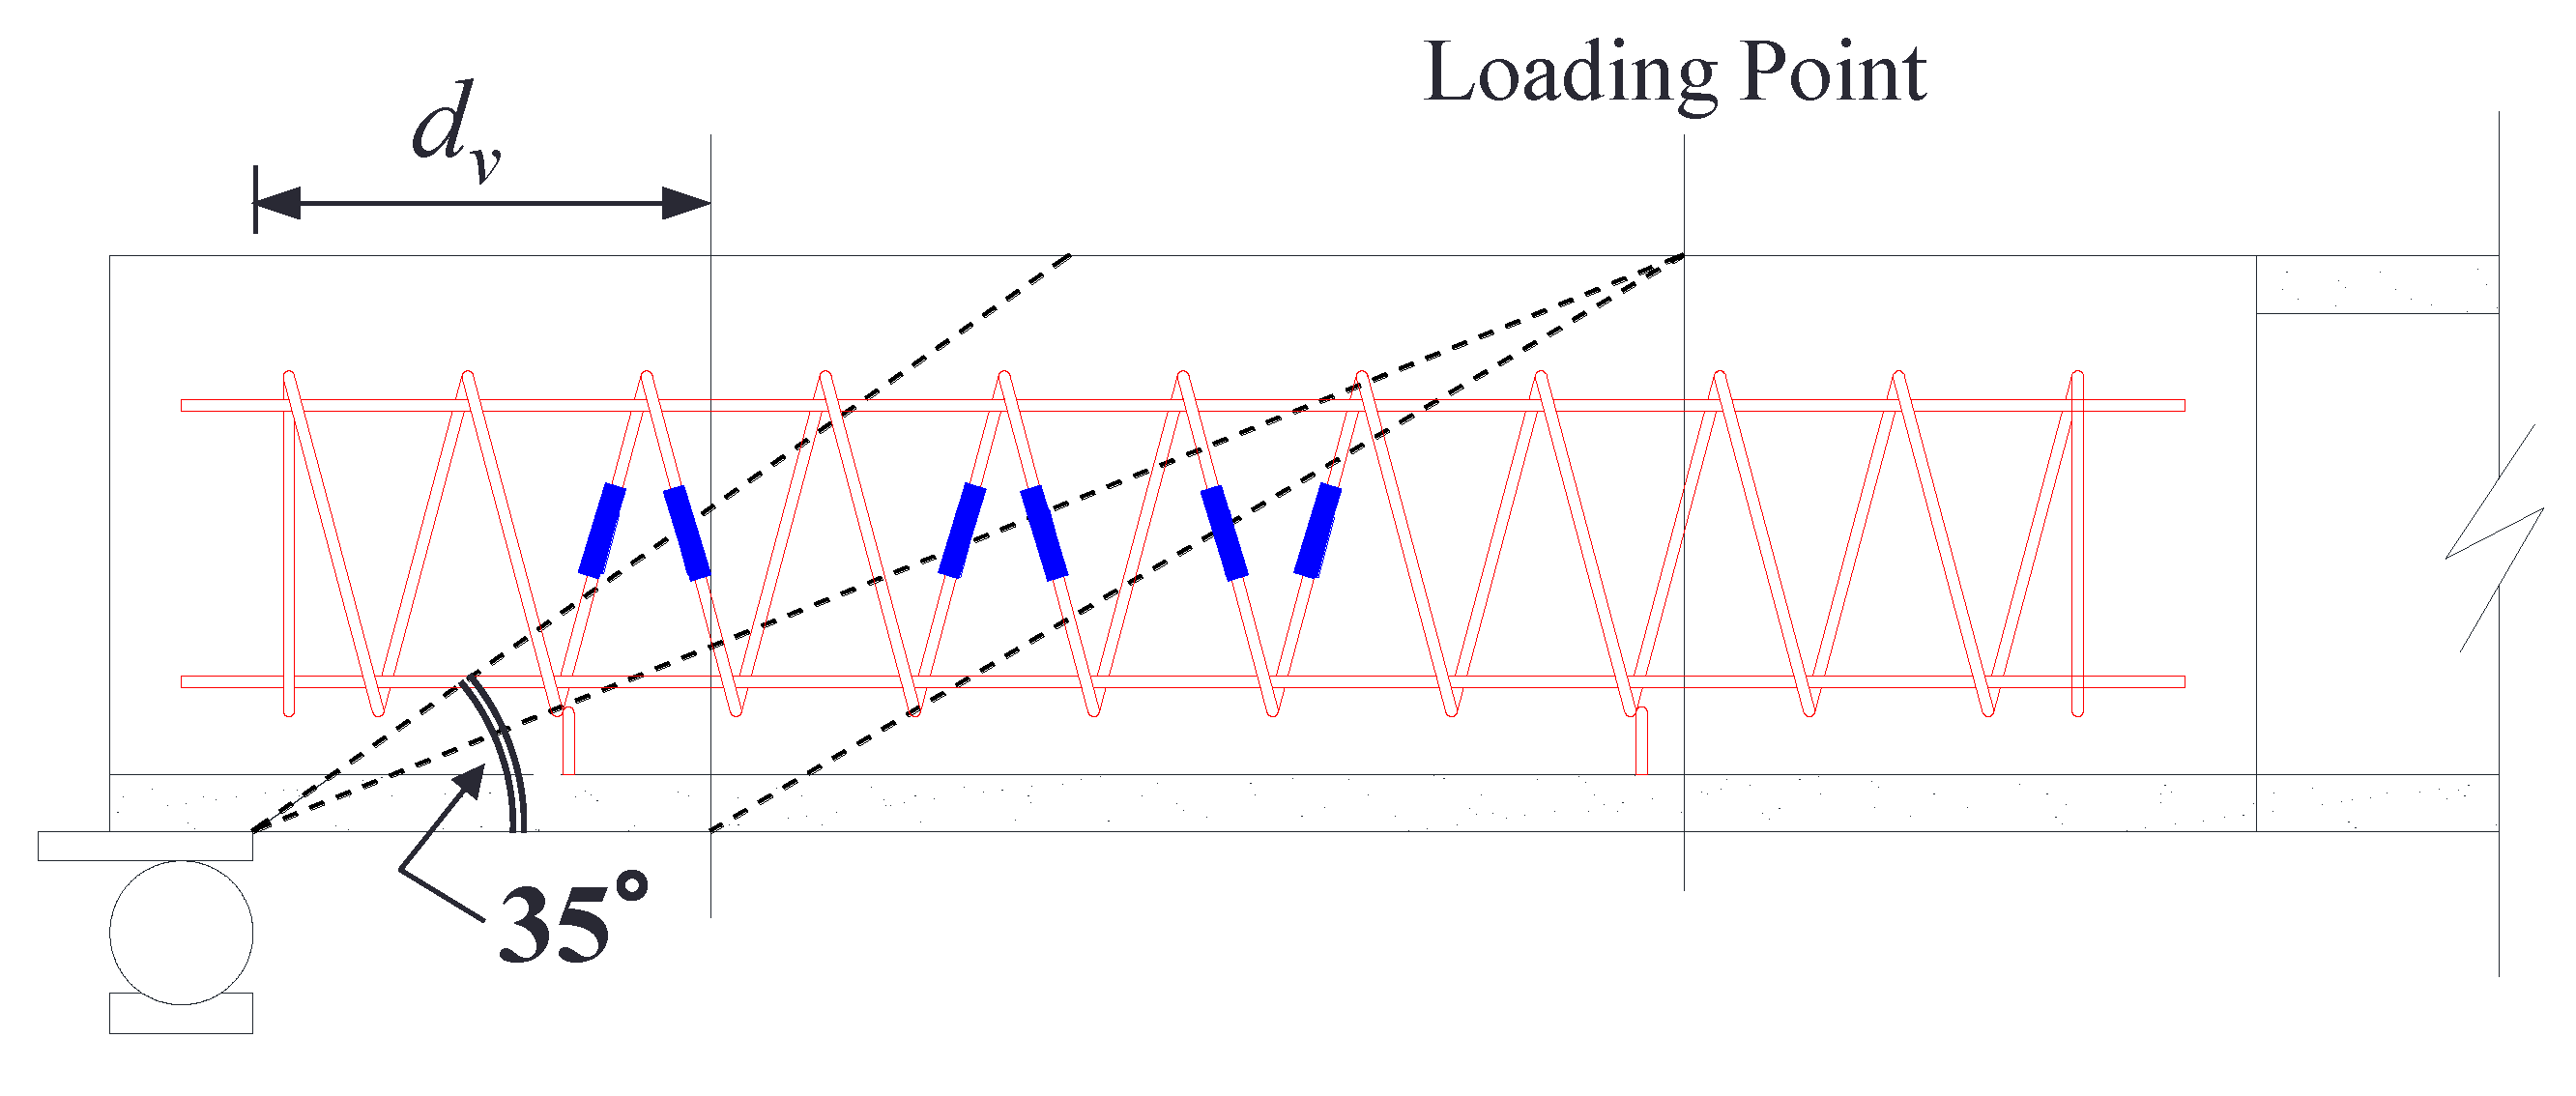
- The shear crack angle of the PHCS unit ranged from 30° to 34°, whereas a very steep crack angle ranging from 53° to 76° occurred in the filled core. In addition, cracks were observed along the interface between the PHCS unit and the filled cores, resulting in the slip between the PHCS unit and the filled cores, which in turn led to a failure of full composite behavior. As a result, the filled core made a partial contribution to the shear resistance of the member, but did not exert its shear capacity due to the slip between the PHCS unit and the filled cores.
- The shear strengths of the LR-2/4 and HR-2/4 specimens strengthened with helix reinforcing bars were almost similar to the shear strength of the NR-2/4 specimen without shear reinforcement. In other words, the shear reinforcement did not exert a proper shear resistance, which is because the shear crack did not cross the helix reinforcing bars.
- The ACI 318-14 code provided conservative evaluations of the shear strengths of the specimens, while the CSA-A23.3 code tended to estimate the shear strengths of the NR-4/4, LR-2/4, and HR-2/4 specimens to be on the unsafe side. In particular, the BS EN 1168 code provided shear strength estimation results on the unsafe side for all of the specimens.
- The separation of the web of the PHCS units and the filled cores at the edge of the section should be considered when applying the code equations, in order to avoid unsafe shear design of the PHCSs reinforced by the core-filling method.
- To understand the shear transfer mechanism of the PHCS units and core-filling concrete more clearly, further research is still needed: (1) Push-off tests of PHCS with filled cores to obtain the bond properties between PHCS and core-filling concrete; (2) Finite element analysis considering the bond–slip relationship; (3) Shear tests of PHCS with core-filling and topping concrete.
Author Contributions
Funding
Conflicts of Interest
References
- Kankeri, P.; Prakash, S. Efficient hybrid strengthening for precast hollow core slabs at low and high shear span to depth ratios. Compos. Struct. 2017, 170, 202–214. [Google Scholar] [CrossRef]
- Celal, M.S. Behaviour of Precast/Prestressed Hollow-Core Slabs. Master’s Thesis, University of Manitoba, Manitoba, Canada, 2011. [Google Scholar]
- El-Arab, I.M.E. Web Shear Strengthening Technique of Deep Precast Prestressed Hollow Core Slabs under Truck Loads. J. Bldg. Constr. Plan. Res. 2017, 5, 129–145. [Google Scholar] [CrossRef]
- Wu, Y.; Cheng, S.; El-Ragaby, A.; Mehta, A. Effectiveness of a Novel Technique in Strengthening Web-Shear Capacity of Prestressed Hollow Core Slabs Using Externally Bonded FRP Sheets. J. Compos. Constr. 2017, 21, 1–14. [Google Scholar] [CrossRef]
- Lee, D.H.; Park, M.K.; Oh, J.Y.; Kim, K.S.; Im, J.H.; Seo, S.Y. Web-Shear Capacity of Prestressed Hollow-Core Slab Unit with Consideration on the Minimum Shear Reinforcement Requirement. Comput. Concr. 2014, 14, 211–231. [Google Scholar] [CrossRef]
- Park, M.K.; Lee, D.H.; Han, S.J.; Kim, K.S. Web-Shear Capacity of Thick Precast Prestressed Hollow-Core Slab Units Produced by Extrusion Method. Int. J. Concr. Struct. Mater. 2019, 13, 1–14. [Google Scholar] [CrossRef]
- Becker, R.J.; Buettner, D.R. Shear Tests of Extruded Hollow-Core Units. PCI J. 1985, 30, 40–54. [Google Scholar] [CrossRef]
- Im, J.H.; Park, M.K.; Lee, D.H.; Kim, K.S.; Seo, S.Y. Evaluation of web-shear capacity of thick hollow-core slabs. Reg. Assoc. Archit. Inst. Korea 2014, 16, 139–145. (In Korean) [Google Scholar]
- Tawadrous, R.; Morcous, G. Shear Strength of Deep Hollow-Core Slabs. ACI Struct. J. 2018, 115, 669–709. [Google Scholar] [CrossRef]
- Brunesi, E.; Bolognini, D.; Nascimbene, R. Evaluation of the shear capacity of precast-prestressed hollow core slabs: Numerical and experimental comparisons. Mater. Struct. 2015, 48, 1503–1521. [Google Scholar] [CrossRef]
- Palmer, K.D.; Schultz, A.E. Factors affecting web-shear capacity of deep hollow-core. PCI J. 2010, 55, 123–146. [Google Scholar] [CrossRef]
- Palmer, K.D.; Schultz, A.E. Experimental investigation of the web-shear strength of deep hollow-core units. PCI J. 2011, 56, 83–104. [Google Scholar] [CrossRef]
- Hawkins, N.M.; Ghosh, S.K. Shear Strength of Hollow-Core Slabs. PCI J. 2006, 51, 110–115. [Google Scholar]
- El-Sayed, A.K.; Al-Negheimish, A.I.; Alhozaimy, A.M. Web Shear Resistance of Prestressed Precast Deep Hollow Core Slabs. ACI Struct. J. 2019, 116, 139–150. [Google Scholar] [CrossRef]
- ACI Committee 318-08. Building Code Requirements for Structural Concrete and Commentary (ACI 318R-08); American Concrete Institute: Farmington Hills, MI, USA, 2008. [Google Scholar]
- ACI Committee 318-14. Building Code Requirements for Structural Concrete and Commentary (ACI 318R-14); American Concrete Institute: Farmington Hills, MI, USA, 2014. [Google Scholar]
- Brunesi, E.; Nascimbene, R. Numerical web-shear strength assessment of precast prestressed hollow core slab units. Eng. Struct. 2015, 102, 13–30. [Google Scholar] [CrossRef]
- Girhammar, U.A.; Pajari, M. Tests and analysis on shear strength of composite slabs of hollow core units and concrete topping. Constr. Build. Mater. 2008, 22, 1708–1722. [Google Scholar] [CrossRef]
- Nguyen, T.N.H.; Tan, K.H.; Kanda, T. Investigations on web-shear behavior of deep precast, prestressed concrete hollow core slabs. Eng. Struct. 2019, 183, 579–593. [Google Scholar] [CrossRef]
- University of Seoul; Korea National University of Transportation; Yunwoo Structural Engineering. Prestressed Hollow-Core Slabs; Samsung C&T Research Report; University of Seoul: Seoul, Korea, 2012. [Google Scholar]
- Lee, D.H.; Park, M.K.; Joo, H.E.; Han, S.J.; Kim, K.S. Strengths of Thick Prestressed Precast Hollow-Core Slab Members Strengthened in Shear. ACI Struct. J. 2020, 117, 1–12. [Google Scholar] [CrossRef]
- CSA A23.3-14. Design of Concrete Structures; Canadian Standards Association: Mississauga, ON, CA, 2014. [Google Scholar]
- EN 1168. Precast Concrete Products−Hollow Core Slabs; European Committee for Standardization: Brussels, Belgium, 2005. [Google Scholar]
- ACI Committee 318-05. Building Code Requirements for Structural Concrete and Commentary (ACI 318R-05); American Concrete Institute: Farmington Hills, MI, USA, 2005. [Google Scholar]
- Hegger, J.; Roggendorf, T.; Kerkeni, N. Shear capacity of prestressed hollow core slabs in slim floor constructions. Eng. Struct. 2009, 31, 551–559. [Google Scholar] [CrossRef]
- EN 1992-1-1. Design of Concrete Structures—Part 1-1: General Rules and Rules for Buildings (Eurocode 2); European Committee for Standardization: Brussels, Belgium, 2004. [Google Scholar]
- Yang, L. Design of Prestressed Hollow-Core Slabs with Reference to Web Shear Failure. J. Struct. Eng. 1994, 120, 2675–2696. [Google Scholar] [CrossRef]


| ACI 318 | * | ||
| CSA-A23.4 | |||
| Simplified method | General method | ||
| BS EN 1168 | |||
| Designation | Number of Filled Cores | ||||
|---|---|---|---|---|---|
| NR *—0/4 ** | 276 | 400 | 360 | 0 | 0.0 |
| NR *—2/4 ** | 2 | 0.0 | |||
| NR *—4/4 ** | 4 | 0.0 | |||
| LR *—2/4 ** | 2 | 0.175 | |||
| HR *—2/4 ** | 2 | 0.395 |
| Concrete | (mm) | S/a (%) | W/C (%) | W (kg/m3) | C (kg/m3) | S (kg/m3) | G (kg/m3) |
|---|---|---|---|---|---|---|---|
| PHCS unit | 20 | 35.5 | 36.1 | 130 | 360 | 699 | 1264 |
| Core-filling | 25 | 47.5 | 47.8 | 170 | 356 | 848 | 956 |
| Specimen | * | Strength Ratio ** | |
|---|---|---|---|
| NR-0/4 (1) | - | 351.0 | 1.0 |
| NR-0/4 (2) | - | 331.0 | |
| NR-2/4 (1) | 436.7 | 472.0 | 1.38 |
| NR-2/4 (2) | 412.8 | 451.2 | 1.32 |
| NR-4/4 (1) | 371.0 | 426.9 | 1.25 |
| NR-4/4 (2) | 387.4 | 422.3 | 1.24 |
| LR-2/4 (1) | 442.1 | 444.7 | 1.30 |
| LR-2/4 (2) | 412.8 | 428.7 | 1.26 |
| HR-2/4 (1) | 392.1 | 436.6 | 1.28 |
| HR-2/4 (2) | 392.1 | 446.1 | 1.31 |
| Specimen | Test Results | ACI 318-14 | CSA-A23.3 | BS EN 1168 | |||
|---|---|---|---|---|---|---|---|
| kN | kN | Ratio * | kN | Ratio * | kN | Ratio * | |
| NR-0/4 (1) | 351.0 | 159.1 (318.2 **) | 2.21 (1.10) | 269.0 | 1.30 | 397.7 | 0.88 |
| NR-0/4 (2) | 331.0 | 159.1 (318.2 **) | 2.08 (1.04) | 269.0 | 1.23 | 397.7 | 0.83 |
| NR-2/4 (1) | 472.0 | 271.6 (430.6 **) | 1.74 (1.10) | 386.6 | 1.22 | 562.7 | 0.84 |
| NR-2/4 (2) | 451.2 | 271.6 (430.6 **) | 1.66 (1.05) | 386.6 | 1.17 | 562.7 | 0.80 |
| NR-4/4 (1) | 426.9 | 384.0 (543.1 **) | 1.11 (0.79) | 504.2 | 0.85 | 727.8 | 0.59 |
| NR-4/4 (2) | 422.3 | 384.0 (543.1 **) | 1.10 (0.78) | 504.2 | 0.84 | 727.8 | 0.58 |
| LR-2/4 (1) | 444.7 | 363.6 (522.7 **) | 1.22 (0.85) | 539.3 | 0.82 | 645.5 | 0.69 |
| LR-2/4 (2) | 428.7 | 363.6 (522.7 **) | 1.18 (0.82) | 539.3 | 0.79 | 645.5 | 0.66 |
| HR-2/4 (1) | 436.6 | 478.6 (637.7 **) | 0.91 (0.69) | 725.4 | 0.60 | 749.0 | 0.58 |
| HR-2/4 (2) | 446.1 | 478.6 (637.7 **) | 0.93 (0.70) | 725.4 | 0.61 | 749.0 | 0.60 |
| Average | - | 1.41 (0.89) | - | 0.94 | - | 0.71 | |
| STD | - | 0.47 (0.16) | - | 0.26 | - | 0.12 | |
| COV | - | 0.33 (0.18) | - | 0.28 | - | 0.17 | |
| Specimen | Test Results | Proposed Equation (2) | |
|---|---|---|---|
| kN | kN | Ratio * | |
| NR-0/4 (1) | 351.0 | 331.4 | 1.06 |
| NR-0/4 (2) | 331.0 | 331.4 | 1.00 |
| NR-2/4 (1) | 472.0 | 458.3 | 1.03 |
| NR-2/4 (2) | 451.2 | 458.3 | 0.98 |
| NR-4/4 (1) | 426.9 | 452.7 | 0.94 |
| NR-4/4 (2) | 422.3 | 452.7 | 0.93 |
| LR-2/4 (1) | 444.7 | 458.3 | 0.97 |
| LR-2/4 (2) | 428.7 | 458.3 | 0.94 |
| HR-2/4 (1) | 436.6 | 458.3 | 0.95 |
| HR-2/4 (2) | 446.1 | 458.3 | 0.97 |
| Average | - | 0.98 | |
| STD | - | 0.04 | |
| COV | - | 0.04 | |
© 2020 by the authors. Licensee MDPI, Basel, Switzerland. This article is an open access article distributed under the terms and conditions of the Creative Commons Attribution (CC BY) license (http://creativecommons.org/licenses/by/4.0/).
Share and Cite
Joo, H.-E.; Han, S.-J.; Park, M.-K.; Kim, K.S. Shear Tests of Deep Hollow Core Slabs Strengthened by Core-Filling. Appl. Sci. 2020, 10, 1709. https://doi.org/10.3390/app10051709
Joo H-E, Han S-J, Park M-K, Kim KS. Shear Tests of Deep Hollow Core Slabs Strengthened by Core-Filling. Applied Sciences. 2020; 10(5):1709. https://doi.org/10.3390/app10051709
Chicago/Turabian StyleJoo, Hyo-Eun, Sun-Jin Han, Min-Kook Park, and Kang Su Kim. 2020. "Shear Tests of Deep Hollow Core Slabs Strengthened by Core-Filling" Applied Sciences 10, no. 5: 1709. https://doi.org/10.3390/app10051709
APA StyleJoo, H.-E., Han, S.-J., Park, M.-K., & Kim, K. S. (2020). Shear Tests of Deep Hollow Core Slabs Strengthened by Core-Filling. Applied Sciences, 10(5), 1709. https://doi.org/10.3390/app10051709