Article

Environmental Impact of the Natural Gas Liquefaction Process: An Example from China

1
School of Economics and Management, China University of Petroleum (Beijing), Beijing 102249, China
2
PetroChina Huabei Oilfield Company, China National Petroleum Corporation, Cangzhou 062552, China
3
School of Economics and Management, Beihang University, Beijing 100191, China
*
Author to whom correspondence should be addressed.
Appl. Sci. 2020, 10(5), 1701; https://doi.org/10.3390/app10051701
Submission received: 5 February 2020 / Revised: 25 February 2020 / Accepted: 27 February 2020 / Published: 2 March 2020
(This article belongs to the Section Environmental Sciences)

Abstract

:
Considering its clean and environmental characteristics, natural gas has gradually attracted attention from countries around the world. China’s coal-to-gas project has significantly increased the country’s demand for, and supply of, natural gas. Liquefied natural gas (LNG) has also been gradually promoted, owing to its advantages of easy storage and transportation. However, the natural gas liquefaction process includes multiple phases, and each phase generates substantial industrial pollutants, such as CO2, SO2, and NOx. Despite this, the resulting environmental impacts have not been quantitatively assessed. Therefore, based on the production process of a liquefaction plant in the Shanxi Province, China, in this study, the Life Cycle Assessment (LCA) model was used to analyze the pollutant discharge in the unit’s natural gas liquefaction production process. By collecting data on the production capacity and composition reports of the eight major LNG-producing provinces, such as Henan, Sichuan, Inner Mongolia, Shaanxi, Xinjiang, Shanxi, Ningxia, and Hebei, the total amount of pollutants discharged from the natural gas liquefaction process in China was estimated. Finally, the environmental impact of the natural gas liquefaction process was evaluated according to the results of the environmental impact of pollutants. Our study arrived at the following conclusions: (i) 93.60% of China’s natural gas liquefaction output is concentrated in eight provinces; (ii) in terms of the unit’s LNG production, the Global Warming Potential (GWP), Acidification Potential (AP), Eutrophication Potential (EP), Photochemical Ozone Creation Potential (POCP) and Dust Potential (DP) proportions of each province explained the gas composition of LNG production gas sources in each province; (iii) the environmental problems caused by natural gas liquefaction were different in each provinces. In addition, we suggested relevant policy recommendations. First, the formulation of LNG-related policies should consider environmental pollution produced during the liquefaction stage. Second, if the problem of pollutant discharge in the liquefaction of natural gas is properly solved, it will not only reduce environmental pollution, but also generate additional income. Third, different provinces should optimize production technology based on the different gas qualities.

1. Introduction

With the increasing emphasis on environmental protection across the world, the advantages of natural gas in the clean production of energy have been gradually highlighted owing to its green environmental protection characteristics, and the prospects for its development are very promising [1,2]. The 13th Five-Year Plan for Energy Development, issued by the National Energy Administration of China, has predicted that natural gas will account for more than 10% of the energy consumption structure, and natural gas consumption will double by the year 2020. By the year 2030, the proportion of natural gas consumption will increase to 15%, consumers of natural gas may span across 500 billion square meters, and there will be a large scope for industrial development [3,4,5]. In China, the coal-to-gas project has led to a sharp rise in the natural gas supply and demand. Furthermore, it has increased the demand for liquefied natural gas (LNG) [6].
In fact, LNG has marked advantages over gaseous natural gas. After liquefaction, the volume of natural gas is greatly reduced to about 6% of the volume of the same amount of gaseous natural gas. From the perspective of storage and transportation, LNG is more efficient and convenient [7]. In addition, in the absence of a gas pipeline, LNG is transported by tankers to places it is difficult for the pipeline to reach in “point supply” mode, and local people can also use natural gas. Therefore, the use of LNG has begun to become widespread and the demand for it is gradually increasing; thus, the production of LNG has also witnessed an expansion [8].
Life cycle assessment (LCA) is an environmental impact assessment method set in accordance with the international ISO 14040 standard (1997, Environmental Management-Life cycle assessment-Principles and framework). It is an environmental impact assessment for the entire cycle of a product, from raw material procurement, to processing, manufacturing, sales, use, and disposal or recycling, and has a wide range of applications. In the field of architecture, Erlanfsson et al. [9] put forward a number of significant characteristics of the LCA methodology for buildings, constructions, and operation services, and then checked whether it was in accordance with “today’s practice and development needs”. In the field of transportation, Ally et al. [10] conducted a Life Cycle Assessment of Perth’s fuel cell bus trials to determine the overall environmental footprint and energy requirements by studying all stages of the entire transportation system, including hydrogen infrastructure, bus manufacturing, operations, and end-of-life disposal. In the field of energy, Shi et al. [11] provided a comparative LCA of remanufactured liquefied natural gas (LNG) and diesel engines, and identified the processes that contribute most to energy consumption and environmental impacts during the life cycles of the two engines.
As far as the liquefaction of natural gas is concerned, the process is very complicated and involves many important phases. At different phases, industrial pollutants, such as carbon oxides, sulfides and nitrogen oxides, are generated, and these industrial pollutants have an adverse impact on the environment. As a result, the study of environmental issues related to LNG has gradually become important. In terms of LNG-related technologies, Kanbur et al. [12] proposed an LNG cold-utilized micro-cogeneration system which combines a Stirling engine and a micro gas turbine. Thermodynamic efficiencies and power generation rates have been studied in thermodynamic analyses, whereas carbon dioxide emission rates and the relevant emission reductions have been studied in environmental analyses. He et al. [13] studied the energy waste in the regasification process of the LNG re-liquefaction terminal and proposed that the use of LNG cold energy may significantly improve the energy and exergy efficiencies of the system. Concerning the use of LNG, Langshaw et al. [14] evaluated the environmental and economic performance of LNG as a transition fuel to replace heavy-duty truck diesel, and proposed that the reduction in greenhouse gases by LNG heavy goods vehicles can only be achieved with an improvement in vehicle efficiency. Shi et al. [15] used the LCA method to quantify the energy-saving and environmental emissions of a remanufactured LNG engine and a newly manufactured diesel engine; both engines were compared in terms of material usage, cumulative energy requirements, and environmental emissions over their entire life cycle. Beyer et al. [16] evaluated the environmental hazards of the Hammerfest LNG wastewater discharge. Xiao et al. [17] reported that the main environmental impact of LNG projects is the wastewater, waste gas, and waste products generated during liquefaction. Through an analysis of the LNG production process, the main pollution discharge phases were identified, and the environmental protection measures that the project may undertake were discussed.
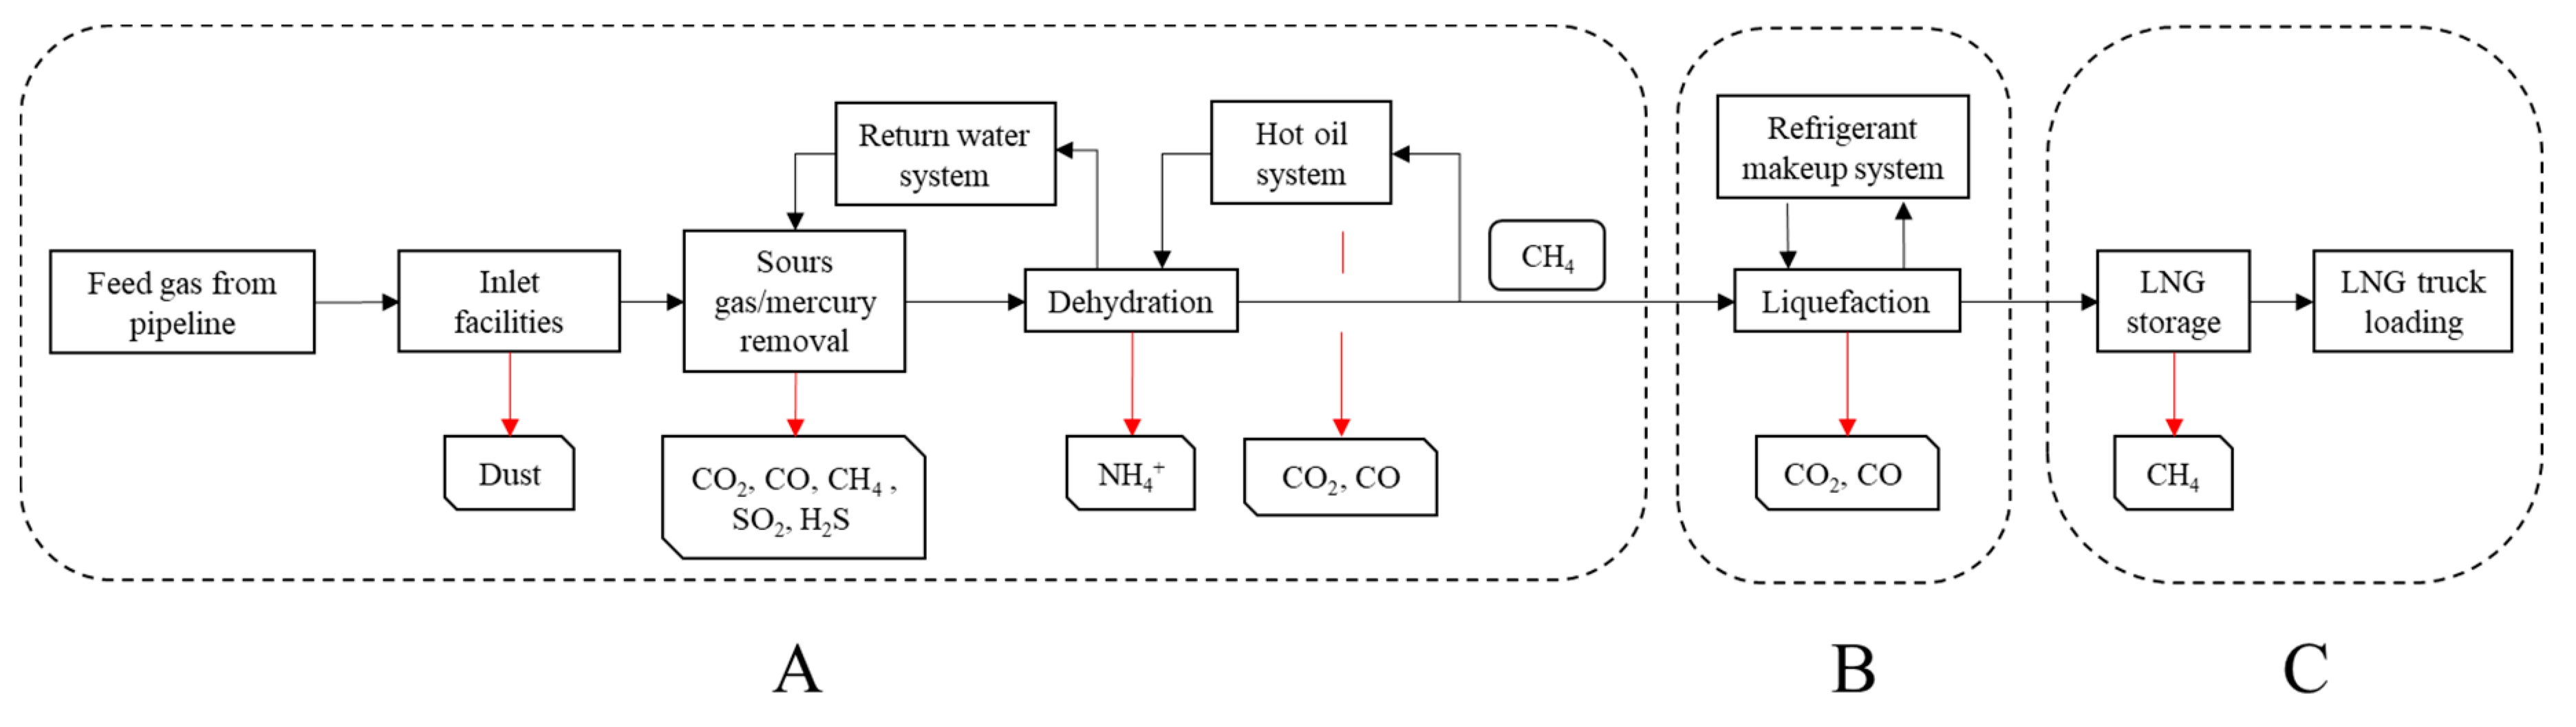
In summary, although there are many related studies, there is little research addressing the issue of industrial pollutant emissions during the natural gas liquefaction process, and the resulting environmental impact issues have not been quantitatively analyzed. Simultaneously, considering the complexity of the natural gas liquefaction process, there is no comprehensive and systematic evaluation of the current academic research. Therefore, this article chose the LCA method to comprehensively and carefully analyze the environmental impacts of wastewater, waste gas, and waste emissions during the natural gas liquefaction process in China and, based on this, proposed policy recommendations.

2. Method

The LCA method is an objective process employed to evaluate the environmental load related to products, processes, or actions. By identifying and quantifying the use of energy and material and environmental emissions, their impact can be evaluated [18]. This method is a product-oriented environmental assessment method [19]. It emphasizes that the research object is the entire life cycle of the product under study. Its holistic and comprehensive approach enables a comprehensive classification of data and results in the analytical process. Therefore, this method is very suitable for a quantitative study of the impact of industrial pollutants emissions on the environment during the liquefaction process of natural gas.

2.1. Goal and Scope

The significance of determining the goal is to decide the reason for performing an LCA. The purpose of this article was to account for the impact of industrial pollutant emissions on the environment in China’s natural gas liquefaction process. The research boundaries were specified considering the feasibility of data collection.
Currently, there are 86 LNG liquefaction plants in China, which are distributed in 17 provinces. The distribution of natural gas liquefaction plants in each province is shown in Figure 1.
We obtained daily data on the natural gas processing of 86 LNG liquefaction plants in China. The daily processing capacity of 17 natural gas liquefaction production provinces in China was calculated, and the total national gas liquefaction processing capacity was estimated to be approximately 68.15 million m3/d (Table 1).
The purpose of this study was to account for the impact of industrial pollutant emissions on the environment in China’s natural gas liquefaction process, and the emissions of industrial pollutants in different provinces during this stage were found to be affected by the composition of the natural gas sources in each province. From the perspective of the feasibility of data collection, it is very difficult to collect the gas composition reports of the LNG sources in 17 provinces situated across the country. Therefore, we selected eight major natural gas liquefaction provinces: Xinjiang, Inner Mongolia, Shaanxi, Shanxi, Ningxia, Henan, Sichuan, and Hebei. The environmental impact of these eight provinces in the natural gas liquefaction process can represent China’s overall situation (Figure 2).

2.2. Life Cycle Inventory

Inventory analysis is the expression of basic data throughout the life cycle and is the basis of the life cycle impact assessment. The process of establishing the inventory is to establish the system input and output of the corresponding functional unit for each process unit within the determined product system.
As the production processes of natural gas liquefaction plants in China are very similar, a natural gas liquefaction plant in the Shanxi Province was used as a model for the process flow. Based on this process flow, the environmental impact of natural gas liquefaction in the eight provinces and in China overall could be assessed. The specific process flow of natural gas liquefaction is shown in Figure 3. According to the functions of each step in liquefaction production, the entire production process was divided into three phases: pretreatment of gas, liquefaction and storage, and off-loading packing.
According to the evaluation principles of LCA, the system boundary for LCA in the natural gas liquefaction process includes the entire process, from the input of raw gas to the output of LNG. According to the output of pollutants in each step of the process flow, we determined the life-cycle pollutant emission map of the natural gas liquefaction plant, as shown in Figure 4. It should be noted that the pollutant emissions during natural gas liquefaction also include other substances, such as N2, which are not shown in Figure 4. This is because this part of the emission is minimal, and its impact on the environment is low. Therefore, in the calculation process, they were ignored. In addition, from the perspective of energy input, electricity is an important part of energy consumption in natural gas liquefaction. However, the environmental impact caused by it accounts for less than 1% of the total environmental impact, so it was omitted too.
It can be seen from Figure 4 that, in phase A, the main pollutant emissions include dust, CO2, CO, CH4, SO2, H2S, and NH4+. In phase B, the main pollutant emissions include CO2 and CO. In phase C, the main pollutant emission includes CH4. In addition, based on the gas composition report of natural gas sources in the Shanxi Province, we categorized the pollutant emission inventory of the LNG production process in the Shanxi Province per unit of output (Table 2).
In fact, the amount of pollutants discharged by each province in the natural gas liquefaction stage was determined by the gas composition of the province’s raw material gas. Therefore, in accordance with the liquefaction process of Shanxi Province, we summarized the pollutant emission inventories of LNG production in Xinjiang, Inner Mongolia, Shaanxi, Ningxia, Henan, Sichuan, and Hebei under unit output based on the gas composition reports of the eight provinces of China. Due to the limited length of the article, we decided to not list the emissions of the A, B, and C phases of the eight provinces separately, but directly list the total emissions. (Table 3).

2.3. Life Cycle Impact Assessment

The environmental impact of LCA is the result of the combined effects of various environmental interference factors. In order to apply LCA to various decision-making processes (such as policy development, product development, etc.), the potential impact on the environment must be assessed. In order to convert environmental emissions into environmental impacts, environmental impacts are classified and characterized in accordance with the framework established by the International Society of Environmental Toxicology and Chemistry and ISO14042 [20,21] (IOS 14042: 2000, Environmental Management-Life cycle assessment-Life cycle impact assessment. The third phase of life cycle assessment is described in IOS 14040). For example, according to ISO14042, Hertwich et al. [22] calculated and classified the impact categories global warming potential, acidification, and eutrophication of emissions of wastewater and organic household waste in a new city area.
Therefore, the life cycle environmental impact assessment mainly includes four parts:
  • Calculation of the environmental impact potential;
  • Standardization of the data;
  • Weightage of the different types of environmental impact potentials; and
  • Calculation of the environmental impact load.
Combined with the research content of this article, the specific calculation process is as follows.

2.3.1. Calculation of the Environmental Impact Potential

The product’s environmental impact potential is the sum of all the environmental emission impacts in the entire product system, and the formula is expressed as follows
EP ( j ) = E P ( j ) i = [ Q i   ×   E F ( j ) i ]
where EP(j) is the contribution of the product system to the jth potential environmental impact, E P ( j ) i is the contribution of the ith emission substance to the jth potential environmental impact,   Q i is the emission of the ith substance, and E F ( j ) i is the equivalent factor for the jth potential environmental impact of the ith emission substance. The determination of the equivalent factor varies with different types of environmental impacts. Typically, the relative impact size of other substances is calculated with reference to a standard substance.
According to the established inventory and taking the actual conditions of China’s environment into account, as well as combining them with the pollutant emissions during the natural gas liquefaction production process (the pollutants mainly included CH4, dust, CO2, CO, SO2, NH4+, and H2S), the environmental impact was divided into five categories: global warming potential (GWP), acidification potential (AP), eutrophication potential (EP), photochemical ozone creation potential (POCP), and dust potentials (DP) [21]. In addition, the environmental impact potential of each type of pollutant was calculated separately. Among them, the gases that had an impact on the GWP mainly included CO2, CO, and CH4. Taking CO2 as a reference substance, the equivalent factors were 1, 2, and 25, respectively. The gases that had an effect on the AP mainly included SO2, NH4+, and H2S. Taking SO2 as a reference substance, their equivalent factors were 1, 1.88, and 1.88, respectively. The gas that affected the EP was NH4+, and, taking NO3 as the reference substance, its equivalent factor was 3.64. The gases that affected the POCP mainly included CO, CH4, and SO2. Taking C2H4 as a reference substance, their equivalent factors were 0.03, 0.007, and 0.05, respectively. The substance that had an effect on the DU was mainly dust, so its reference substance was dust itself, and its equivalent factor was 1.
Based on Table 2, the impact potential of LNG production in the Shanxi Province was calculated and is shown in Table 4. Similarly, we calculated the impact potential of the other seven provinces, as shown in Table 5.

2.3.2. Standardization of the Data

The purpose of data standardization is to provide a comparable standard for the relative contributions of various types of environmental impacts. The standardization process is mainly used to establish a standardization benchmark. For global environmental impacts, global benchmarks should be used, and for regional and local environmental impacts, Chinese (or regional) benchmarks should be used. In order to compare global, regional, and local impacts, the 1990s per capita environmental impact potential was used as the environmental impact benchmark, and the formula can be expressed as follows [23]
ER ( j ) 90 = EP ( j ) 90 / Pop 90
where ER(j)90 is the global (or China) per capita environmental impact potential in 1990. EP(j)90 is the global (or China) total environmental impact potential in 1990, and Pop90 is the global (or China) population in 1990.
According to this benchmark, the environmental impact potential of the standardized product system can be expressed as follows
NEP ( j ) = EP ( j ) / ( T   ×   ER ( j ) 90 )
where NEP(j) is a standardized value and T is the product service period. The unit of environmental impact potential after standardization is the standard population equivalent, namely, PEW Cn90. W represents the world population, Cn represents the Chinese population, and 90 represents 1990 as the base year.
The purpose of normalizing the calculation results of latent values is to better understand the relative magnitude of each environmental impact in the study object. The equivalent standard of the standardization process is the Chinese standard population equivalent standard, as calculated by Yang et al. [23]. The equivalent standards for GWP, AP, EP, POCP, and DP are 8700, 36, 61, 0.65, and 18 kg/p⋅a, respectively [24]. By dividing the annual environmental impact potential value of the natural gas liquefaction process by the standard population equivalent standard of environmental impact, the standardized environmental impact potential value can be obtained.
According to the above method, the environmental standardized values of the eight provinces of China in the LNG production stage were produced and are shown in Table 6.

2.3.3. Weightage of the Different Types of Environmental Impact Potential

After standardization, if two different types of environmental impact potential have the same magnitude, it does not mean that the potential environmental impacts of the two types are equally serious. Therefore, the importance of impact types needs to be determined; that is, different impact types are given different weightages before they can be compared. This process is called weighted evaluation. The weightage is determined using the “target distance method”, which is where the severity of an environmental effect is characterized by the distance between the current level of the effect and the target level [24]. This study used the Chinese government’s reduction targets for the year 2000 to determine the weightage of the different types of environmental impact in China. The formulae used are shown below
WP ( j ) = WF ( j ) × EP ( j ) / ER ( j ) 90 , ER ( j ) T 2000 = E P ( j ) T 2000 / Pop 90 , WF ( j ) = ER ( j ) 90 / ER ( j ) T 2000 ,
where WP(j) is the weightage value, WF(j) represents the weightage factors, ER(j)90 is the standardized value for the year 1990, and ER(j)T2000 is the standardized value for the year 2000.
The standardized environmental impact potentials were assigned weightages. The weightage factors of GWP, AP, EP, POCP, and DU were found to be 0.83, 0.73, 0.73, 0.53, and 0.61, respectively [24]. The weightage of the environmental impact potential value can be obtained by multiplying the normalized environmental impact potential value by a weightage factor.
According to the above-mentioned method, the environmental weightage value of the LNG production process in the eight provinces of China per unit output was determined and is shown in Table 7.

2.3.4. Calculation of the Environmental Impact Load

The weighted potential of various environmental impacts is comparable and reflects their relative importance; therefore, they can be integrated into a simple indicator called the environmental impact load. This reflects the pressure of the product system under study on the environmental system throughout its life cycle.
The total environmental impact potential of the eight provinces of Henan, Sichuan, Inner Mongolia, Shaanxi, Xinjiang, Shanxi, Ningxia, and Hebei at the unit production level is shown in Table 8.

3. Results and Discussion

According to Table 1, China’s natural gas liquefaction volume may reach 68,150,000 m3 per year, and the output of LNG was about 45,768.97 t. From the perspective of an environmental impact assessment, the annual environmental impact loads of Xinjiang, Inner Mongolia, Shaanxi, Shanxi, Ningxia, Henan, Sichuan, and Hebei in the liquefaction stage of natural gas were 746,115 p⋅a, 4,117,479 p⋅a, 3,873,521 p⋅a, 540,931 p⋅a, 1,439,688 p⋅a, 194,030 p⋅a, 191,898 p⋅a, and 226,758 p⋅a, respectively. The total environmental impact load of these eight provinces was found to be 11,330,420 p⋅a. The environmental impact potential of natural gas liquefaction at unit output and the environmental impact potential of natural gas liquefaction at annual output were analyzed separately and are presented in the following sections.

3.1. Environmental Impact Potential of Natural Gas Liquefaction at Unit Output

Owing to the different qualities of raw material gas for natural gas liquefaction in China’s provinces, the GWP, AP, EP, POCP, and DU results for Xinjiang, Inner Mongolia, Shaanxi, Shanxi, Ningxia, Henan, Sichuan, and Hebei were found to be different for each unit of LNG production. Therefore, this section discusses the results of each indicator under the unit output in the natural gas liquefaction stage. The following six results can be inferred from Figure 5.
First, as shown in Figure 5a, the difference in the GWP of the eight provinces was not significant. Specifically, Inner Mongolia, Ningxia, and Shaanxi had the largest GWP results, and Sichuan had the smallest GWP result. In particular, the GWP results of Inner Mongolia (the largest GWP result) were found to be nearly 1.76 times higher than those of Sichuan.
Second, as shown in Figure 5b, the AP results of the eight provinces were found to be quite different. Among them, Xinjiang, Hebei, and Henan had the largest AP results, whereas the remaining five provinces had smaller AP results. In particular, the AP results of Xinjiang (the largest AP result) were nearly 29 times higher than those of Ningxia (the smallest AP result).
Third, as shown in Figure 5c, the EP results of the eight provinces varied widely. Among them, Xinjiang, Hebei, and Henan had the largest EP results, whereas the remaining five provinces had smaller EP results. In particular, the EP results of Xinjiang (the largest EP result) were found to be nearly 281.5 times higher than those of Sichuan (the smallest EP result).
Fourth, as shown in Figure 5d, the POCP results of the eight provinces were found to be uneven. Among them, Shaanxi, Ningxia, and Inner Mongolia had the largest POCP results, whereas Sichuan had the smallest POCP results. In particular, the POCP results of Shaanxi (the largest POCP result) were found to be nearly 6.14 times higher than those of Sichuan.
Fifth, as shown in Figure 5e, the DP results of the eight provinces were uneven. Among them, Sichuan, Shaanxi, and Inner Mongolia had the largest DP results, whereas Shanxi had the smallest DP results. In particular, the DP results of Sichuan (the largest DP result) were found to be nearly 3.40 times higher than those of Shanxi.
Sixth, as shown in Figure 5f, the total environmental impact (EI) potential of the eight provinces varied widely. Among them, Shaanxi, Ningxia, and Inner Mongolia had the largest total EI potential, whereas Sichuan had the smallest total EI potential. In particular, the total EI potential of Shaanxi (the largest total EI potential) was found to be nearly 4.96 times higher than that of Sichuan.

3.2. Environmental Impact Potential of Natural Gas Liquefaction at Annual Output

Based on the calculation of the environmental impact potential of natural gas liquefaction per unit of production, we calculated the GWP, AP, EP, POCP, DU, and Total EI Potential weights of Xinjiang, Inner Mongolia, Shaanxi, Shanxi, Ningxia, Henan, Sichuan, and Hebei during the natural gas liquefaction process at annual output levels. The following six conclusions can be drawn from Figure 6.
First, according to the annual GWP results of the eight provinces, China’s annual GWP was estimated to be about 1,257,526 p⋅a. Inner Mongolia and Shaanxi had the largest annual GWP weights, accounting for 33.59% and 28.69%, respectively (Figure 6a). In contrast, Henan had the smallest annual GWP weight, accounting for 2.59%. Inner Mongolia and Shaanxi had the highest annual GWP weights, owing to their higher LNG production and higher greenhouse gas content in the gas source components.
Second, according to the annual AP results of the eight provinces, China’s annual AP was estimated to be about 40,333 p⋅a. Xinjiang, Hebei, and Inner Mongolia had the largest annual AP weights, accounting for 33.40%, 20.87%, and 20.40%, respectively (Figure 6b). The total annual AP weights of the five remaining provinces accounted for less than 30%, of which Ningxia accounted for only 1.41%. Therefore, the AP weights and natural gas liquefaction output were not completely proportional. The main reason for this disproportion is that the components of the Hebei and Xinjiang natural gas sources had a relatively high acid content, especially SO2 and NH4+. Therefore, although LNG production was not high, the AP weights remained high.
Third, according to the annual EP results of the eight provinces, China’s annual EP was estimated to be about 43,437 p⋅a. Xinjiang, Hebei, and Inner Mongolia had the largest annual EP weights, accounting for 33.11%, 22.48%, and 21.80%, respectively (Figure 6c). However, Ningxia and Sichuan had extremely small annual EP weights of 0.95% and 0.09%, respectively. Therefore, the EP weights of Xinjiang and Hebei were not directly proportional to the liquefaction output of these two provinces. The main reason for this was that the content of NH4+ in the components of the natural gas sources in these two provinces was relatively high.
Fourth, according to the annual POCP results of the eight provinces, China’s annual POCP was estimated to be about 10,760,516 p⋅a. Inner Mongolia and Shaanxi had the largest annual POCP weights, accounting for 36.38% and 34.64%, respectively (Figure 6d). The total annual POCP weight of the six remaining provinces was less than 30%. The smallest two values were for Henan and Sichuan, which accounted for 1.55% and 1.38%, respectively. The POCP weights of the provinces were not completely proportional to their natural gas production. However, because the natural gas liquefaction output and gas source components in Inner Mongolia and Shaanxi were relatively high in photochemical ozone synthesis substances, these two provinces had the largest annual POCP weights.
Fifth, according to the annual DP results of the eight provinces, China’s annual DP was estimated to be about 2420 p⋅a. Inner Mongolia and Shaanxi had the largest two annual DP weights, accounting for 32.07% and 31.73%, respectively (Figure 6e). The remaining six provinces accounted for smaller annual DP weights. Therefore, the DP weights of each province were not completely proportional to natural gas production. However, owing to the higher levels of DP weights in the natural gas liquefaction output and gas source components in Inner Mongolia and Shaanxi, the annual DP weights of these two provinces were the largest.
Sixth, Inner Mongolia and Shaanxi had the largest annual total EI potential weights (Figure 6f), and these two provinces accounted for about 70% of the annual total EI potential. The annual EI potential weights of the remaining six provinces were between 2% and 13%, and they were small.
The status of pollution in each province is shown in Figure 7. The total annual environmental impact potentials of the eight provinces of Xinjiang, Inner Mongolia, Shaanxi, Shanxi, Ningxia, Henan, Sichuan, and Hebei during the liquefaction stage of natural gas were found to be 746,115 p⋅a, 4,117,479 p⋅a, 3,735,521 p⋅a, 1,541,688 p⋅a, 194,330 p⋅a, and 191,898 p⋅a, respectively. Based on the annual total EI potential results of the eight provinces, it was estimated that China’s annual total EI potential is approximately 12,104,231 p⋅a. At the same time, it could be estimated that the annual GWP, AP, EP, POCP, and DP results of China in the process of natural gas liquefaction are about 1,257,526 p⋅a, 40,333 p⋅a, 43,437 p⋅a, 10,760,516 p⋅a, and 2420 p⋅a, respectively.

4. Conclusions

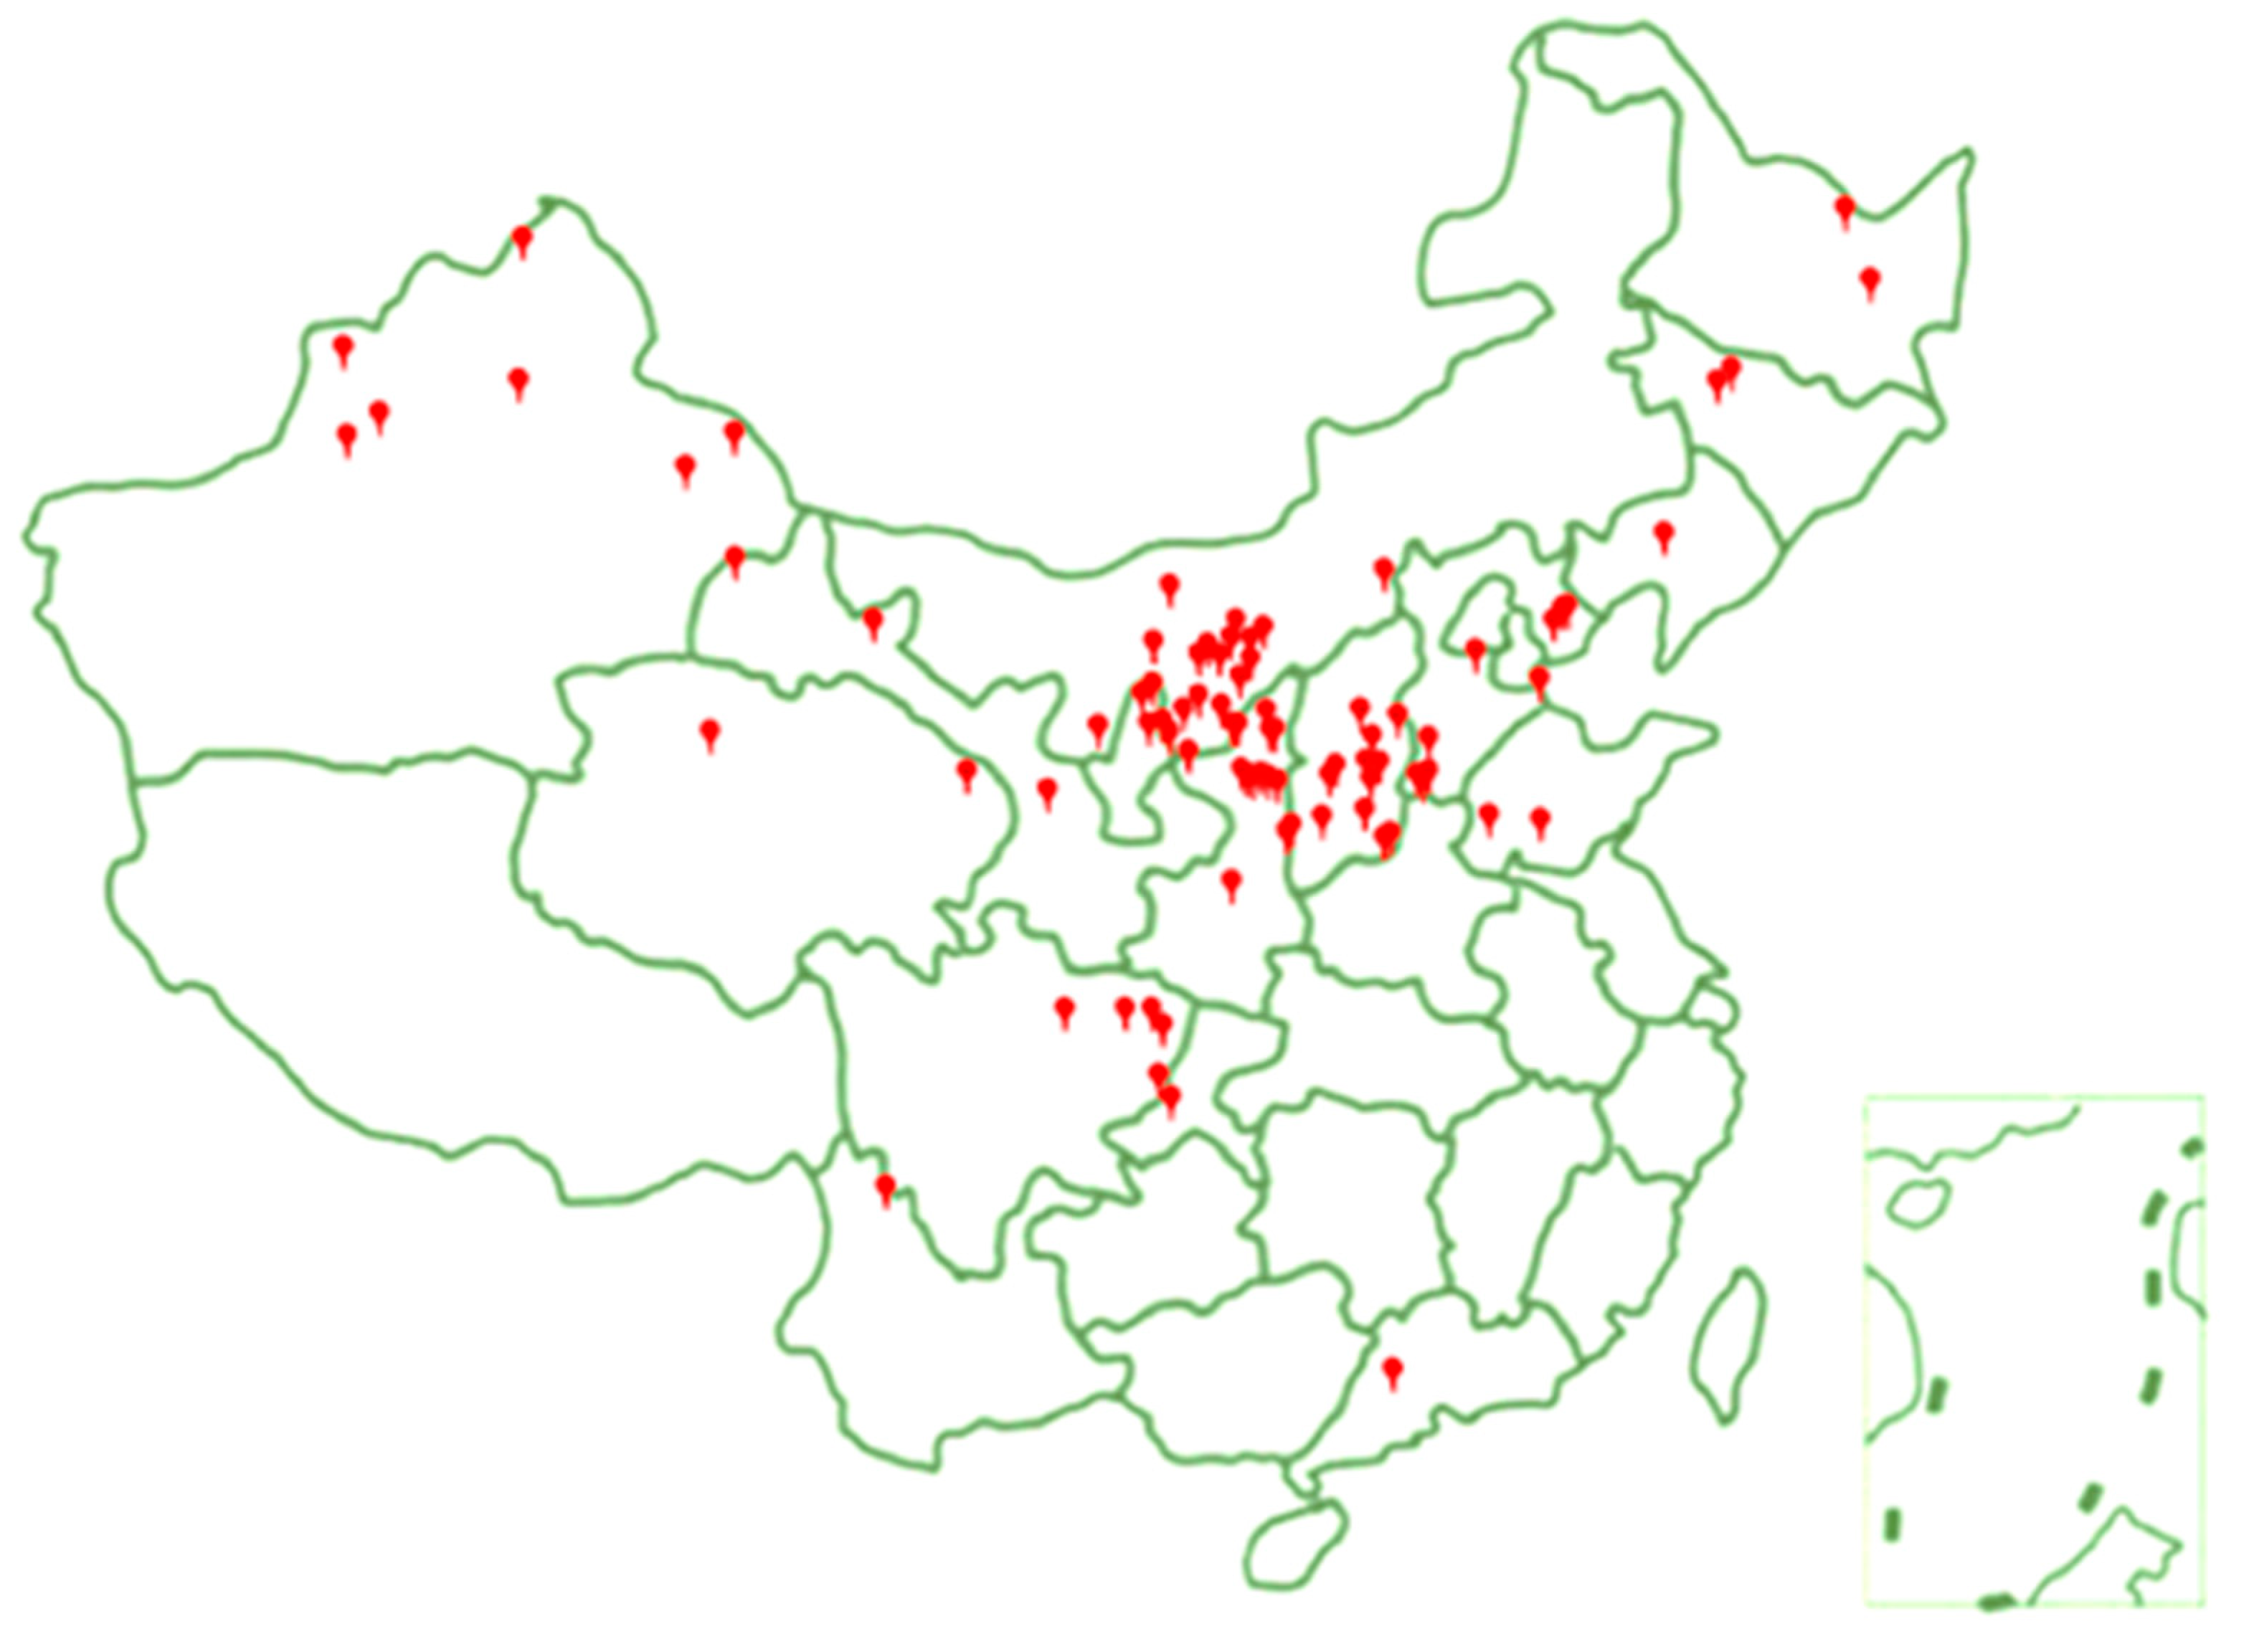
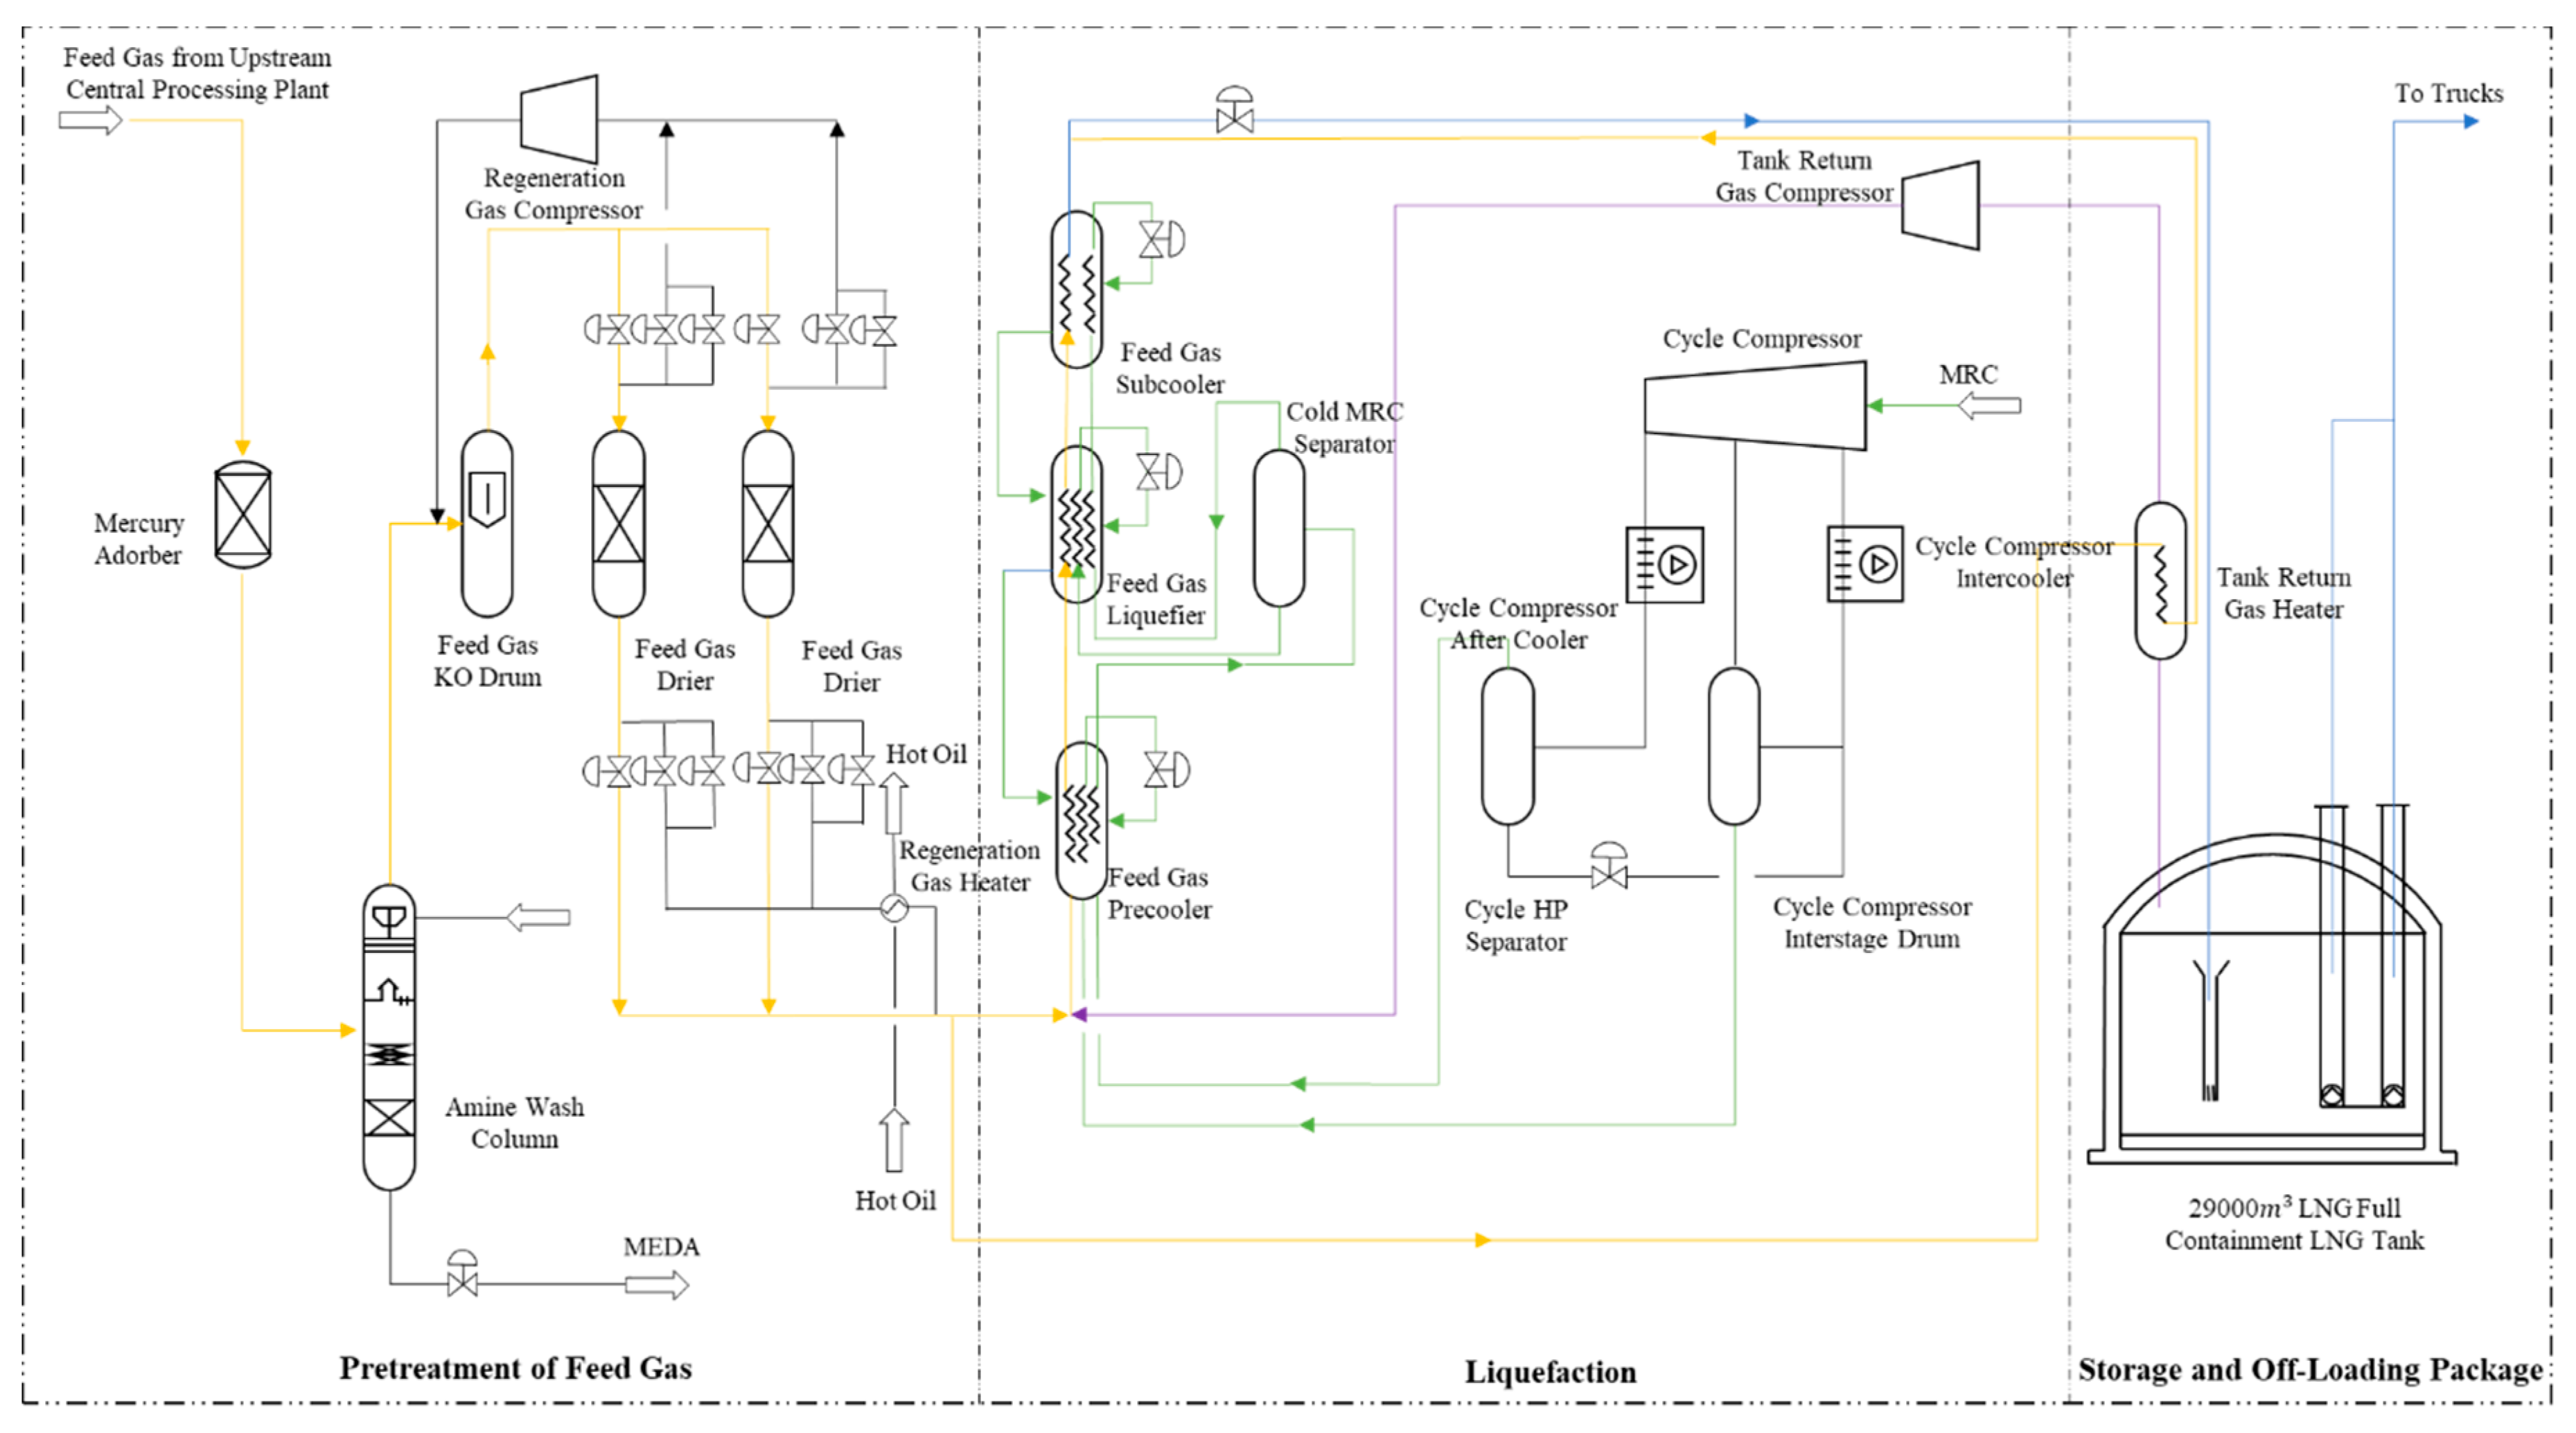
This article uses the LCA method to study the problem of industrial pollutant emissions during the natural gas liquefaction process in China. The production data were collected for 86 LNG liquefaction plants in China and the gas quality reports were collected for eight major natural gas liquefaction production provinces (Xinjiang, Inner Mongolia, Shanxi, Shanxi, Ningxia, Henan, Sichuan, and Hebei). Using a natural gas liquefaction plant in Shanxi Province as the process flow reference, we performed a series of data processing and calculations. We first conducted a quantitative study on the environmental impact of natural gas liquefaction. Specifically, the environmental impact potential of natural gas liquefaction at the unit output level of the listed eight provinces, and the environmental impact potential of natural gas liquefaction at the annual output level, were calculated and compared. Based on this, China’s GWP, AP, EP, POCP, DP, and total EI potential were calculated, and the following research conclusions were drawn.
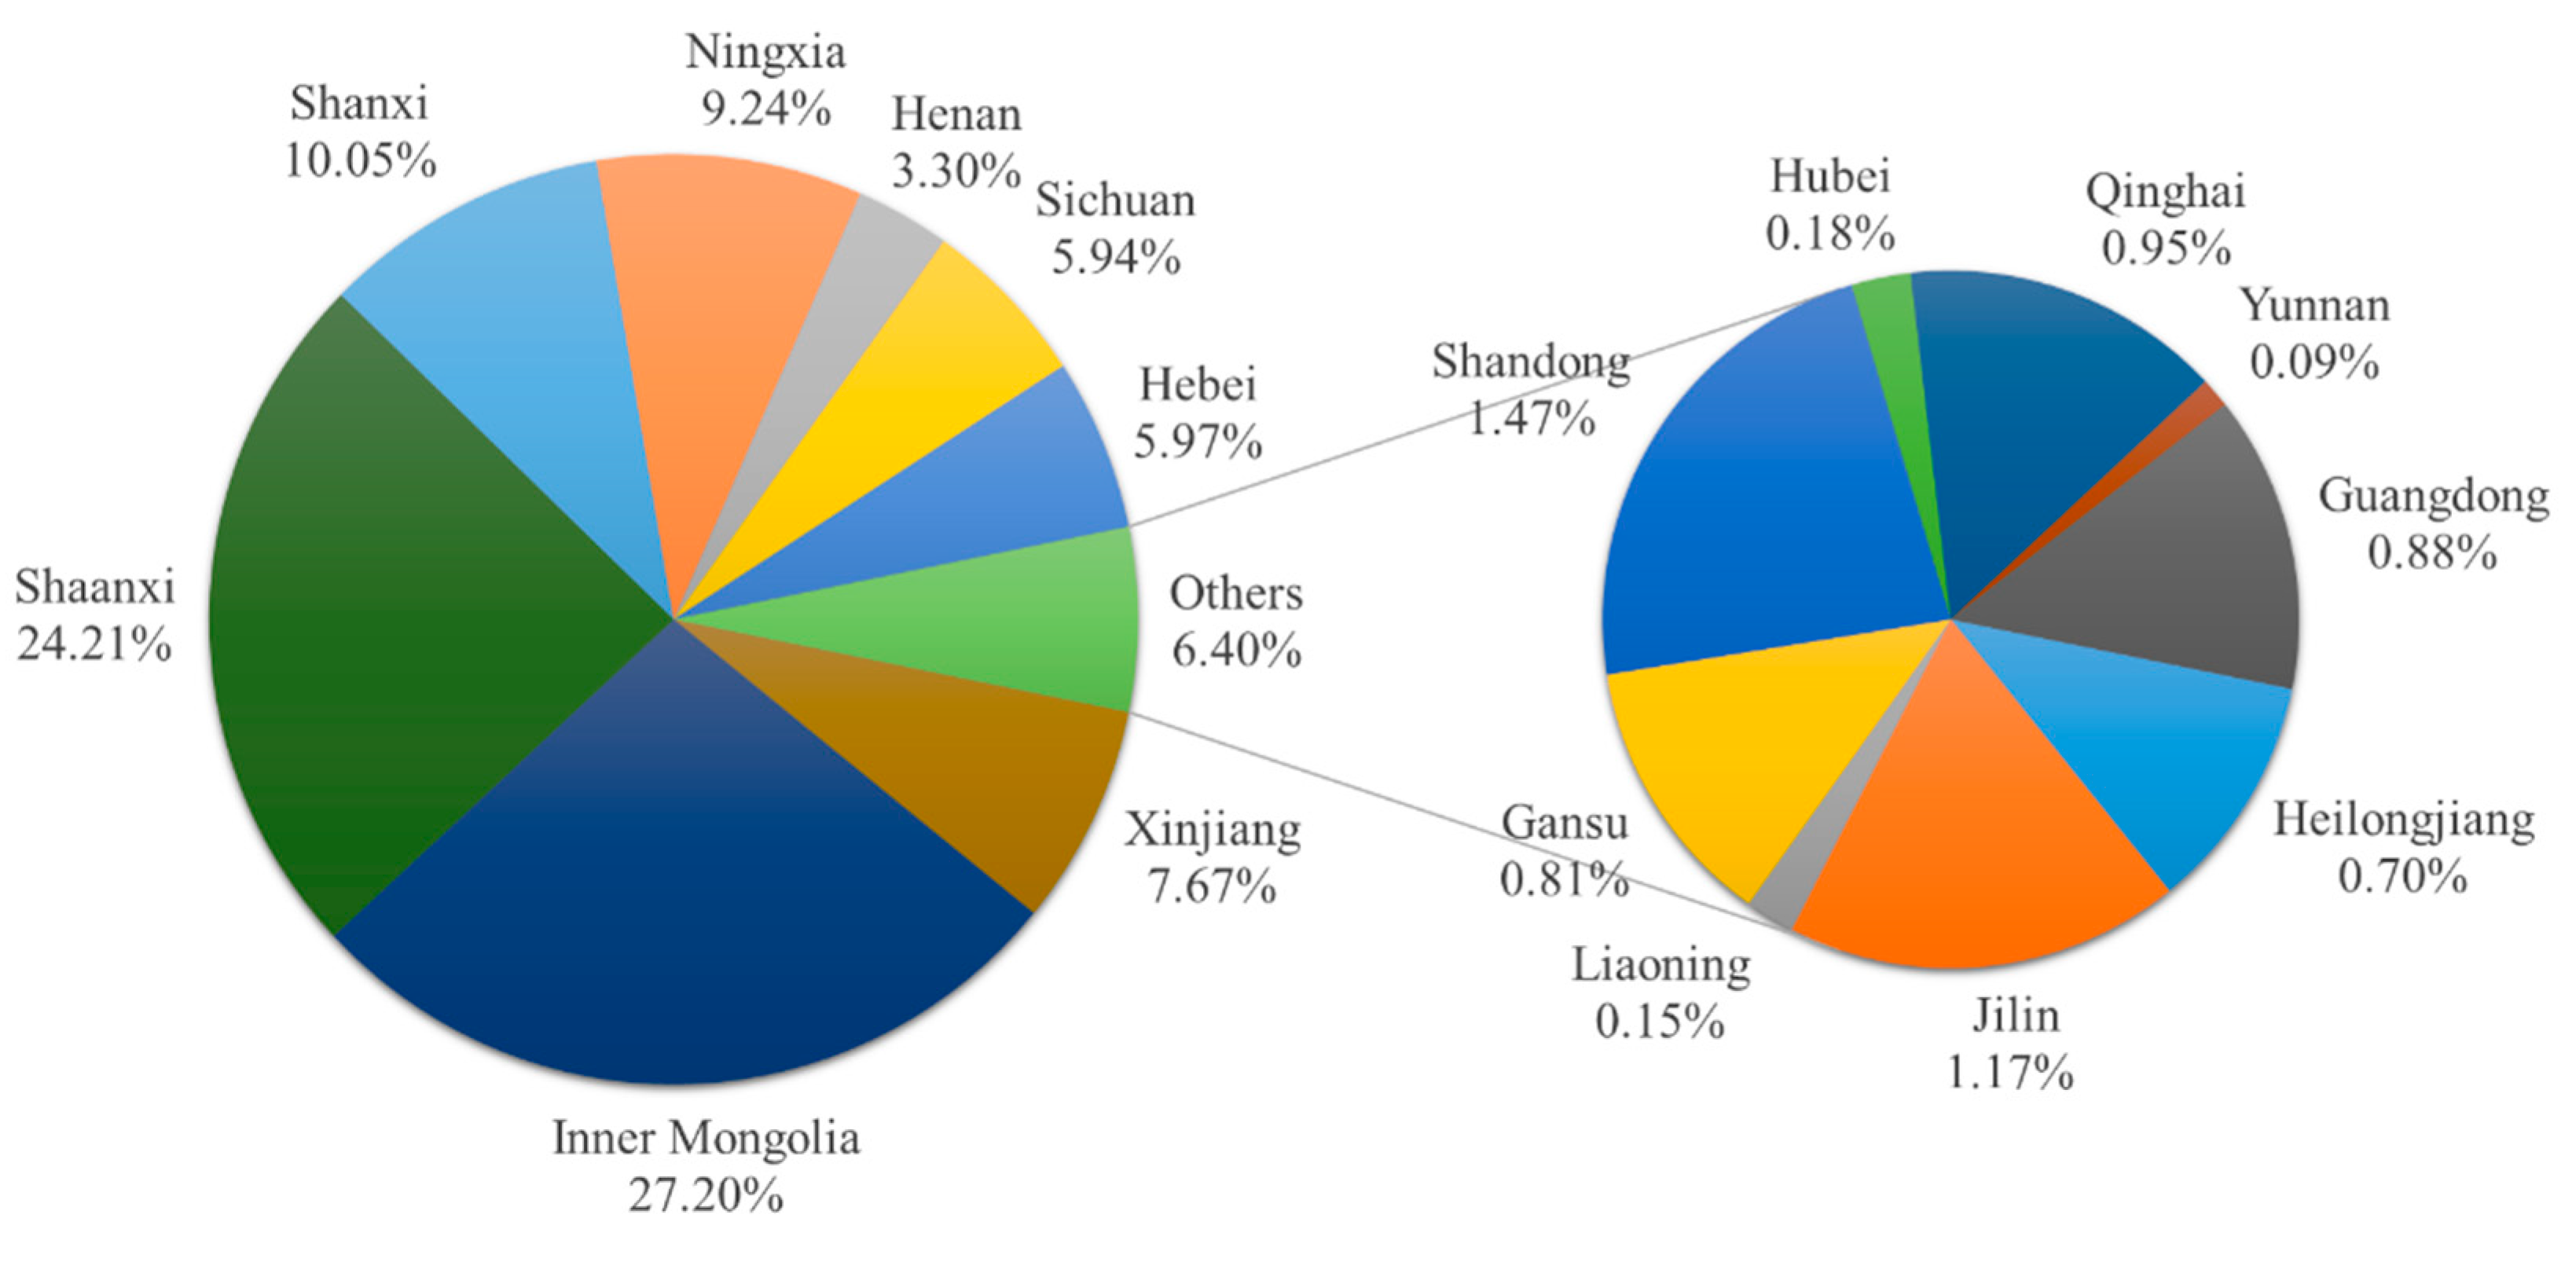
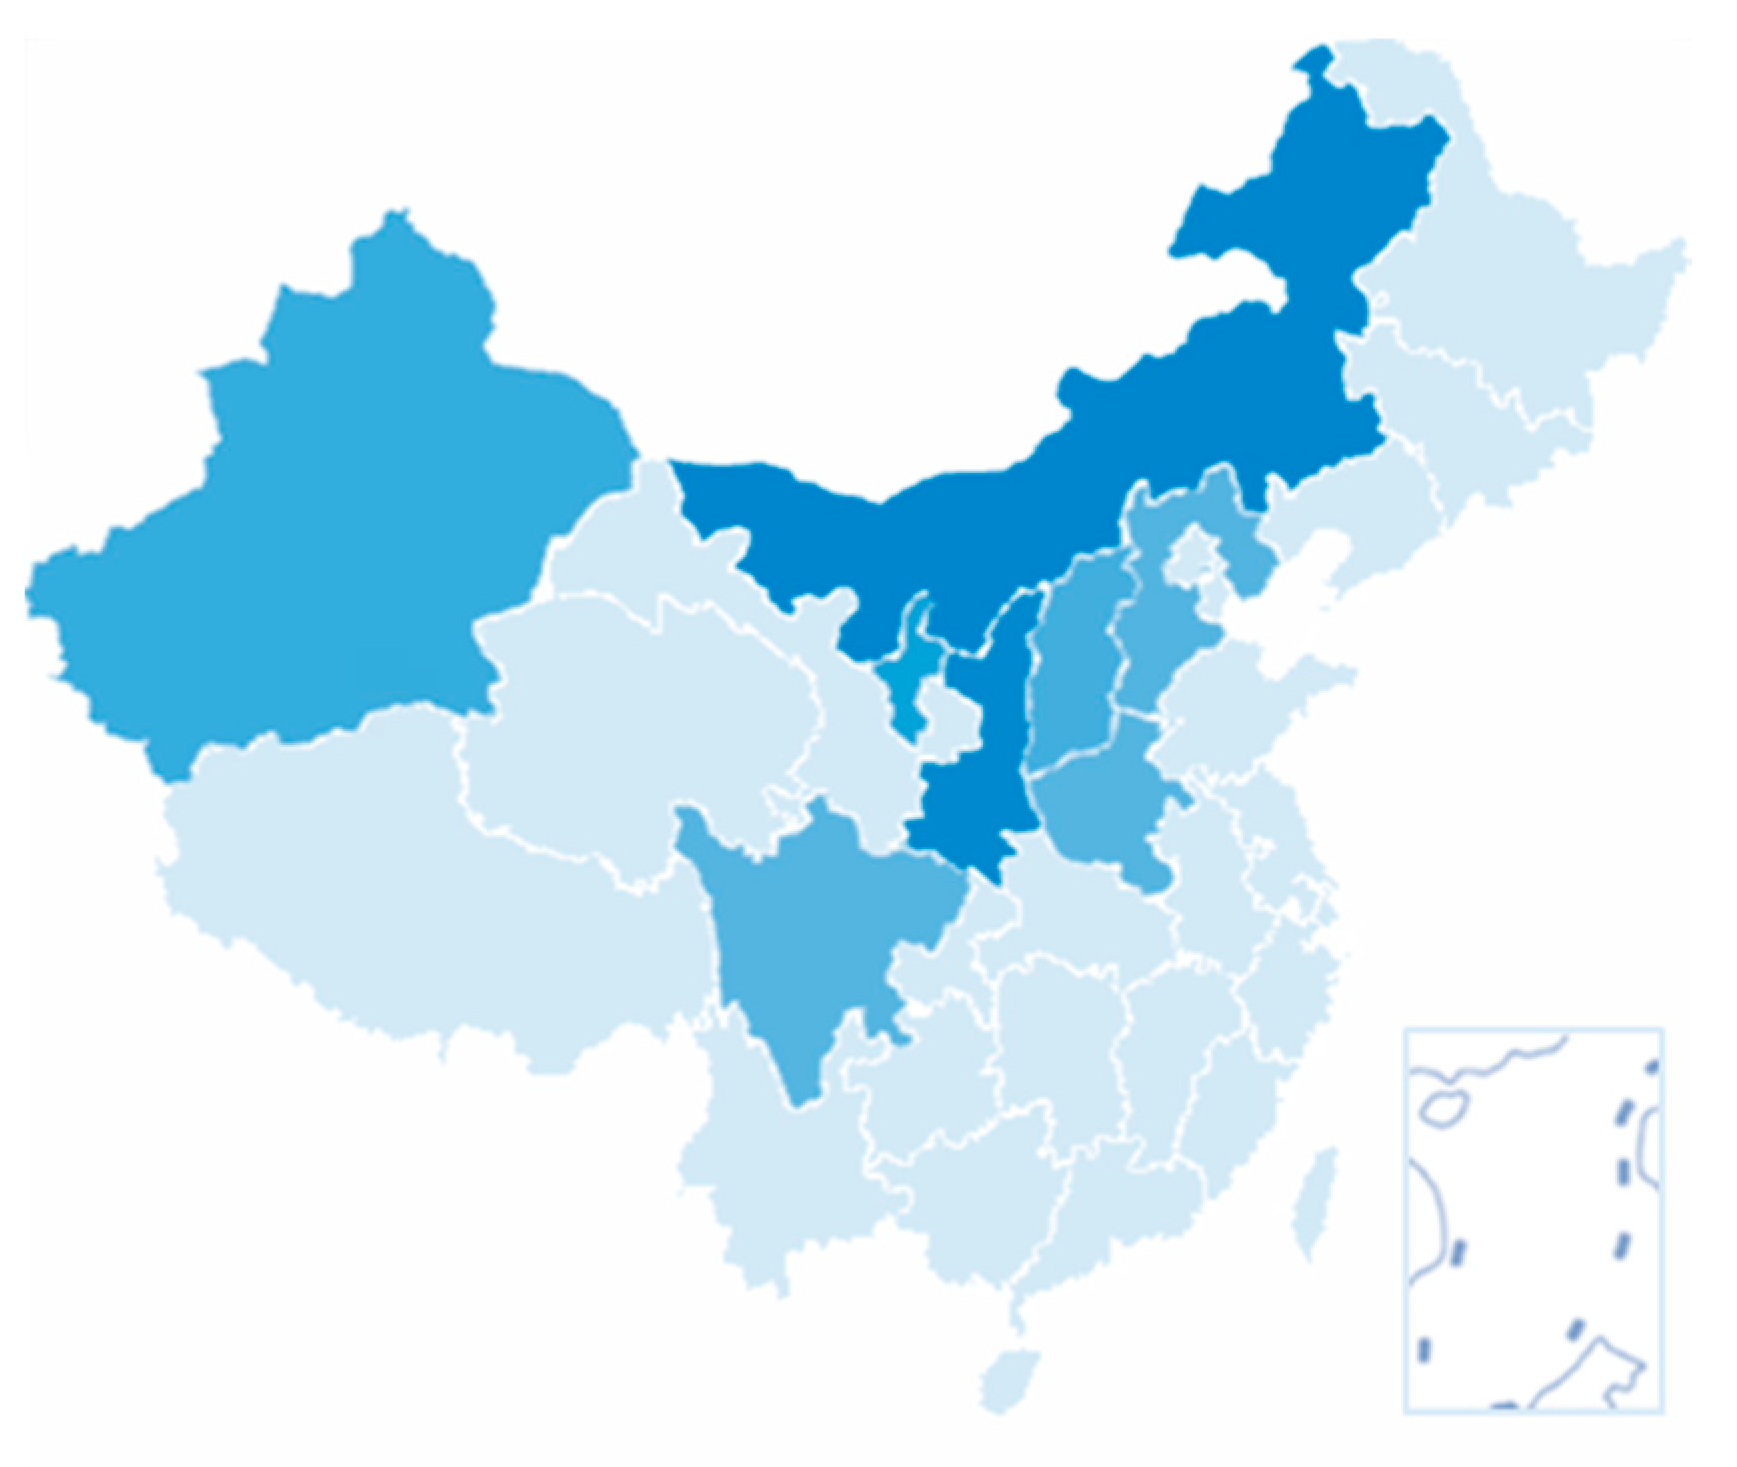
First, 93.60% of China’s natural gas liquefaction output was concentrated in eight provinces: Xinjiang, Inner Mongolia, Shanxi, Shanxi, Ningxia, Henan, Sichuan, and Hebei. Among them, Inner Mongolia and Shaanxi had the largest number of liquefaction plants, and the sum of LNG production in the two provinces exceeded 50% of the total national output. The reason for this may be attributed to the relatively low construction cost of the LNG liquefaction plant in Inner Mongolia, the small initial investment, and local policies that are conducive to the construction of these plants. Shaanxi Province had a large amount of natural gas extraction. Building a liquefaction plant nearby may reduce transportation and time costs.
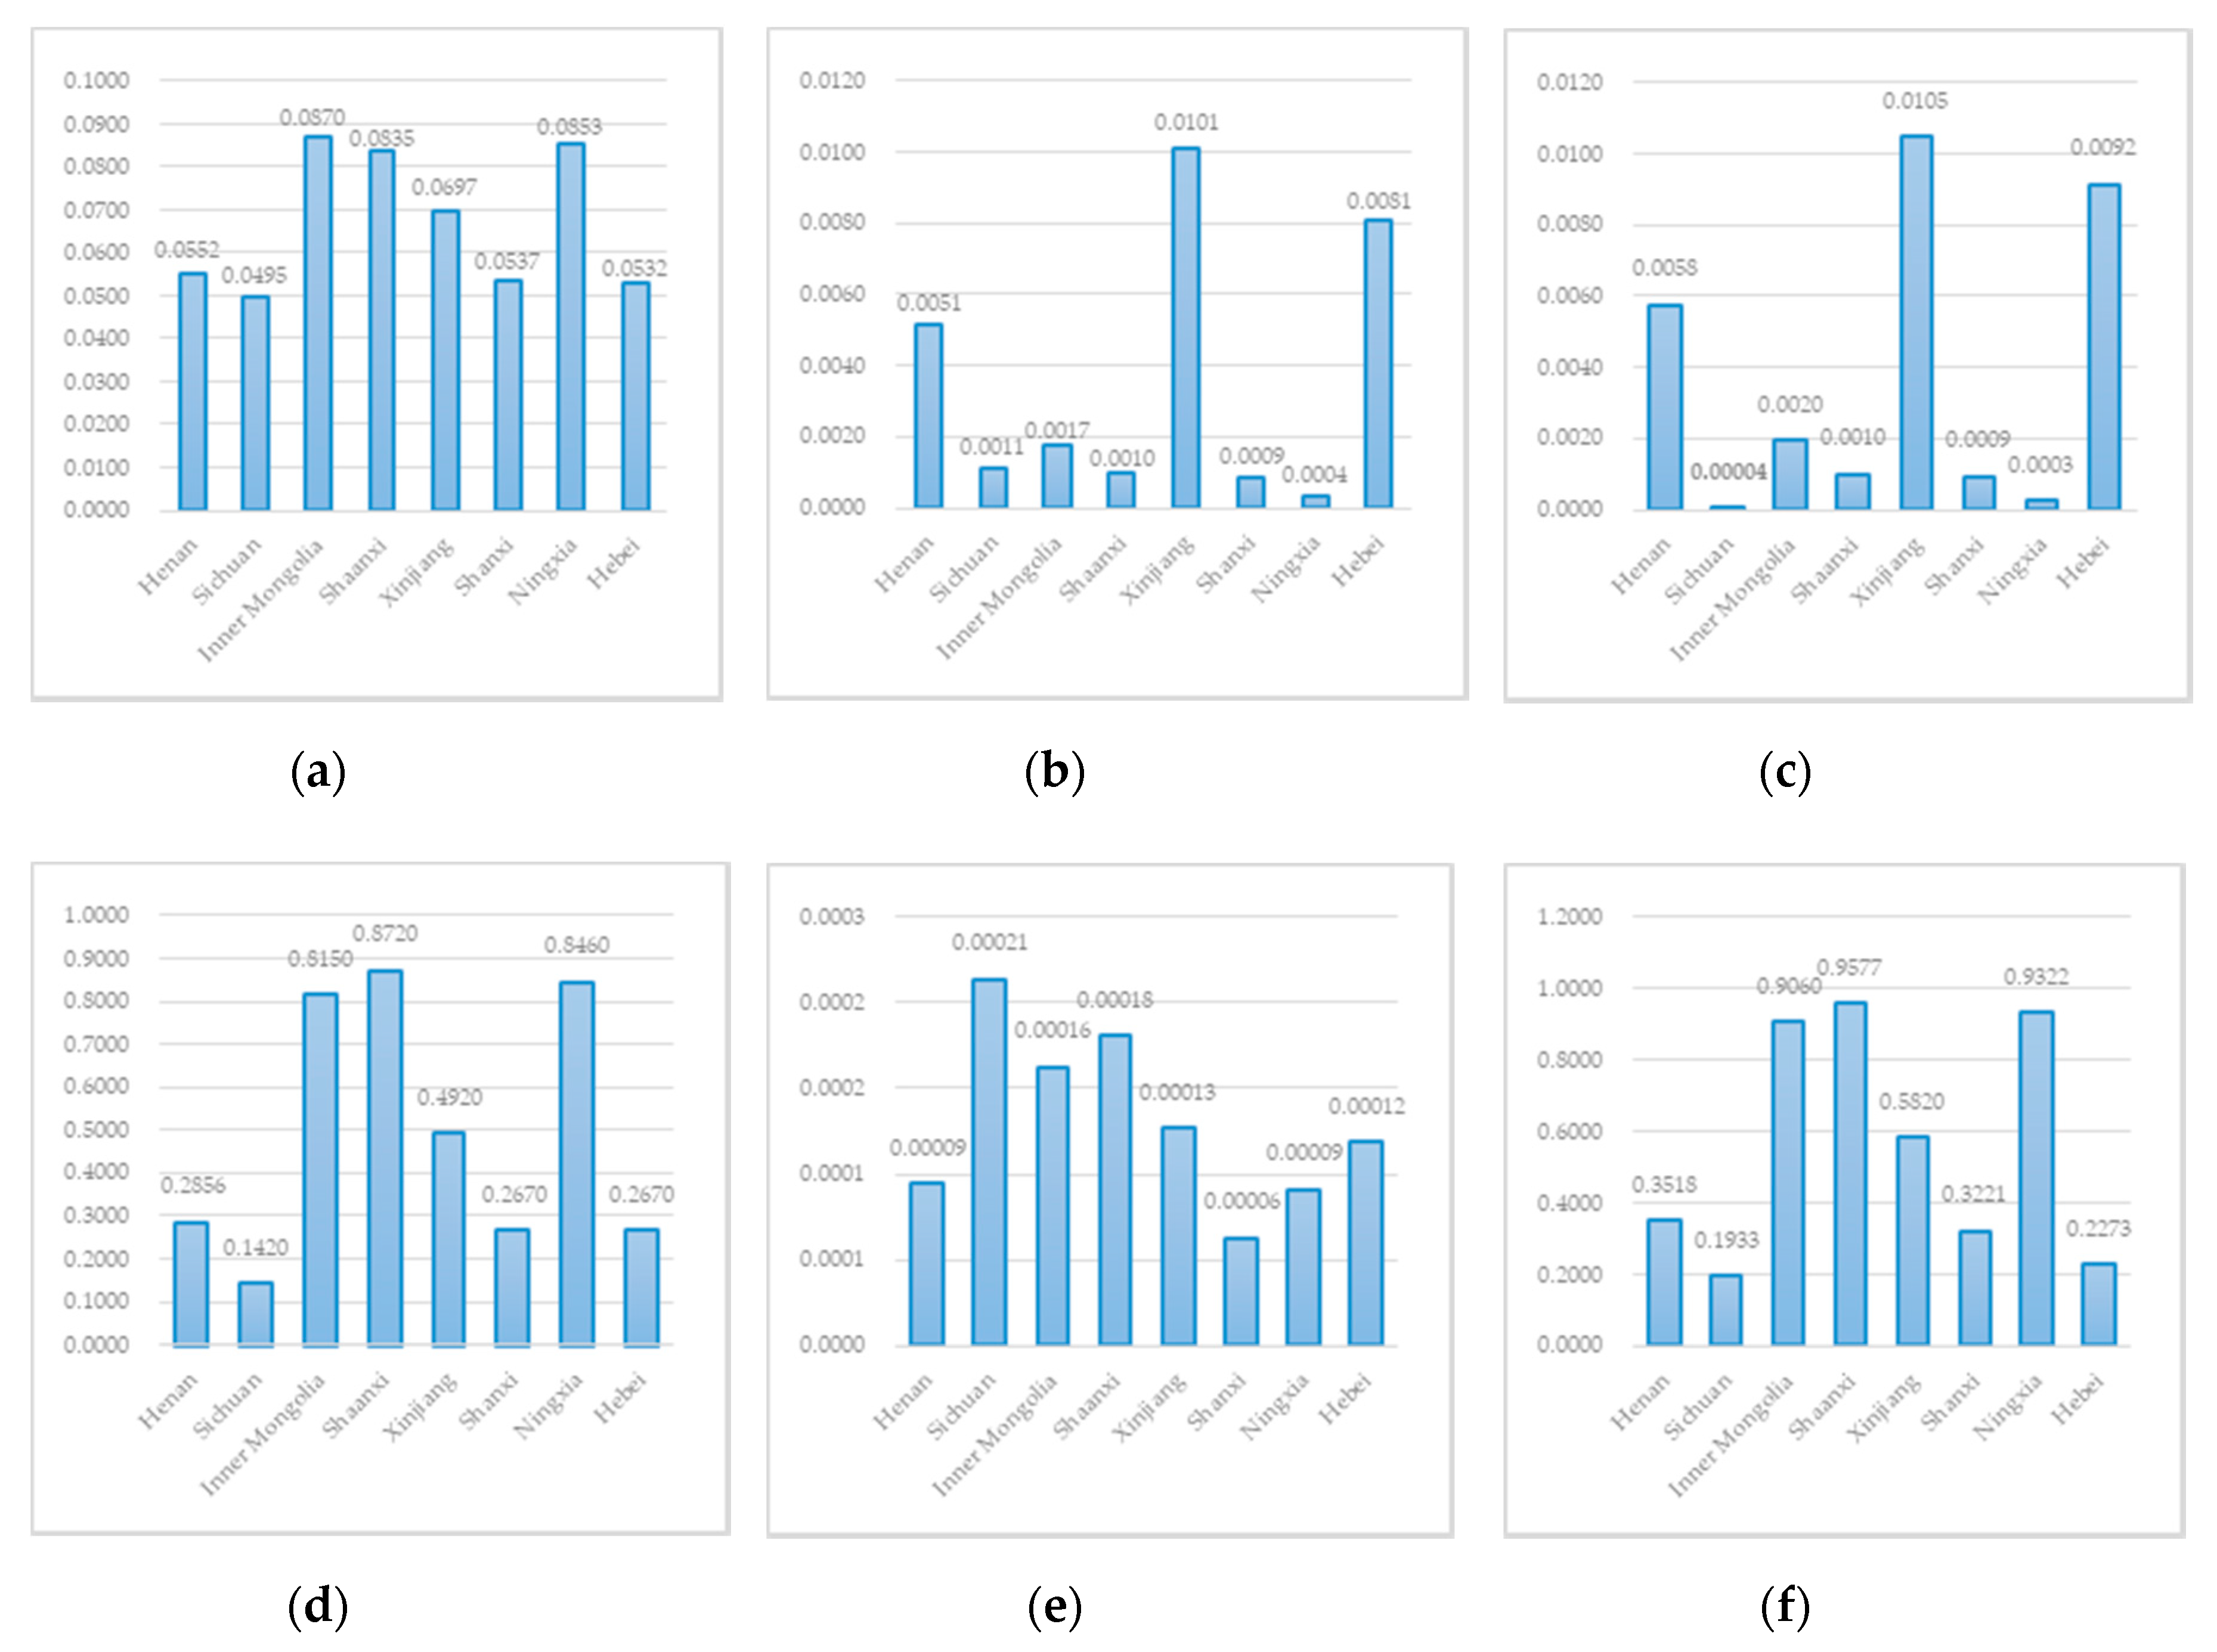
Second, in terms of the unit LNG production, the GWP, AP, EP, POCP, and DP of each province explained the gas composition of LNG production gas sources in each province. Among them, Inner Mongolia, Ningxia, and Shaanxi contained the largest greenhouse gas emissions, and Sichuan had the lowest greenhouse gas emissions. Gas sources in Xinjiang, Hebei, and Henan contained the greatest amount of acidified substances, and the remaining five provinces had low amounts. Xinjiang, Hebei, and Henan collectively had the most gas eutrophication in the gas source, and the remaining five provinces had low amounts of gas eutrophication. Shaanxi, Ningxia, and Inner Mongolia had the highest levels of photochemical smog, whereas Sichuan had the lowest levels of photochemical smog. Gas sources in Sichuan, Shaanxi, and Inner Mongolia contained the greatest amount of dust, whereas Shanxi had the least amount of dust.
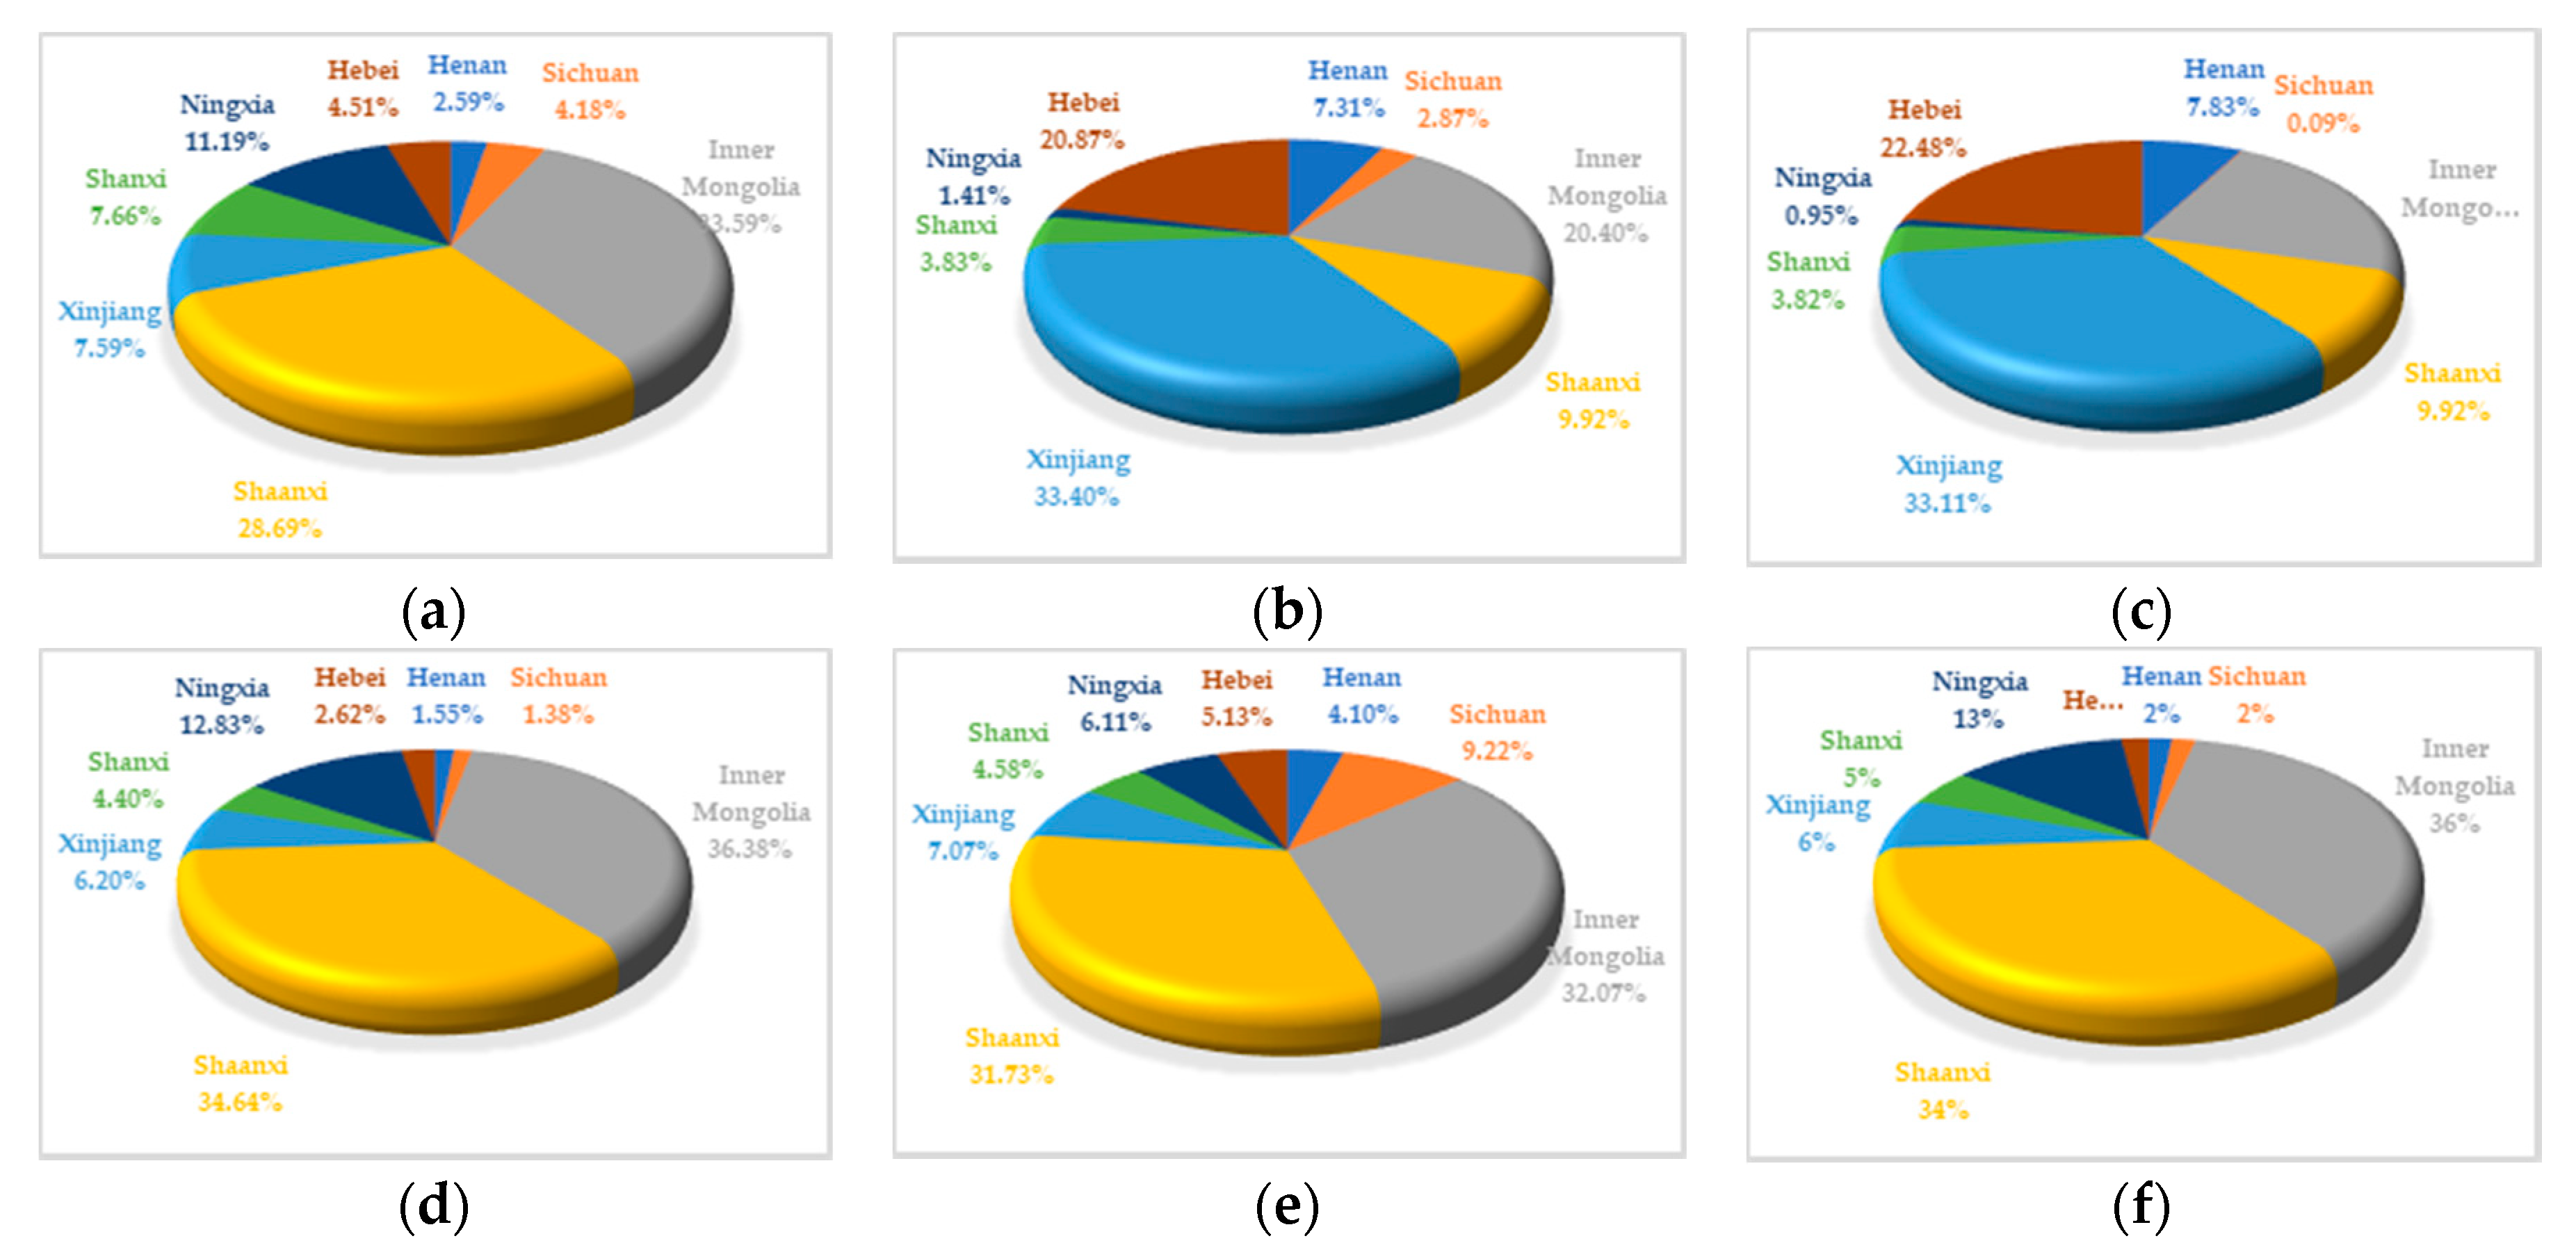
Third, in terms of annual LNG production, the GWP, AP, EP, POCP, DP, and total EI potential in Xinjiang, Inner Mongolia, Shanxi, Shanxi, Ningxia, Henan, Sichuan, Hebei, and China indicated different environmental issues in various provinces and in China overall. Specifically, in terms of greenhouse gas emissions, Inner Mongolia and Shaanxi had the largest emissions, and the resulting greenhouse effect may be the most severe. In terms of acidifying substance emissions, Hebei and Xinjiang had the greatest emissions and may, therefore, experience the greatest acidification effect. In terms of eutrophication emissions, Xinjiang, Hebei, and Inner Mongolia had the greatest emissions, and the eutrophication effect of the water bodies was a major concern. In terms of photochemical smog emissions, Inner Mongolia and Shaanxi had the greatest emissions, and the resulting photochemical pollution effects were the most evident concerns. In terms of dust emissions, Inner Mongolia and Shaanxi had the greatest emissions, and the dust pollution effect was the most severe. It was evident from the total environmental impact potential that Inner Mongolia and Shaanxi were the most affected by severe environmental pollution during the natural gas liquefaction process.
Based on the above research conclusions, this article makes the following three suggestions.
First, China’s coal-to-gas project makes use of natural gas instead of coal, and this can indeed reduce the effect of environmental pollution. However, when assessing the actual benefits, the environmental pollution caused by the liquefaction of natural gas should be considered. A reduction in pollution caused by natural gas liquefaction should be achieved so that the coal-to-gas project can be effectively implemented.
Second, if various pollutants are discharged during natural gas liquefaction, they must be properly treated, recycled, and reused, which may reduce environmental pollution. Take methane as an example—in the natural gas liquefaction process, methane is both an energy input and a pollutant that is emitted. Therefore, some liquefaction plants in Inner Mongolia have begun to optimize the technology link, considering the recovery and reuse of methane, thereby reducing production costs. In addition, the resource utilization of pollutants may bring additional income to natural gas liquefaction plants or reduce the production costs for enterprises using these pollutants.
Third, from the perspective of the five types of environmental impact potentials, there are many differences in the components of natural gas sources in different provinces. Additionally, according to these different components, natural gas liquefaction plants should be targeted to optimize production technologies and reduce environmental pollution. For example, the plants in Inner Mongolia and Shaanxi should pay attention to the reduction in and recovery of greenhouse gases. Moreover, the plants in Xinjiang should consider reducing and reusing acidified pollutants.
Despite these findings, this article has the following limitation. Due to the difficulty of data collection, this article cannot yet quantify the environmental impact of the entire LNG production process. However, one of the major problems of the LNG production is the leakage of methane in the pipelines. Therefore, in further work, the authors plan to extend the boundary of the research and analyze the environmental impact of the entire LNG production process.

Author Contributions

X.Y. and B.Z. conceived the original idea of the study, analyzed the data, and wrote this manuscript. R.L. and Y.S. collected the data and drew the process flow diagram. R.W. revised the paper. All authors have read and agreed to the published version of the manuscript.

Funding

The study was funded by the National Natural Science Foundation of China (71673297) and the National Social Science Funds of China (13&ZD159).

Conflicts of Interest

The authors declare that they have no conflict of interest.

References

  1. Qin, Y.; Höglund-Isaksson, L.; Byers, E.; Feng, K.; Wagner, F.; Peng, W.; Mauzerall, D.L. Air quality–carbon–water synergies and trade-offs in China’s natural gas industry. Nat. Sustain. 2018, 1, 505–511. [Google Scholar] [CrossRef] [Green Version]
  2. Jia, C.; Zhang, Y.; Zhao, X. Prospects of and challenges to natural gas industry development in China. Nat. Gas Ind. 2014, 1, 1–13. [Google Scholar]
  3. Wang, Z.; Xue, Q. To fully exert the important role of natural gas in building a modern energy security system in China: An understanding of China’s National l3th Five-Year Plan for Natural Gas Development. Nat. Gas Ind. B 2017, 4, 270–277. [Google Scholar] [CrossRef]
  4. Pan, X.; Wang, L.; Dai, J.; Qi, Z.; Peng, T.; Chen, W. Analysis of China’s oil and gas consumption under different scenarios toward 2050: An integrated modeling. Energy 2020, 195, 116991. [Google Scholar] [CrossRef]
  5. Xu, S.; Ge, J. Sustainable shifting from coal to gas in North China: An analysis of resident satisfaction. Energy Policy 2020, 138, 111296. [Google Scholar] [CrossRef]
  6. Pospíšil, J.; Charvát, P.; Arsenyeva, O.; Lubomír, K.; Špiláček, M.; Klemeša, J.J. Energy demand of liquefaction and regasification of natural gas and the potential of LNG for operative thermal energy storage. Renew. Sustain. Energy Rev. 2019, 99, 1–15. [Google Scholar] [CrossRef]
  7. Sarah, P.; Oliver, S.; Yasel, C. Acceptance of LNG as an alternative fuel: Determinants and policy implication. Energy Policy 2018, 120, 259–267. [Google Scholar]
  8. Shirazi, L.; Sarmad, M.; Rostami, R.M.; Moein, P.; Zare, M.; Mohammadbeigy, K. Feasibility study of the small scale LNG plant infrastructure for gas supply in north of Iran (Case Study). Sustain. Energy Technol. Assess. 2019, 35, 220–229. [Google Scholar] [CrossRef]
  9. Erlandsson, M.; Borg, M. Generic LCA-methodology applicable for buildings, constructions and operation services—Today practice and development needs. Build. Environ. 2003, 38, 919–938. [Google Scholar] [CrossRef]
  10. Ally, J.; Pryor, T. Life-cycle assessment of diesel, natural gas and hydrogen fuel cell bus transportation systems. J. Power Sources 2007, 170, 401–411. [Google Scholar] [CrossRef] [Green Version]
  11. Shi, J.; Li, T.; Peng, S.; Liu, Z.; Zhang, H.; Jiang, Q. Comparative Life Cycle Assessment of remanufactured liquefied natural gas and diesel engines in China. J. Clean. Prod. 2015, 101, 129–136. [Google Scholar] [CrossRef]
  12. Kanbur, B.B.; Xiang, L.; Dubey, S.; Choo, F.H.; Duan, F. Thermoeconomic and environmental assessments of a combined cycle for the small scale LNG cold utilization. Appl. Energy 2017, 204, 1148–1162. [Google Scholar] [CrossRef]
  13. He, T.; Chong, Z.R.; Zheng, J.; Ju, Y.; Linga, P. LNG cold energy utilization: Prospects and challenges. Energy 2019, 170, 557–568. [Google Scholar] [CrossRef]
  14. Langshaw, L.; Ainalis, D.; Acha, S.; Shah, N.; Stettler, E.J. Environmental and economic analysis of liquefied natural gas (LNG) for heavy goods vehicles in the UK: A Well-to-Wheel and total cost of ownership evaluation. Energy Policy 2020, 137, 111161. [Google Scholar] [CrossRef]
  15. Shi, J.; Li, T.; Liu, Z.; Zhang, H.; Peng, S.; Jiang, Q.; Yin, J. Life Cycle Environmental Impact Evaluation of Newly Manufactured Diesel Engine and Remanufactured LNG Engine. Procedia Cirp 2015, 29, 402–407. [Google Scholar] [CrossRef]
  16. Beyer, J.; Aarab, N.; Tandberg, A.H.; Ingvarsdottir, A.; Bamber, S.; Børsetha, J.F.; Camus, L.; Velvin, R. Environmental harm assessment of a wastewater discharge from Hammerfest LNG: A study with biomarkers in mussels (Mytilus sp.) and Atlantic cod (Gadus morhua). Mar. Pollut. Bull. 2013, 69, 28–37. [Google Scholar] [CrossRef] [Green Version]
  17. Xiao, F.; Shi, L.; Jing, X.; Luo, X. Main points and methods of engineering analysis in environmental impact assessment of LNG project. Chem. Eng. Oil Gas 2013, 42, 424–428. [Google Scholar]
  18. Tillman, A. Significance of decision-making for LCA methodology. Environ. Impact Assess. Rev. 2000, 20, 113–123. [Google Scholar] [CrossRef] [Green Version]
  19. Hertwich, E.G.; Pease, W.S.; Koshland, C.P. Evaluating the environmental impact of products and production processes: A comparison of six methods. Sci. Total Environ. 1997, 196, 13–29. [Google Scholar] [CrossRef]
  20. Schmidt, W.P.; Sullivan, J. Weighting in Life Cycle assessments in a global context. Int. J. Life Cycle Assess. 2002, 7, 5–10. [Google Scholar] [CrossRef]
  21. Guinee, J.B. Handbook on life cycle assessment operational guide to the ISO standards. Int. J. Life Cycle Assess. 2001, 6, 255. [Google Scholar] [CrossRef]
  22. Hertwich, E.G.; Pease, W.S. ISO 14042 restricts use and development of impact assessment. Int. J. Life Cycle Assess. 1998, 3, 180–181. [Google Scholar] [CrossRef]
  23. Yang, J.; Xu, C. Methodology and Application of Life Cycle Assessment; China Meteorological Press: Beijing, China, 2002; Chapter 6–8. [Google Scholar]
  24. Yang, J.; Wang, R.; Liu, J. Methodology of Life Cycle Impact Assessment for Chinese Products. Acta Sci. Circumst. 2001, 21, 234–237. [Google Scholar]
Figure 1. Distribution of natural gas liquefaction plants in China.
Applsci 10 01701 g001
Figure 2. Proportion of the liquefied natural gas production in different provinces in China.
Applsci 10 01701 g002
Figure 3. Flow chart of the natural gas liquefaction process.
Applsci 10 01701 g003
Figure 4. Emissions of pollutants from natural gas liquefaction plants throughout their life cycle. Phase A is pretreatment of feed gas, Phase B is liquefaction, and Phase C is storage and off-loading package.
Applsci 10 01701 g004
Figure 5. Environmental impact potentials of the eight provinces in the nature gas liquefaction process (per unit): (a) Global Warming Potential (GWP), (b) Acidification Potential (AP), (c) Eutrophication Potential (EP), (d) Photochemical Ozone Creation Potential (POC), (e) Dust Potential (DP), and (f) Total Environmental Impact Potential.
Applsci 10 01701 g005
Figure 6. Weightage of the various environmental impact potentials of the eight provinces in natural gas liquefaction stage (per year): (a) Global Warming Potential (GWP), (b) Acidification Potential (AP), (c) Eutrophication Potential (EP), (d) Photochemical Ozone Creation Potential (POCP), (e) Dust Potential (DP), and (f) Total Environmental Impact Potential.
Applsci 10 01701 g006
Figure 7. Total environmental impact of natural gas liquefaction in China.
Applsci 10 01701 g007
Table 1. Provinces of natural gas liquefaction production and the capacity of each province in China.
No.ProvinceProduction Capacity (104 m3/d)No.ProvinceProduction Capacity (104 m3/d)
1Heilongjiang4810Xinjiang523
2Jilin8011Inner Mongolia1854
3Liaoning1012Shaanxi1650
4Gansu5513Shanxi685
5Shandong10014Ningxia630
6Hubei1215Henan225
7Qinghai6516Sichuan405
8Yunnan617Hebei407
9Guangdong60
Total: 6815
Table 2. Emission inventory of liquefied natural gas production in the Shanxi Province (per unit).
PhaseOutputUnitValue
Adustkg/t0.0019
CO2kg/t78.7560
CH4kg/t3.6365
SO2kg/t0.0023
NH4+kg/t0.0213
H2Skg/t0.0007
COkg/t6.3379
BCO2kg/t0.3936
COkg/t0.1628
CCH4kg/t15.1914
TotalCH4kg/t18.8280
dustkg/t0.0019
CO2kg/t79.1496
COkg/t6.5006
SO2kg/t0.0023
NH4+kg/t0.0213
H2Skg/t0.0007
Table 3. Emission inventory of the liquefied natural gas production in eight provinces of China (per year).
Output (kg/t)HenanSichuanInner MongoliaShaanxiXinjiangShanxiNingxiaHebei
CH419.379120.091921.389918.332120.080918.828019.732921.6721
dust0.00280.00630.00480.00530.00380.00190.00270.0035
CO280.00212.5723320.2105353.8802197.623679.1496360.309812.8327
CO7.14761.133028.333631.373915.37216.500733.98321.3437
SO20.00290.03660.00160.00390.02350.00230.00570.0039
NH4+0.13250.00090.04470.02290.24130.02130.00580.2104
H2S0.00070.00900.00080.00040.00990.00070.00050.0003
Table 4. Impact potential of liquefied natural gas production in the Shanxi Province (per unit).
Type of EIPollutantsReference MaterialsEquivalency FactorOutput of PollutantImpact Potential of Pollutant (kg)Impact Potential of EI (kg)
GWPCO2CO2179.149679.1496562.8499
CO26.50076.5007
CH42518.828018.8280
APSO2SO210.00230.00230.0436
NH4+1.880.02130.0213
H2S1.880.00070.0007
EPNH4+NO33.640.02130.02130.0774
POCPCOC2H40.036.50076.50070.3269
CH40.00718.828018.8280
SO20.050.00230.0023
DUdustdust10.00190.00190.0019
EI is short for environmental impact.
Table 5. Impact potential of liquefied natural gas production in the eight provinces of China (per unit/kg).
Type of EIHenanSichuanInner MongoliaShaanxiXinjiangShanxiNingxiaHebei
GWP578.7756519.1644911.6252874.9307730.3911562.8499893.5984557.3228
AP0.25340.05520.08570.04690.49590.04360.01750.3999
EP0.48240.00310.16280.08330.87840.07740.02100.7657
POCP0.35020.17460.99971.06950.60290.32691.03790.1922
DU0.00280.00630.00480.00530.00370.00190.00270.0035
Table 6. Standardized value of the liquefied natural gas production in the eight provinces of China (p⋅a).
Type of EIHenanSichuanInner MongoliaShaanxiXinjiangShanxiNingxiaHebei
GWP0.06650.05970.10480.10060.08400.06500.10270.0641
AP0.00700.00150.00240.00130.01370.00120.00050.0111
EP0.00790.00010.00260.00140.01440.00130.00030.0126
POCP0.53880.26871.53811.64540.92750.50301.59680.2957
DU0.00020.00040.00030.00030.00020.00010.00010.0002
Table 7. Weightage value of the liquefied natural gas production in the eight provinces of China (per unit/kg).
Type of EIHenanSichuanInner MongoliaShaanxiXinjiangShanxiNingxiaHebei
GWP0.05520.04950.08700.08350.06970.05370.08530.0532
AP0.00510.00110.00170.00100.01010.00090.00040.0081
EP0.00580.000040.00190.00100.01050.00090.00030.0092
POCP0.28560.14240.81520.87210.49160.26660.00010.1567
DU0.000090.000210.000160.000180.000130.000060.000090.00012
Table 8. Total environmental impact (EI) potential of the liquefied natural gas production in the eight provinces of China (p⋅a).
HenanSichuanInner MongoliaShaanxiXinjiangShanxiNingxiaHebei
Total EI Potential0.35180.19330.90600.95770.58200.32210.93220.2273

