Article

Multi-Objective Optimization of Process Parameters of Longitudinal Axial Threshing Cylinder for Frozen Corn Using RSM and NSGA-II

1
Key Laboratory of Bionic Engineering, Ministry of Education, Jilin University, Changchun 130022, China
2
College of Biological and Agricultural Engineering, Jilin University, Changchun 130022, China
3
Chinese Academy of Agricultural Mechanization Sciences, Beijing 100083, China
*
Author to whom correspondence should be addressed.
Appl. Sci. 2020, 10(5), 1646; https://doi.org/10.3390/app10051646
Submission received: 1 February 2020 / Revised: 24 February 2020 / Accepted: 24 February 2020 / Published: 1 March 2020
(This article belongs to the Section Mechanical Engineering)

Abstract

:
Corn was frozen at harvest time in high-latitude areas, when corn kernel is wetter and more easily broken. When frozen corn was threshed and separated by the longitudinal axial threshing cylinder of a combine harvester, it caused a significantly high kernel damage rate and loss rate. The process parameters of threshing cylinder were optimized using RSM (response surface method) and NSGA-II (Non-Dominated Sorted Genetic Algorithm-II). The drum speed (Ds), feed rate (Fr) and concave clearance (Cc) were determined as the optimized process parameters. The loss rate (Lr) and damage rate (Dr) were indicators of operational performance. The RSM was used to establish a mathematical model between process parameters and indicators. With an elite strategy, NSGA-II was used for multi-objective optimization to obtain the optimal operational performance of the threshing cylinder. Overall, when the drum speed was selected as 384.1 rpm, the feed rate as 8.6 kg/s and the concave clearance as 40.5 mm, according to the requirement of corn harvest, the best operational performance of the longitudinal axial threshing cylinder on frozen corn was obtained. The Lr was 1.98% and the Dr was 3.49%. This result indicated that the applicability of the optimal process parameters and the optimization method of combining NSGA-II and RSM was effective for determining the optimal process parameters. This will provide an optimization method for synchronously reducing the loss rate and damage rate of grain harvesters.

1. Introduction

In some high-latitude regions, especially in North America (United States and Canada), Europe (Russia, Belarus and Ukraine) and Asia (China), the temperature is already below freezing point when corn comes into maturity. After corn is frozen, its kernels’ mechanical properties are changed. Particularly after a snowfall, corn ears are covered with snow, as shown in Figure 1. Frost is formed on the surface of corn ears, and kernel gaps are filled with frosts. Frozen corn kernels are often damaged by low temperatures [1], which reduces corn quality and causes mildew [2]. The threshing loss rate is improved with a higher kernel splash speed, as the collision coefficient restitution of frozen kernels is increased [3]. Therefore, the mechanical harvesting of frozen corn, especially threshing devices, is also in urgent need of reducing its loss rate and damage rate.
Both the loss and damage rate were directly affected by the process parameters of a longitudinal axial threshing cylinder for corn harvesters [4,5,6]. The drum speed (rotational speed of threshing cylinder, rpm), feed rate (weight of corn material inputting the threshing cylinder per unit time, kg/s) and concave clearance (radial distance between the outside of threshing drum and the inside of concave, mm) were considered to be the main characteristics of corn combine harvester process parameters [7,8,9,10]. Yu et al. [11] established a numerical model of corn threshing cylinder adopting 3-d discrete element method (DEM). The effect of the feeding rate and drum speed on the threshing rate was verified, but this method cannot detect the kernel loss rate or damage rate. Srison et al. [12] found that threshing loss was significantly impacted by concave clearance applied response surface method and central composite design. The threshing loss ranged from 1.2% to 14.06%, as concave clearance ranged from 10 mm to 30 mm. Al Sharifi et al. [10] discovered that corn kernel damage was related to kernel moisture content, and the threshing loss was mainly affected by drum speed. A factorial experiment was carried out under a completely randomized design. The results demonstrated that the damage rate was positively correlated with moisture content. The loss rate decreased from 4.939% to 3.242% when the drum speed decreased from 400 rpm to 200 rpm. Chen et al. [13] adjusted the corn material feed rate based on the designed PID controller of corn harvester forward speed. The field experiment results showed that the lowest loss rate was 0.52%, as the feed rate ranged from 2.82 kg/s to 3.10 kg/s. However, there were few reports on how to optimize the three process parameters (i.e., drum speed, feed rate and concave clearance) together for a corn combine harvester. Additionally, the performance parameters of longitudinal axial threshing cylinders for frozen corn have not been optimized synchronously.
In order to get the exact optimal model and improve the accuracy and efficiency of the optimization, new methods have been applied in other fields. NSGA-II was improved on the basis of NSGA and used for multi-objective optimization. By using the fast non-inferior hierarchical sorting mechanism, the Pareto (optimal solution) front can be approached very well. At the same time, by introducing the crowding degree operator, the dispersion uniformity of the Pareto optimal solution can be guaranteed. The experimental design, ANOVA and optimization algorithm by NSGA-II were combined to optimize the process parameters to save energy consumption during injection molding [14]. Sheet stamping process parameters were optimized by the multi-objective method [15]. Posterior multi-objective optimization by genetic algorithm was used to optimize cutting parameters in turning [16]. The optimal forming quality was obtained through the simulation experiments and multi-objective optimization for the precision forging process parameters [17]. The optimal PID tuning was obtained by various multi-objective optimization algorithms for the paper machine [18]. A study about the multi-objective optimization of a welding process of advanced high-strength steel using an evolutionary algorithm has been discussed [19]. However, the multi-objective optimization method has not been used in combine harvesters, especially for frozen corn threshing.
In order to synchronously reduce the loss rate and damage rate of frozen corn threshing, especially to optimize the process parameters of the longitudinal axial threshing cylinder, a multi-objective optimization method based on the response surface method (RSM) and non-dominated sorted genetic algorithm-II (NSGA-II) was proposed in this paper. A central composite design (CCD) was used to obtain test data based on a longitudinal axial threshing cylinder test device. The relationship between process parameters and objectives was established using RSM. NSGA-II was used to facilitate the global search and obtain the Pareto-optimal front. Finally, according to the actual threshing efficiency demand of frozen corn combine harvesters, the optimum value of the process parameters was determined.

2. Materials and Methods

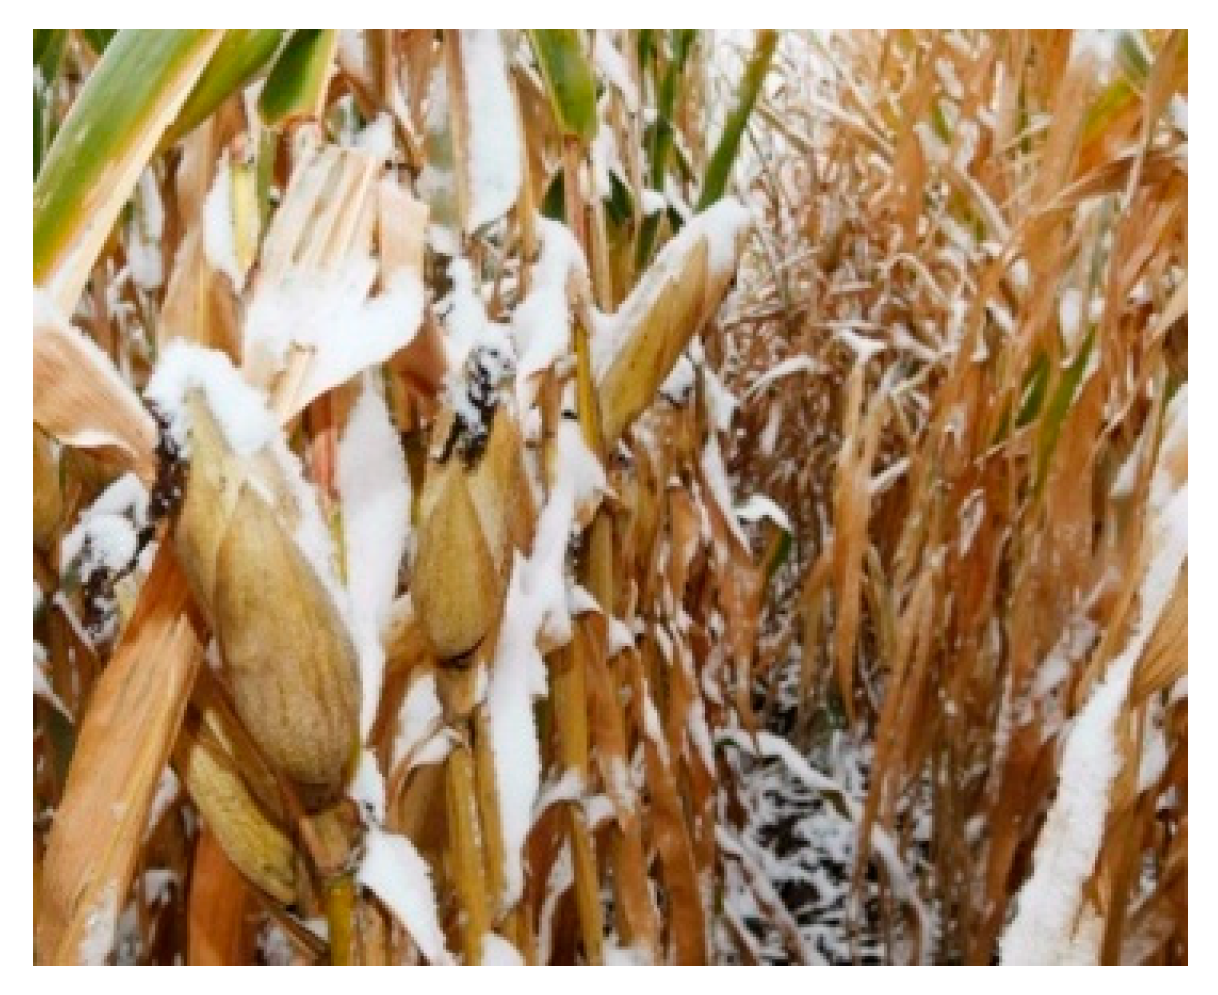
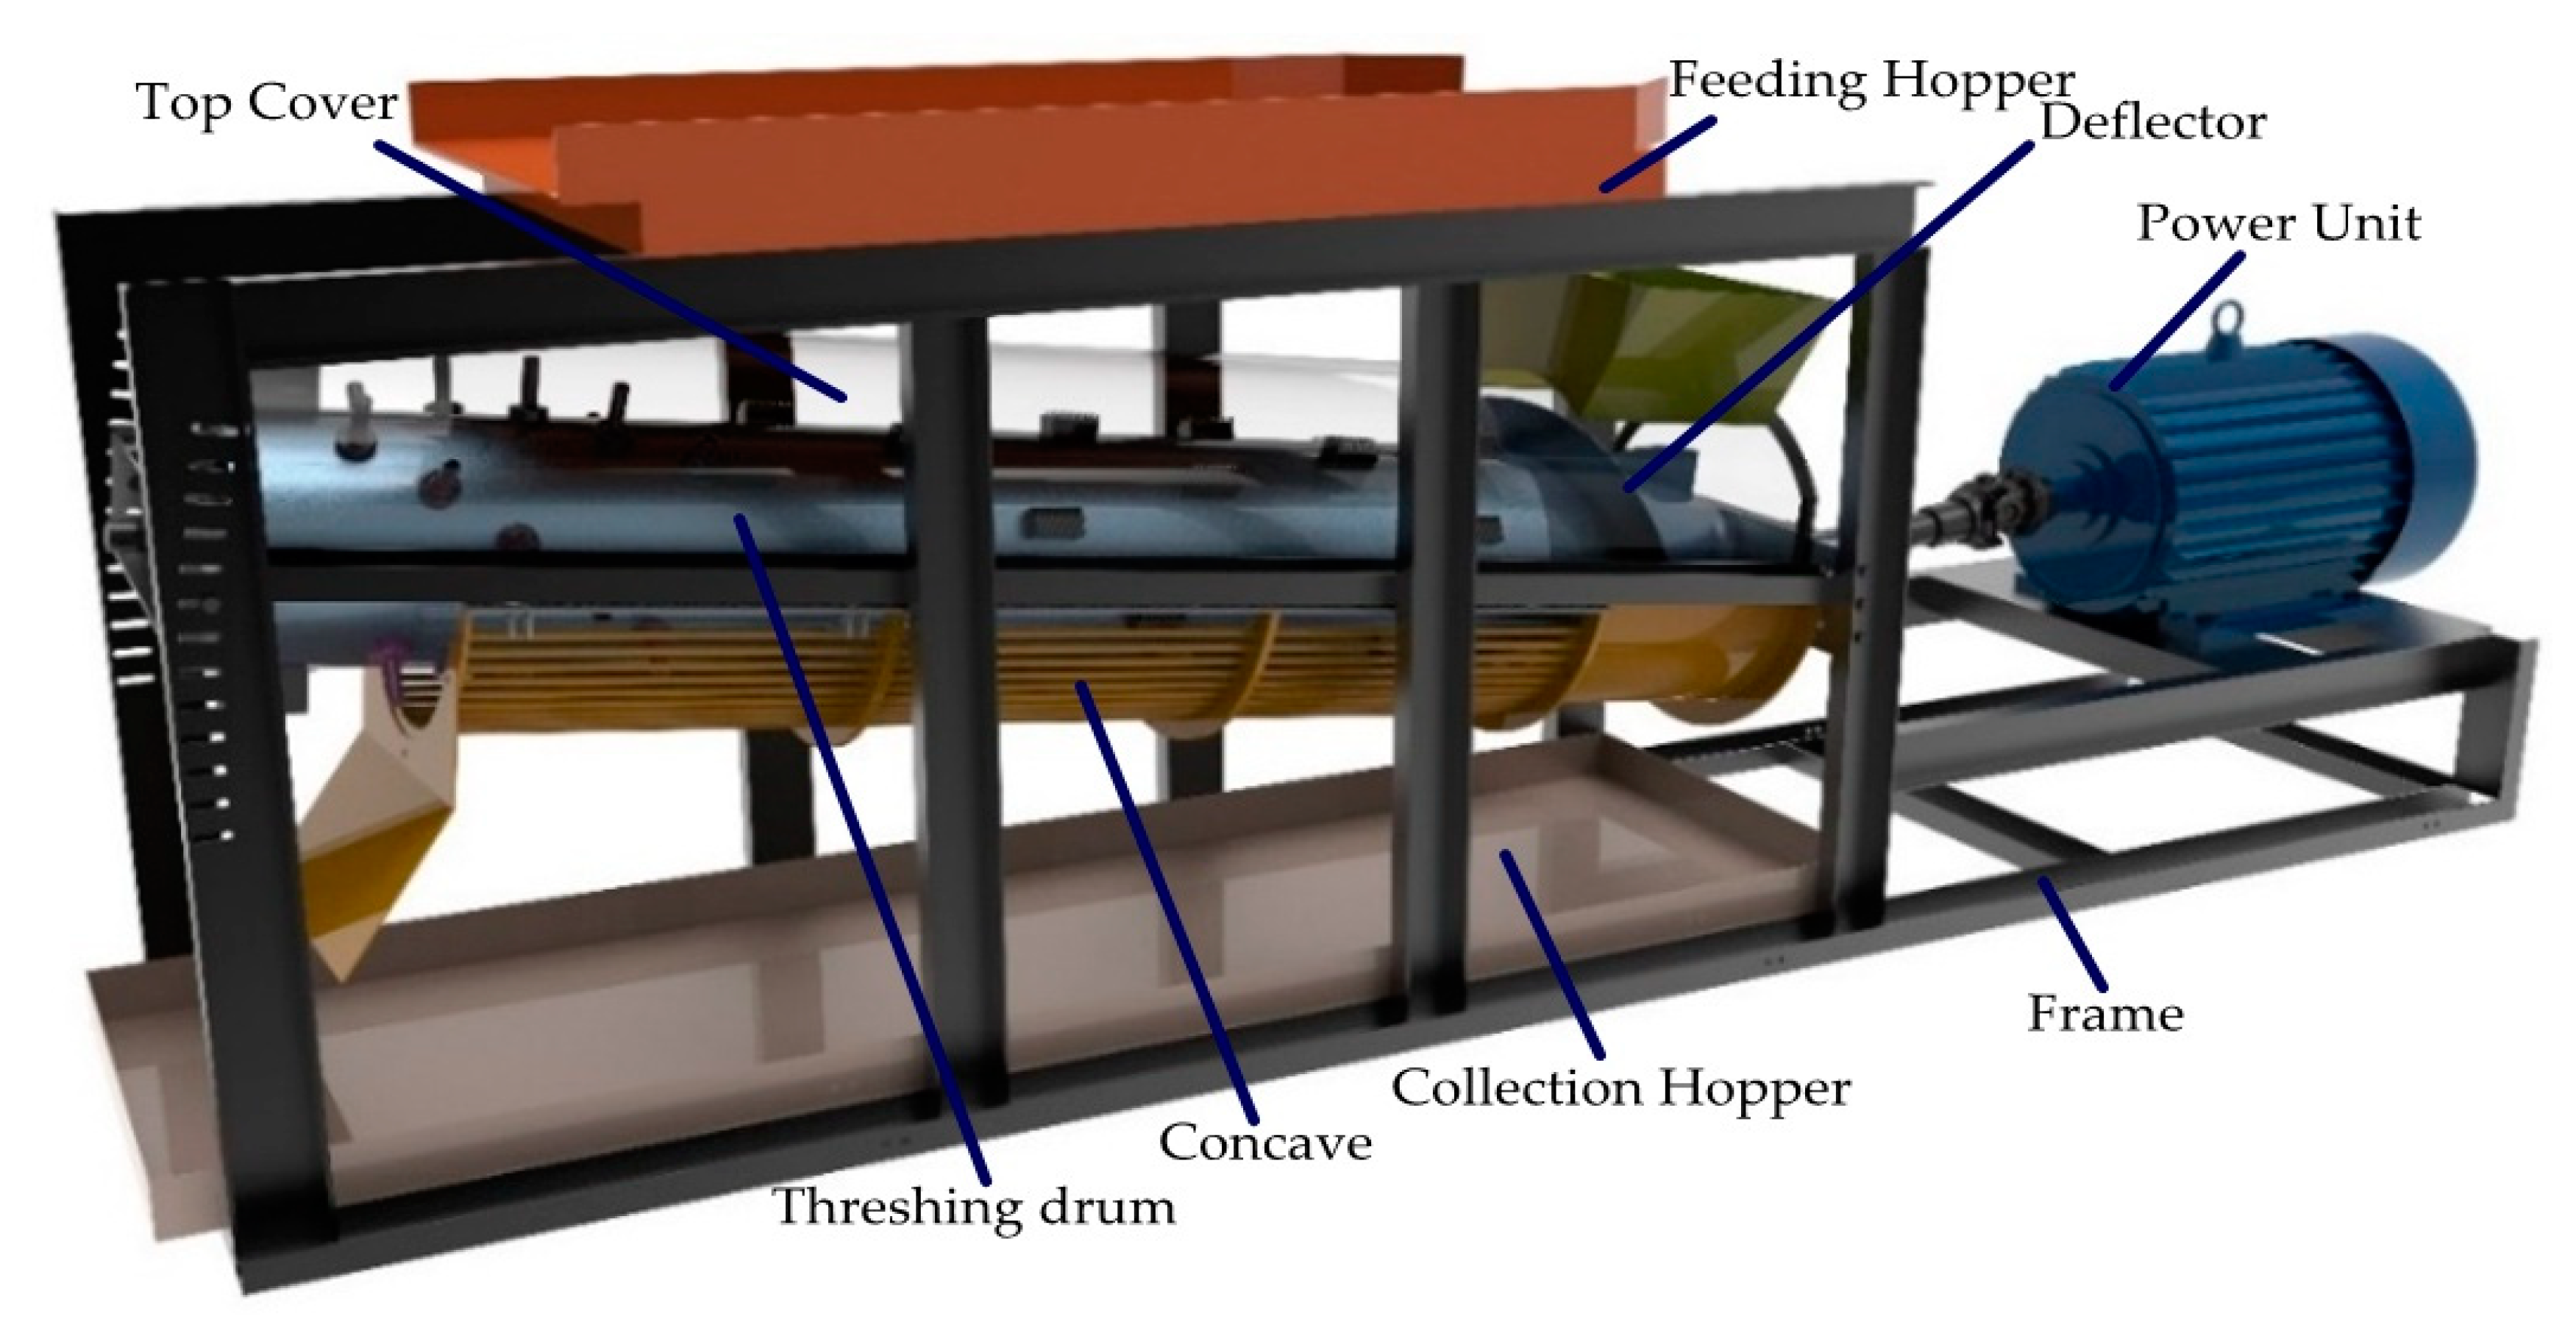
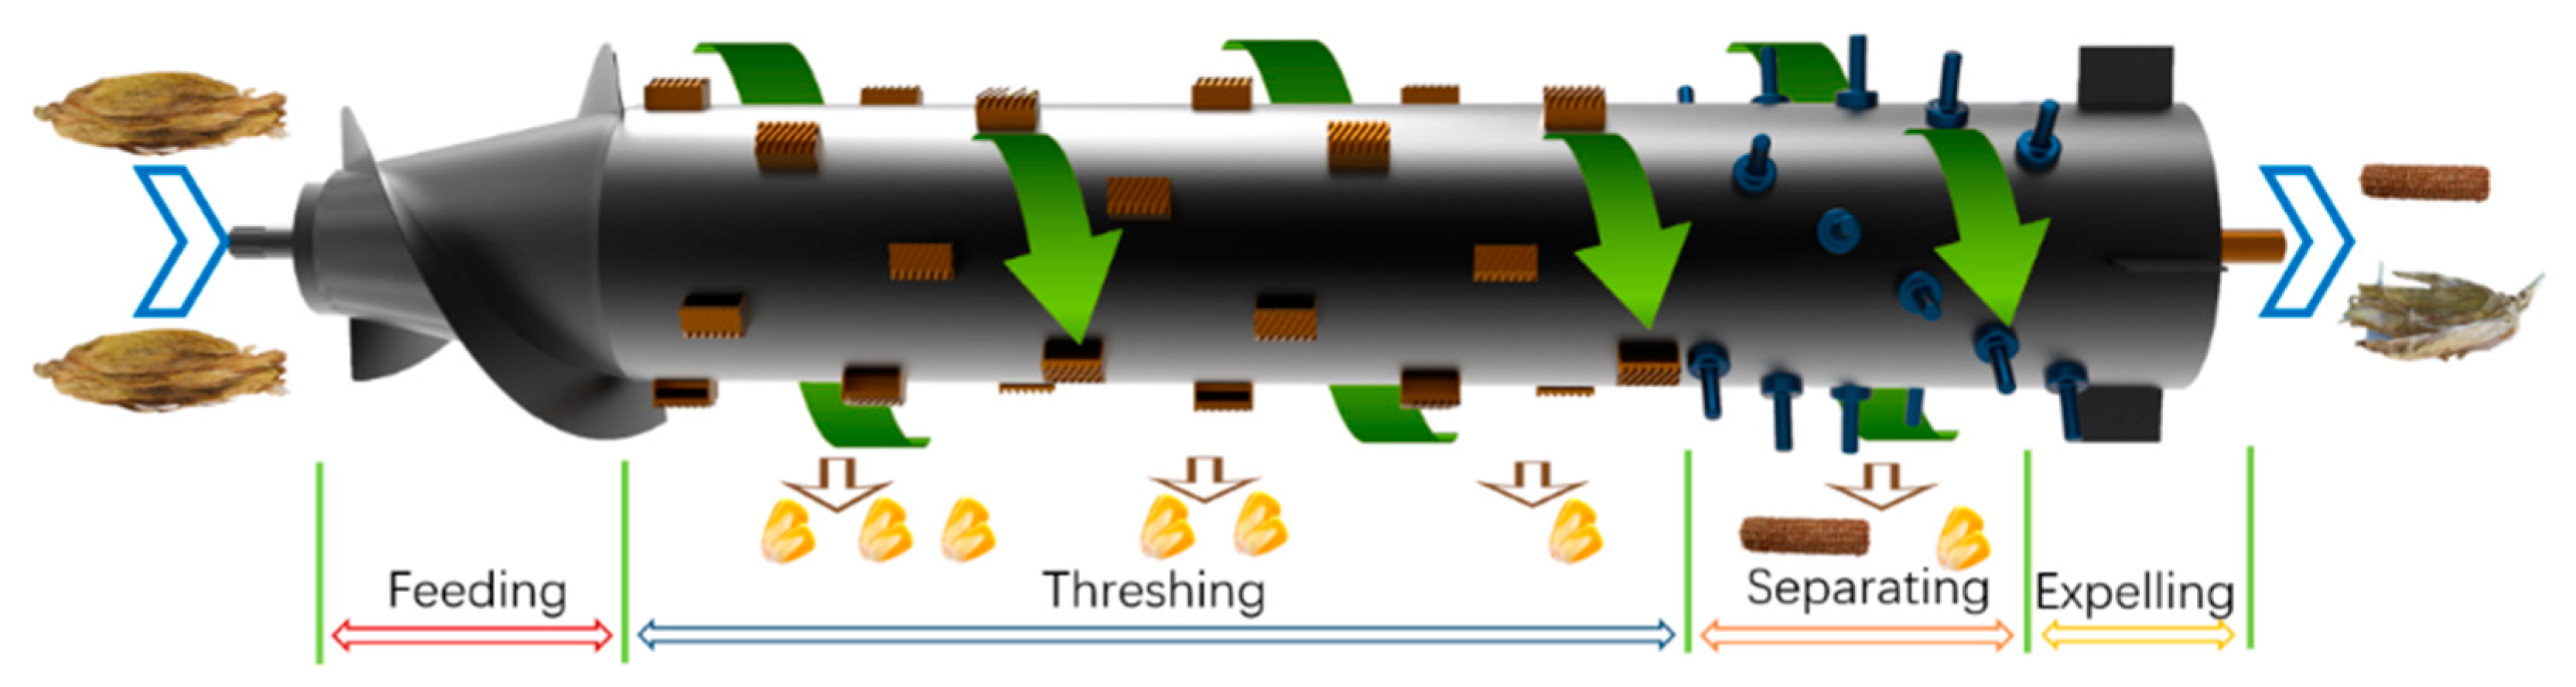
2.1. Material and Equipment

In view of the temperature of harvest time of frozen corn, the experiment was carried out at −5.0~−10.0 °C in the Agricultural Experimental Base of Jilin University (N43°56′45.99″, E125°14′52.44″) in Changchun, Jilin province, China, in January 2020. The temperature was monitored by a digital thermometer (0.1 °C accuracy). Corn was collected after frost, and stored at −5.0 °C. The corn variety used in this experiment was Feitian 358, a native corn variety cultivated by the Dunhuang Seed Industry Co., Ltd in Wuhan, China. The average moisture content of frozen corn kernels was a 27.3% wet basis, measured using a grain moisture digital tester (0.1% accuracy).
The structure of the longitudinal axial threshing cylinder test device was shown in Figure 2. It was mainly composed of a power unit, feeding hopper, top cover, deflector, concave, threshing drum, frame and collection hopper. In order to clearly illustrate the structures, the top cover was set to be transparent. The threshing drum located in the threshing chamber consisted of a top cover and concave. Rasp bars and round head spikes were fixed onto the threshing drum surface circumferentially in a spiral shape. The concave surrounded the threshing drum at an angle of 180°, and was bolted onto the frame. Its clearance was adjusted with the bolt mounting depth, and ranged from 30 mm to 50 mm. The concave diameter and area were 656 mm and 2.266 m2, respectively. The diameter and length of the threshing drum were 408 mm and 2740 mm, respectively. The drum was powered with an electric motor rated at 55 kW and a variable frequency controller. Drum speed ranged from 200 rpm to 600 rpm, and was measured by an infrared velocimeter (0.01 rpm accuracy). The threshing drum inclined by 7° with the horizontal plane, the same as its tilt angle in a combine harvester. The corn ears feed rate ranged from 5 kg/s to 9 kg/s, according to the normal operating efficiency of a Chinese 5-row corn harvester. The maximum mass feed rate was determined in pre-tests and controlled by the feeding hopper opening size and conveyor speed. Samples were evenly distributed along the belt conveyor length and continuously fed into the threshing chamber.
Corn ears were subjected to four kinds of mechanical actions by the threshing cylinder successively, including feeding, threshing, separating and expelling. The division of functional areas was shown in Figure 3. Firstly, corn ears were placed on the feeding hopper, and then fed into the threshing chamber and conveyed axially along with the threshing drum. Corn kernels were threshed from ears by the rasp bars, and fell into the collection hopper after being separated from corncobs by a round head spike. Finally, corncobs and leaves were then expelled from the outlets.

2.2. Experiment Design

The performance of the threshing cylinder depends on several process parameters, such as drum speed, concave clearance and feed rate [20]. The best performance for threshing cylinder is the lowest loss rate and lowest damage rate. An excessively high loss rate means that a large amount of kernels are lost and cannot be collected into silo, and an excessively high damage rate means that there are more broken kernels, which affects the quality of corn kernels and reduces their grade.
Pre-experiments were carried out. When the feed rate was 5 kg/s and the drum speed was 200 rpm, the un-threshed rate still did not appear. In this paper, the drum speed, concave clearance and feed rate were selected as the independent variables, while the loss and damage rate were taken as the responses. The relationship of the process parameters with the optimization objectives was established. A central composite design (CCD) was used to find the optimal values of the three parameters. In order to describe the nature of the response surface in the optimum region, a central composite design was taken six center points and five levels of each factor, and taken rotatable alpha, so the factor level encodes (−1.628, −1, 0, 1, 1.628) [21]. The process parameters and corresponding range were shown in Table 1. A five-level, three-factor central composite rotatable factorial design is shown in Table 2, which comprises 20 sets of coded conditions for the modeling of the threshing process.
Every test was repeated six times, and the total amount of frozen corn in the overall experiment with CCD was approximately 2625 kg. After each test, kernels in the collection hopper and outlets were weighed by an electronic balance. Corn kernels obtained from the outlets were known as loss grains. 2 kg of kernels were randomly weighed from collection hopper to calculate the damage rate. According to Paulsen’s research [22], corn kernel threshing damage only included broken grains, rather than grains with stress cracks, meaning the damaged grains were picked out by an artificial eye. The formulae for the calculation of the loss rate (Lr) and damage rate (Dr) were as follows:
L r = W l W t × 100
D r = W d 2 × 100
In the formula, Wl was the weight of kernels collected in outlets, kg, Wt was the total weight of kernels from collection hopper and outlets in each test, kg, and Wd was the weight of the broken kernels in the sample kernels, kg.

2.3. Multi-objective Optimization Methodology

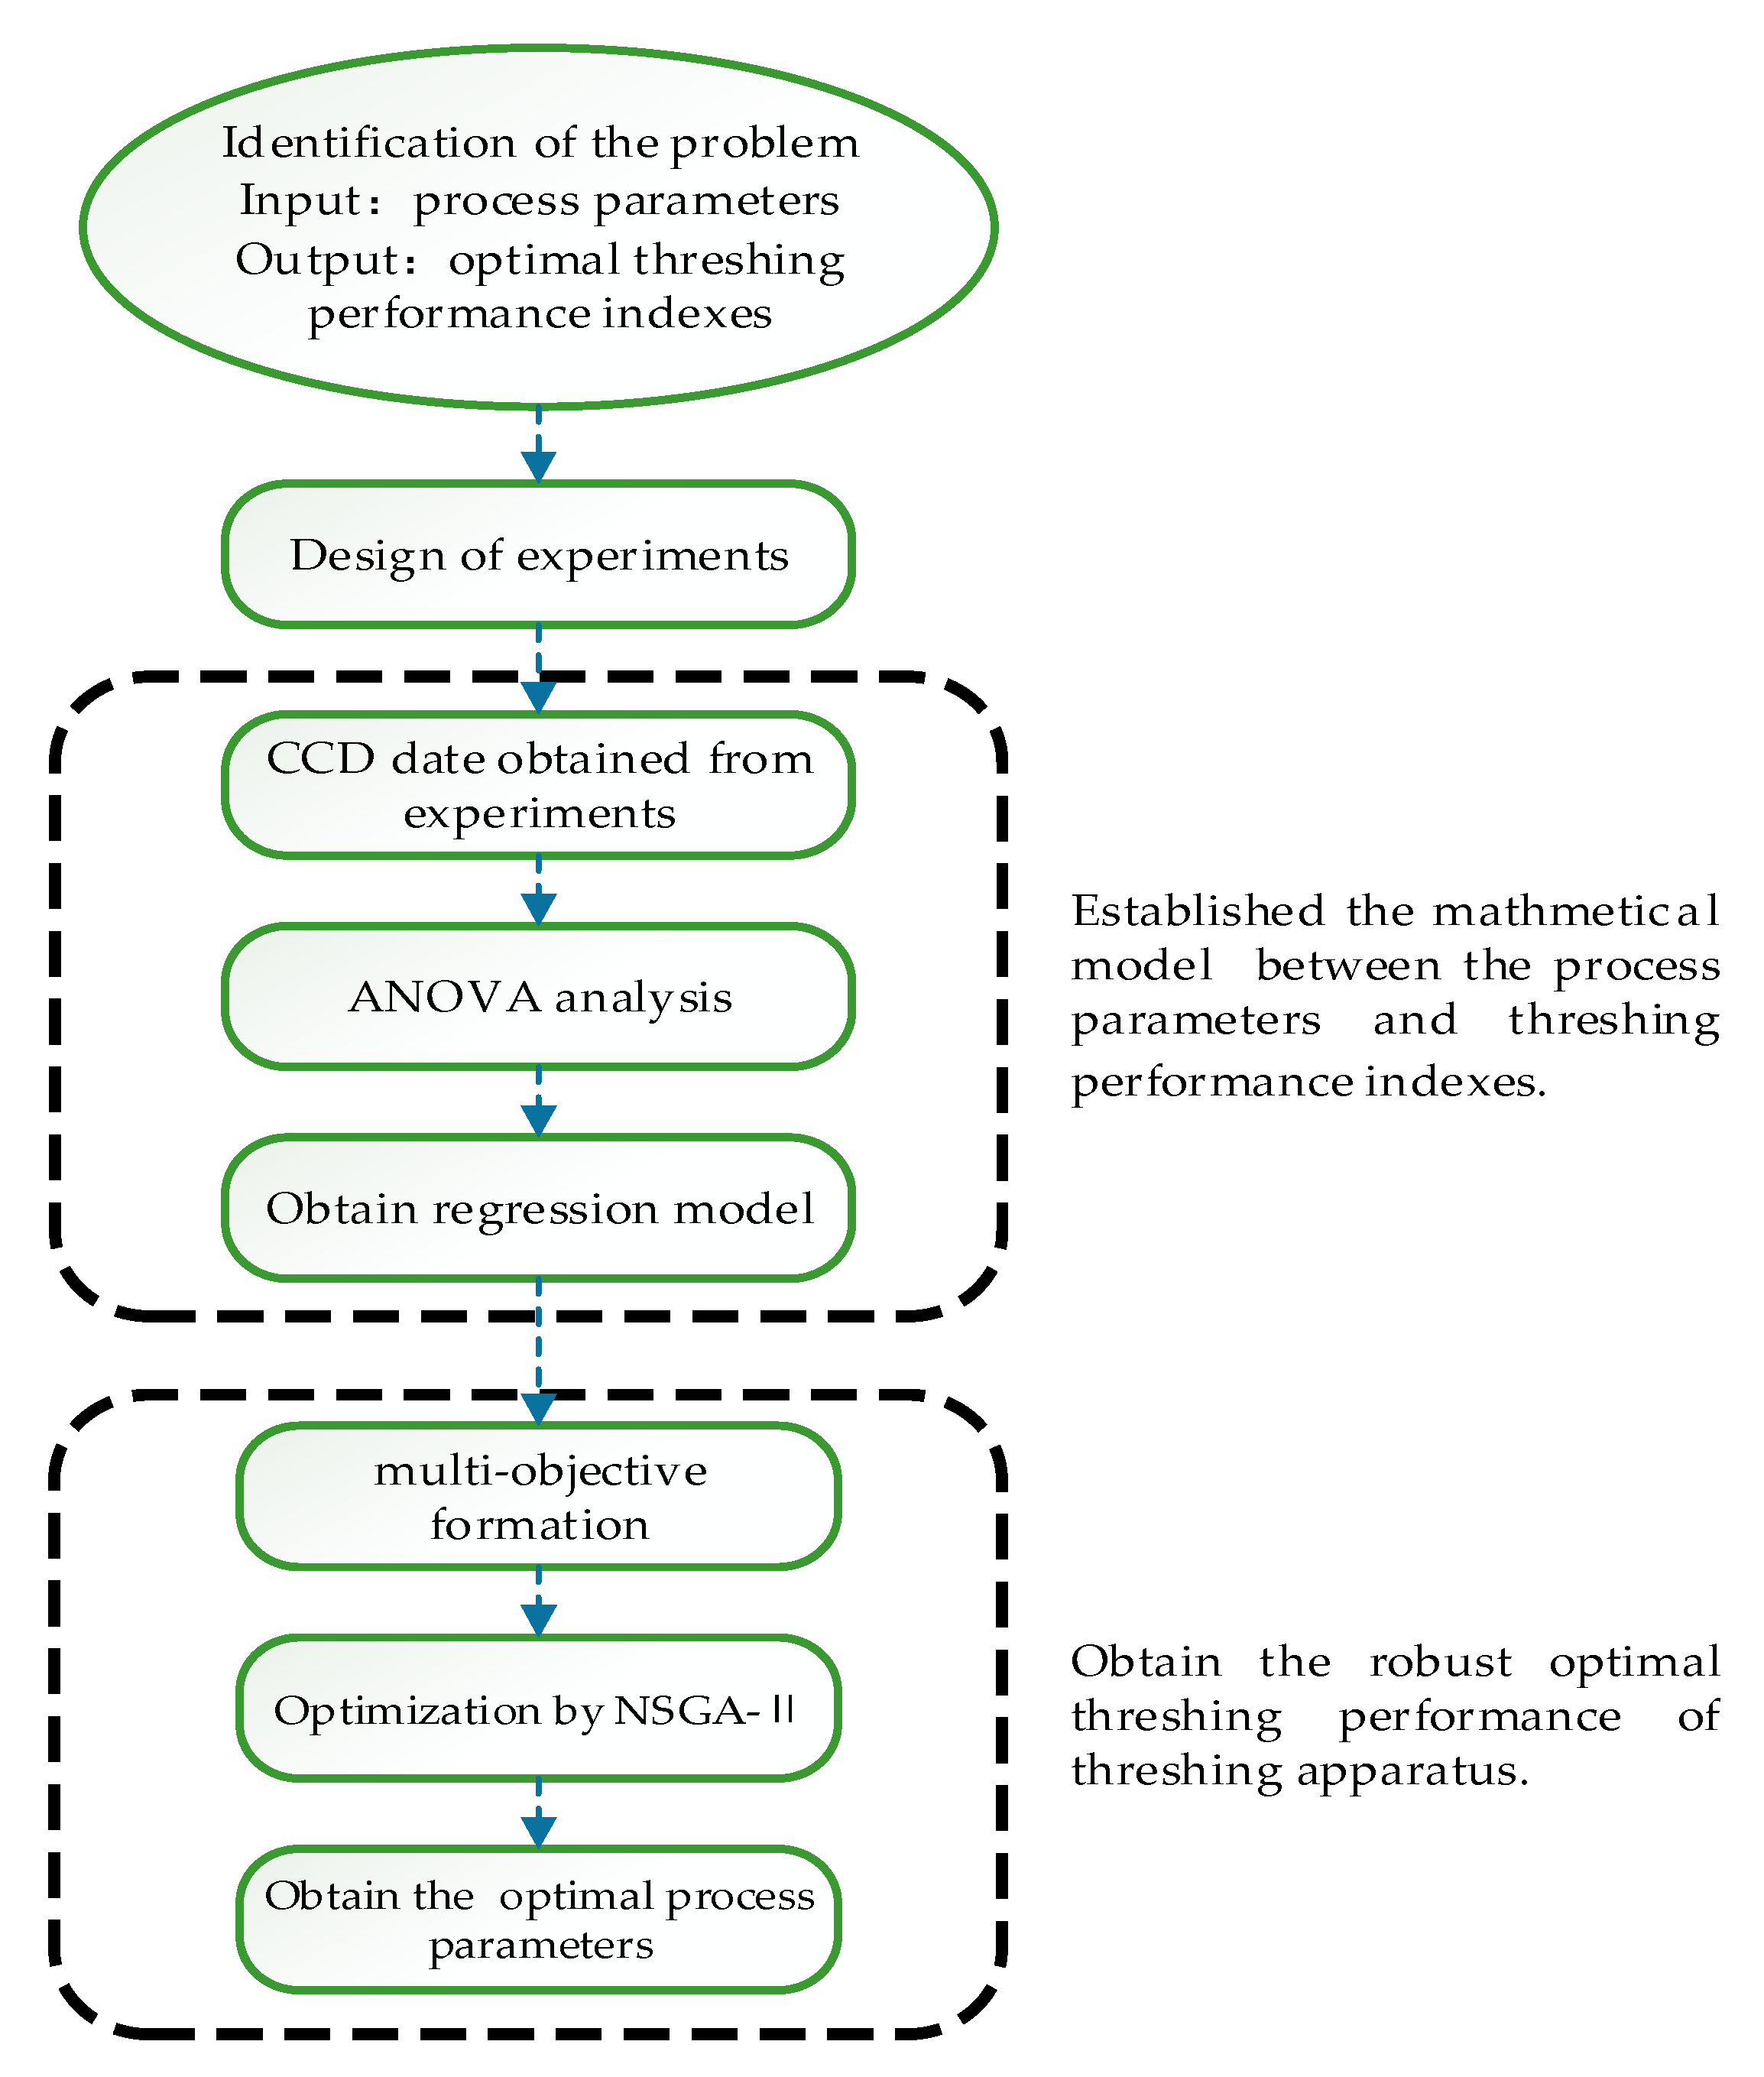
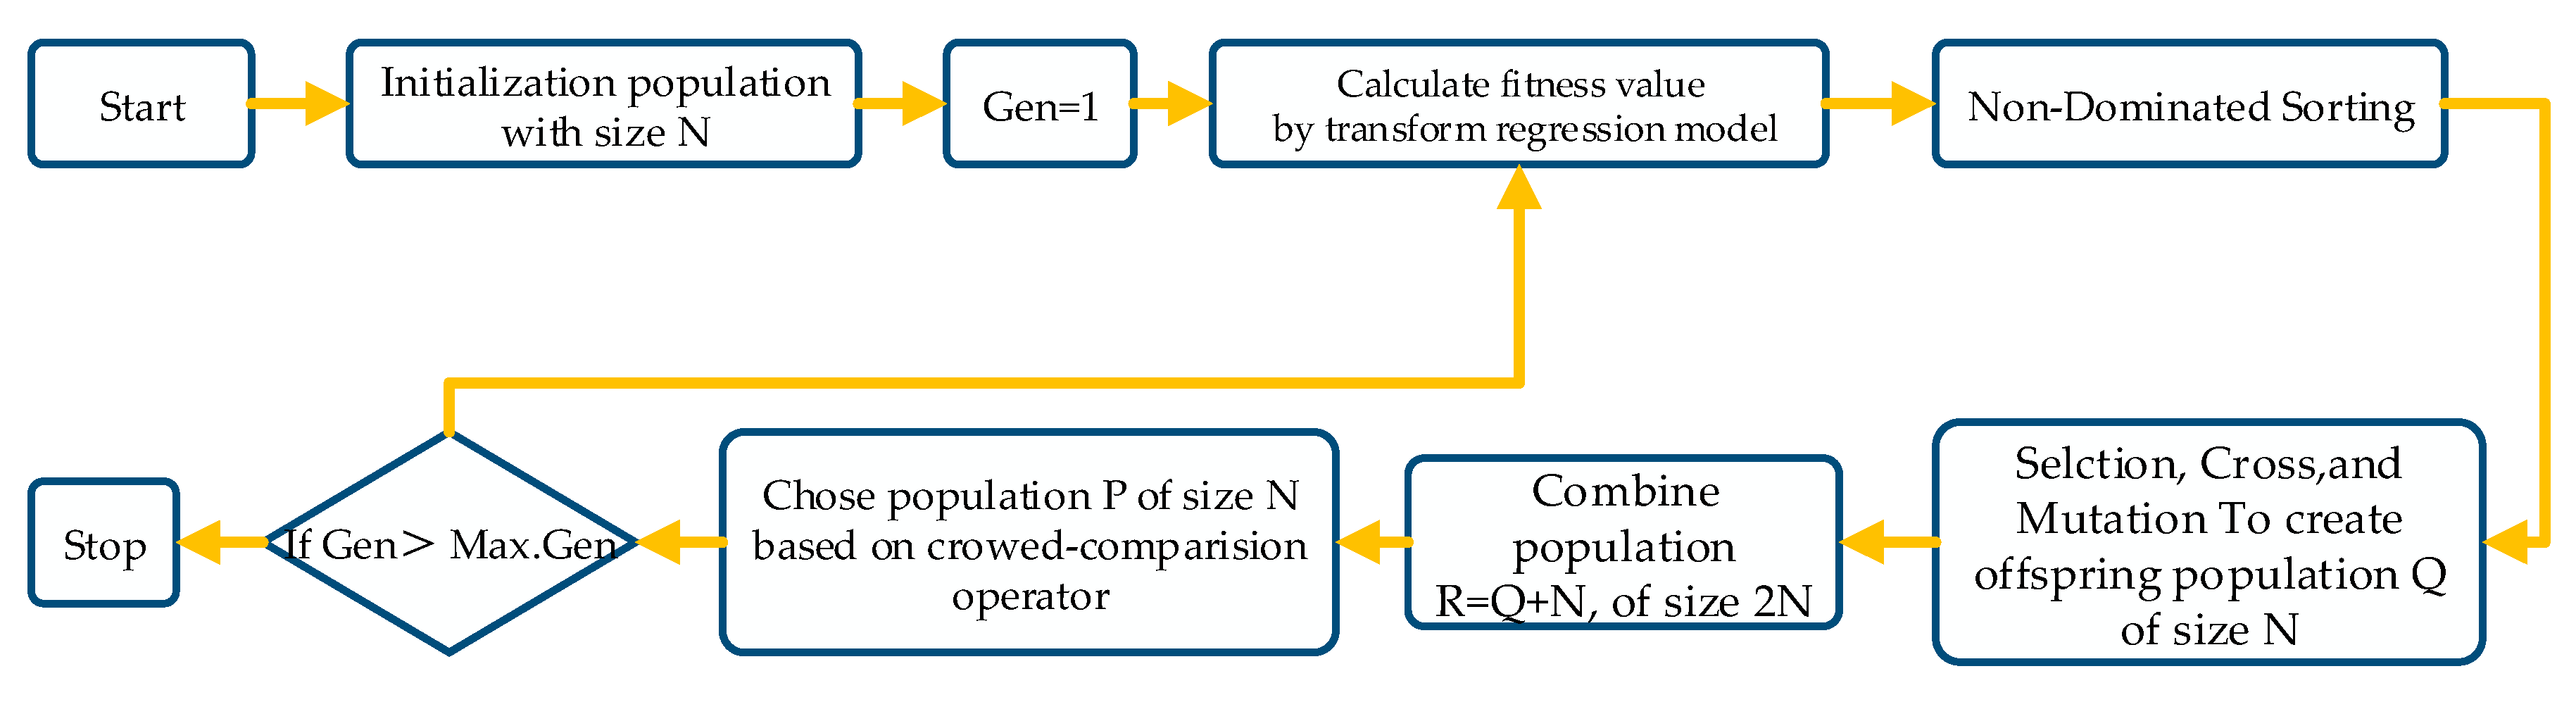
2.3.1. Optimization Process

The procedure diagram of the process parameters optimization of the threshing cylinder used in the current work was shown in Figure 4. As described previously, three process parameters for objective functions related to drum speed, feed rate and concave clearance were selected for optimization. There were two objectives, so this was multi-objective optimization research. It appears that other optimization targets may be reduced when optimizing one target. Therefore, there was usually an optimal solution set for multi-objective optimization, and the optimal solution was integrated as a Pareto optimal solution.
In this paper, a Pareto optimal solution was obtained by combining with RSM and NSGA-II. RSM was used to experiment and establish the relationship between the process parameters and objectives. NSGA-II was used to facilitate the global search and obtain the Pareto-optimal front. The optimization steps were as follows:
Step 1: To identify the problem, and input process parameters. Then to output optimal operational performance indexes.
Step 2: To design the experiments by CCD.
Step 3: To obtain a date from threshing experiments.
Step 4: ANOVA analysis with quadratic model for experiments results, then to establish the regression model of factors with objectives.
Step 5: To calculate the Pareto optimal front and obtain the optimum process by NSGA-II.
Step 6: To verify the optimum process parameter by threshing experiments.

2.3.2. Response Surface Method

The response surface method was commonly used in experimental design. Its principle was to use the multivariate quadratic regression equation to express the functional relationship between factors and response values. CCD was one of the methods of response surface optimization. CCD can reduce experimental times required to evaluate the main effect of each parameter and their interactions. Because of the large number of corns required for each test and the wide range of process parameters, the CCD test was selected as the test method. Equation (3) shows the quadratic polynomial equation often used in the response surface method.
y = β 0 + i = 1 n β i x i + i = 1 n β ii x i 2 + i = 1 n β ij x i x j + ε
In the formula, y was the response, x was the independent variable, β0 was the constant coefficient, βi was the linear term coefficient, βii was the quadratic term coefficient and βij was the interaction term coefficient. In this experiment, indicators of operational performance, namely the loss rate and damage rate, were the response, and were represented by Lr and Dr, respectively. Moreover, the drum speed, feed rate and concave clearance were the independent variables, and were represented by Ds, Fr and Cc, respectively.

2.3.3. Non-Dominated Sorted Genetic Algorithm-II (NSGA-II)

In order to obtain the best operational performance of the threshing cylinder in this study, the non-dominated sorting genetic algorithm II (NSGA-II) was utilized [23]. This optimization algorithm was of low computational complexity and elite strategy. It was not only applied to detect the Pareto-optimal front for non-convex multi-objective problems, but also could avoid being too time-consuming. The Pareto-optimal solutions could be obtained in a single run only.
The detailed procedure of the NSGA-II was shown in Figure 5. As mentioned in the flow chart, the fitness functions of the optimization algorithm were determined by the regression model between process parameters to the indictors. Genetic operators, including crossover and mutation, were applied in order to generate a new population. Then, the elitist strategy was conducted to save the better part of the newly generated population for each cycle. Finally, the optimization process was wrapped up with the condition of the repetitions number.
Two functions were used in this algorithm. The first was the non-dominated sorting function, and the second was the crowding distance function. This subprogram took population members as input, and put them into fronts in proportion to their ranks. The second function was designed to avoid the accumulation of population members in a limited distance. On the other hand, there were no blank intervals in the domain due to using a crowding distance function. This function was utilized for comparison between members of a front which had equal ranks. For each reference point, the normalization Euclidean distance of each solution of the front was compared with the first, the previous, the next and the last member of the population. Normalization was used to avoid the problem that the objectives were on different scales.

3. Results and Discussion

3.1. ANOVA Analysis

According to the result of CCD, the threshing cylinder operational performance experiments was performed, and the values of the different response variables were obtained. The results were presented in Table 2. The loss rate (Lr) ranged from 2.495% to 8.231%, while the damage rate (Dr) ranged from 2.634% to 6.114%. These results were consistent with the investigation of the maize ear threshing process [24]. However, both performance parameters cannot be minimized simultaneously at this time. The response variables obtained from the simulations were then analyzed by multiple quadratic regressions to determine the mathematical models with the best fits. The adequacy and reliability of the regression models were also tested using the analysis of variance (ANOVA).
Statistical significance was determined by the ANOVA with quadratic models. The results from ANOVA of the Lr were listed in Table 3. They were evaluated by the coefficient of multiple determination (R2). When the value of R2 was 0.9517, it implied that the quadratic model was not reflected the 0.0483% of total Lr variation. When the F-value was 21.89, it expressed that the regression model of Lr reached great significance for the performance optimization of threshing cylinders. In Table 3 and Table 4, single asterisks indicated that the model terms were significant levels (P ≤ 0.05), while double asterisks indicated that the model terms were very significant levels (P ≤ 0.01) and triple asterisks indicated that the model terms were an extremely significant level (P ≤ 0.001). In Table 3, it can be found that significant level terms included the linear terms of Fr, the very significant level terms included the linear terms of Cc and the quadratic terms of (Cc)2, and the extremely significant level terms included the linear terms of Ds and the quadratic terms of (Ds)2. Therefore, the most significant term was the linear term, and the interaction term was the least significant for the Lr. In addition, Ds was the strongest factor affecting Lr. These results indicated that the Lr would be improved significantly with the increase of Ds. Pishgar-Komleh et al. [25] also found that the effects of combine cylinder speed on the threshing loss were significant, at a level of 1%. Their results also indicated that the loss rate was improved from 4.7% to 5.28%, with the drum speed increasing from 400 rpm to 500 rpm.
The results from ANOVA of the Dr were listed in Table 4. The results were evaluated by the coefficient of multiple determination (R2). When the value of R2 was 0.8768, it implied that the quadratic model was not reflected the 0.1232% of total Dr variation. When the F-value was 7.91, it expressed that the regression model of Dr reached great significance for the performance optimization of the threshing cylinder. In Table 4, it can be found that significant level terms included the linear terms of (Ds)2, while the very significant level terms included the linear terms of Cc and the extremely significant level terms included the linear terms of Ds. Therefore, the most significant term was the linear term, and the interaction term was the least significant for the Dr. In addition, Ds also was the strongest factor affecting the Dr. The previous research also found that corn kernel damage increased from 10% up to 23%, with rasp bar movement speed varying from 12 to 20 m/s [24].

3.2. Regression Models of Responses

Based on the results of the experiments in Table 2, experimental data were analyzed and fitted with the quadratic polynomials that were obtained using the regression model.
The Lr regression response surface models were represented as:
L r = 28.15192 0.062565 D s 0.26050 F r 0.79458 C c 4.41088 × 10 - 3 D s 7.59398 × 10 - 5 D s × C c 0.031304 F r × C c + 1.29006 × 10 - 4 D s 2 + 0.22419 F r 2 + 0.014604 C c 2
The Dr regression response surface models were represented as:
D r = 16.08260 0.022436 D s + 3.65587 F r + 0.65757 C c 2.39532 × 10 - 4 D s × F r 2.72059 × 10 - 4 D s × C c 0.022225 F r × C C + 5.01967 × 10 - 5 D s 2 0.20692 F r 2 6.15949 × 10 - 3 C c 2

3.3. Multi-objective Optimization Model

The optional operation performance of threshing cylinder should be of low grain loss rate, and the damage rate as soon as possible. In this research, the process parameters of the Ds, Fr and Cc were used as design variables. Based on the pre-experiment, the drum speed was set as 300 rpm ≤ Ds ≤ 600 rpm, the feed rate was set as 5 kg/s ≤ Fr ≤ 9 kg/s and the concave clearance was set as 30 mm ≤ Cc ≤ 50 mm. When process parameters were changed, the kernel loss rate and the damage rate developed contradictorily. Therefore, the objective function and constraint function of the optimization problem were as follows:
{ min [ L r ( D s ,   F r ,   C c ) ,   D r ( D s ,   F r ,   C c ) ] 300 r p m D s 600 r p m 5 kg / s F r 9 kg / s 30 m m C c 50 m m

3.4. Effect of Interaction

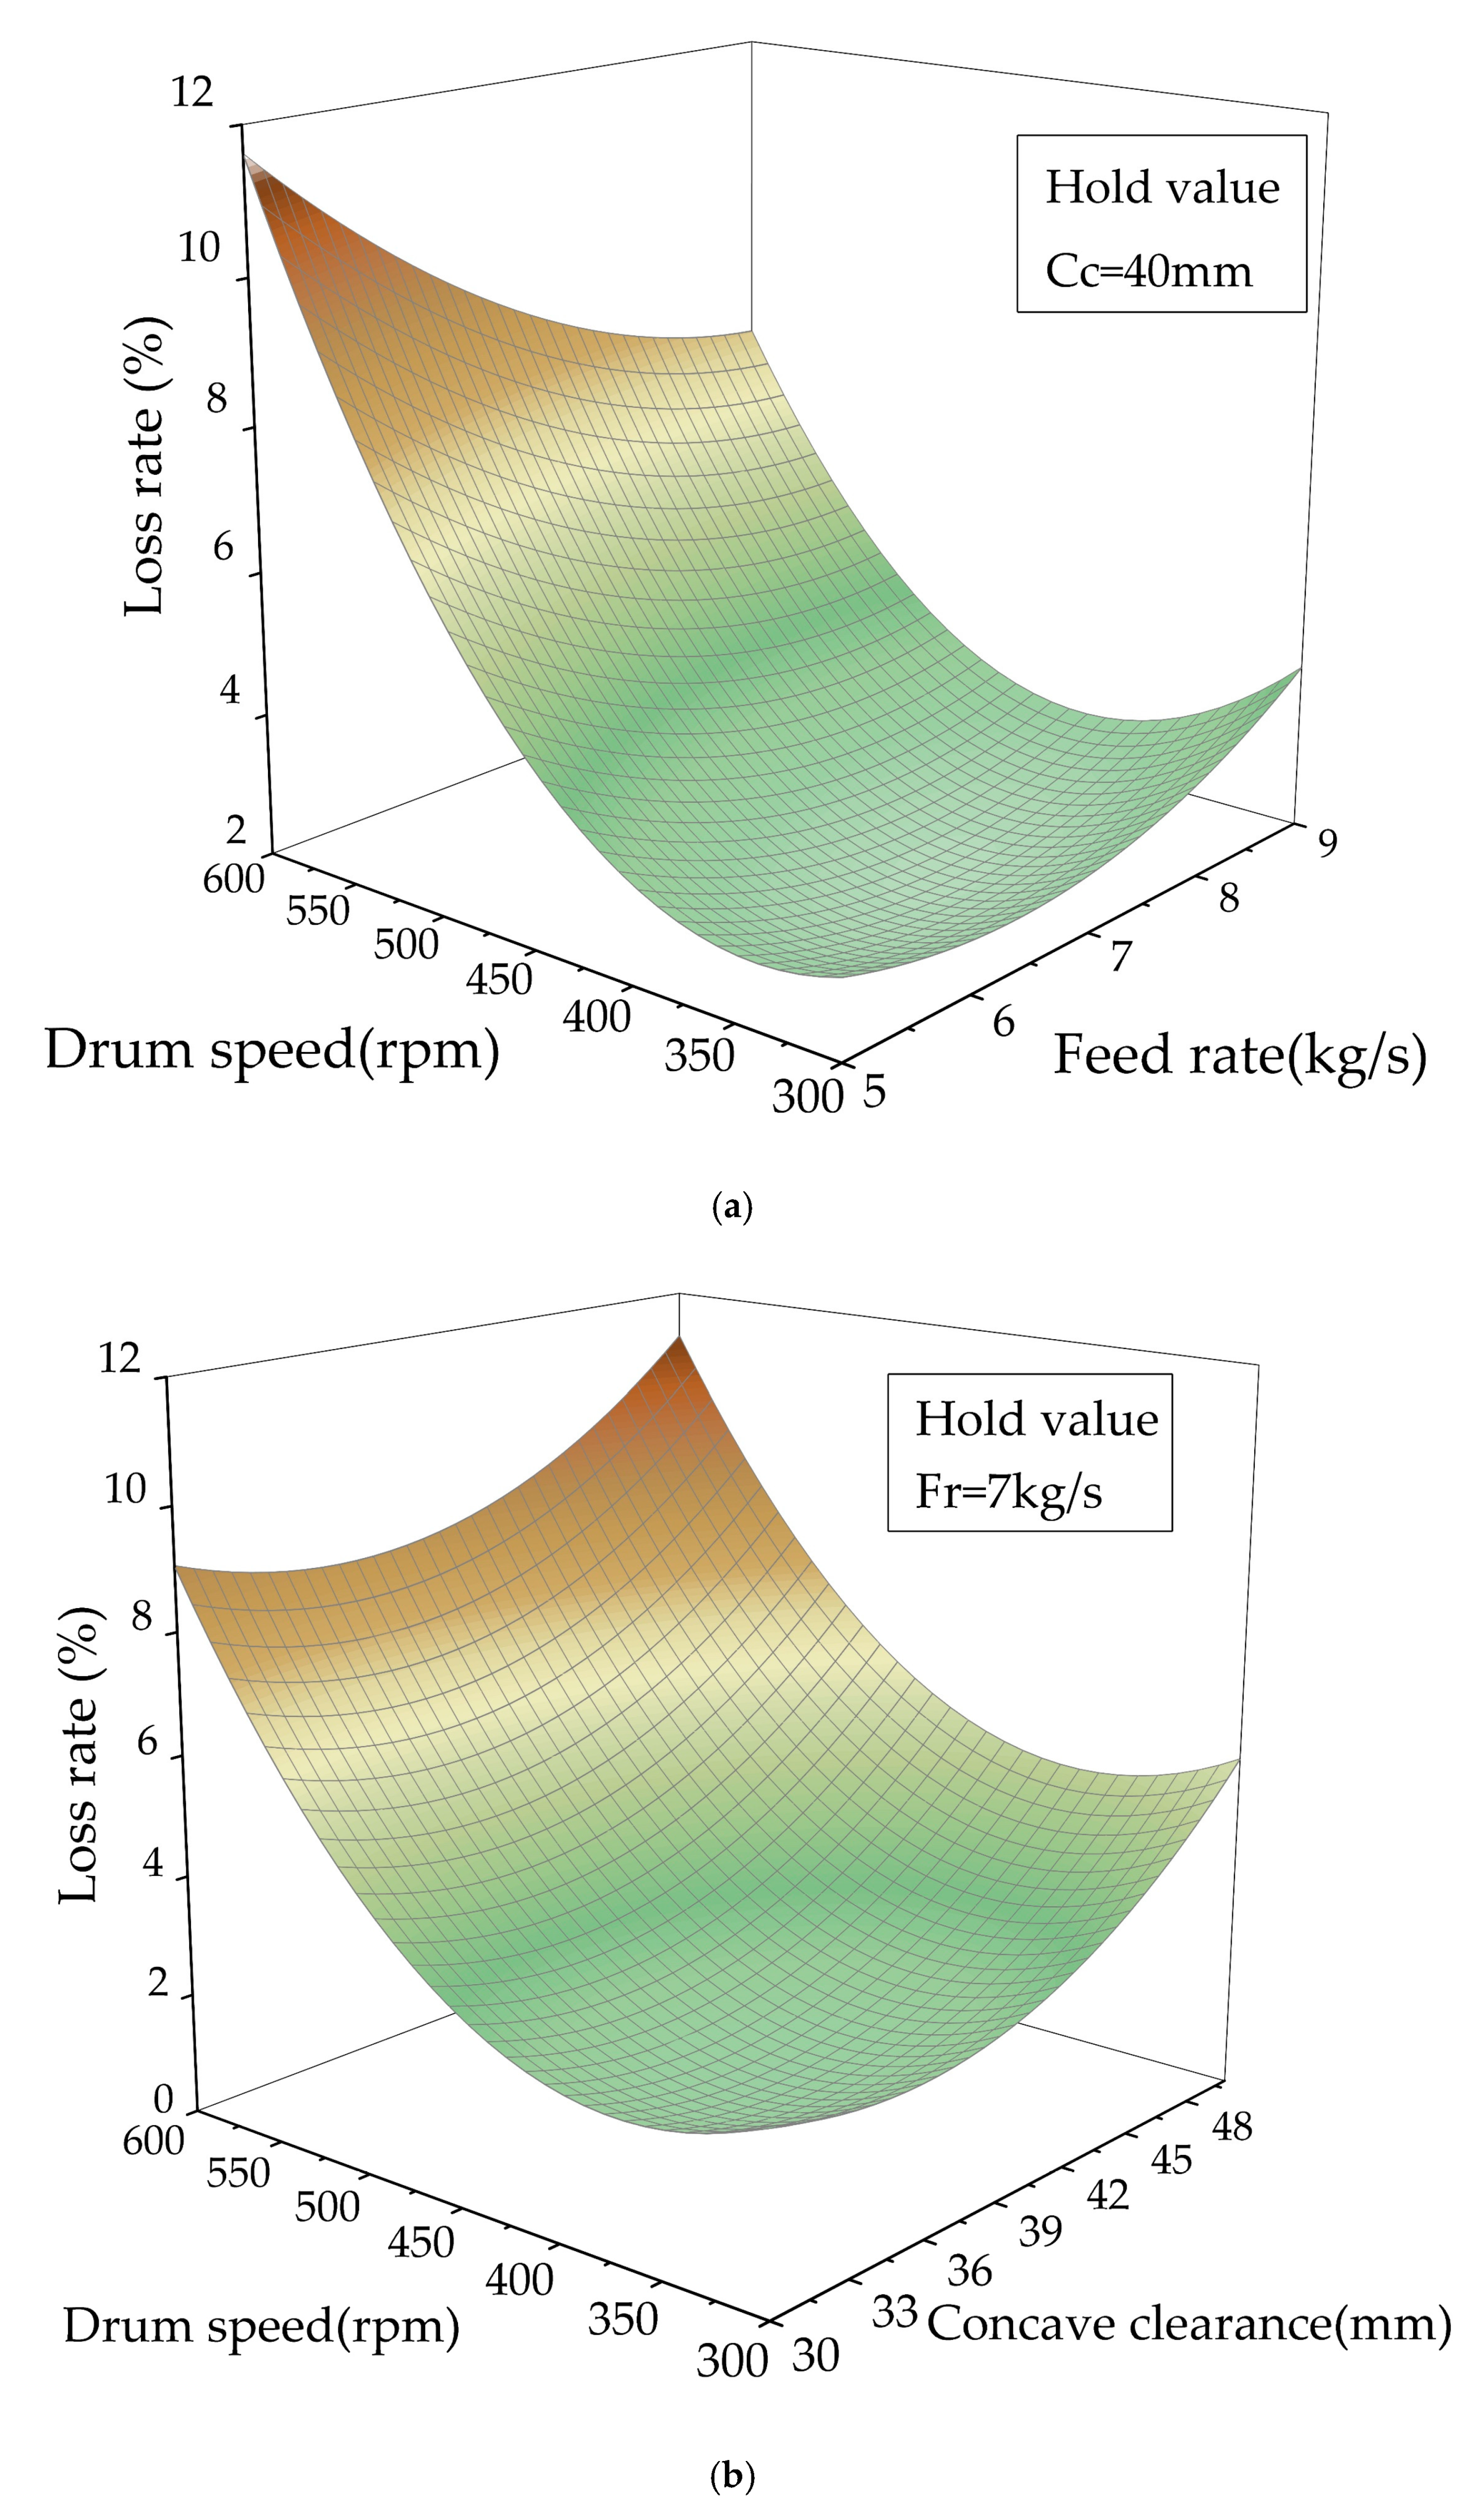
3.4.1. Effect of Interaction of Factors on Lr

In order to observe certain curvature regions and interactions among the process parameters, the response surfaces of Equation (4) were modeled through robust parameter design. Lr was presented in Figure 6 on the experimental region, with hold values specified in each graph. From the contour map, it was found that the central color of Figure 6a was obviously darker than those of Figure 6b and Figure 6c, and the trend of change was stronger, as was the p-value of each item in Table 3; this indicated that the interaction was more significant.

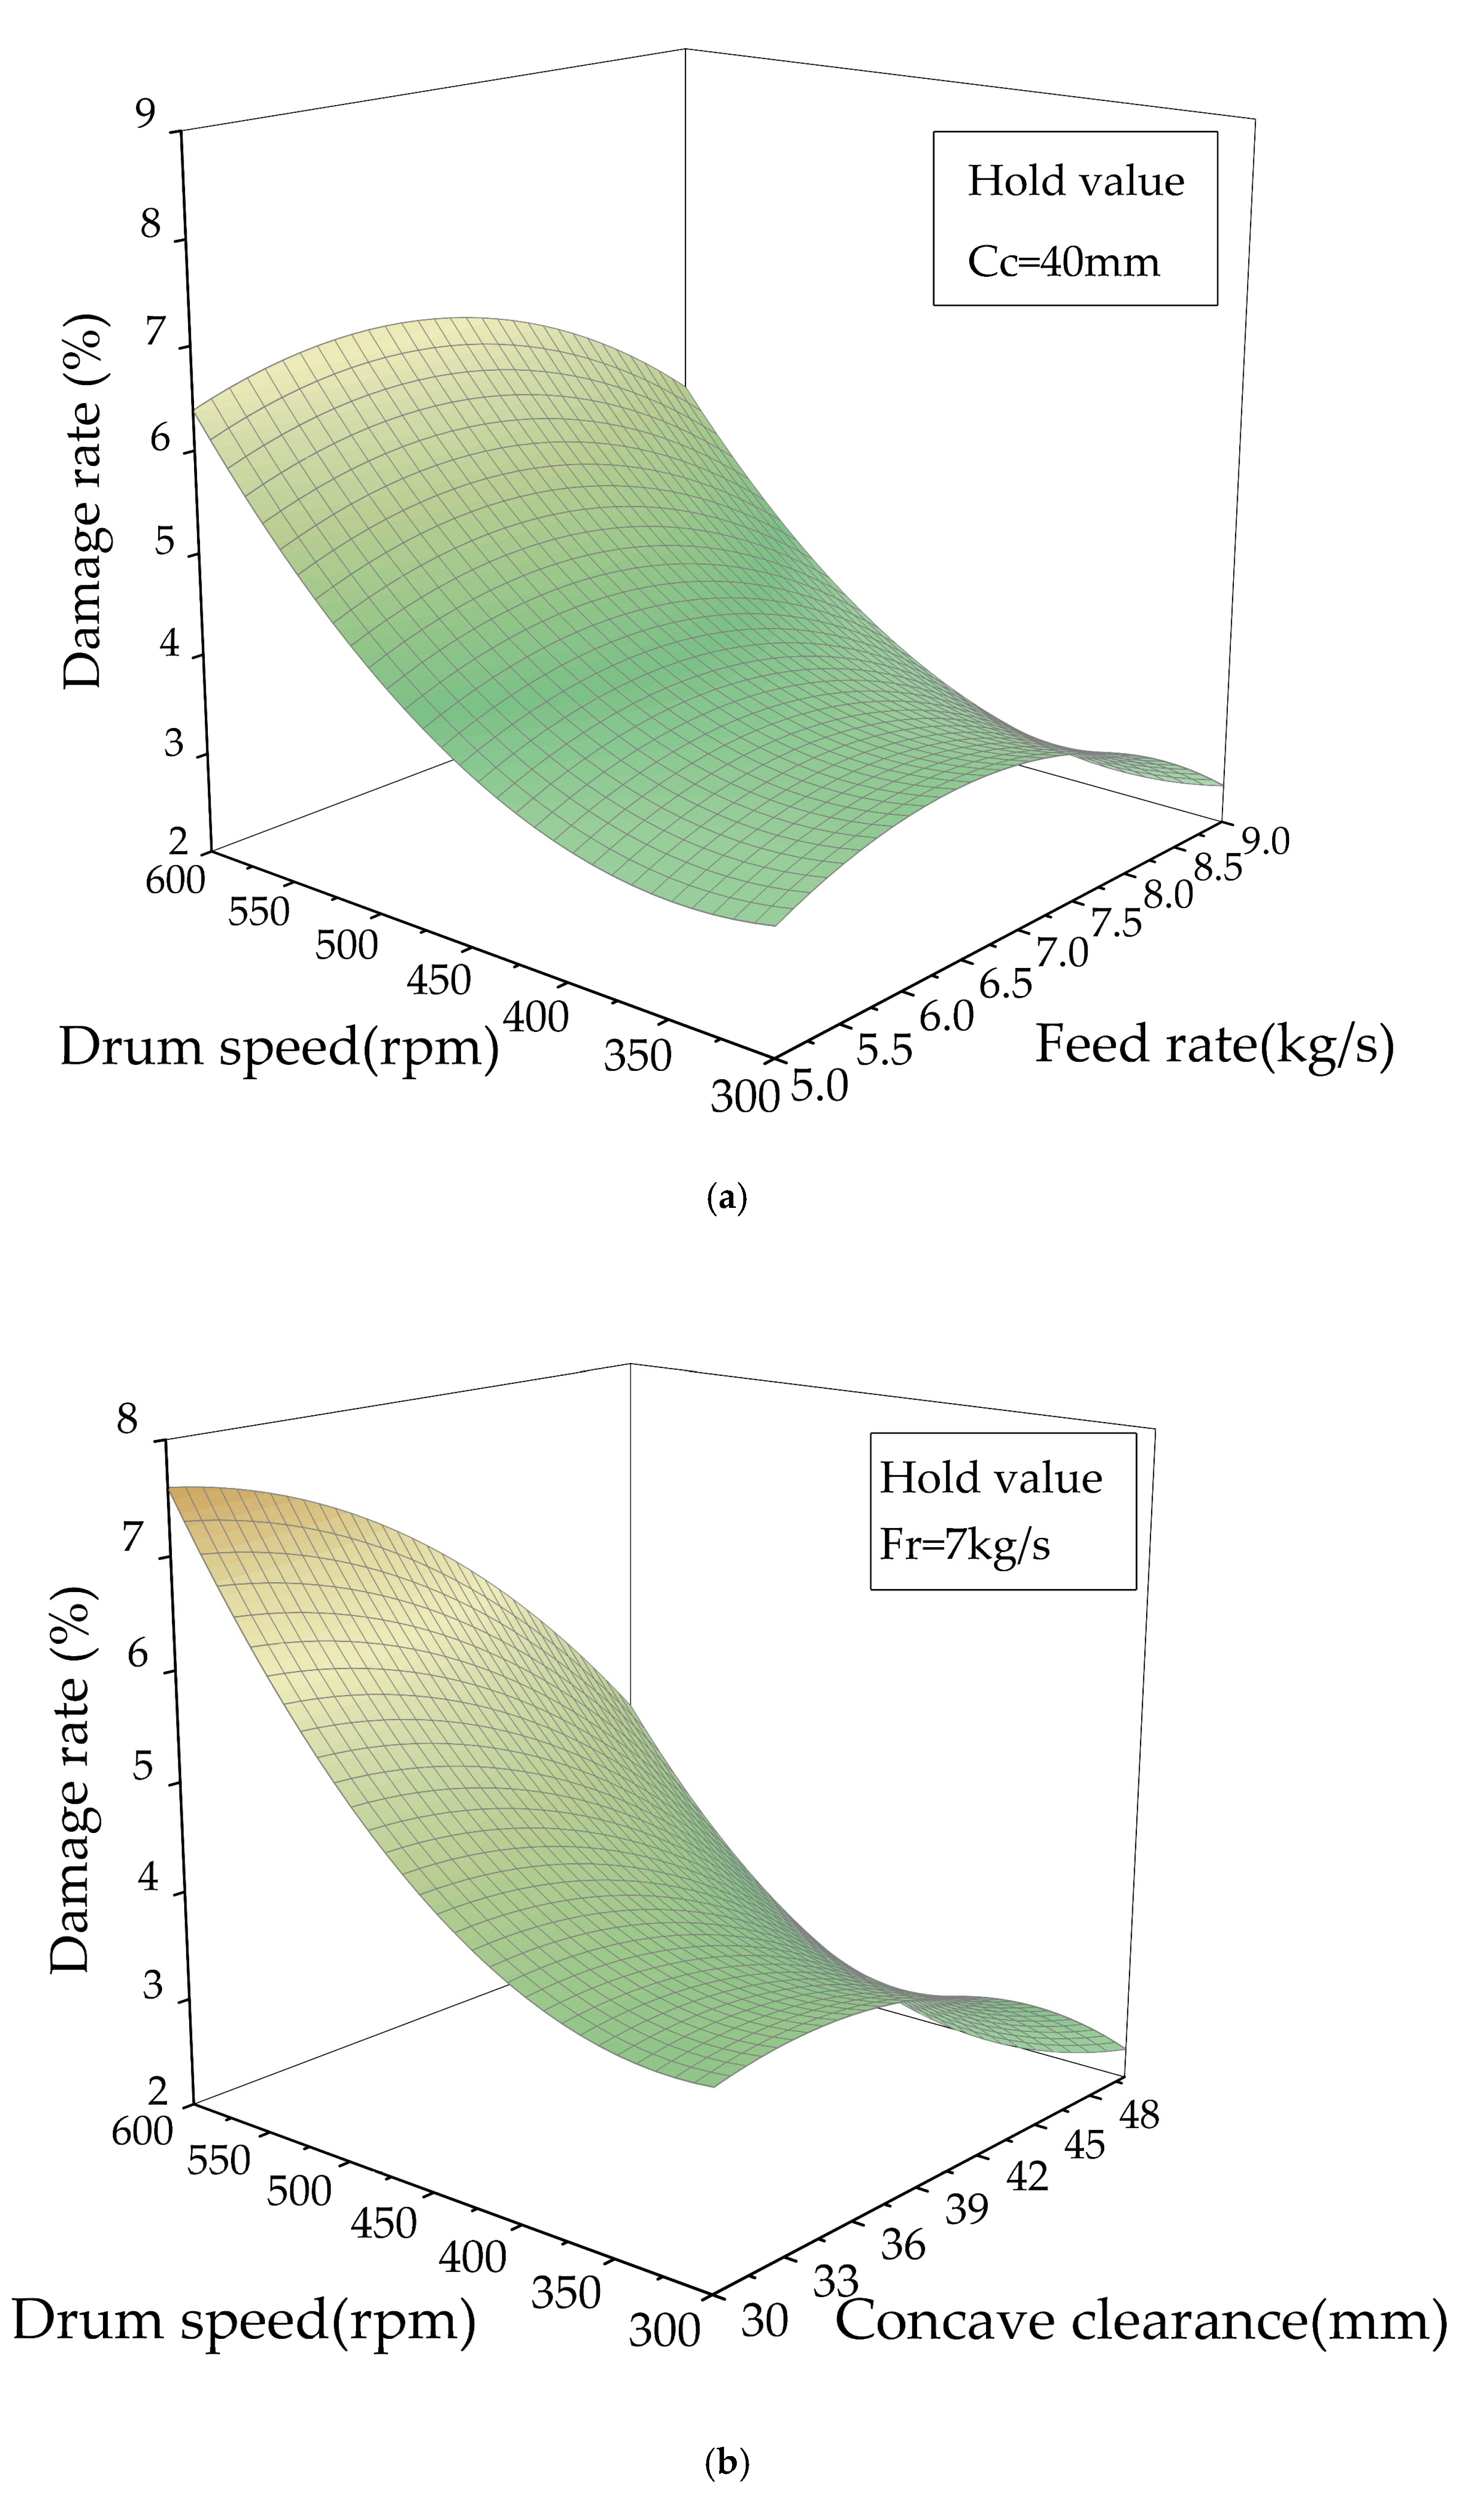
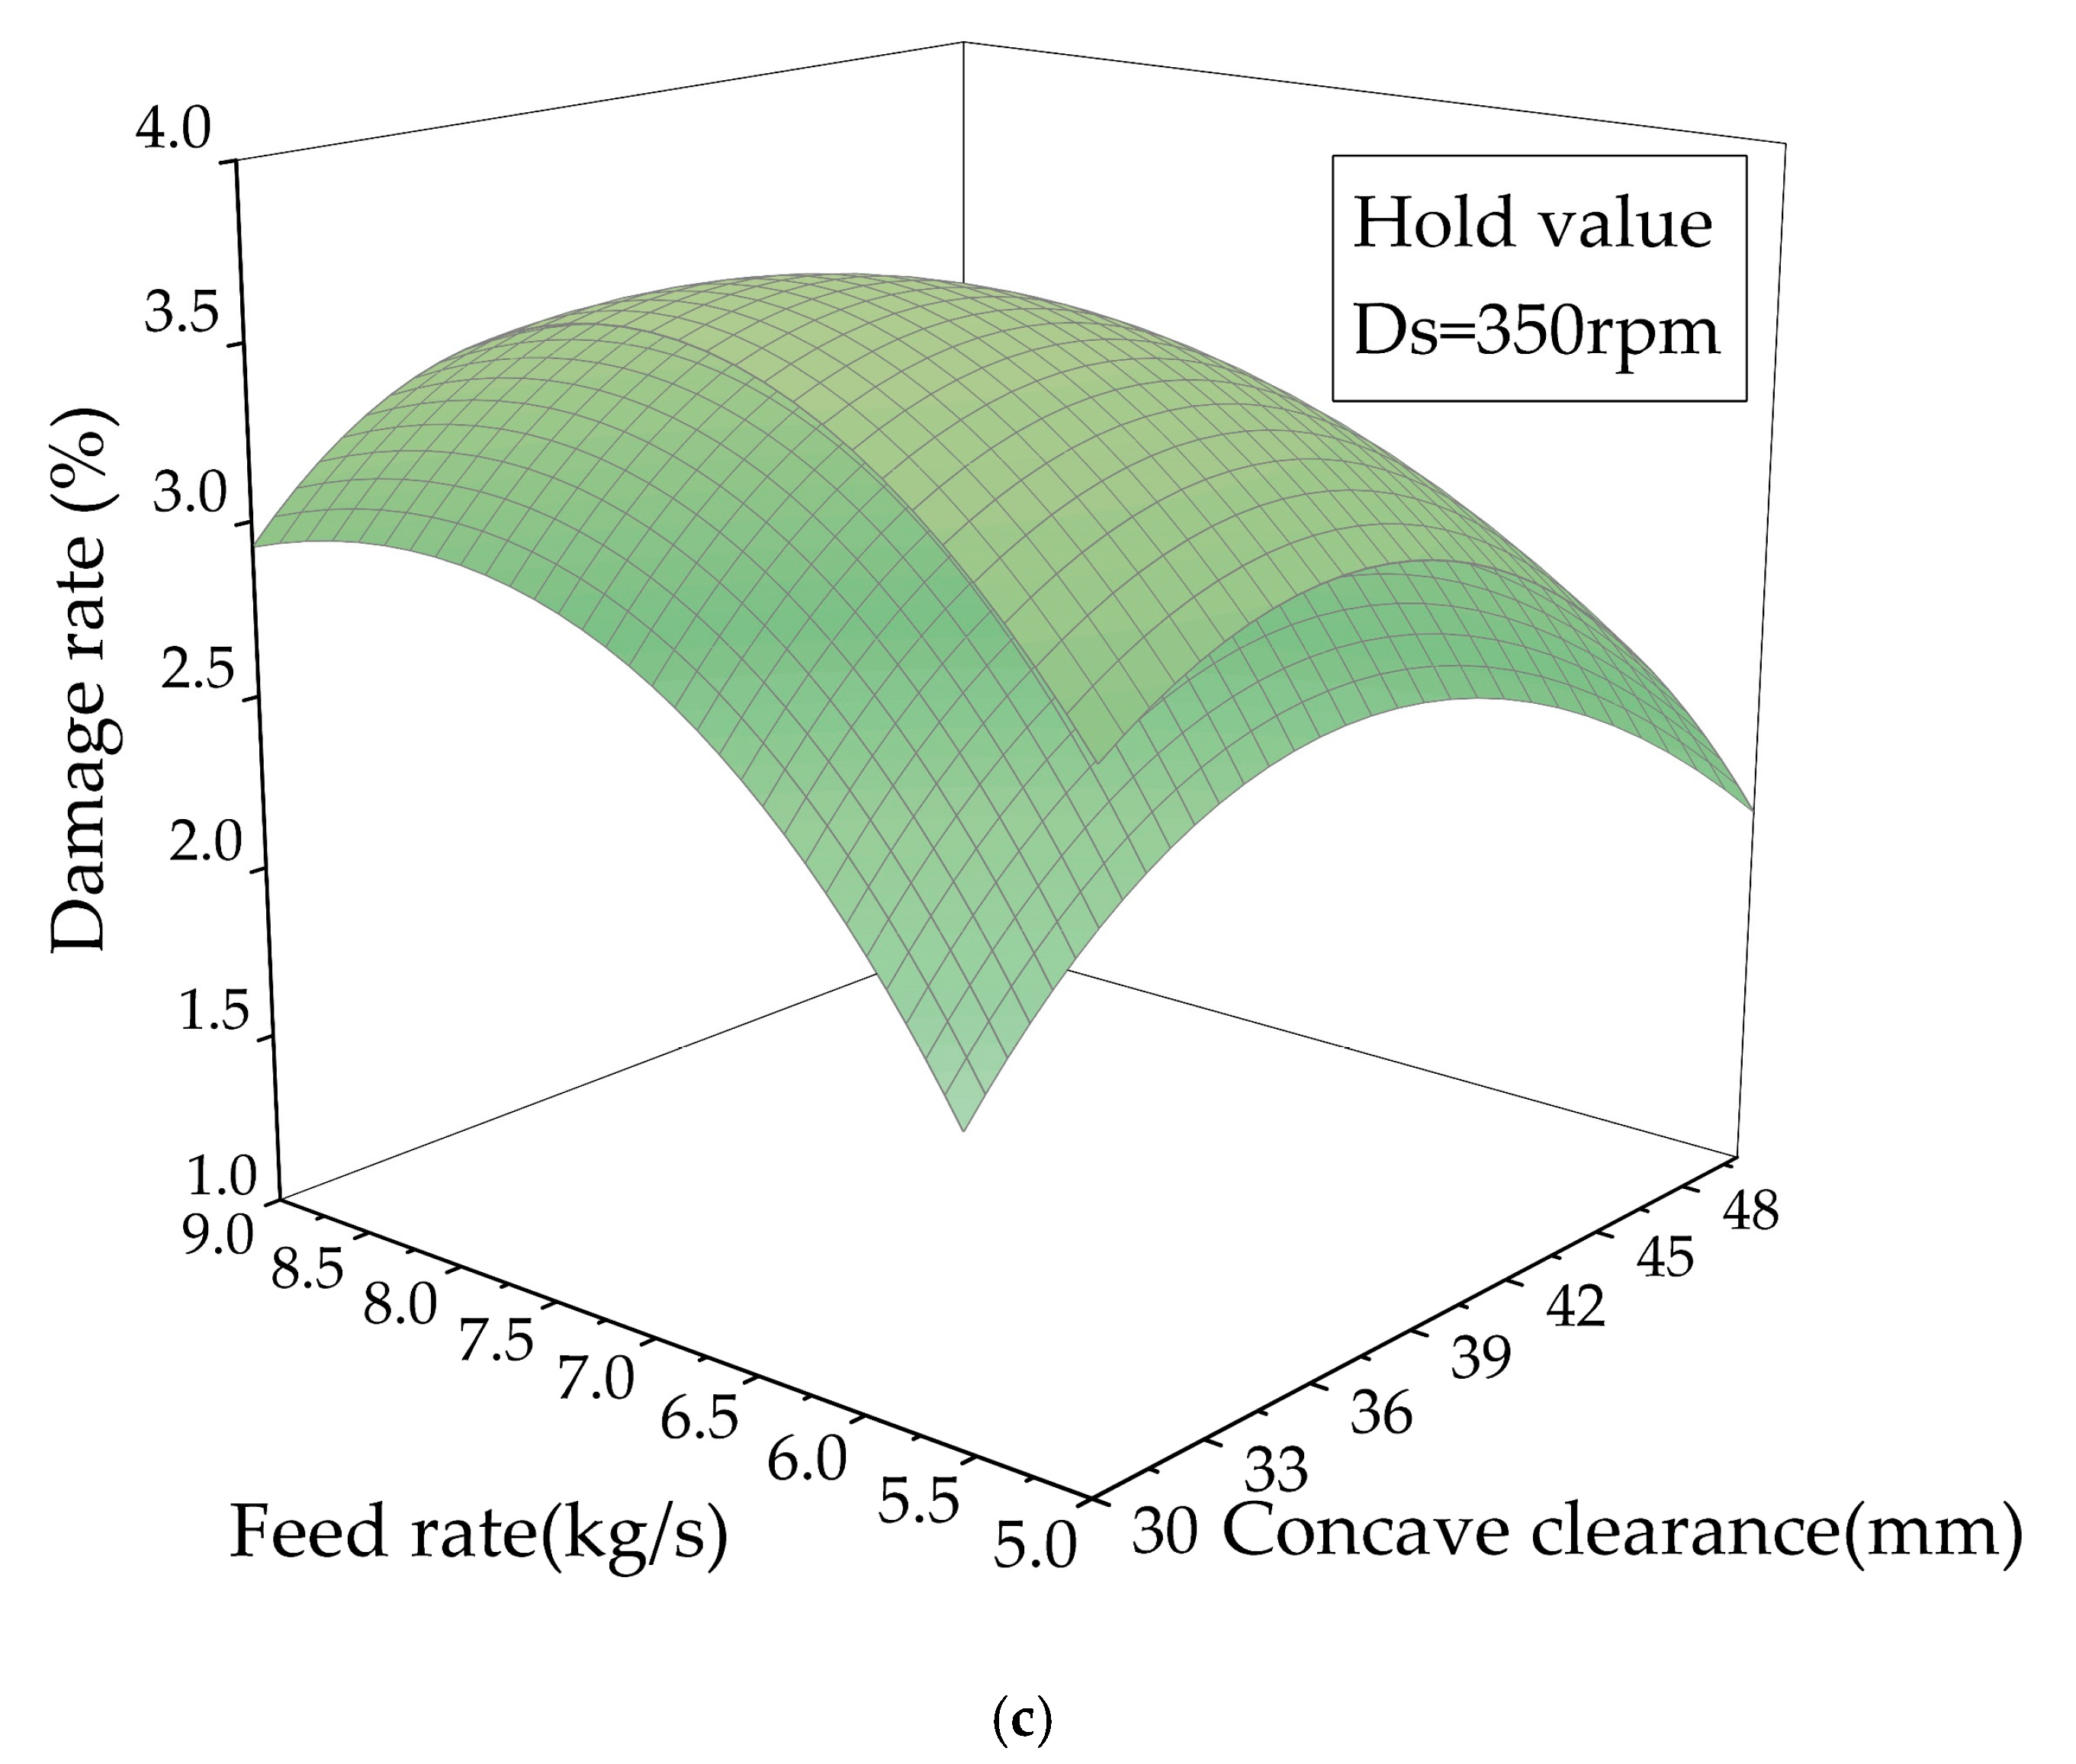
3.4.2. Effect of Interaction of Factors on Dr

For the observation of certain curvature regions and interactions among the process parameters, the response surfaces of Equation (5) were modeled through robust parameter design. Dr was presented in Figure 7 on the experimental region, with hold values specified in each graph. The contour map showed that the central colors of Figure 7b and 7c were obviously darker than those of Figure 7a, and the trend of change was stronger, as was p-value of each item in Table 4. This indicates that the interaction was more significant.

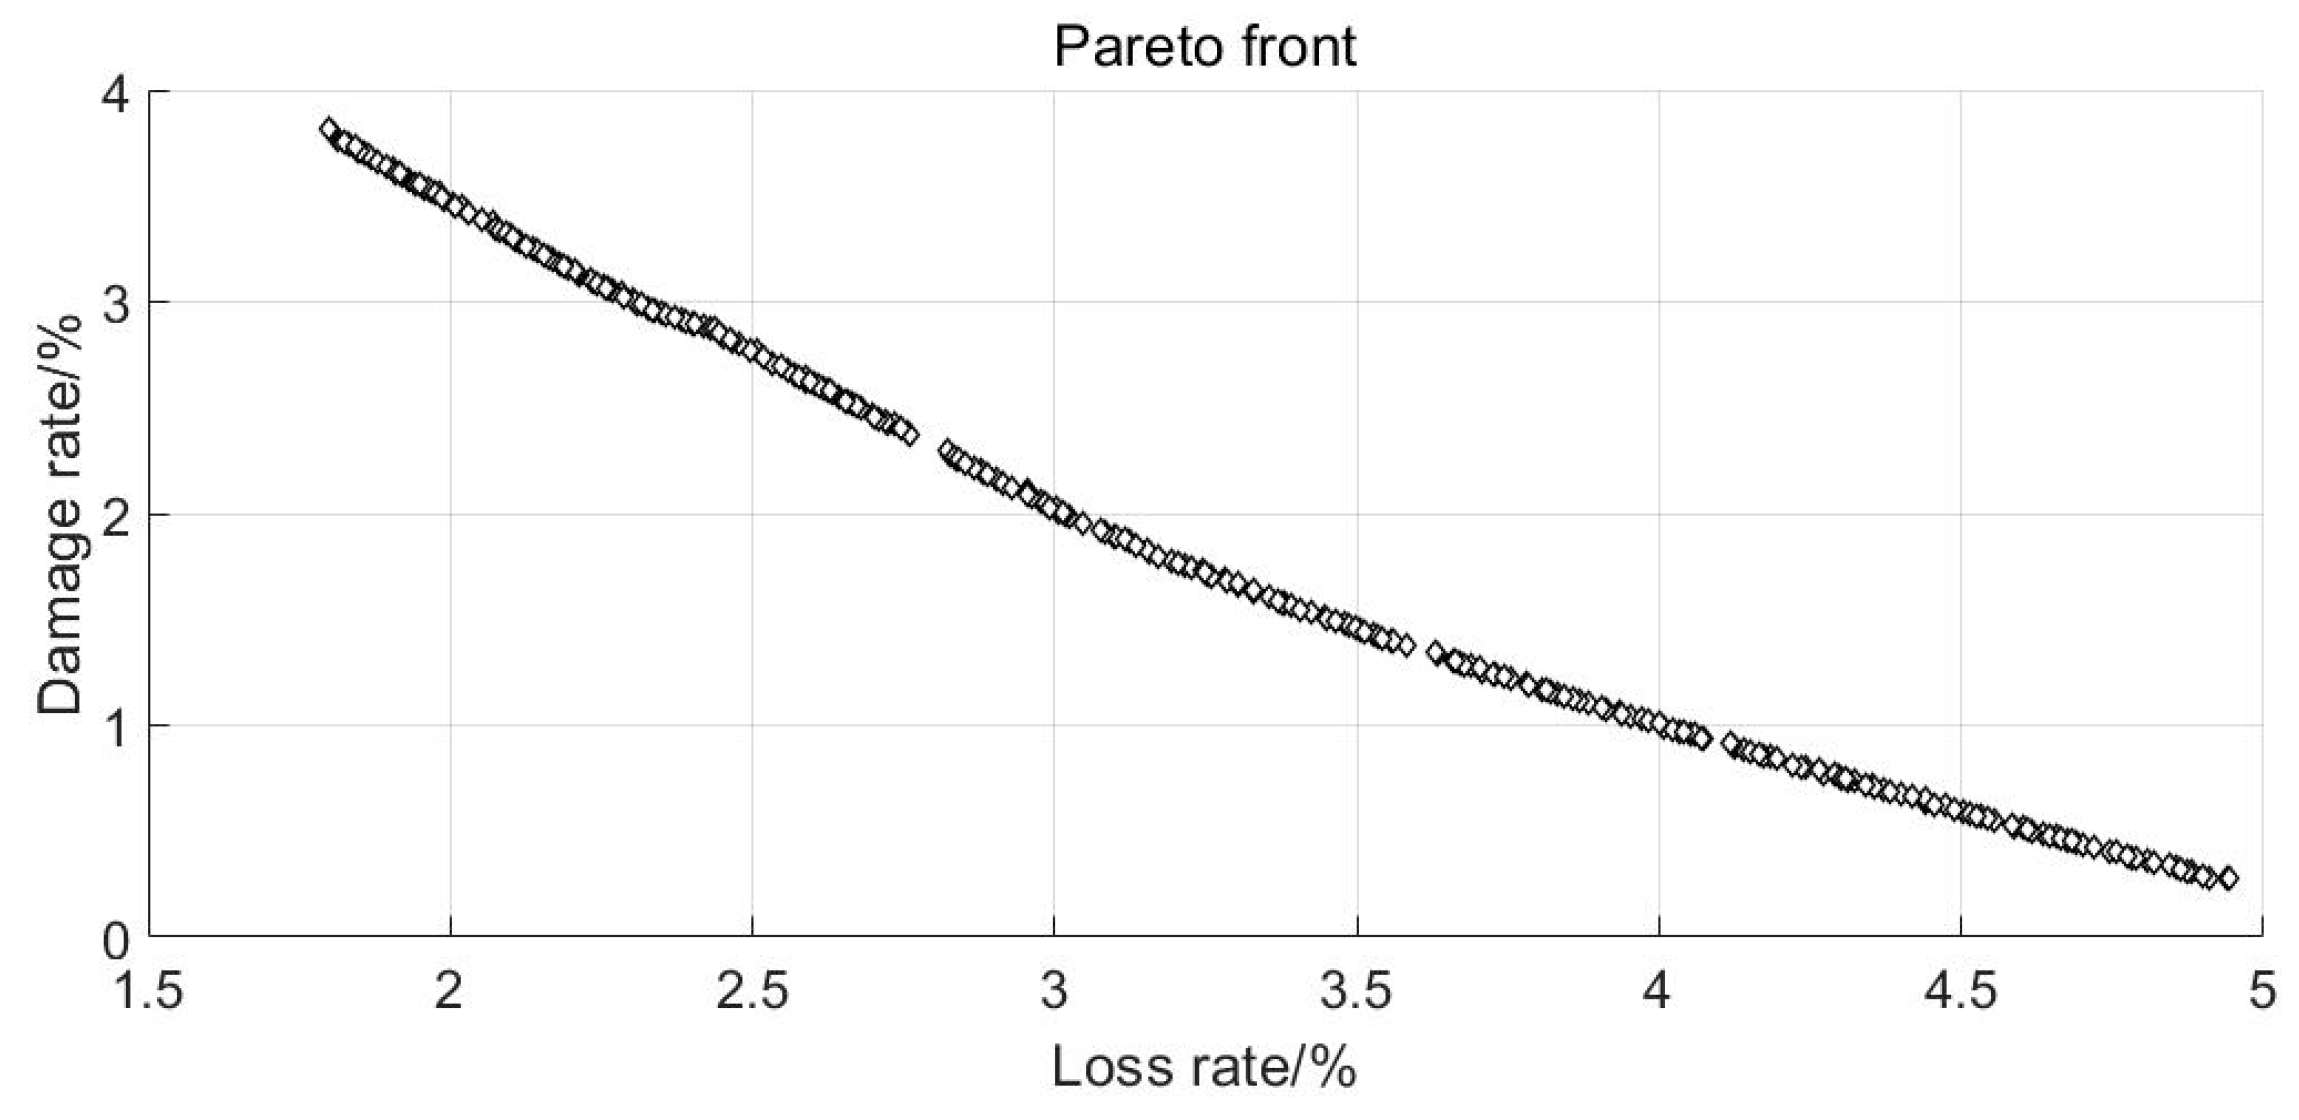
3.5. Optimization by NSGA-II

The Pareto frontier obtained by solving the optimization model with the NSGA-II algorithm was shown in Figure 8. Lr was represented on the abscissa, and Dr was represented on the ordinate. For multi-objective optimization problems, it was impossible to make each objective optimal at the same time. However, coordination and tradeoffs between the objectives can be performed to satisfy each objective as much as possible. This means that all solutions on the optimal frontier can be used for scheme optimization. According to the reference of GB/T 21961-2008 (State Standard of the People’s Republic of China of Test Methods for Maize Combine Harvester) and GB/T 21962-2008 (State Standard of the People’s Republic of China of Technical Requirements for Maize Combine Harvester), the permissible range of Lr and Dr is 5% and 5%, respectively. Dr is less important than Lr within the permissible range, therefore the weight of Lr is greater than weight of Dr. In order to make Lr and Dr as optimal as possible, the drum speed was selected as 384.1 rpm, the feed rate as 8.6 kg/s and the concave clearance as 40.5 mm, according to the requirement of corn harvest. Therefore, the best operational performance of a longitudinal axial threshing cylinder on frozen corn was obtained. The Lr was 1.98% and the Dr was 3.49%. Under this condition, Lr has reached the normal threshing indexes of threshing corn at normal temperatures. Dr was lower than the normal threshing indexes of threshing corn at normal temperatures.

3.6. Verification Experiment

To validate the optimal process parameters, the threshing experiment was repeated under the optimal conditions. The valid test was repeated three times to obtain the result. The results were presented in Table 5. The average Lr reached 1.93%, and the average Dr reached 3.40%. The errors were within ±5%. This result indicated that the applicability of the optimal process parameters and the optimization method of combining NSGA-II and RSM was effective to determine the optimal process parameters.

4. Conclusions

The mathematical model of the multi-objective optimization of longitudinal axial threshing cylinders for frozen corn was established based on the second-order response surface method (RSM). Furthermore, the Non-Dominated Sorted Genetic Algorithm-II (NSGA-II) was used to obtain the Pareto-optimal solutions. It was clearly found that drum speed, feed rate and concave clearance shake amplitude significantly affected operational performance. As a result, Ds was the strongest factor affecting both Lr and Dr. In other words, the threshing quality of frozen corn was most affected by drum speed (Ds) in a longitudinal axial combine harvester.
The optimum values of the process parameters of threshing cylinders for frozen corn were determined. The drum speed was 384.1 rpm, the feed rate was 8.6 kg/s and the concave clearance was 40.5 mm. Accordingly, the Lr was 1.98% and Dr was 3.49%. The verification experiment determined that the Lr was 1.93% and Dr was 3.40%. The feasibility of the proposed multi-objective optimization method of process parameters in agriculture machinery was verified by RSM and NSGA-II.
After the optimization, the loss rate and damage rate of threshing performance for frozen corn were reduced in the demand for combine harvesters. This will provide an optimization method for synchronously reducing the loss rate and damage rate for grain harvesters. This multi-objective optimization method, combining RSM and NSGA-II, may be widely used in other agricultural machinery.

Author Contributions

Conceptualization, J.F.; methodology, J.F.; validation, H.Y. and D.Z.; investigation, H.Y. and D.Z.; resources, L.R.; writing—original draft preparation H.Y.; writing—review and editing, J.F.; supervision, Z.C., and L.R.; project administration, J.F.; funding acquisition, J.F. All authors have read and agreed to the published version of the manuscript.

Funding

This research was funded by the National Key Research and Development Plan of China, grant number 2017YFD0700302.

Acknowledgments

The authors are grateful for the frozen corn provided by the Experimental Base of Agriculture of Jilin University.

Conflicts of Interest

The authors declare no conflict of interest.

References

  1. Zhang, J.; Dai, L.; Cheng, F. Classification of frozen corn seeds using hyperspectral VIS/NIR reflectence imaging. Molecules 2019, 24, 149. [Google Scholar] [CrossRef] [Green Version]
  2. Su, Y.; Cui, T.; Zhang, D.; Xia, G.; Gao, X.; He, X.; Xu, Y. Damage resistance and compressive properties of bulk maize kernels at varying pressing factors: Experiments and modeling. J. Food Process Eng. 2019, 42. [Google Scholar] [CrossRef]
  3. Wang, L.; Wu, B.; Wu, Z.; Li, R.; Feng, X. Experimental determination of the coefficient of restitution of particle-particle collision for frozen maize grains. Powder Technol. 2018, 338, 263–273. [Google Scholar] [CrossRef]
  4. Gu, R.-L.; Huang, R.; Jia, G.-Y.; Yuan, Z.-P.; Ren, L.-S.; Li, L.; Wang, J.-H. Effect of Mechanical Threshing on damage and vigor of maize seed threshed at different moisture contents. J. Integr. Agric. 2019, 18, 1571–1578. [Google Scholar] [CrossRef]
  5. Šotnar, M.; Pospíšil, J.; Mareček, J.; Dokukilová, T.; Novotný, V. Influence of the combine harvester parameter settings on harvest losses. Acta Technol. Agric. 2018, 21, 105–108. [Google Scholar] [CrossRef] [Green Version]
  6. Yang, L.; Cui, T.; Qu, Z.; Li, K.H.; Yin, X.W.; Han, D.D.; Yan, B.X.; Zhao, D.Y.; Zhang, D.X. Development and application of mechanized maize harvesters. Int. J. Agric. Biol. Eng. 2016, 9, 15–28. [Google Scholar] [CrossRef]
  7. Fu, J.; Chen, Z.; Han, L.; Ren, L. Review of grain threshing theory andtechnology. Int. J. Agric. Biol. Eng. 2018, 11, 12–20. [Google Scholar] [CrossRef]
  8. Steponavičius, D.; Pužauskas, E.; Špokas, L.; Jotautienė, E.; Kemzūraitė, A.; Petkevičius, S. Concave design for high-moisture corn ear threshing. Mechanics 2018, 24. [Google Scholar] [CrossRef]
  9. Kiniulis, V.; Steponavičius, D.; Kemzuraite, A.; Andriušis, A.; Juknevicius, D. Dynamic indicators of a corn ear threshing process influenced by the threshing-separation unit load. Mechanika 2018, 24, 412–421. [Google Scholar] [CrossRef]
  10. Al Sharifi, S.K.A.; Aljibouri, M.A.; Taher, M.A. Effect of Threshing Machines, Rotational speed and grain moisture on corn shelling. Bulg. J. Agric. Sci. 2019, 25, 243–255. [Google Scholar]
  11. Yu, Y.; Fu, H.; Yu, J. DEM-based Simulation of the corn threshing process. Adv. Powder Technol. 2015, 26, 1400–1409. [Google Scholar] [CrossRef]
  12. Srison, W.; Chuan-udom, S.; Saengprachatanarug, K. Design factors affecting losses and power consumptionof an axial flow corn shelling unit. Songklanakarin J. Sci. Technol. 2016, 38. [Google Scholar] [CrossRef]
  13. Chen, D.; Kang, F.; Zhu, Q.Y.; Wang, S.M. Study on combine harvester speed control based on optimum threshing power consumption model. Appl. Mech. Mater. 2011, 130–134, 1911–1914. [Google Scholar] [CrossRef]
  14. Lu, N.Y.; Gong, G.X.; Yang, Y.; Lu, J.H. Multi-objective process parameter optimization for energy saving in injection molding process. J. Zhejiang Univ. Sci. A 2012, 13, 382–394. [Google Scholar] [CrossRef]
  15. Xiao, W.; Wang, B.; Zhou, J.; Ma, W.; Yang, L. Optimization of aluminium sheet hot stamping process using a multi-objective stochastic approach. Eng. Optim. 2016, 48, 2173–2189. [Google Scholar] [CrossRef]
  16. Li, H.; Chen, J.; Xiao, Y. Multi-objective optimization for laminated steel sheet forming process based on desirability function approach and reliability analysis. Eng. Comput. 2013, 30, 1107–1127. [Google Scholar] [CrossRef]
  17. Zhu, F.; Wang, Z.; Lv, M. Multi-objective optimization method of precision forging process parameters to control the forming quality. Int. J. Adv. Manuf. Technol. 2015, 83, 1763–1771. [Google Scholar] [CrossRef]
  18. Nisi, K.; Nagaraj, B.; Agalya, A. Tuning of a PID controller using evolutionary multi objective optimization methodologies and application to the pulp and paper industry. Int. J. Mach. Learn. Cybern. 2018, 10, 2015–2025. [Google Scholar] [CrossRef]
  19. Torres-Treviño, L.M.; Reyes-Valdes, F.A.; López, V.; Praga-Alejo, R. Multi-objective optimization of a welding process by the estimation of the Pareto optimal set. Expert Syst. Appl. 2011, 38, 8045–8053. [Google Scholar] [CrossRef]
  20. Kiniulis, V.; Steponavičius, D.; Andriušis, A.; Kemzūraitė, A.; Jovarauskas, D. Corn ear threshing performance of filler-plate-covered threshing cylinders. Mechanics 2017, 23, 714–722. [Google Scholar] [CrossRef] [Green Version]
  21. Ren, L.Q. Design of Experiment and Optimiz-Ation; Higher Education Press: Beijing, China, 2009; pp. 246–257. [Google Scholar]
  22. Paulsen, M.R.; Nave, W.R. Corn damage from conventional and rotary combines. Trans. ASAE 1980, 23, 1100–1116. [Google Scholar] [CrossRef]
  23. Konak, A.; Coit, D.W.; Smith, A.E. Multi-objective optimization using genetic algorithms: A tutorial. Reliab. Eng. Syst. Saf. 2006, 91, 992–1007. [Google Scholar] [CrossRef]
  24. Petkevichius, S.; Shpokas, L.; Kutzbach, H.D. Investigation of the maize ear threshing process. Biosyst. Eng. 2008, 99, 532–539. [Google Scholar] [CrossRef]
  25. Pishgar Komleh, S.H.; Keyhani, A.; Mostofi Sarkari, M.R.; Jafari, A. Assessment and determination of seed corn combine harvesting losses and energy consumption. Elixir Agric. 2013, 54, 12631–12637. [Google Scholar] [CrossRef] [Green Version]
Figure 1. Frozen corn with snow.
Applsci 10 01646 g001
Figure 2. Longitudinal axial threshing cylinder test device.
Applsci 10 01646 g002
Figure 3. Threshing cylinder.
Applsci 10 01646 g003
Figure 4. Procedure diagram of the optimization.
Applsci 10 01646 g004
Figure 5. Flowchart of the NSGA-II.
Applsci 10 01646 g005
Figure 6. Response surface diagrams of interaction: (a) Interaction of Ds-Fr; (b) interaction of Ds-Cc. (c) Interaction of Fr-Cc.
Applsci 10 01646 g006aApplsci 10 01646 g006b
Figure 7. Response surface diagrams of interaction: (a) Interaction of Ds-Fr; (b) interaction of Ds-Cc. (c) Interaction of Fr-Cc.
Applsci 10 01646 g007aApplsci 10 01646 g007b
Figure 8. Pareto-Pareto optimal sets with NSGA-II.
Applsci 10 01646 g008
Table 1. Coding of process parameters and their corresponding range.
LevelDrum speed (Ds)(rpm)Feed rate (Fr)(kg/s)Concave clearance (Cc)(mm)
1.682600950
1539.198.1945.95
0450740
−1360.815.8134.05
−1.682300530
Table 2. Experimental design and result.
LevelsDsFrCcLr, %Dr, %
1−1−1−12.4954.282
21−1−16.1325.569
3−11−12.2393.700
411−14.7416.114
5−1−114.0192.616
61−118.2314.554
7-1113.6142.634
81115.2193.242
9−1.682002.3503.042
101.682009.4566.702
110−1.68204.1243.669
1201.68203.6702.162
1300−1.6823.1813.892
14001.6825.7412.362
150002.4773.771
160002.7023.936
170002.6854.168
180003.7253.582
190002.6734.739
200002.7233.959
Lr = loss rate, Dr = damage rate
Table 3. Analysis of variance for loss rate.
SourceSSDfMSF-Valuep-value
Model71.6497.9621.89< 0.0001***
Ds41.85141.85115.10< 0.0001***
Fr2.4912.496.840.0258*
Cc7.0017.0019.270.0014**
Ds-Fr1.7511.754.820.0529
Ds-Cc0.01310.0130.0360.8539
Fr-Cc0.3910.391.080.3236
Ds215.18115.1841.74< 0.0001***
Fr21.4511.453.980.0739
Cc23.8413.8410.570.0087**
Residual3.64100.36
Lack of Fit2.6450.532.640.1551
Pure Error1.0050.20
Cor Total75.2719
SS = sequential sum of squares; Df = degrees of freedom; MS = mean squares; F = Fischer’s variance ratio; p = probability value; * Significant (p < 0.05); ** Very significant (p < 0.01); *** Very significant (p < 0.001).
Table 4. Analysis of variance for damage rate.
SourceSSDfMSF-Valuep-value
Model23.5892.627.910.0017**
Ds11.26111.2634.010.0002***
Fr1.0911.093.300.0993
Cc6.1916.1918.680.0015**
Ds-Fr5.164E-00315.164E-0030.0160.9031
Ds-Cc0.1710.170.500.4944
Fr-Cc0.2010.200.600.4577
Ds22.3012.306.940.0250*
Fr21.2311.233.730.0824
Cc20.6810.682.060.1814
Residual3.31100.33
Lack of Fit2.5150.503.120.1186
Pure Error0.8050.16
Cor Total26.8919
SS = sequential sum of squares; Df = degrees of freedom; MS = mean squares; F = Fischer’s variance ratio; p = probability value; * Significant (p < 0.05); ** Very significant (p < 0.01); *** Very significant (p < 0.001).
Table 5. Results of the validation tests.
Trail123Error ValueAverage Value
Lr/%1.89621.95161.95540.03311.9344
Dr/%3.51223.44833.25210.13553.4042

