Article

Using the Equivalent Material Concept and the Average Strain Energy Density to Analyse the Fracture Behaviour of Structural Materials

1
Laboratory of Materials Science and Engineering, University of Cantabria, E.T.S. de Ingenieros de Caminos, Canales y Puertos, Av/Los Castros 44, 39005 Santander, Spain
2
Fracture Research Laboratory, Faculty of New Science and Technologies, University of Tehran, P.O. Box Tehran 14395-1561, Iran
*
Author to whom correspondence should be addressed.
Appl. Sci. 2020, 10(5), 1601; https://doi.org/10.3390/app10051601
Submission received: 29 January 2020 / Revised: 26 February 2020 / Accepted: 27 February 2020 / Published: 28 February 2020
(This article belongs to the Special Issue New Trends in Fracture Mechanics and Fatigue Design)

Abstract

:

Featured Application

This paper provides an analysis of the applications and limitations of the Equivalent Material Concept-Average Strain Energy Density combined criterion for the assessment of fracture loads in structural materials containing U-notches.

Abstract

This paper provides a complete overview of the applicability of the Equivalent Material Concept in conjunction with the Average Strain Energy Density criterion, to provide predictions of fracture loads in structural materials containing U-notches. The Average Strain Density Criterion (ASED) has a linear-elastic nature, so in principle, it does not provide satisfactory predictions of fracture loads in those materials with nonlinear behaviour. However, the Equivalent Material Concept (EMC) is able to transform a physically nonlinear material into an equivalent linear-elastic one and, therefore, the combination of the ASED criterion with the EMC (EMC–ASED criterion) should provide good predictions of fracture loads in physically nonlinear materials. The EMC–ASED criterion is here applied to different types of materials (polymers, composites and metals) with different grades of nonlinearity, showing the accuracy of the corresponding fracture load predictions and revealing qualitatively the limitations of the methodology. It is shown how the EMC–ASED criterion provides good predictions of fracture loads in nonlinear materials as long as the nonlinear behaviour is mainly limited to the tensile behaviour, and how the accuracy decreases when the nonlinear behaviour is extended to the material behaviour in the presence of defects.

1. Introduction

In the 1970s, Sih [1] presented the Strain Energy Density factor (S) as the product of the Strain Energy Density by a certain distance (from the point of singularity). More recently, Lazzarin and co-authors (e.g., [2,3,4,5]) proposed the Average Strain Energy Density (ASED) criterion as a combination of Sih’s model with the concept of elementary structural volume suggested by Neuber [6]. As stated in [2], the (local) ASED criterion is based on the quantification of the Strain Energy Density averaged over a control volume defined at the notch tip. The ASED approach is based on the idea that failure occurs when the mean value of the elastic strain energy (W) referred to a volume (or an area, in plane problems) is equal to a critical value (Wc) [2], which is a material property. Thus, the ASED criterion is finally a relatively simple failure criterion that may be applied to linear-elastic materials and has been widely validated in a significant number of brittle and quasi-brittle structural materials (e.g., [4,7,8]). Its simplicity is especially evident when using the expressions of W gathered in [5].
Meanwhile, Torabi proposed the Equivalent Material Concept (EMC) [9] to equate a real ductile material (thus, exhibiting elastic-plastic behaviour) with an equivalent (virtual) brittle material displaying elastic behaviour. This proposal allows elastic assessment tools, which are generally simpler, to be applied to nonlinear (ductile) materials. Some examples may be found in the literature, where the EMC is used in combination with the Theory of Critical Distances (TCD, e.g., [10]), the Maximum Tangential Stress criterion (MTS, e.g.,[11]) or the Average Stress Energy Density Criterion (e.g., [12]), among others. The results are promising, with the different resulting combined criteria (EMC–TCD, EMC–MTS and EMC–ASED) providing accurate predictions of fracture loads in different types of materials. Moreover, Torabi has recently proposed the Fictitious Material Concept [13], which has a similar purpose (the use of linear-elastic tools in nonlinear situations) but would seem to be more oriented to materials developing a larger nonlinear behaviour. All this suggests that there are materials which are linear-elastic enough to be analysed without any need for the EMC, there are materials for which the EMC may be used to obtain accurate analyses of fracture processes by using simple linear-elastic tools and, finally, there may be materials for which the use of the EMC is not enough to obviate the nonlinear behaviour of the real material being analysed.
With the aim of providing a full view of the capacities and limitations of the EMC–ASED criterion for the estimation of fracture loads in structural materials containing U-notches, this criterion is applied here to various materials (and hundreds of fracture specimens) with different levels of ductility. Thus, Section 2 describes the materials being analysed and gathers a brief description of the EMC, the ASED criterion and the combined EMC–ASED criterion; Section 3 presents the results provided by the EMC–ASED criterion; Section 4 develops the corresponding discussion; and, finally, Section 5 gathers the main conclusions.

2. Materials and Methods

The EMC–ASED criterion is applied here to a wide range of materials with different levels of nonlinear behavior. All tests were previously completed by the authors and reported in the literature (see the corresponding references), with different purposes than those pursued in this research, but the application of the EMC–ASED criterion analyses is here presented for first time (except for one case, as mentioned below), providing a comprehensive overview of the EMC–ASED potential as a fracture assessment tool. The materials and conditions are as follows:
  • PA6 (Durethan, Lanxess, Germany), see [7,14] for details, with basically linear-elastic behaviour, even in the stress–strain curve of the tensile test, and fully linear behaviour in the presence of defects (for both crack and notch-type defects. SENB specimens). Tensile tests were performed according with [15], whereas fracture tests followed [16]. Both types of tests were completed at 20 ºC, with the thickness and the width being 4 and 10 mm, respectively, in all cases. Before being tested, the specimens were dried in an oven at 100 °C, to avoid any trace of moisture.
  • SGFR-PA6 (Short Glass Fiber Reinforced PA6, see [7,14,15,16] for details), with 5 wt.% of fibre content. The short fibres were oriented in the longitudinal direction of the specimens, had an average length of 300 µm and a diameter of 10 µm, with their tensile strength, elastic modulus and density being 3450 MPa, 72.5 GPa and 2.6 gr/cm3, respectively. This material has a slightly nonlinear tensile curve, with the load–displacement curves of the fracture tests performed on SENB specimens (for both cracked and notched specimens) being fully linear. Again, the tests were completed at 20 °C, with the thickness and the width of the specimens being 4 and 10 mm, respectively. The specimens were also dried in an oven, at 10 °C to avoid any trace of moisture.
  • SGFR-PA6 (Short Glass Fiber Reinforced PA6, see [7,14,15,16] for details), with 50 wt.% of fibre content. In this case, the tensile curve is clearly nonlinear, and the load–displacement curve of the fracture tests performed on SENB specimens is basically linear (fulfilling linear-elastic fracture mechanics conditions). The characteristics of the fibres and the specimens were analogous to those mentioned above.
  • PMMA (see [10,15,16,17] for a wide description of experimental procedure, material properties and critical loads), with moderate nonlinear tensile curve and predominantly linear-elastic curves in notched conditions (with fully linear-elastic behaviour in cracked conditions. SENB specimens). Both tensile and fracture tests were performed at 20 °C in 4 mm thick specimens, with the width being 10 mm.
  • Al7075-T651 (TL orientation) with linear-elastic behaviour in cracked conditions (CT specimens), moderate nonlinear behaviour in tensile behaviour and intermediate situations in the presence of notches. Details (material properties and experimental critical loads) may be found in [12,18], with the proper EMC–ASED criterion being applied in [13]. Tensile and fracture tests were performed by following [19] and [20], respectively. Fracture tests were performed at room temperature, with the width and the thickness of the specimens being 40 and 20 mm, respectively.
  • Steel S275JR at −120 °C, operating within its Lower Shelf region (T0 = −26 °C [21]) and, thus, presenting dominant linear-elastic behaviour in cracked conditions. However, it develops significant nonlinear behaviour in tensile tests. Thus, this material is in an analogous situation of Al7075T651. The basic fracture (CT specimens) and tensile characterisation of this material, and the corresponding experimental critical loads, may be consulted in [8,19,20,22]. The thickness and the width of the fracture specimens were 25 and 50 mm, respectively.
  • Steel S275JR at −50 °C (see [19,20,22] for details on experimental procedures, material properties and critical loads), operating within the Ductile-to-Brittle Transition Zone (DBTZ), below the corresponding Reference Temperature [21] (T0 = −26 °C). The material in such conditions is clearly nonlinear in tensile tests and moderately nonlinear in cracked conditions (CT specimens), with increasing nonlinear behaviour when the notch radius increases. Again, the thickness and the width of the fracture specimens were 25 and 50 mm, respectively. The fracture toughness results in cracked conditions do not fulfil KIC requirements and are qualified as KJc [20].
  • Steel S275JR at −10 °C (see [19,20,22] for details), operating within the Ductile-to-Brittle Transition Zone (DBTZ), above the corresponding Reference Temperature [21] (T0 = −26 °C). The material in such conditions is, again and more noticeably, nonlinear in tensile tests, and moderately nonlinear in cracked conditions (CT specimens). The thickness and the width of the fracture specimens were 25 and 50 mm, respectively. Likewise, the fracture toughness results in cracked conditions do not fulfil KIC requirements and are qualified as KJc [20].
Thus, the materials covered in this analysis include two polymers, one composite with two different contents of reinforcement and two metals with different mechanical behavior (the steel been tested, additionally, at three different temperatures). Some of them are linear-elastic in tensile and fracture conditions (PA6 and SGFR-PA6 5 wt.%); some of them are linear elastic in cracked conditions and have a nonlinear stress–strain tensile curve (SGFR-PA5 50 wt.%, PMMA, Al7075-T651 and S275JR at −120 °C); finally, some of them are nonlinear in both tensile and cracked conditions (S275JR at −10 ºC and −50 ºC), not fulfilling linear-elastic fracture conditions in the fracture tests performed on cracked specimens. Thus, the variety of nonlinearity levels presented by the materials covered in this work represents a significant sample of engineering materials. Except for the Al7075-T651 [12], the EMC–ASED criterion has not been applied by the authors to the materials gathered in this work. Figure 1 shows a schematic of the different situations for the two extreme conditions, tensile tests (stress–strain curves, σ-ε) and fracture tests on cracked specimens (load–displacement curves, P-Δ), with the fracture tests performed in notched conditions having an intermediate behaviour. Table 1 gathers the main material properties and parameters.
Concerning the methods used in the analysis, the latter is based on both the Equivalent Material Concept and the Average Strain Energy Criterion. The Equivalent Material Concept (EMC) (e.g., [9]) assumes the following Hollomon´s power-law equation for the tensile stress–strain relationship in the plastic region:
σ = KεnP
The parameters σ, εP, K, and n are the true stress, the true plastic strain, the strain-hardening coefficient and the strain-hardening exponent, respectively.
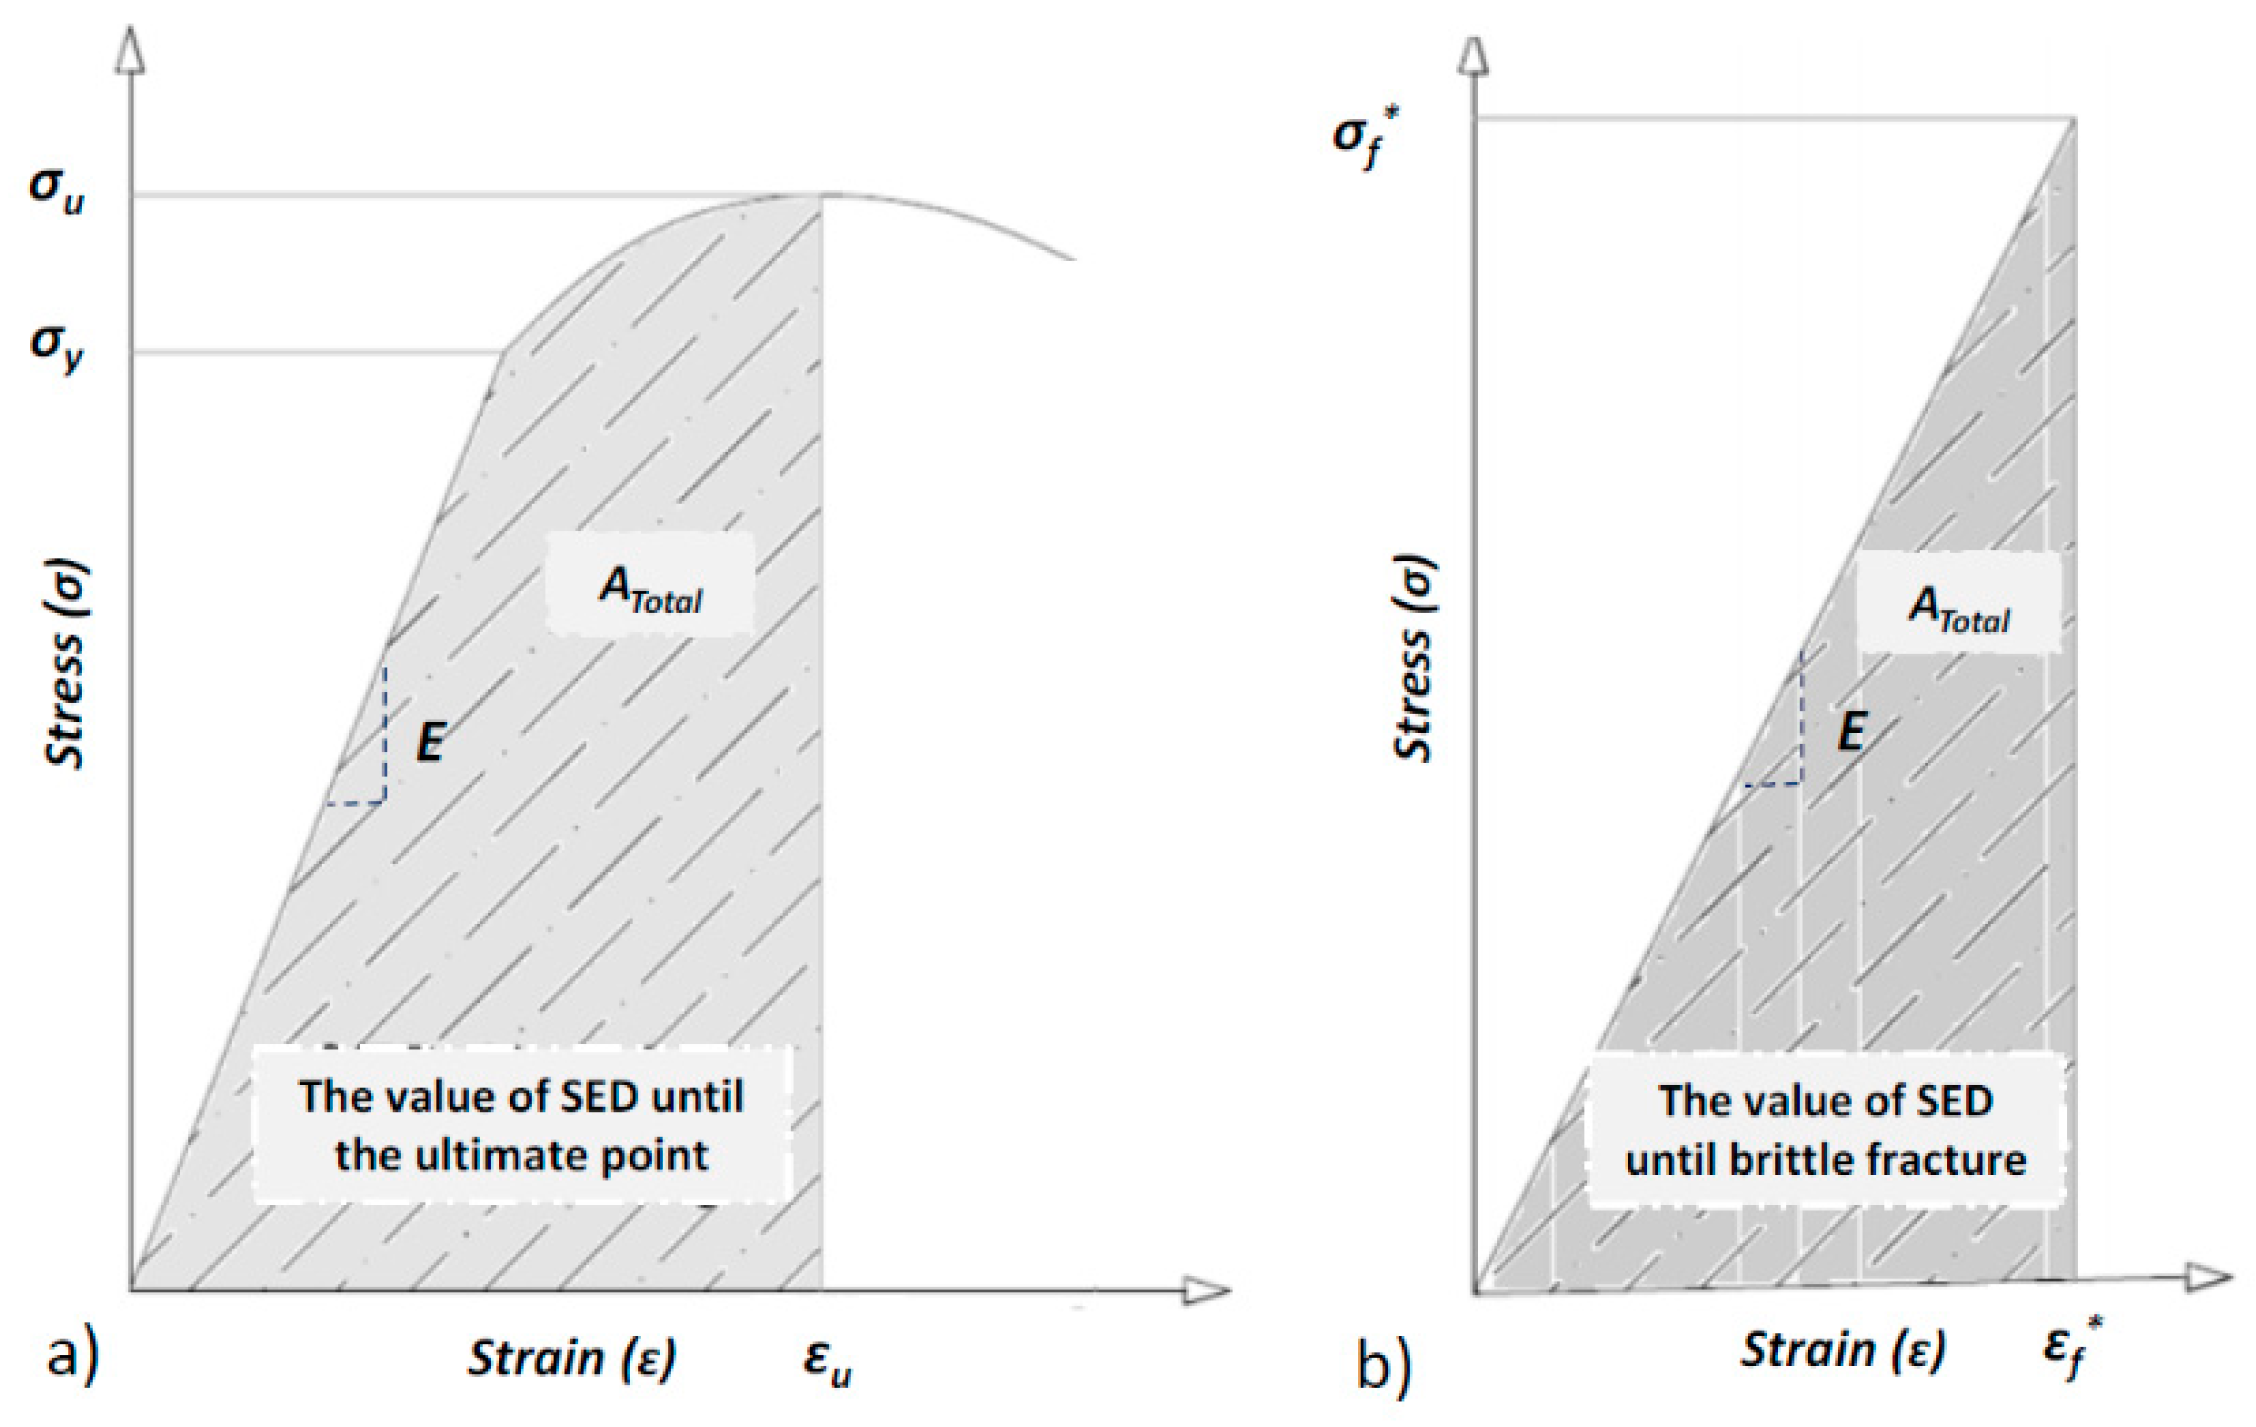
Then, the EMC computes the total strain energy density (SED) for the real ductile material up to the peak point (i.e., the ultimate point) in the stress–strain tensile curve. Finally, it assumes that the equivalent (virtual) brittle material develops the same amount of tensile SED for brittle fracture to take place. These basic assumptions allow the tensile strength of the equivalent material to be computed as a closed-form expression.
The Strain Energy Density (SED) of a ductile material is the area under the curve until the beginning of the necking starts to take place (maximum point of the stress–strain curve; see Figure 2a).
Assuming that the total SED (SEDtot) has an elastic (SEDe) and a plastic component (SEDp), it will follow Equation (2):
SED tot . = SED e + SED p = 1 2 σ Y · ε Y + ε P Y ε P σ · d ε P
with σY, εY and εPY being the yield strength, the elastic strain at yield point and the true plastic strain at yield point, respectively.
By combining Equation (1) and Equation (2), and considering Hooke’s Law at yielding (σY = E·εY), Equation (3) is obtained:
SED tot . = σ Y 2 2 E + ε P Y ε P K ε P n d ε P = σ Y 2 2 E + K n + 1 [ ( ε P ) n + 1 ( ε P Y ) n + 1 ]
Now, assuming that the offset yield point is equal to 0.2% (i.e., εPY=0.002), we get the following:
SED tot . = σ Y 2 2 E + K n + 1 [ ( ε P ) n + 1 ( 0.002 ) n + 1 ]
The crack initiation in the ductile material takes place when the ultimate load is reached. Consequently, SEDtot (the area under the curve) must be calculated at this point (the necking instance). As a result, εP is substituted by εu,True (true plastic strain at maximum load):
SED tot SED necking = σ Y 2 2 E + K n + 1 [ ( ε u , True ) n + 1 ( 0.002 ) n + 1 ]
A common stress–strain curve for the equivalent (virtual) brittle material is shown in Figure 2b. It can be observed that, at fracture, the total SED absorbed by the equivalent material (SEDEM) follows:
SED EM = 1 2 σ f * · ε f *
where σf* and εf* are the tensile stress and the strain at crack initiation for the equivalent brittle material, respectively. Since the main assumption of the EMC is to have the same Young modulus (E) and K-based fracture toughness (Kmat) for both the real ductile material and the equivalent (virtual) brittle material, Equation (6) may be rewritten as follows:
SED EM = σ f * 2 2 E
Now, given that the real material and the equivalent material develop the same SED at fracture, Equations (5) and (7) may be equated:
σ Y 2 2 E + K n + 1 [ ( ε u , True ) n + 1 ( 0.002 ) n + 1 ] = σ f * 2 2 E
Finally, Equation (9) is proposed by the EMC for calculating the σf*:
σ f * = σ Y 2 + 2 EK n + 1 [ ( ε u , True ) n + 1 ( 0.002 ) n + 1 ]
where εu,True (the true plastic strain at peak point) can be easily calculated from the corresponding engineering plastic strain (εu), using the following expression:
ε u , True = ln ( 1 + ε u )
With respect to the ASED approach [2,3,4,5], it establishes that, under mode I loading, fracture takes place when the average value of the SED (Wavg) over a certain control volume (defined by radius R0 [5]; see Figure 3) reaches a critical value (Wc):
Wavg = Wc
where Wc depends on the material and, in principle, can be estimated by using Equation (12):
W c = σ u 2 2 E
with σu being the ultimate tensile strength and E being the Young´s modulus. Under plane strain conditions, R0 may be estimated by using Equation (13) [2,23]:
R 0 = ( 1 + ν ) ( 5 8 ν ) 4 π · ( K mat / σ u ) 2
When plane stress conditions are dominant, R0 follows Equation (14):
R 0 = ( 5 3 ν ) 4 π · ( K mat / σ u ) 2
Lazzarin and Berto [4] have derived a useful, straightforward analytical expression for the ASED referred to the control volume:
W a v g = F ( 2 α ) H ( 2 α , R 0 ρ ) σ max 2 E
where F(2α) is a function that depends on the notch opening angle (α) whose values are gathered in [4]. Here, it is sufficient to say that for U-shaped notches (2α=0º) F is equal to 0.785. Moreover, H is another function depending on notch geometry (opening angle and notch radius) and material properties (fracture toughness, ultimate tensile strength and Poisson´s ratio), which may be easily obtained from the look-up tables gathered in [4].
This basic formulation allows the analysis of fracture processes in notched components to be performed by a direct comparison of the critical value of the ASED, provided by Equation (12), with the mean value of this ASED within the control volume, provided by Equation (15). The criterion is, in any case, limited to linear-elastic materials, as its main hypotheses assume that the material being analysed has a linear-elastic behaviour.
Finally, the EMC–ASED criterion arises as an engineering tool for the fracture assessment of non-fully linear materials. In such cases, once the values of the EMC parameters are obtained, and given that the equivalent material has a perfect linear elastic behaviour, the value of the critical strain energy density, Wc, can be calculated by substituting the value of σu by the value of σf* in Equation (12). This, considering Equations (11) and (15), leads to the EMC–ASED criterion:
F ( 2 α ) H ( 2 α , R 0 ρ ) σ max 2 E = σ f * 2 2 E
Equation (16) allows the maximum stress at the notch tip (σmax) to be obtained.
Now, for the case being analysed (U-shaped notches), the Creager–Paris stress distribution [24] can be considered to obtain the stress intensity factor at failure (KI, failure):
σ ( r = 0 ) = σ max = 2 K I , failure π ρ
Finally, considering the type of specimens being used in the analysis (see below), the corresponding estimations of the critical loads (PEMC–ASED) may be obtained from Equations (18) and (19) for the SENB and CT specimens, respectively [25]:
K I , failure = P EMC ASED B W 1 / 2 6 ( a / W ) 1 / 2 1.99 ( a / W ) ( 1 a / W ) ( 2.15 3.93 ( a / W ) + 2.7 ( a / W ) 2 ) ( 1 + 2 ( a / W ) ) ( 1 a / W ) 3 / 2
K I , failure = P EMC ASED B W 1 / 2 2 + a W ( 1 a / W ) 3 / 2 ( 0.886 + 4.64 ( a / W ) 13.32 ( a / W ) 2 + 14.72 ( a / W ) 3 5.60 ( a / W ) 4 )

3. Results

Section 2 provides the different references [7,10,14,17,18,22] where the experimental fracture loads for the different materials and notch radii being analyzed may be found. There are several hundreds of tests and, for the sake of simplicity, only the average values for each particular combination of material and notch radius are gathered here.
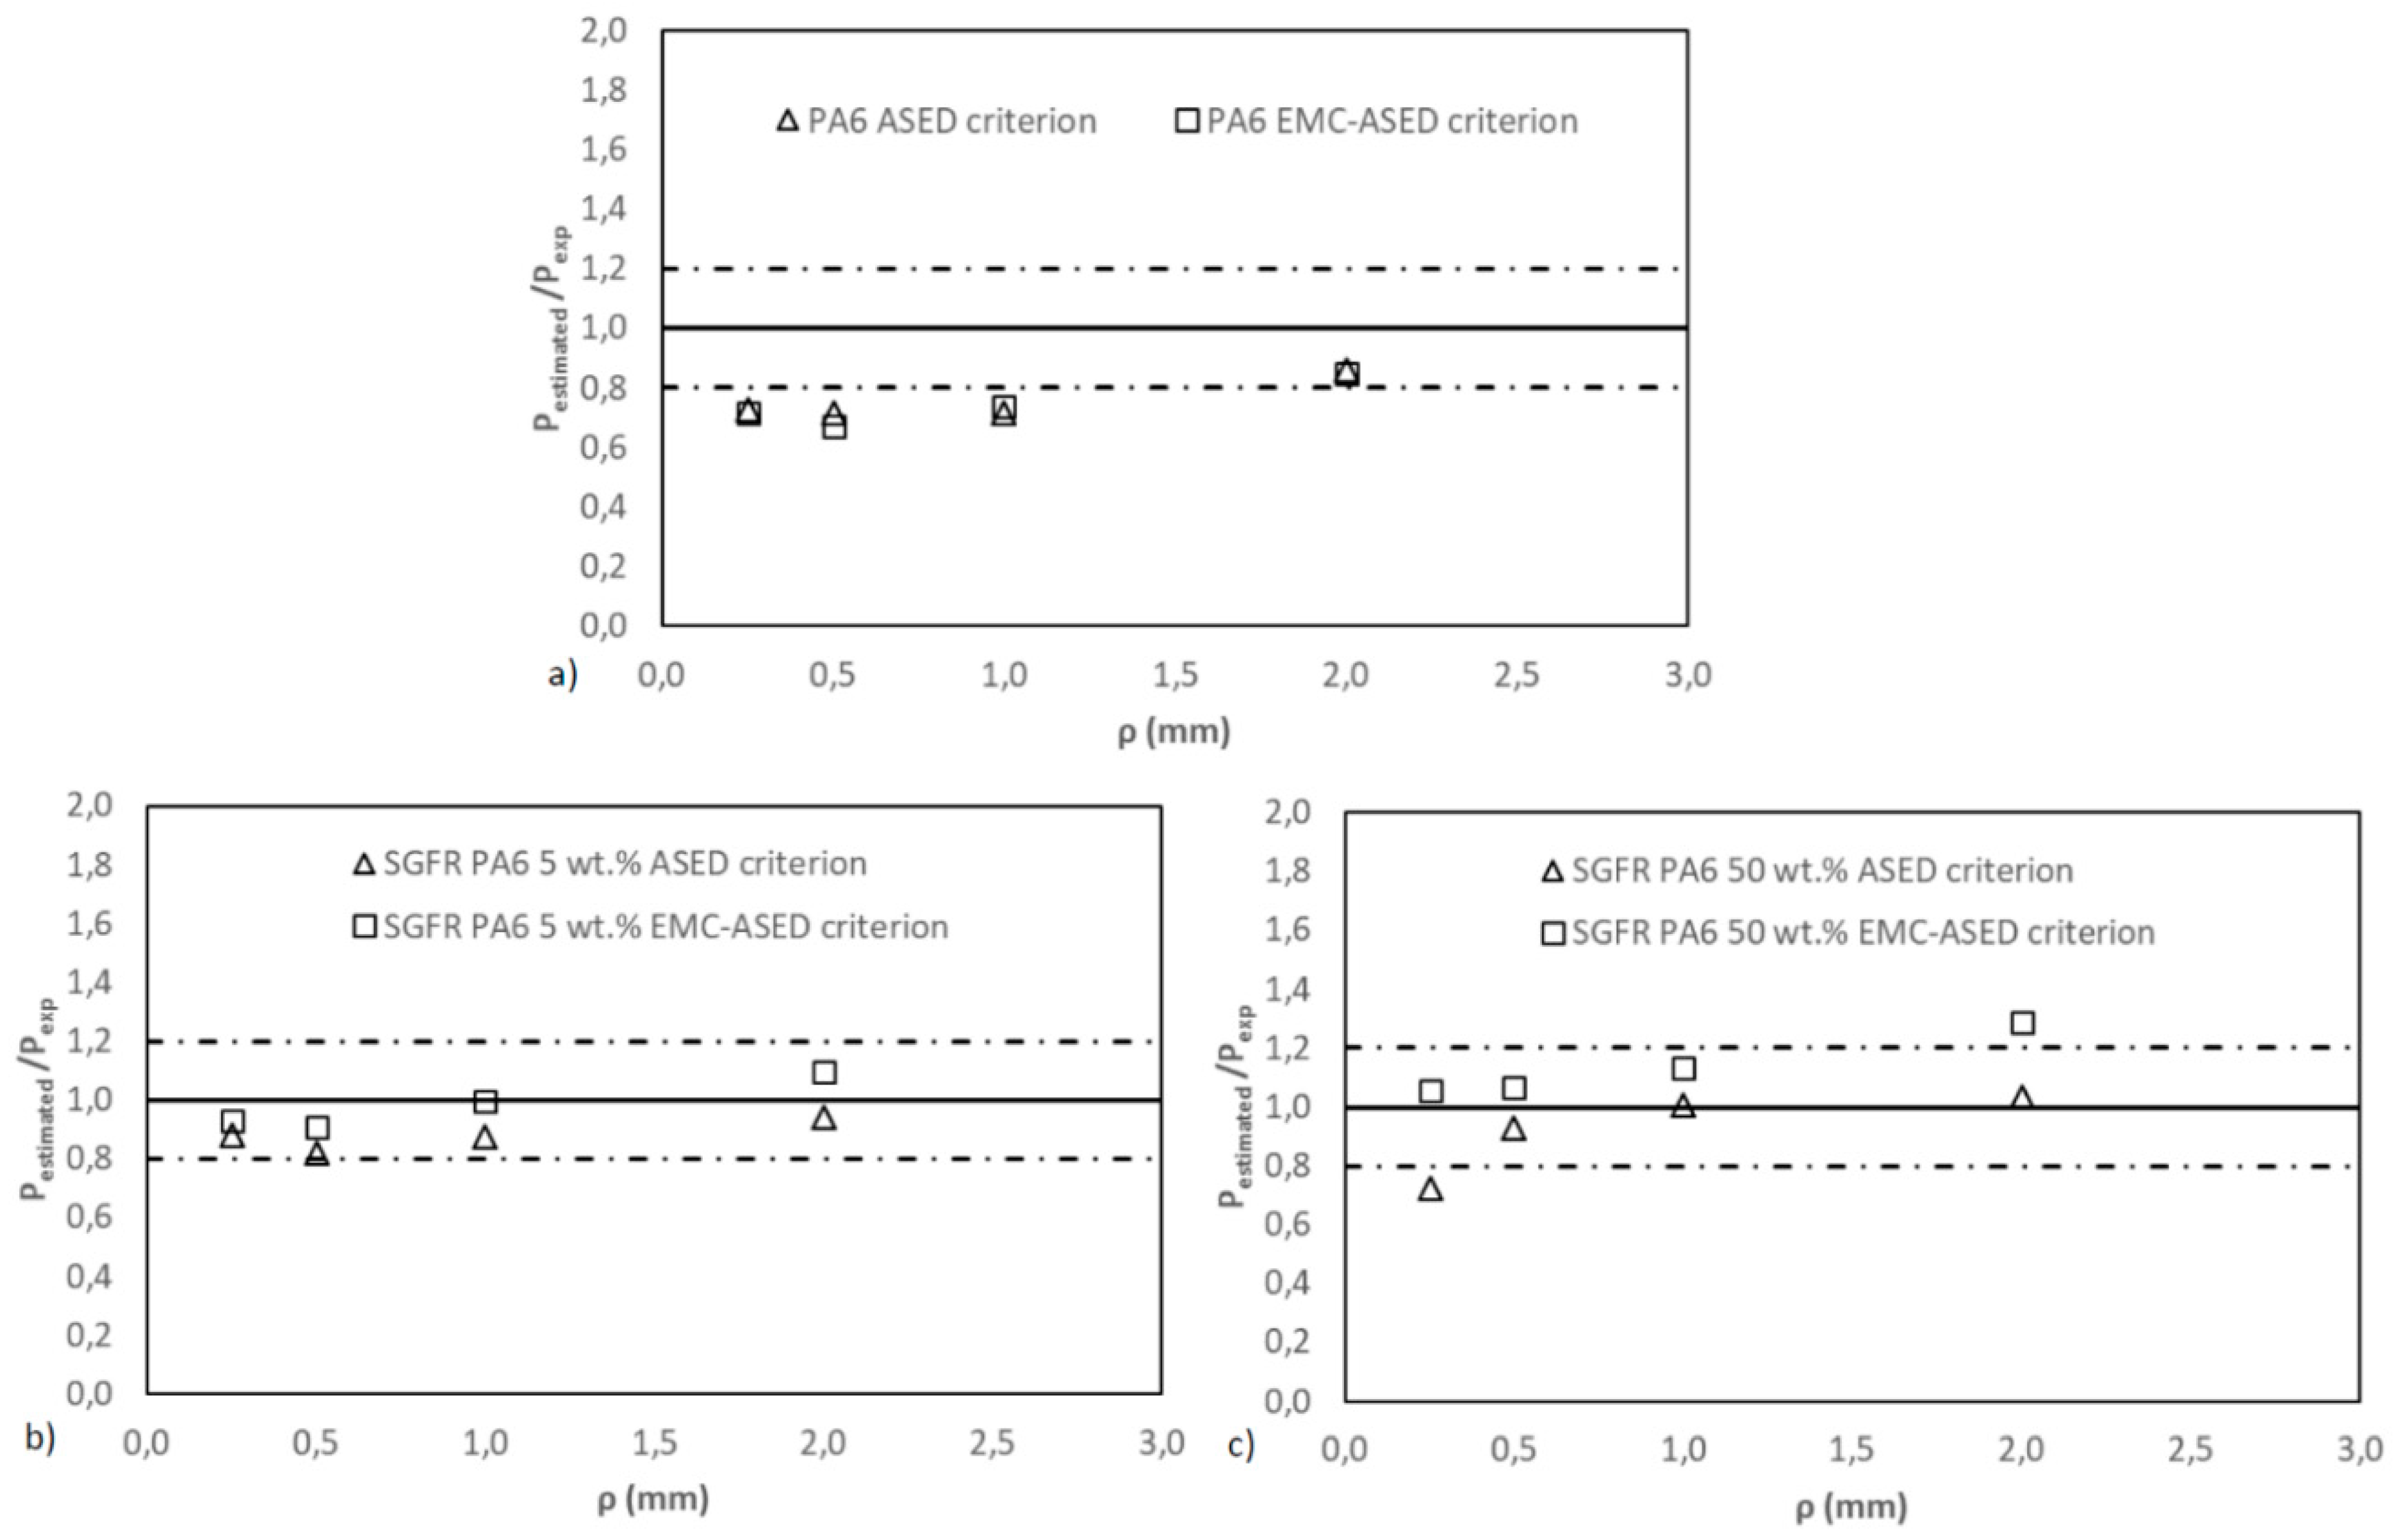
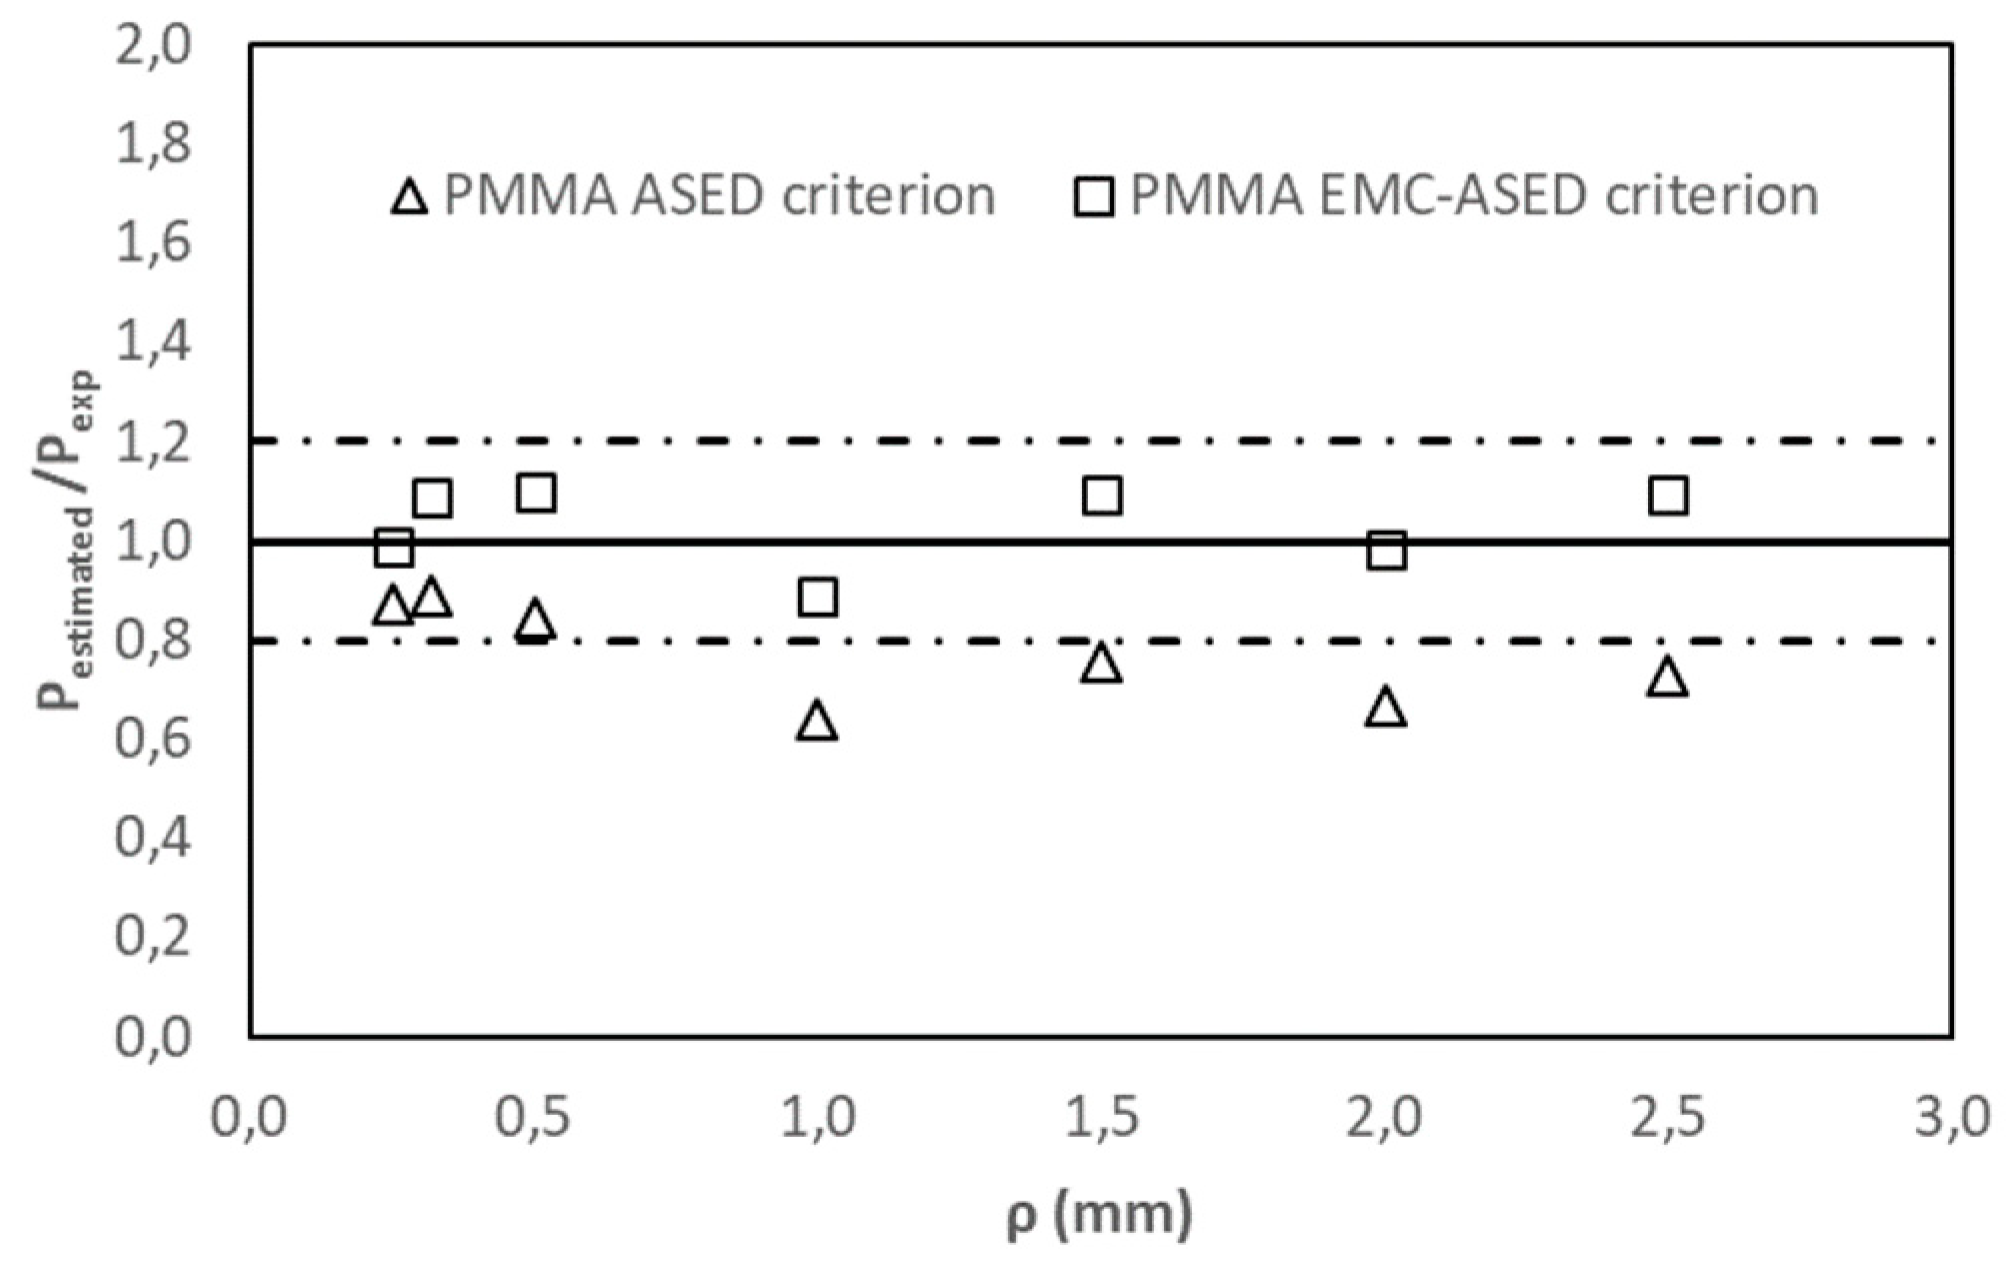
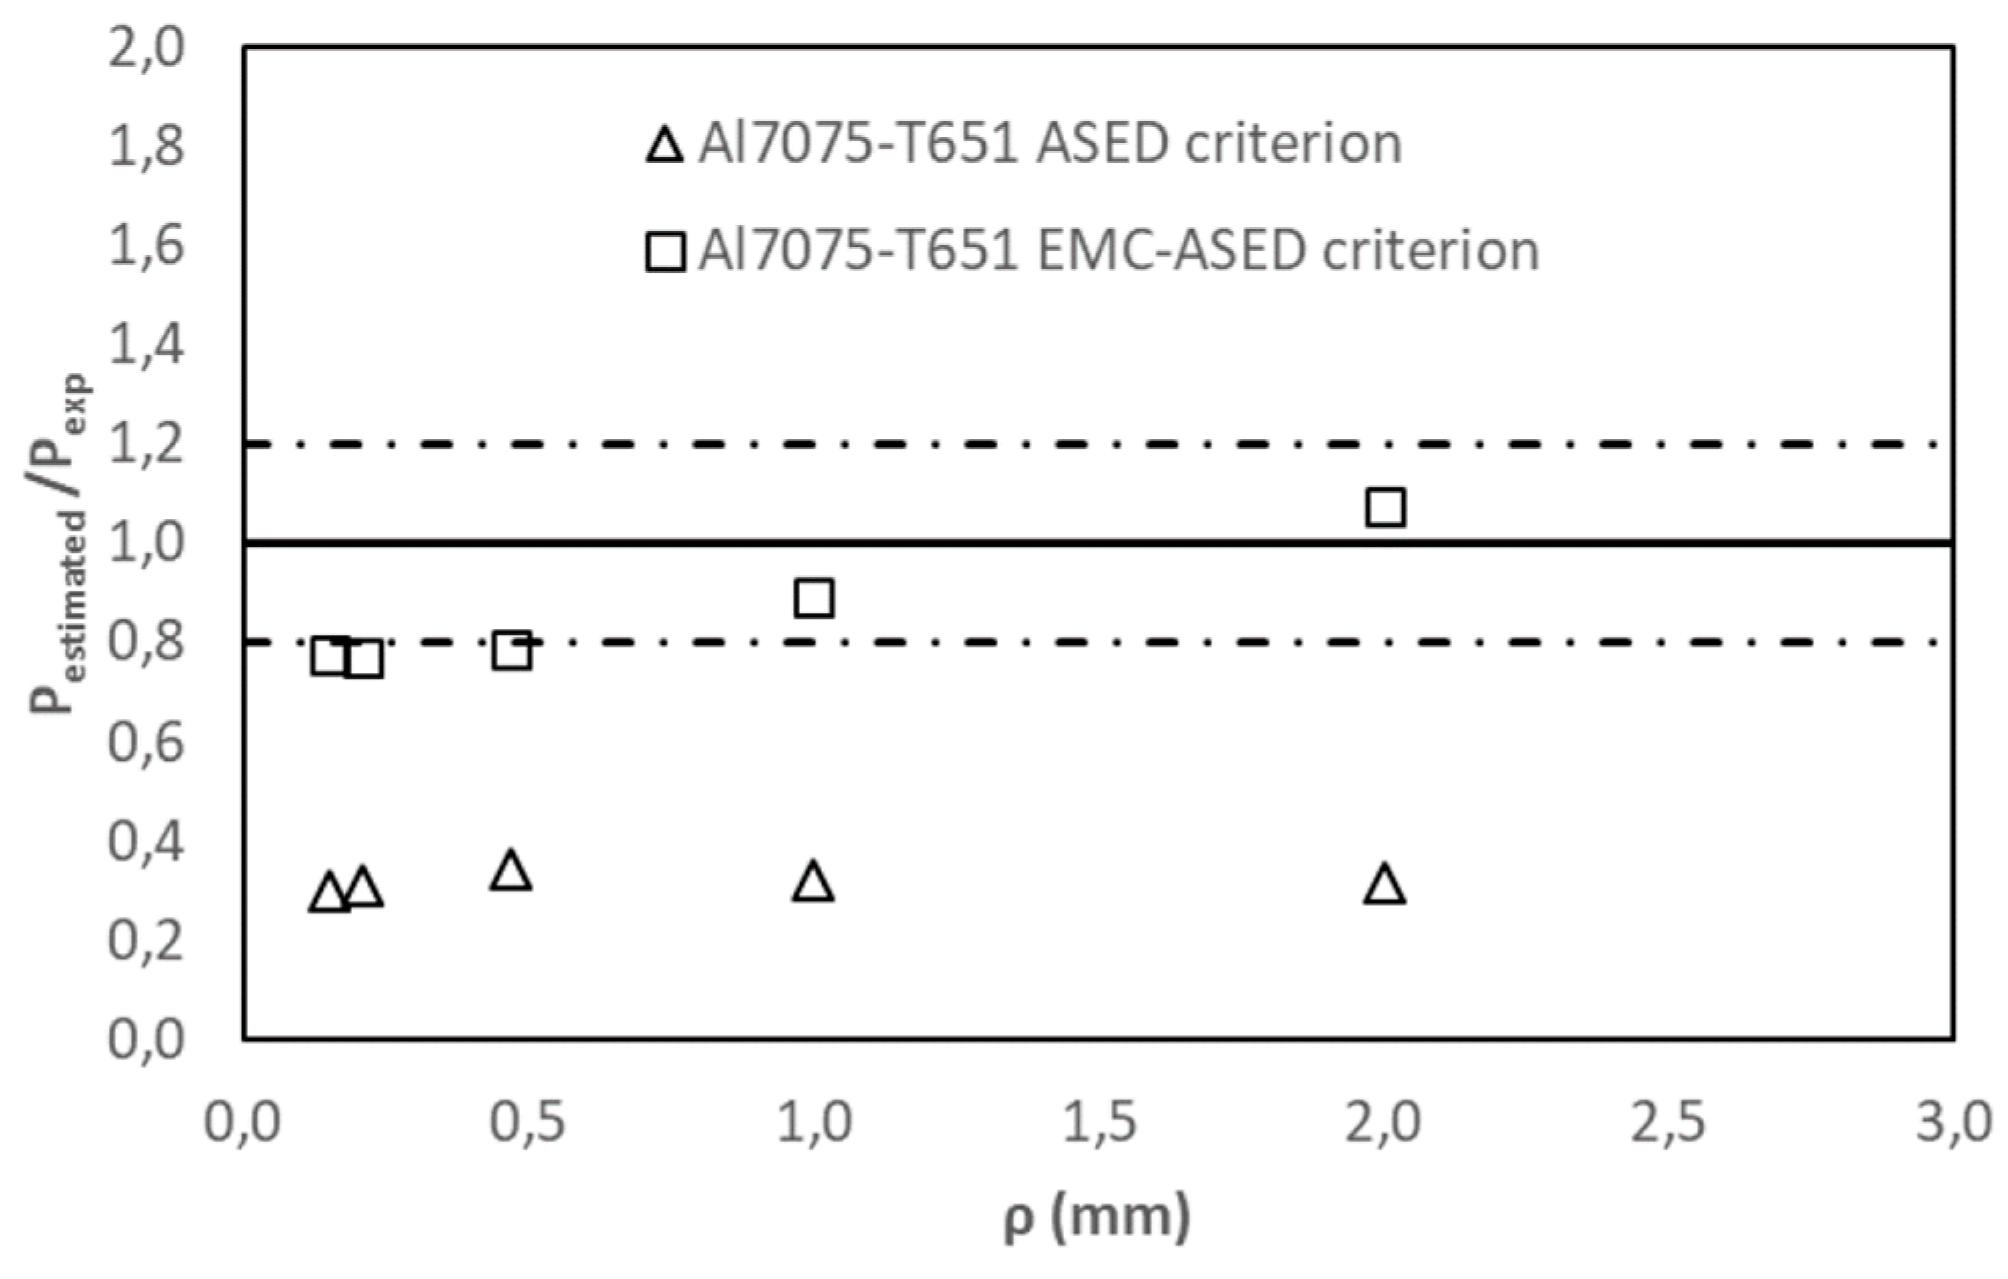
Figure 4, Figure 5, Figure 6 and Figure 7 show the comparison of the fracture load predictions with the (average) experimental fracture loads (Pexp). As mentioned above, the only difference between the two estimations is the value of the ultimate tensile strength: the real ultimate tensile strength (σu) in the ASED criterion and the calibrated σf* in the EMC–ASED criterion. Table 2 provides the specific estimations of the fracture loads obtained through the application of both the ASED (PASED) and the EMC–ASED (PEMC–ASED) criteria.

4. Discussion

The results obtained in PA6 (Figure 4a) are very similar when applying the ASED and the EMC–ASED criteria, given that the material tensile curve is almost linear elastic and σf* is slightly higher than σu. In any case, it corresponds to a situation where these energetic criteria do not provide fully satisfactory results, with an accuracy level around 75%. The predictions are, in any case, conservative.
Concerning the SGFR PA6 (Figure 4b,c), the predictions provided by the EMC–ASED criterion are moderately different to those provided by the ASED criterion. This is caused by the (moderate) nonlinearity of the corresponding tensile curves. In the case of SGFR PA6 5 wt.%, the EMC–ASED criterion improves the predictions provided by the ASED criterion, increasing the average accuracy from 86.3% to 96.7%, whereas in the case of SGFR PA6 50 wt.%, the accuracy goes from 92.0% up to 113.5%. The latter case provides acceptable predictions in both cases (considering the inherent scatter obtained experimentally), but the ASED criterion provides more accurate conservative results. The reason for this situation is the results obtained for larger radii, whose corresponding load–displacement curves present nonlinear behaviour [7] in SGFR PA6 50 wt.%, and fully linear in SGFR PA6 5 wt.%. Such nonlinearity generates a loss of accuracy, given that the EMC corrects the nonlinear behaviour of the tensile stress–strain curve, but it does not correct the nonlinear behaviour (if any) of the fracture behaviour.
The analysis of PMMA is shown in Figure 5. A clear improvement can be observed in the accuracy of the predictions, which increases from 77.0% (ASED criterion) up to 103.4% (EMC–ASED criterion). This is a clear case of applicability of the EMC–ASED criterion, given that it is a material presenting a nonlinear tensile curve (whose nonlinearity may be corrected by the EMC), and linear-elastic load–displacement curves in the fracture tests (although a slight nonlinear behaviour may be observed in the curves for ρ = 2.0 mm and ρ = 2.5 mm) [17].
Figure 6 presents the results obtained in Al7075-T651. This material presents a clear nonlinear behaviour in the tensile test (with the strain under maximum load, εmax, being 9.90%), linear-elastic load–displacement curves in the fracture tests for notch radii up to 0.47 mm, and a certain nonlinear behaviour for larger radii (1.0 and 2.0 mm) [18]. The evident nonlinear tensile curve generates very poor predictions of the ASED criterion, with the average value being 31.9%. However, the application of the EMC–ASED criterion provides accurate conservative results (86.0% of accuracy).
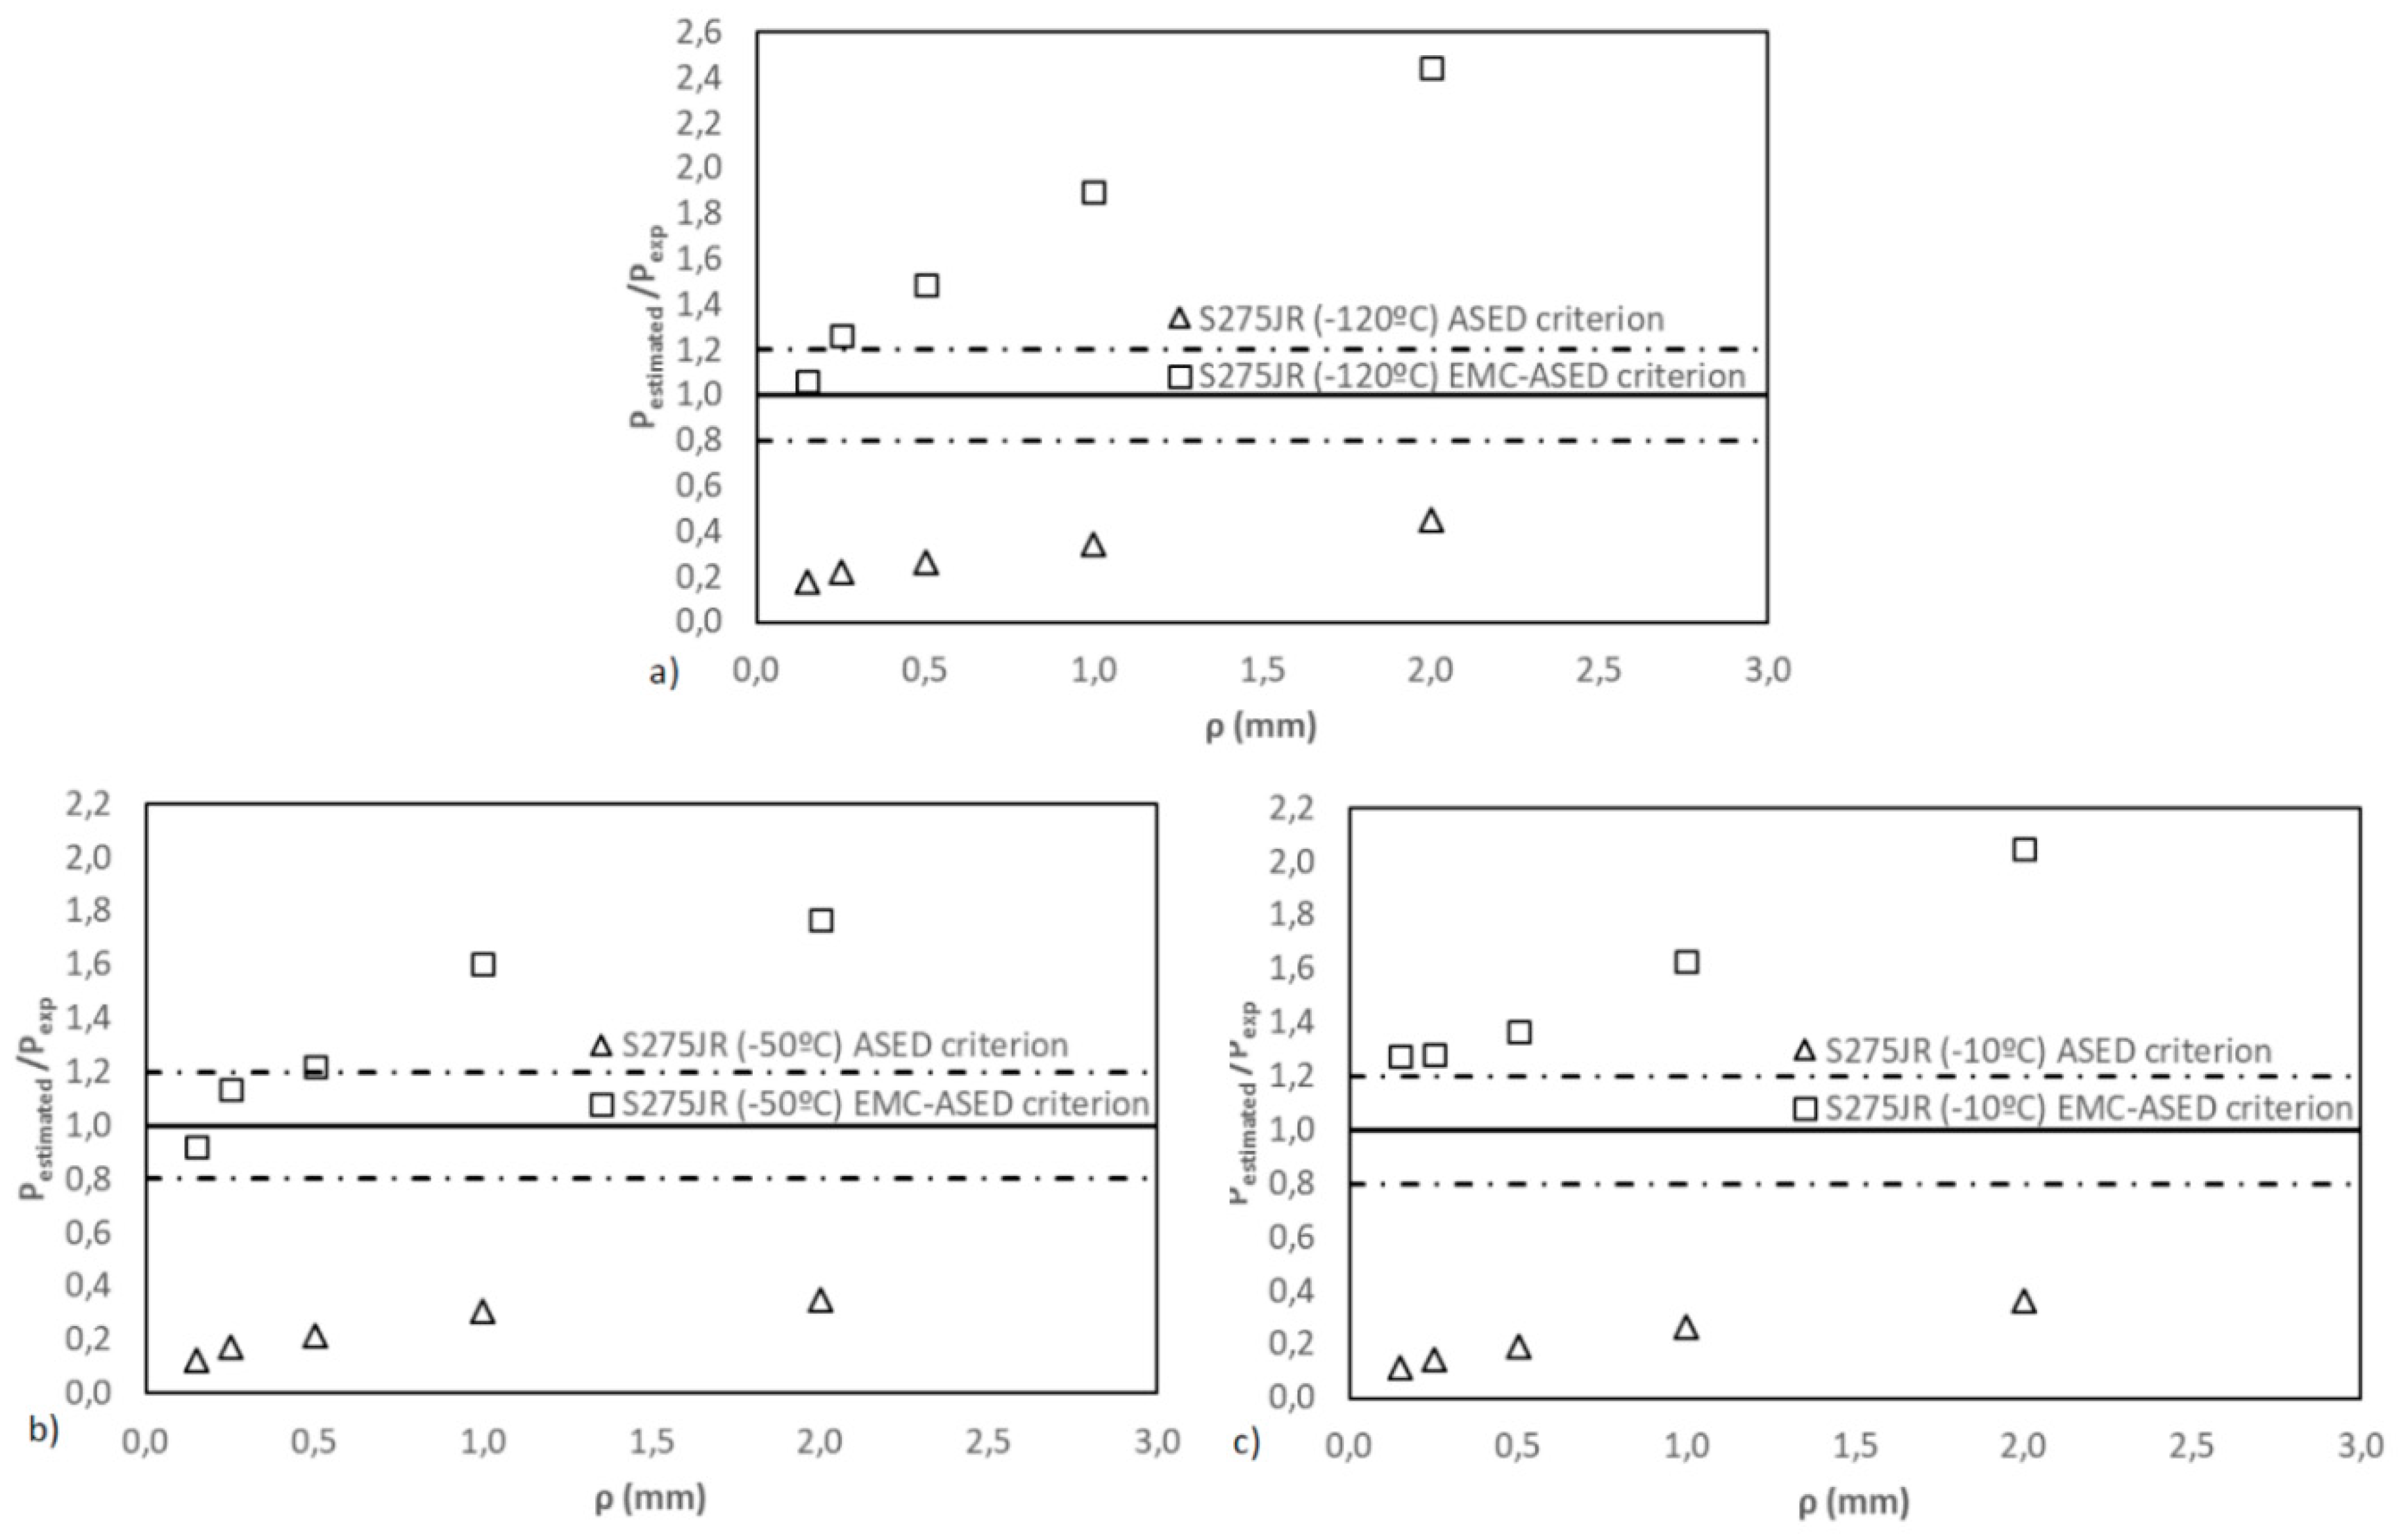
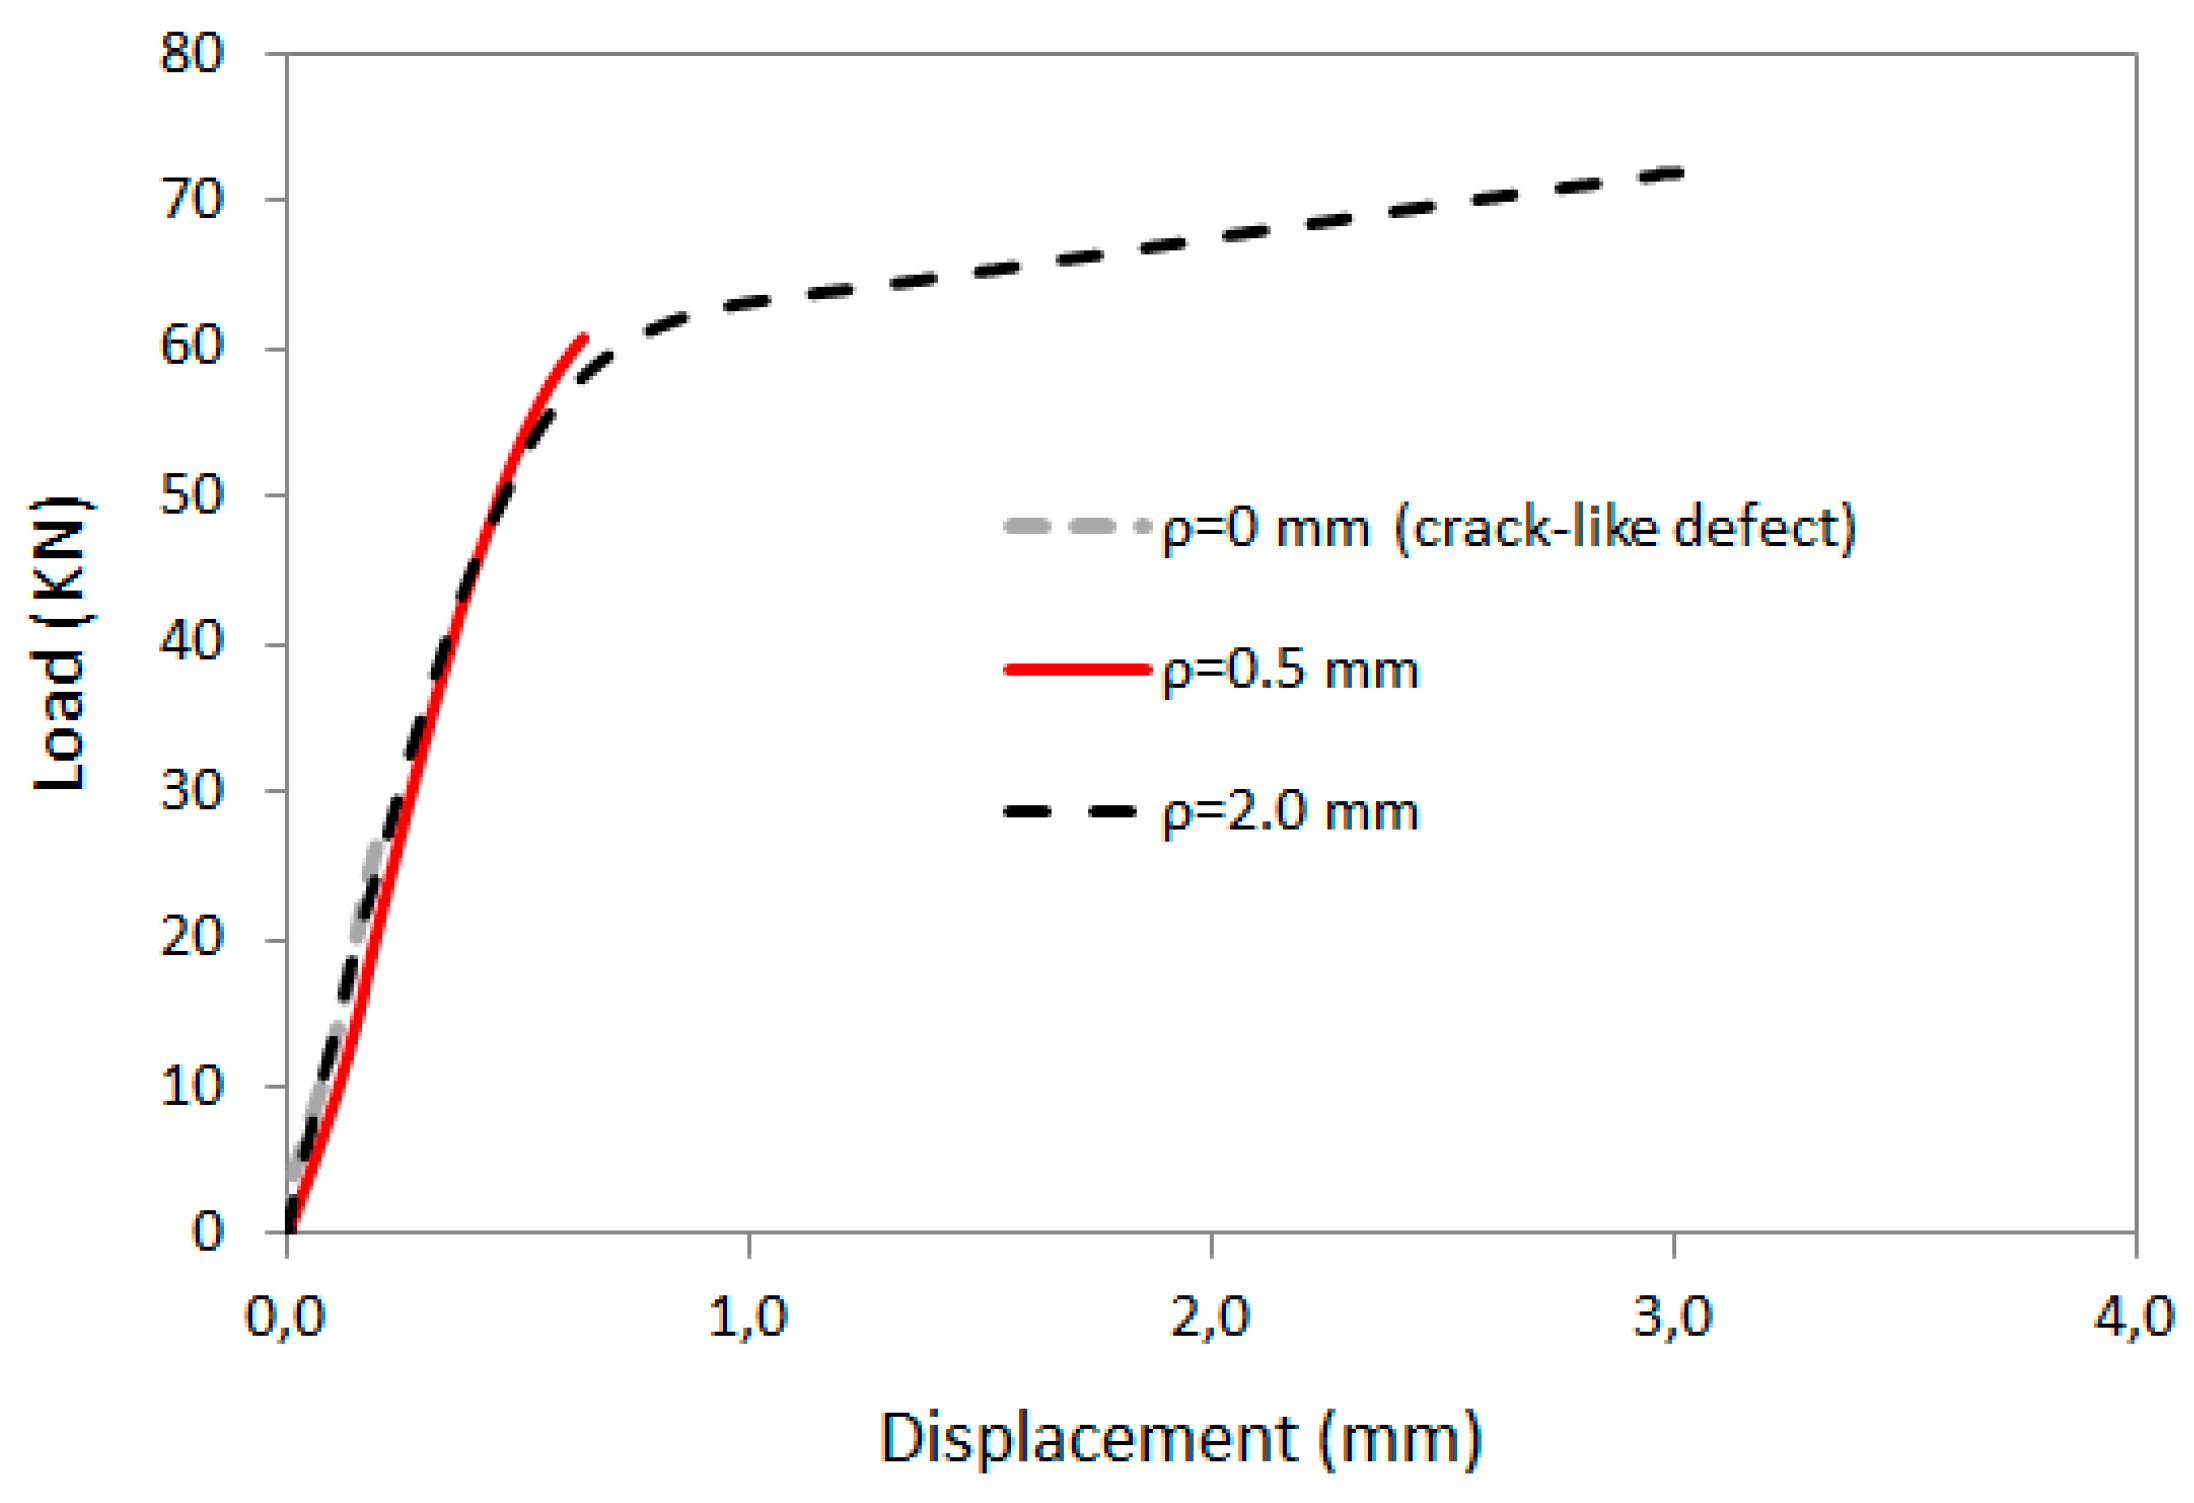
Finally, Figure 7 shows the results obtained in steel S275JR. A similar tendency can be observed in the three temperatures being analysed, with very poor predictions of the ASED criterion (caused by the nonlinear tensile curve in the three situations [22]), and clear overestimations of the fracture loads when applying the EMC–ASED criterion. This is something reasonable for working temperatures of −50 and −10 ℃, both belonging to the DBTZ and, thus, developing elastoplastic behaviour even in cracked conditions (which is not corrected when applying the EMC). However, in principle, the EMC–ASED criterion should provide good results in this material at −120 ℃, given that the corresponding tensile curve is nonlinear, but its working temperature (and fracture behaviour) corresponds to the material Lower Shelf, with brittle, almost fully linear-elastic behaviour. The reason why the predictions are not good can be observed in Figure 8: Although the behaviour is linear-elastic in cracked conditions, this material at this particular working temperature has a very pronounced notch effect in the development of nonlinear conduct. Thus, for small-notch radii (e.g., 0.15 mm), with limited nonlinearity, the predictions are good, but as the notch radius grows, the predictions lose accuracy.
With all this, it can be stated that the EMC–ASED criterion provides good predictions of fracture loads, improving the results of the ASED criterion, in those materials that present nonlinear behaviour in the tensile test and keep the linear-elastic behaviour of the fracture tests. When the behaviour in both kind of tests is linear elastic, the ASED criterion is sufficient and there is no need to use the EMC. Finally, when the fracture conditions are developed with significant nonlinear behaviour, the EMC–ASED criterion is not able to provide accurate fracture load predictions. This situation may arise from cracked conditions or from a given notch radius, above which the fracture process becomes predominantly nonlinear. In the latter case, the EMC–ASED criterion would provide good predictions as long as such a given radius is not reached, but once it is exceeded, the fracture analysis of notched materials using the ASED criterion would require its combination with other tools different from the EMC. Some possibilities could be new formulations or forms for the EMC [26], the modified EMC (MEMC) [27] or the Fictitious Material Concept (FMC) [13].

5. Conclusions

This paper has completed a comprehensive application of the EMC–ASED criterion for the analysis of structural materials containing notches, revealing its applicability and its limitations. More precisely, the criterion has been applied to polymers, composites and metals containing U-shaped notches, with notch radii varying from 0 mm (crack-like defects) up to 2.0–2.5 mm, depending on the material being analysed.
It has been shown how the EMC–ASED criterion provides good predictions of fracture loads in those situations where the material has nonlinear tensile behaviour but retains a dominant linear-elastic behaviour in fracture conditions. Under such conditions, the simple application of the ASED criterion does not provide sufficient accuracy, and the EMC–ASED criterion finds its main application.
On the contrary, when the fracture conditions become nonlinear, the EMC is not able to correct the material nonlinearity, and the EMC–ASED criterion does not provide accurate predictions of fracture loads. Moreover, if the behaviour is fully linear elastic in both tensile and fracture conditions, the EMC–ASED criterion is basically coincident with the ASED criterion and, thus, the latter may be directly applied.

Author Contributions

Conceptualization, S.C. and A.R.T.; methodology, S.C., J.D.F. and A.R.T.; validation, S.C. and J.D.F.; investigation, S.C., J.D.F. and A.R.T.; resources, S.C.; writing—original draft preparation, S.C.; writing—review and editing, S.C., J.D.F. and A.R.T.; All authors have read and agreed to the published version of the manuscript.

Funding

This research was funded by the Spanish Ministry of Science, Innovation and Universities, grant number PGC2018-095400-B-I00 (MCIU/AEI/FEDER, UE).

Conflicts of Interest

The authors declare no conflict of interest.

References

  1. Sih, G.C. Strain-energy-density factor applied to mixed mode crack problems. Int. J. Fract. 1974, 10, 305–321. [Google Scholar] [CrossRef]
  2. Lazzarin, P.; Zambardi, R. A finite-volume-energy based approach to predict the static and fatigue behavior of components with sharp V-Shaped notches. Int. J. Fract. 2001, 112, 275–298. [Google Scholar] [CrossRef]
  3. Berto, F.; Lazzarin, P. A review of the volume-based strain energy density approach applied to V-noches and welded structures. Theor. App. Fract. Mech. 2009, 52, 183–194. [Google Scholar] [CrossRef]
  4. Berto, F.; Lazzarin, P. Recent developments in brittle and quasi-brittle failure assessment of engineering materials by means of local approaches. Mater. Sci. Eng. R Rep. 2014, 75, 1–48. [Google Scholar] [CrossRef]
  5. Lazzarin, P.; Berto, F. Some expressions for the strain energy in a finite volume surrounding the root of blunt V-notches. Int. J. Fract 2005, 135, 161–185. [Google Scholar] [CrossRef]
  6. Neuber, H. Theory of Notch Stresses; Springer-Verlag: Berlin, Germany, 1958. [Google Scholar]
  7. Ibáñez-Gutiérrez, F.T.; Cicero, S.; Madrazo, V.; Berto, F. Fracture loads prediction on notched short glass fibre reinforced polyamide 6 using the Strain Energy Density. Phys. Mesomech. 2018, 21, 165–172. [Google Scholar] [CrossRef]
  8. Cicero, S.; Berto, F.; Ibáñez-Gutiérrez, F.T.; Procopio, I.; Madrazo, V. SED criterion estimations of fracture loads in structural steels operating at lower shelf temperatures and containing u-notches. Theor. App. Fract. Mech. 2017, 90, 234–243. [Google Scholar] [CrossRef]
  9. Torabi, A.R. Estimation of tensile load-bearing capacity of ductile metallic materials weakened by a V-notch: The equivalent material concept. Mater. Sci. Eng. A. 2012, 536, 249–255. [Google Scholar] [CrossRef]
  10. Cicero, S.; Torabi, A.R.; Madrazo, V.; Azizi, P. Prediction of fracture loads in PMMA U-notched specimens using the Equivalent Material Concept and the theory of critical distances combined criterion. Fatigue Fract. Eng. Mater. Struct. 2018, 41, 688–699. [Google Scholar] [CrossRef]
  11. Torabi, A.R.; Rahimi, A.S.; Ayatollahi, M.R. Elastic-plastic fracture assessment of CNT-reinforced epoxy/nanocomposite specimens weakened by U-shaped notches under mixed mode loading. Comp. Part B: Eng. 2019, 176, 107114. [Google Scholar] [CrossRef]
  12. Fuentes, J.D.; Cicero, S.; Berto, F.; Torabi, A.R.; Madrazo, V.; Azizi, P. Estimation of Fracture Loads in AL7075-T651 Notched Specimens Using the Equivalent Material Concept Combined with the Strain Energy Density Criterion and with the Theory of Critical Distances. Metals 2018, 8, 87. [Google Scholar] [CrossRef] [Green Version]
  13. Torabi, A.R.; Kamyab, M. The Fictitious Material Concept. Eng. Fract. Mech. 2019, 209, 17–31. [Google Scholar] [CrossRef]
  14. Ibáñez-Gutiérrez, F.T.; Cicero, S.; Carrascal, I.A.; Procopio, I. Effect of fibre content and notch radius in the fracture behaviour of short glass fibre reinforced polyamide 6: An approach from the Theory of Critical Distances. Comp. Part B Eng. 2016, 94, 299–311. [Google Scholar] [CrossRef]
  15. ASTM D638-10. Standard Test Method for Tensile Properties of Plastics; American Society for Testing and Materials: Philadelphia, PA, USA, 2010. [Google Scholar]
  16. ASTM D5045-99. Standard Test Methods for Plane-Strain Fracture Toughness and Strain Energy Release Rate of Plastic Materials; American Society for Testing and Materials: Philadelphia, PA, USA, 2007. [Google Scholar]
  17. Cicero, S.; Madrazo, V.; Carrascal, I.A. Analysis of notch effect in PMMA using the Theory of Critical Distances. Eng. Fract. Mech. 2012, 86, 56–72. [Google Scholar] [CrossRef]
  18. Madrazo, V.; Cicero, S.; Carrascal, I.A. On the Point Method and the Line Method notch effect predictions in Al7075-T651. Eng. Fract. Mech. 2012, 79, 363–379. [Google Scholar] [CrossRef]
  19. ASTM E8/E8M-09. Standard Test Method for Tension Testing of Metallic Materials; American Society of Testing and Materials: Philadelphia, USA, 2018. [Google Scholar]
  20. ASTM E1820-091. Standard Test Method for Measurement of Fracture Toughness; American Society of Testing and Materials: Philadelphia, PA, USA, 2009. [Google Scholar]
  21. ASTM E1921-05. Standard Test Method for Determination of Reference Temperature, T0. for Ferritic Steels in the Transition Range; American Society for Testing and Materials: Philadelphia, PA, USA, 2005. [Google Scholar]
  22. Cicero, S.; García, T.; Madrazo, V.; Carrascal, I.A.; Ruiz, E. Analysis of notch effect in load bearing capacity, apparent fracture toughness and fracture micromechanisms of ferritic–pearlitic steels. Eng. Fail. Anal. 2014, 44, 250–271. [Google Scholar] [CrossRef] [Green Version]
  23. Yosibash, Z.; Bussiba, A.R.; Gilad, I. Fracture criteria for brittle elastic materials. Int. J. Fract. 2004, 125, 47–64. [Google Scholar] [CrossRef]
  24. Creager, M.; Paris, P.C. Elastic Field Equations for Blunt Cracks with Reference to Stress Corrosion Cracking. Int. J. Fract. 1967, 3, 247–252. [Google Scholar] [CrossRef]
  25. Anderson, T.L. Fracture Mechanics: Fundamentals and Applications, 3rd ed.; CRC Press: Boca Raton, FL, USA, 2005. [Google Scholar]
  26. Torabi, A.R. Tensile failure in blunt V-notched ductile members: A new formulation of the Equivalent Material Concept. Eng. Fract. Mech. 2017, 184, 1–13. [Google Scholar] [CrossRef]
  27. Torabi, A.R.; Kamyab, M. Notch ductile failure with significant strain-hardening: The modified equivalent material concept. Fatigue Fract. Eng. Mater. Struct. 2019, 42, 439–453. [Google Scholar] [CrossRef]
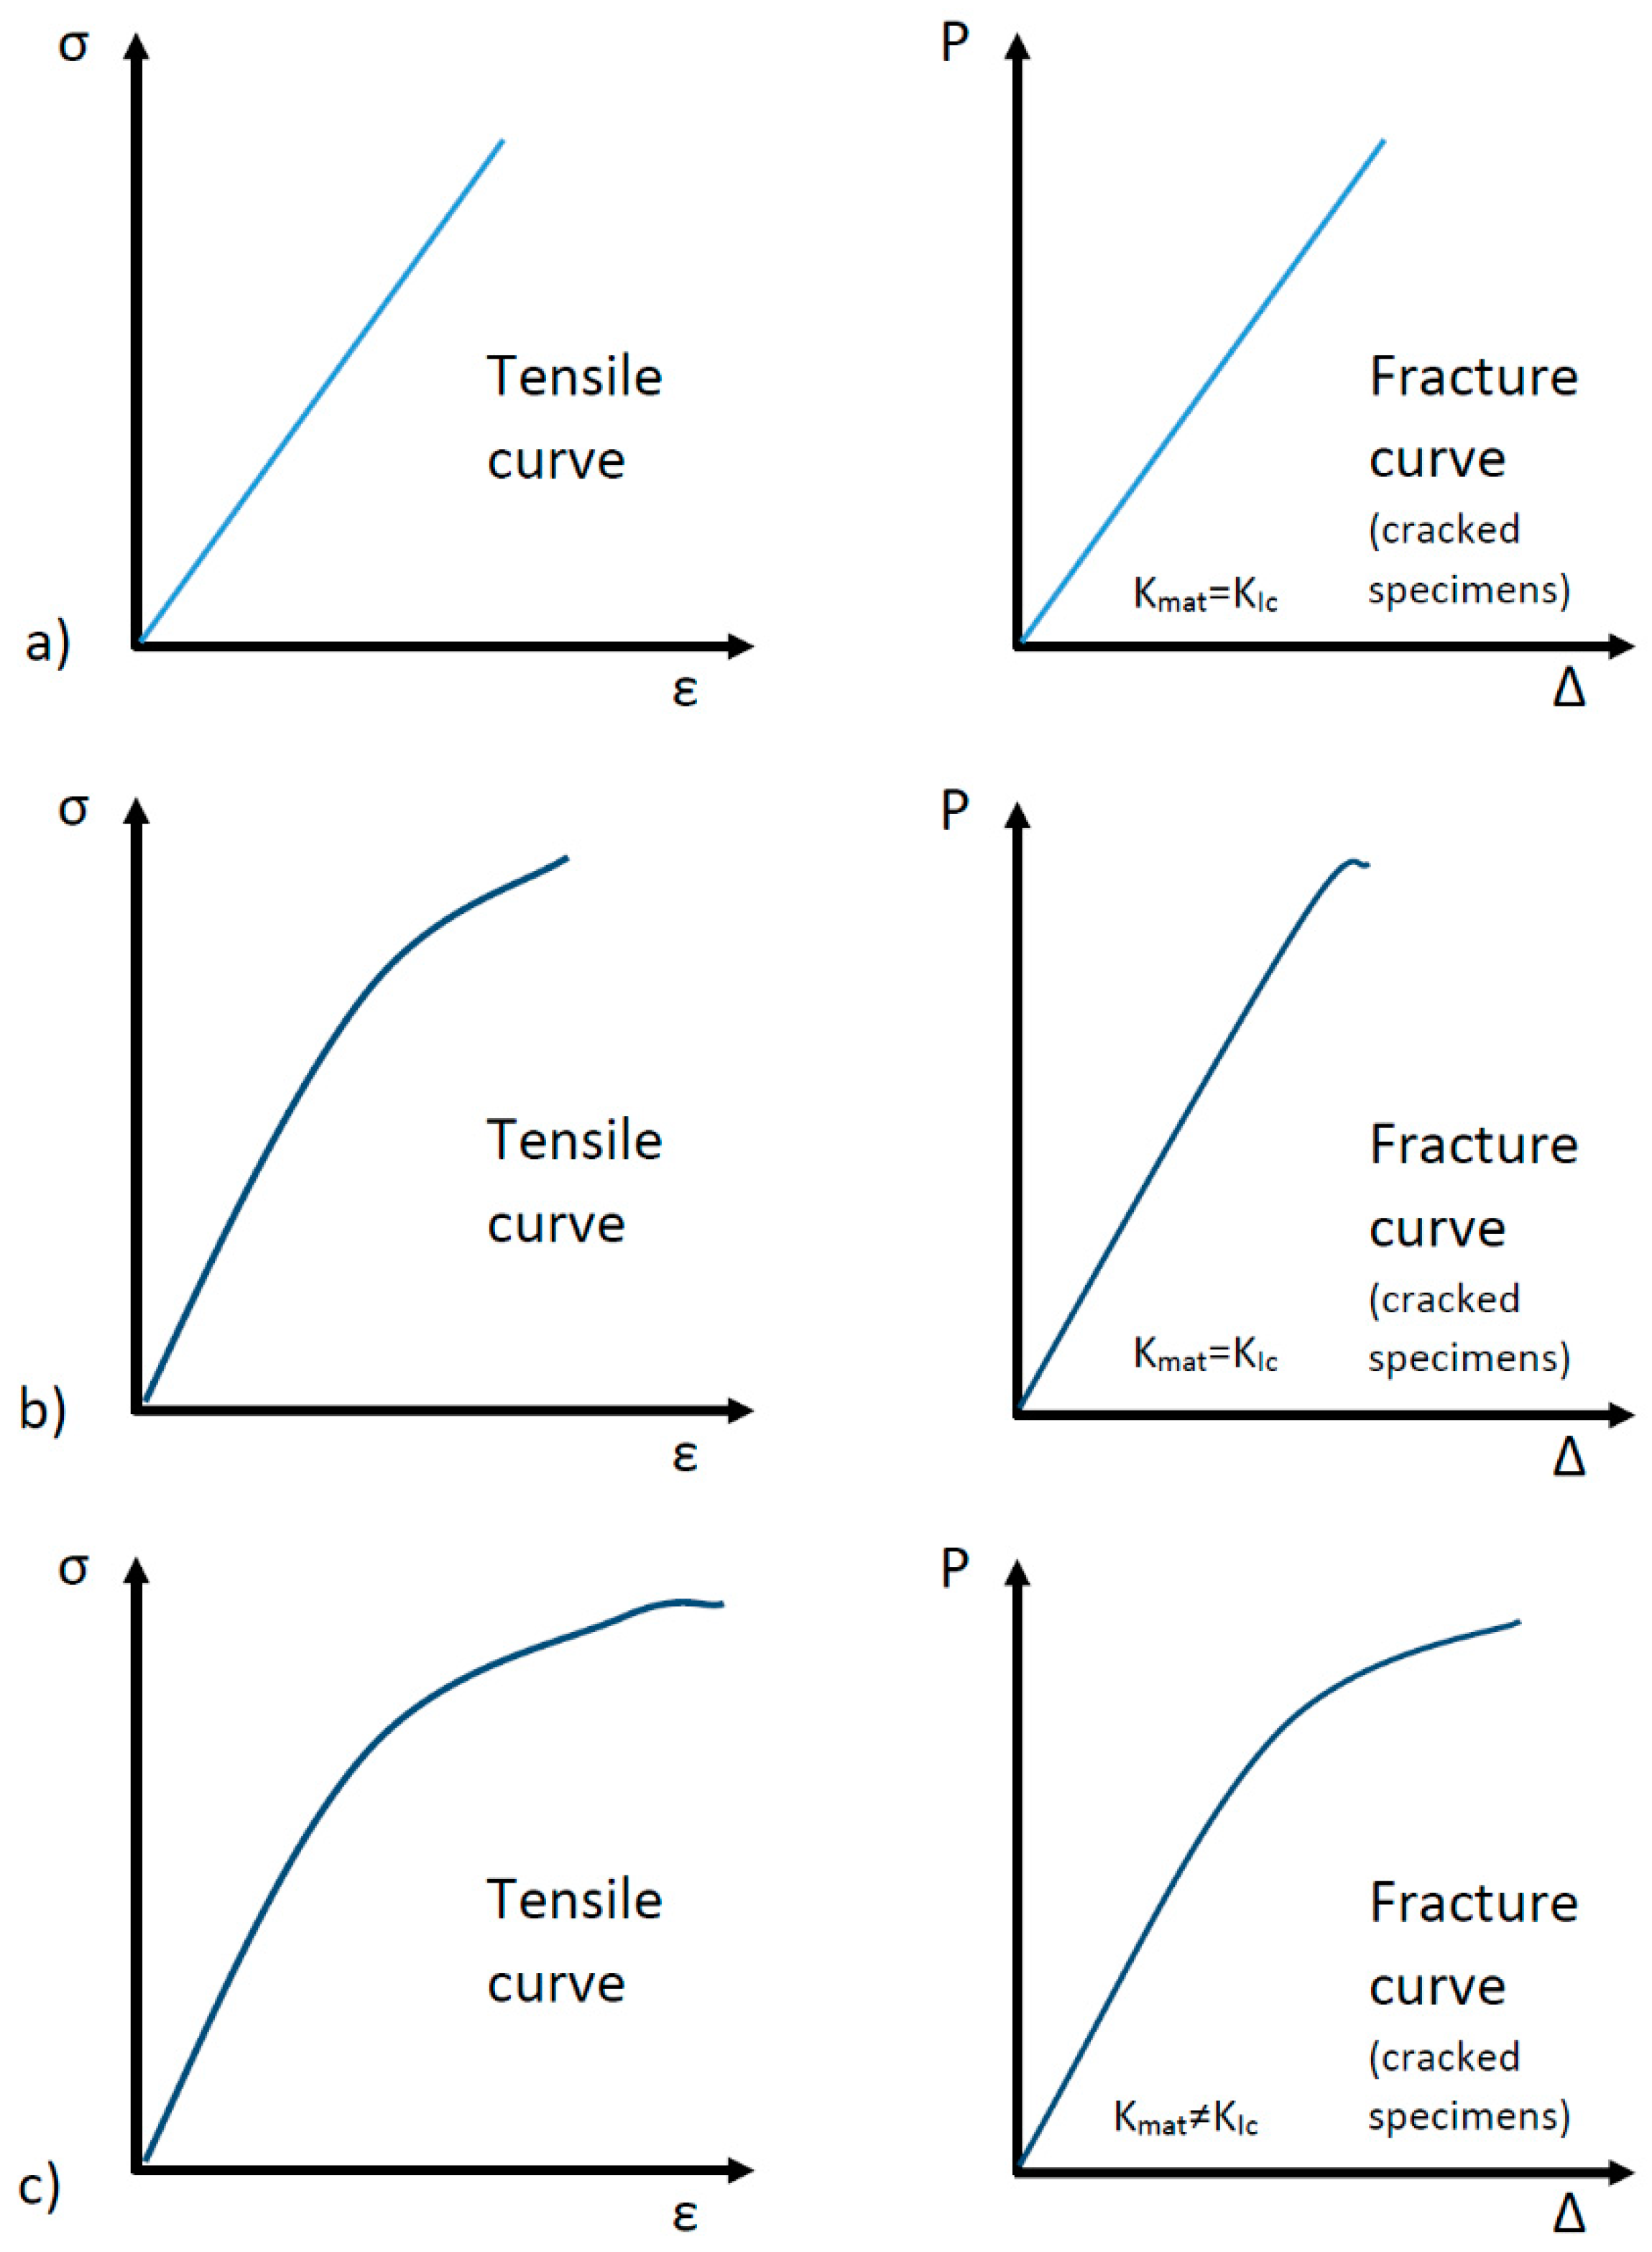
Figure 1. Schematic of the different mechanical behaviours covered in the analysis: (a) completely linear-elastic in both tensile and fracture conditions (cracked specimens); (b) moderately nonlinear in tensile conditions, and predominantly linear-elastic in fracture (cracked) specimens; (c) nonlinear in both tensile and fracture conditions.
Applsci 10 01601 g001
Figure 2. (a) Typical (engineering) stress–strain curve for a ductile material; (b) stress–strain curve for the equivalent linear-elastic material.
Applsci 10 01601 g002
Figure 3. Control volume (control area in plane problems) under mode I loading: (a) sharp V-notch; (b) crack; (c) blunt V-notch.
Applsci 10 01601 g003
Figure 4. Predictions of ASED and EMC–ASED criteria and comparison with the experimental Figure 6. (b) SGFR PA6 5 %wt.; (c) SGFR PA6 50 %wt.
Applsci 10 01601 g004
Figure 5. Predictions of ASED and EMC–ASED criteria and comparison with the experimental fracture loads (Pexp). PMMA.
Applsci 10 01601 g005
Figure 6. Predictions of ASED and EMC–ASED criteria and comparison with the experimental fracture loads (Pexp). Al7075-T651 (TL orientation).
Applsci 10 01601 g006
Figure 7. Predictions of ASED and EMC–ASED criteria and comparison with the experimental results. (a) Steel 275JR (−120 ℃); (b) S275JR (−50 ℃); (c) S275JR (−10 ℃).
Applsci 10 01601 g007
Figure 8. Examples of load–displacement curves obtained in the fracture tests for various notch radii. Steel S275JR (−120 ℃).
Applsci 10 01601 g008
Table 1. Main mechanical properties and resulting parameters of the materials being analysed. E: Young´s Modulus; σy: yield stress; σu: ultimate tensile strength; σf*: tensile stress at crack initiation in the equivalent material; εmax: strain under maximum load; Kmat: fracture toughness.
MaterialE (MPa)σy (MPa)σu (MPa)σf* (MPa)εmaxKmat (MPa·m1/2)
PA 6 285054.2054.2059.342.072.17
SGFR PA 6
(5% wt.%)
330066.9072.0586.302.661.84
SGFR PA 6
(50% wt.%)
12,600161.1192.8282.12.478.59
PMMA342048.571.95115.84.052.04
Al7075-T65174,400539.2602.227279.9026.6
S275JR
(−120 °C)
218000837.0928.2720813.7131.3
S275JR (−50 °C)209,000349.1564.7563915.3380.6
S275JR (−10 °C)207,000337.6536.3585317.15122.8
Table 2. Average fracture loads and predictions of fracture loads provided by the ASED and the EMC–ASED criteria.
MaterialNotch Radius, ρ (mm)Pexp
(kN)
PASED
(kN)
PEMC–ASED
(kN)
PASED/Pexp
PEMC–ASED/Pexp
PA60.250.10490.06830.07480.7240.713
0.500.13300.09100.08900.7140.669
1.00.13090.09300.09680.7180.739
2.00.13890.11200.11820.8620.850
SGFR-PA6
5 wt.%
0.250.08210.06890.07300.8390.889
0.500.09760.07920.08780.8110.899
1.00.11350.09860.11250.8680.991
2.00.13780.12910.15030.9361.090
SGFR-PA6
50 wt.%
0.250.33700.24310.35560.7211.055
0.500.37140.34370.39600.9251.066
1.00.39440.39600.44721.0041.133
2.00.42620.43970.54911.0311.288
PMMA0.250.11400.09930.11250.8710.987
0.320.11030.09780.12020.8881.090
0.500.12700.10710.14000.8431.102
1.00.20730.13270.18480.6410.891
1.50.19960.15050.21830.7541.094
2.00.25250.16900.24910.6690.986
2.50.25170.18380.27510.7301.093
Al7075-T6510.1520.366.0915.740.2990.773
0.2123.047.2017.760.3120.770
0.4731.3910.7824.700.3430.786
1.038.9312.4834.770.3200.893
2.044.9114.3548.330.3191.076
S275JR
(−120 °C)
0.1549.258.6152.160.1741.059
0.2550.9011.1164.310.2181.263
0.5059.1315.7287.900.2651.486
1.064.3322.23121.80.3451.894
2.069.8331.45170.60.4502.444
S275JR
(−50 °C)
0.1562.007.7056.850.1240.916
0.2556.529.9464.030.1751.132
0.5065.4814.0679.640.2141.216
1.065.5319.89104.30.3031.591
2.080.0228.13141.50.3511.768
S275JR
(−10 °C)
0.1565.047.4182.740.1141.272
0.2565.809.5683.990.1451.276
0.5069.8513.5295.160.1931.362
1.072.6319.13118.20.2631.627
2.075.3027.05154.10.3592.046