Observing Pictures and Videos of Creative Products: An Eye Tracking Study


Abstract
1. Introduction
2. Objectives and Originality of the Study
- They have different level of dynamics based on the classification presented in Table 1, i.e., pictures are static, while videos are dynamic stimuli.
- It is possible to use consistent stimuli for the product sets under analysis; otherwise said, the possible bias due to the use of different products can be overcome due to the diffused presence of pictures and videos depicting the same product.
- Both forms of representation can be employed in ET studies alternatively and supported by the same hardware and software. ET is clearly essential to capture data on people’s visual behavior objectively.
3. Materials and Methods
3.1. Participants
- The Long Night of Research held at the Free University of Bozen-Bolzano, Italy.
- A lecture about ET technologies held by the authors in a course of MSc in Mechanical Engineering at the University of Florence, Italy.
- A workshop with BSc students in Industrial Design at the University of Florence, Italy.
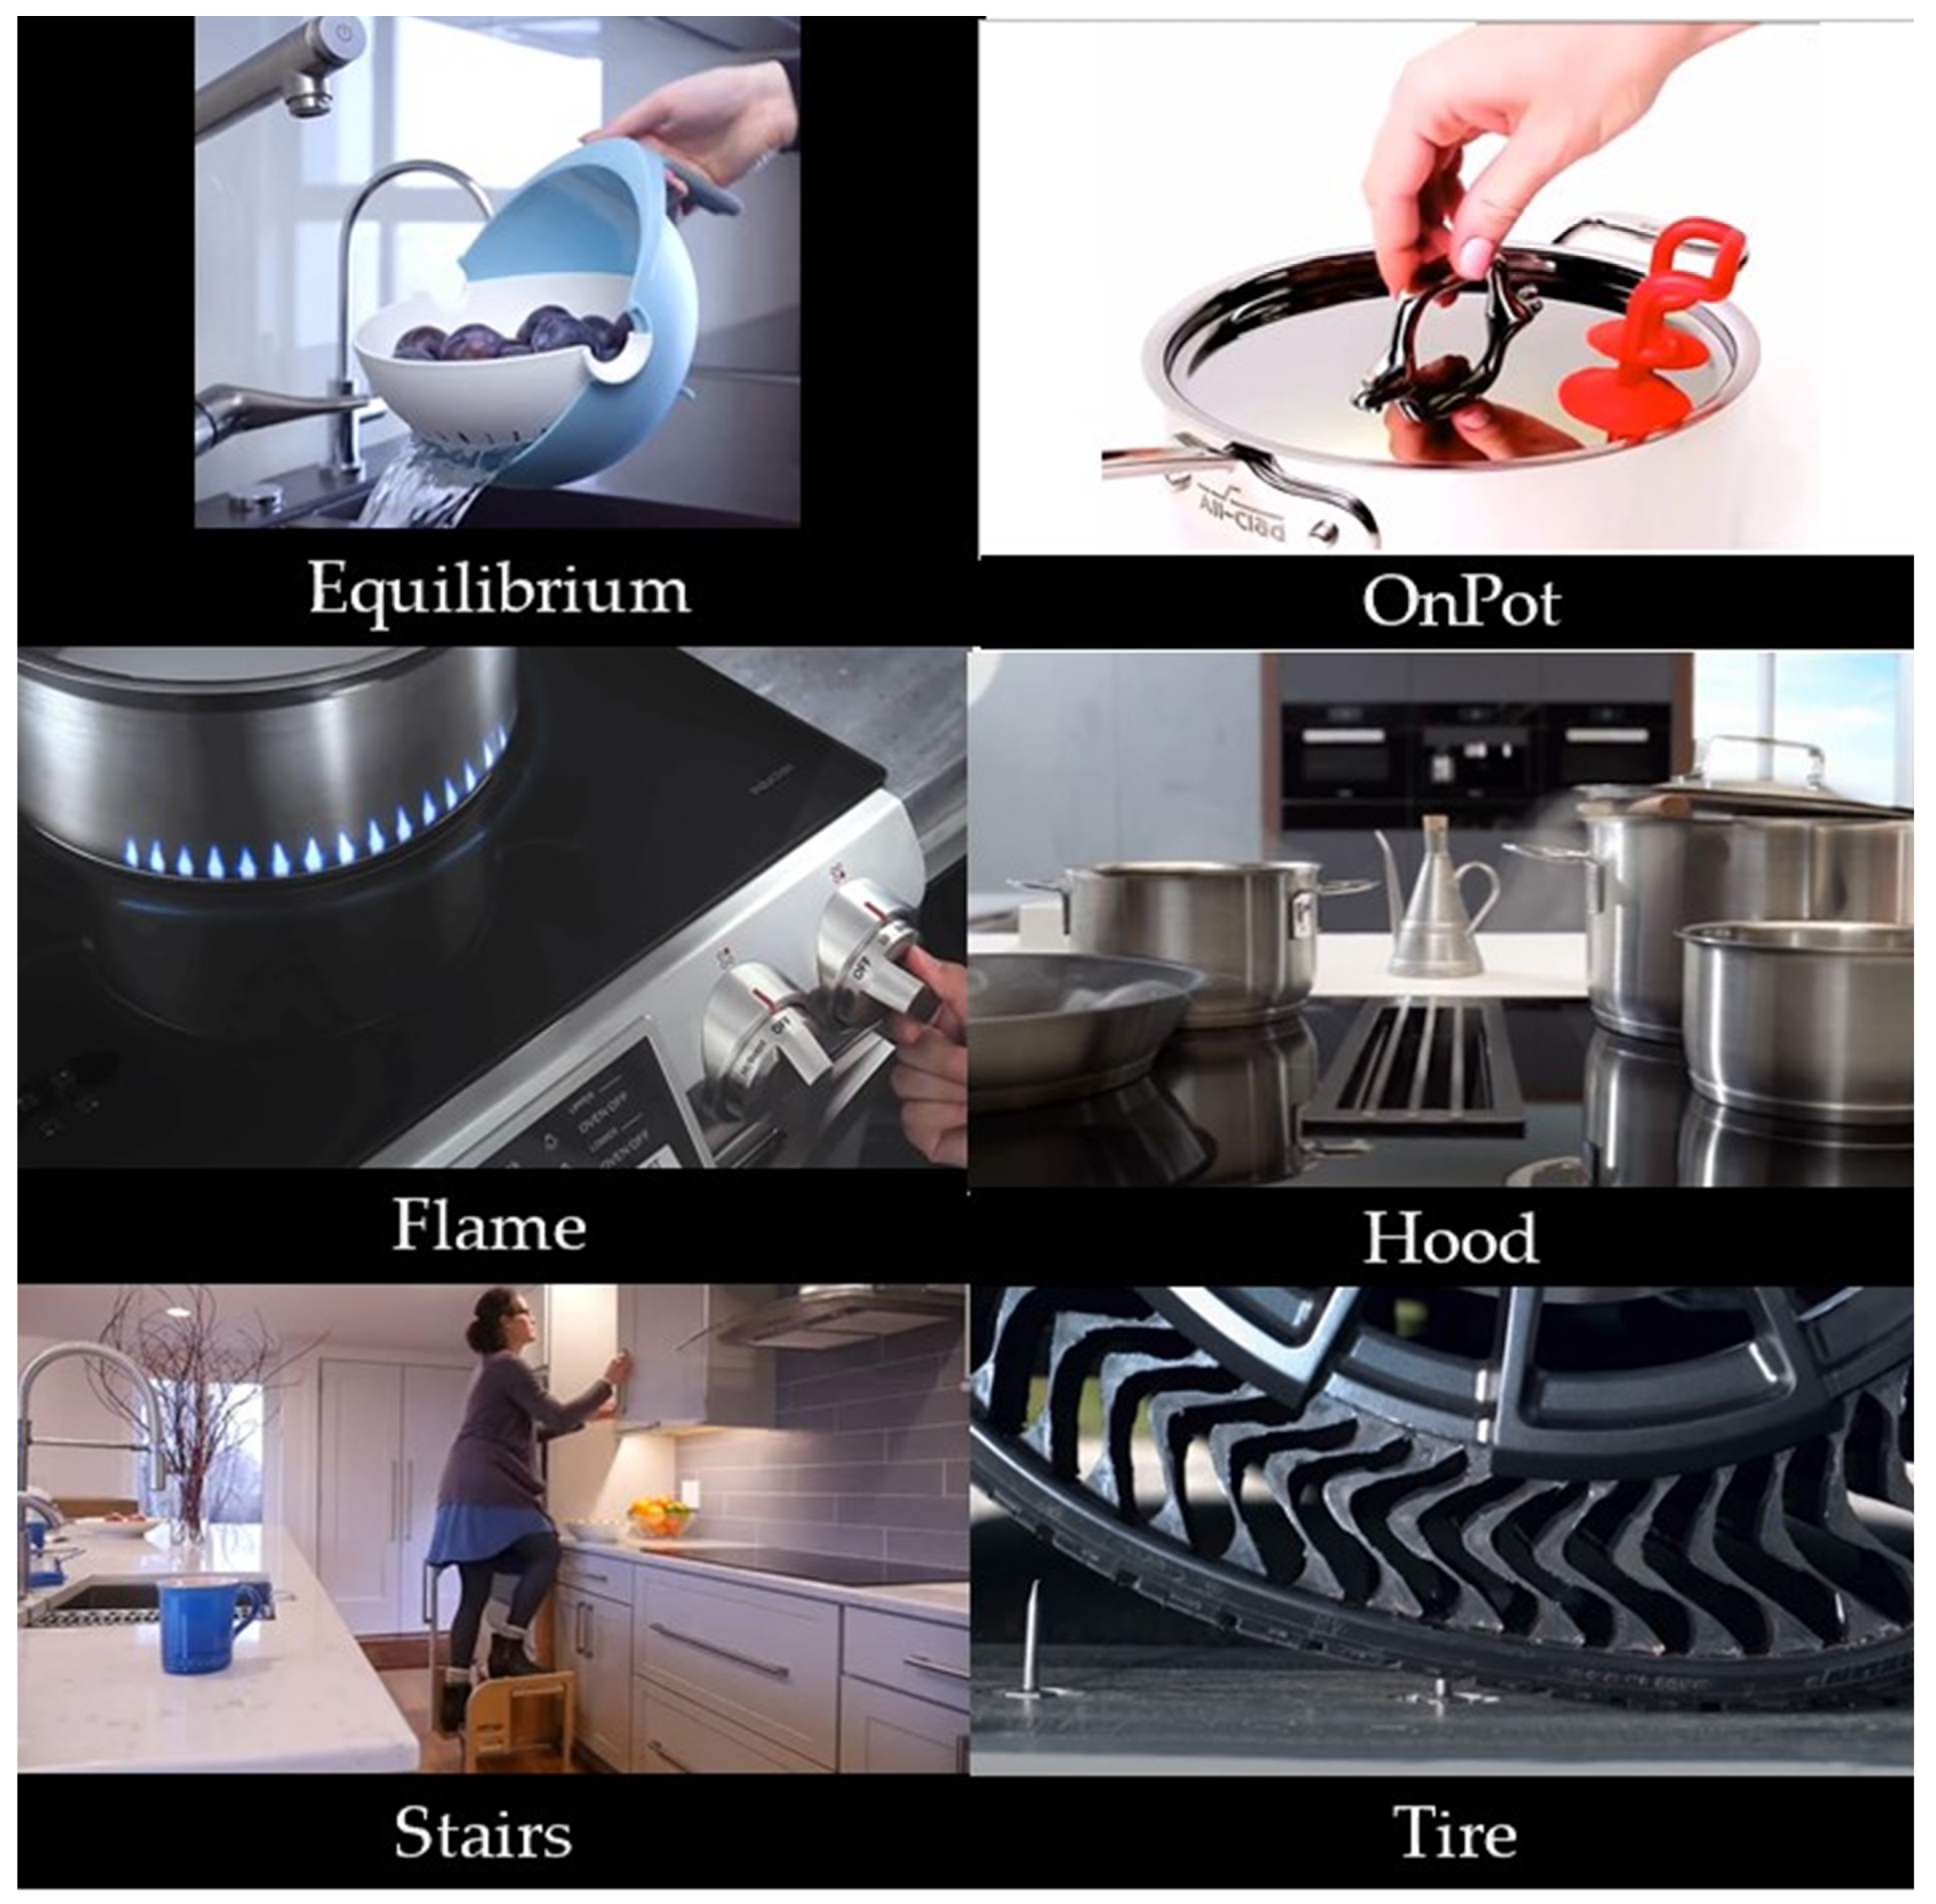
3.2. Stimuli
- Creative designs are supposed to attract greater interest than commonplace products and capture users’ attention.
- A task was designed to keep participants’ attention focused on products and their elements (see Section 3.3) and this required the use of products that are not supposedly everyday objects.
- As stated in the Introduction section, creative designs are featured by a major need for being evaluated, as they introduce novel elements or functions that deviate from people’s habits.
- Equilibrium: It is a colander integrated into a bowl. The water is kept inside the bowl; the removal of the water takes place without any need for disassembling the object while the fall of the washed food is prevented.
- Flame: it is an induction hob where the flame-shaped LED light projected on the pot indicates the intensity of the heat like in gas-powered hobs.
- Stairs: space-saving foldable stairs are integrated in the kitchen furniture.
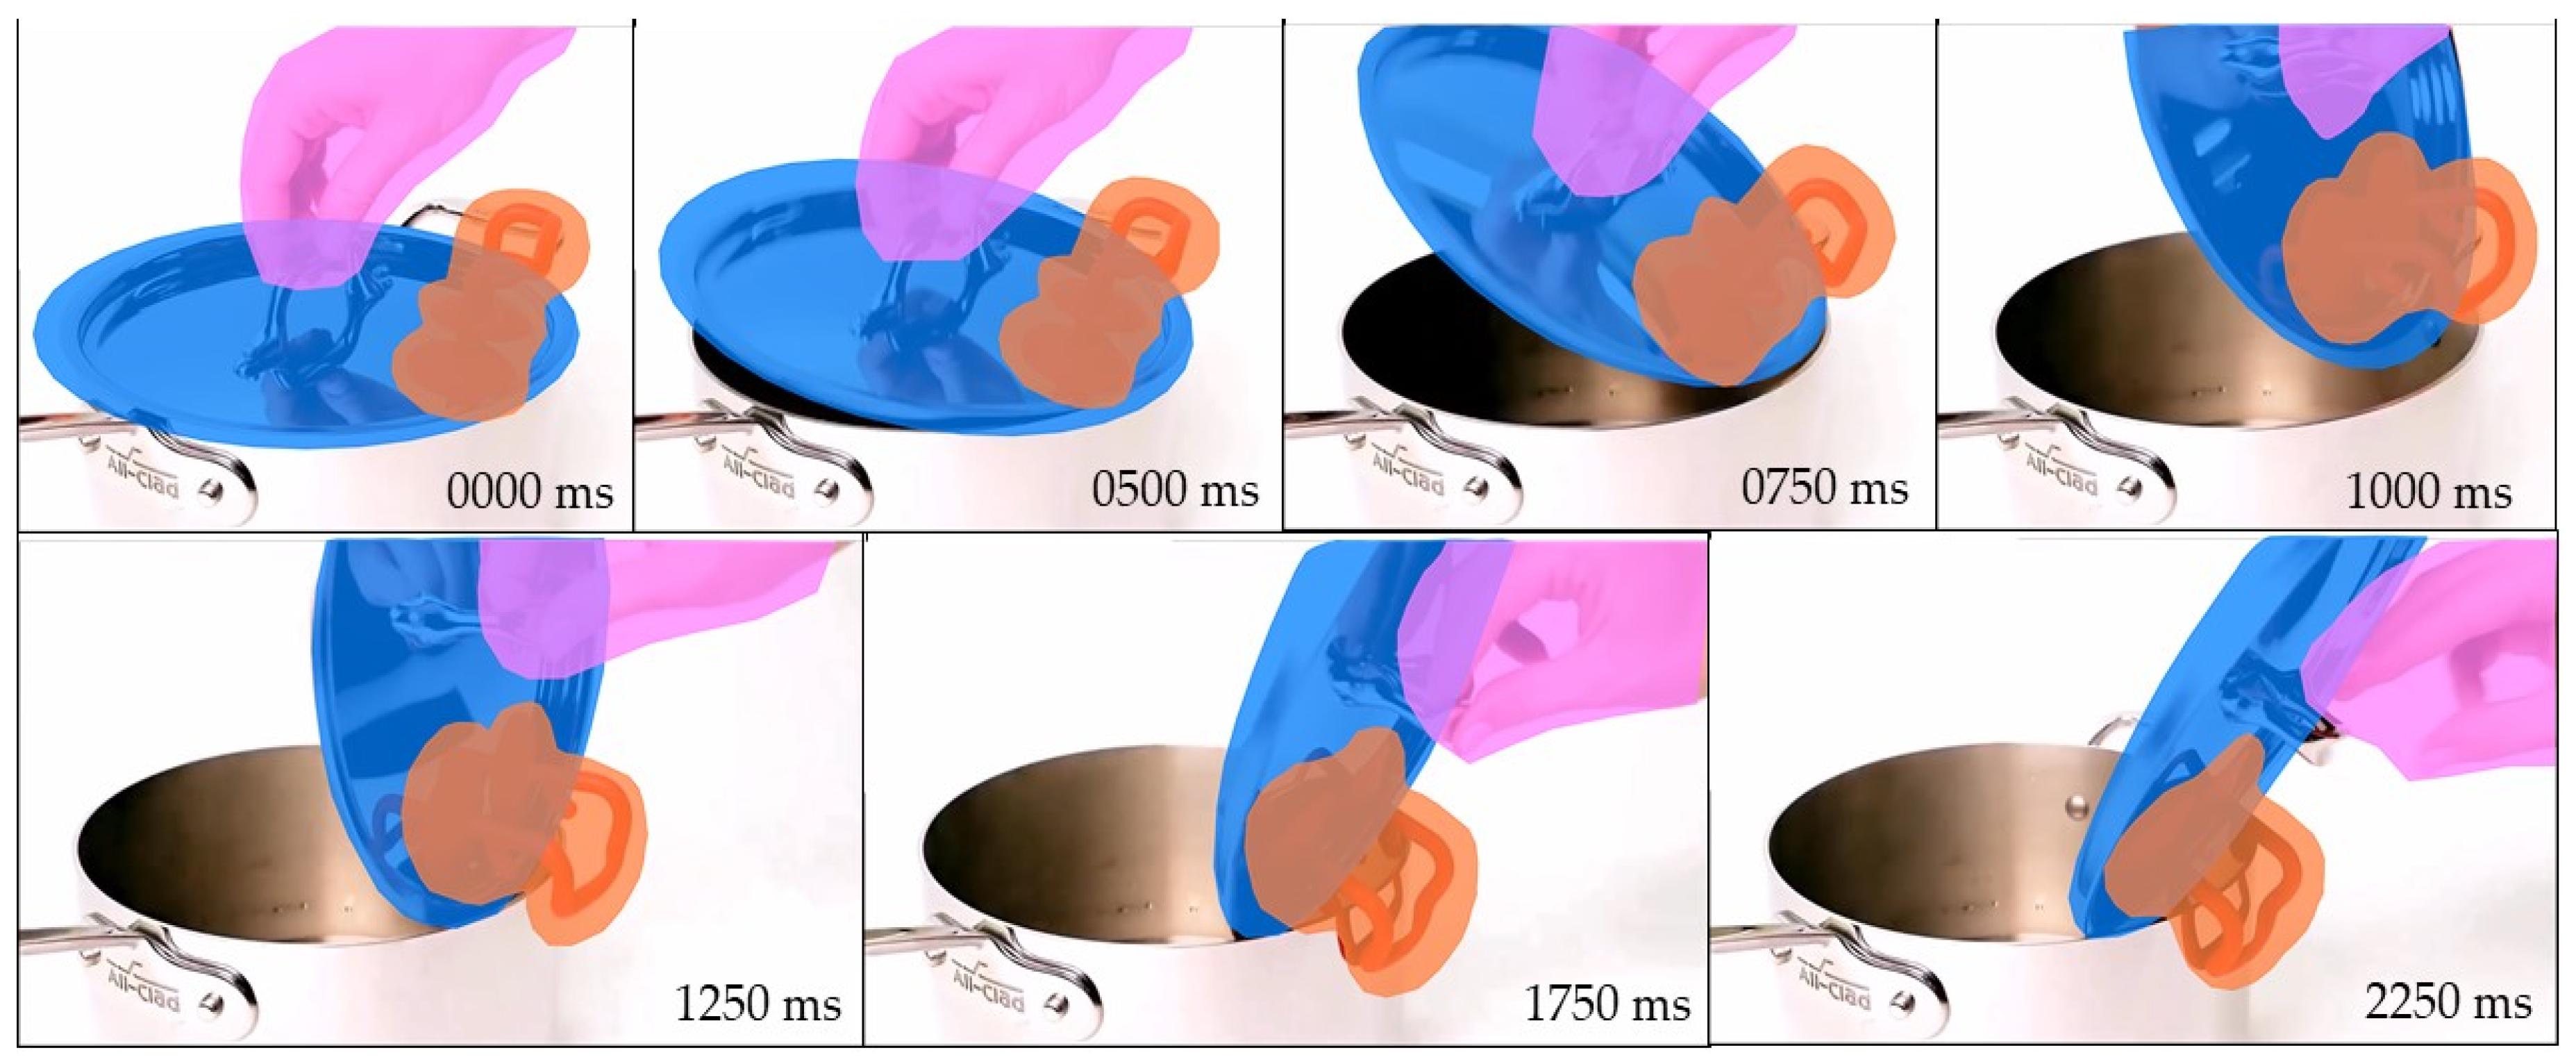
- OnPot: it is a suction cup applied on a lid and it allows the user to open the lid over the pot and, at the same time, to put it on the edge of the pot.
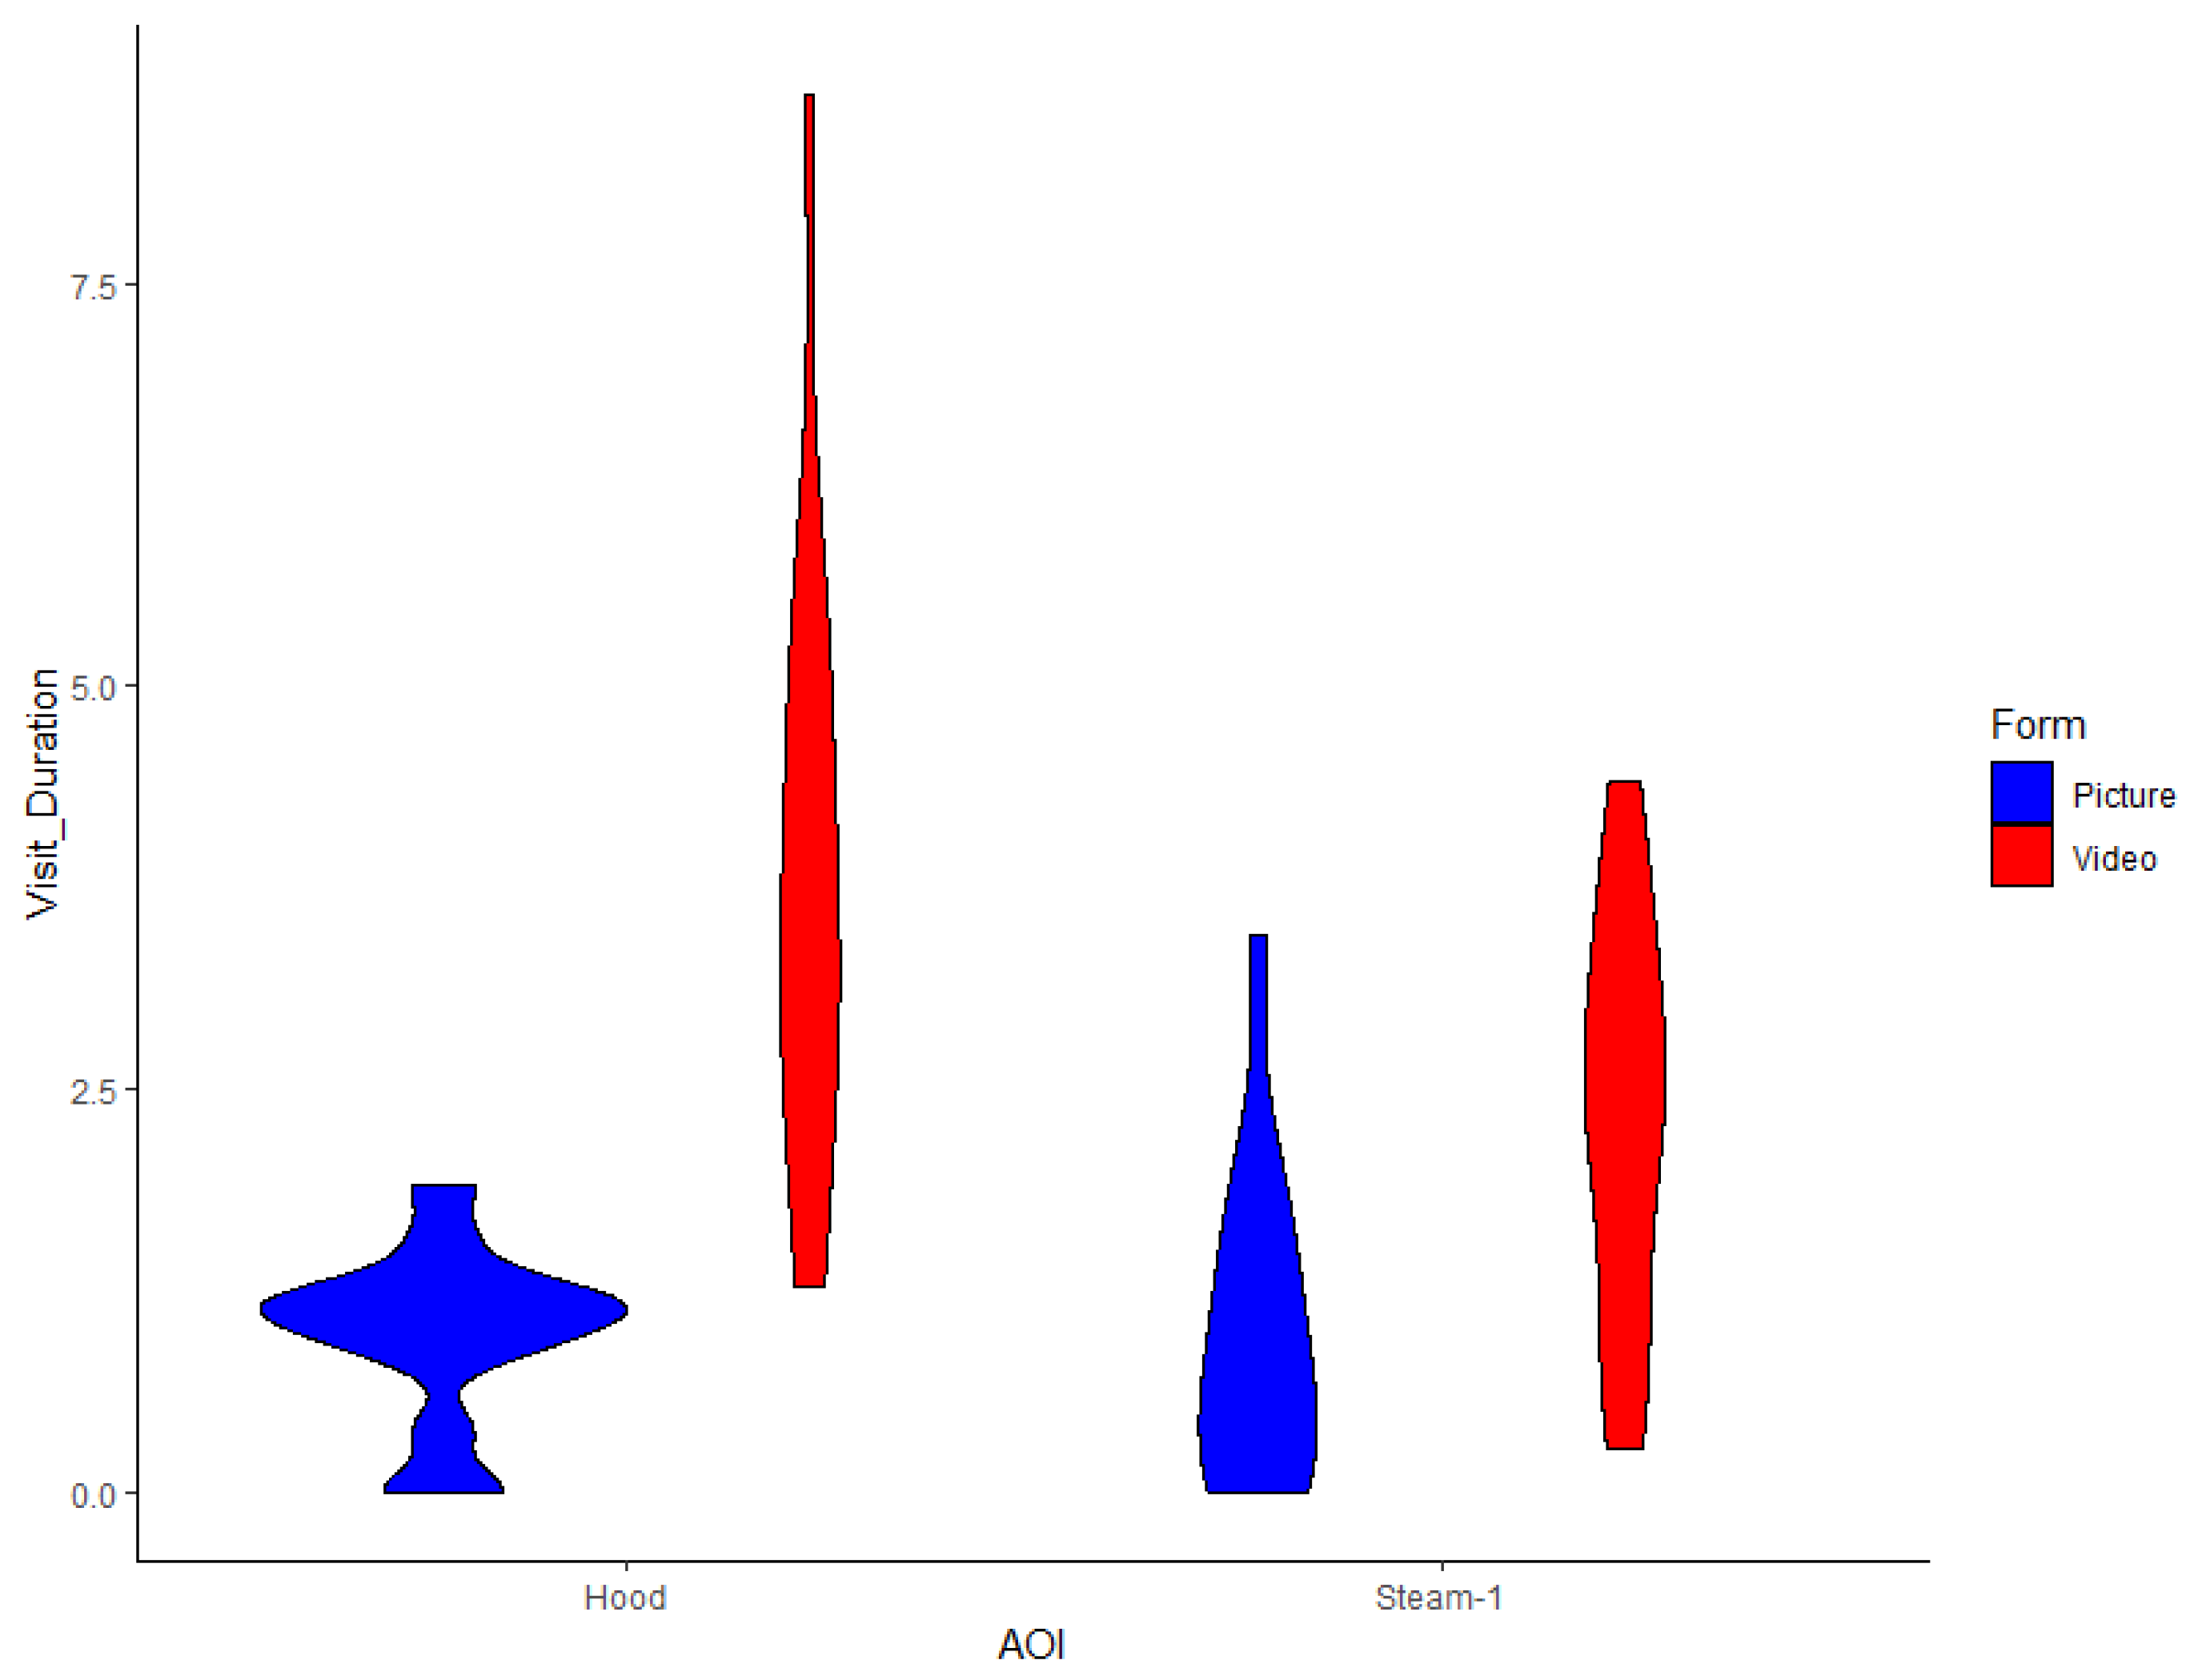
- Hood: it is a kitchen hood integrated in the hob so that the user can arrange easily the hob in the middle of the kitchen room.
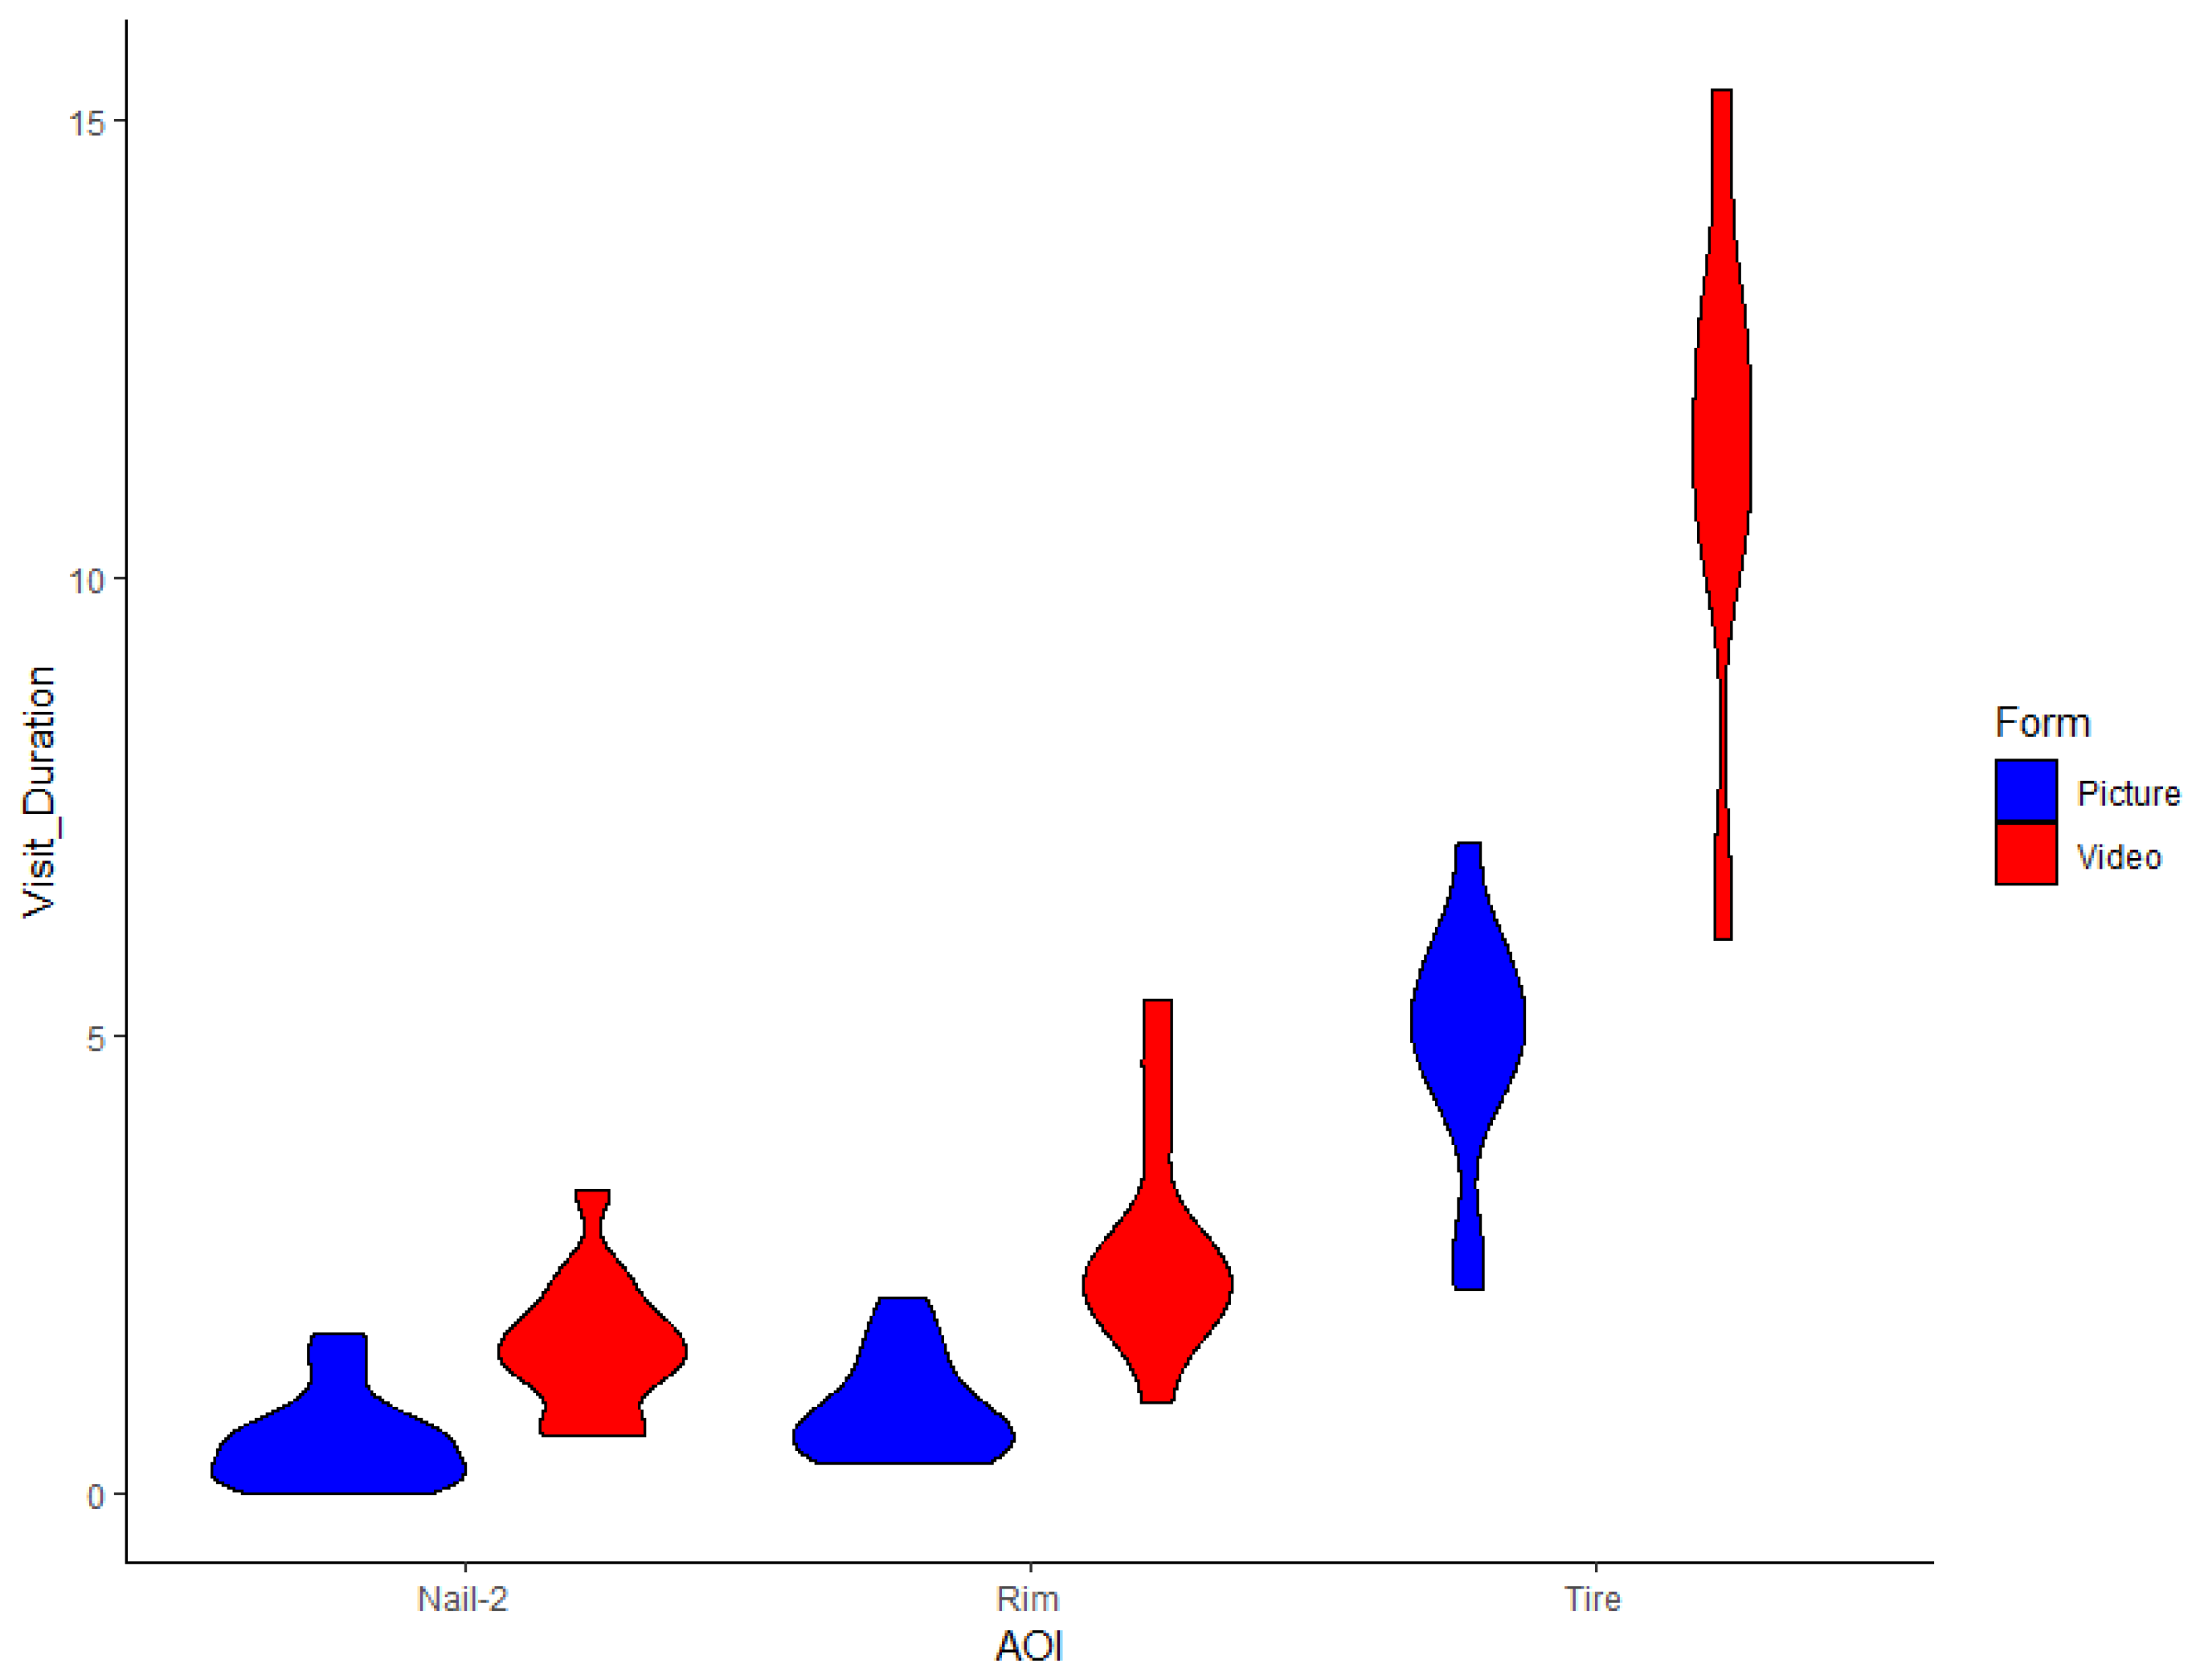
- Tire: it is an airless tire that keeps being usable in case of an accidental puncture.
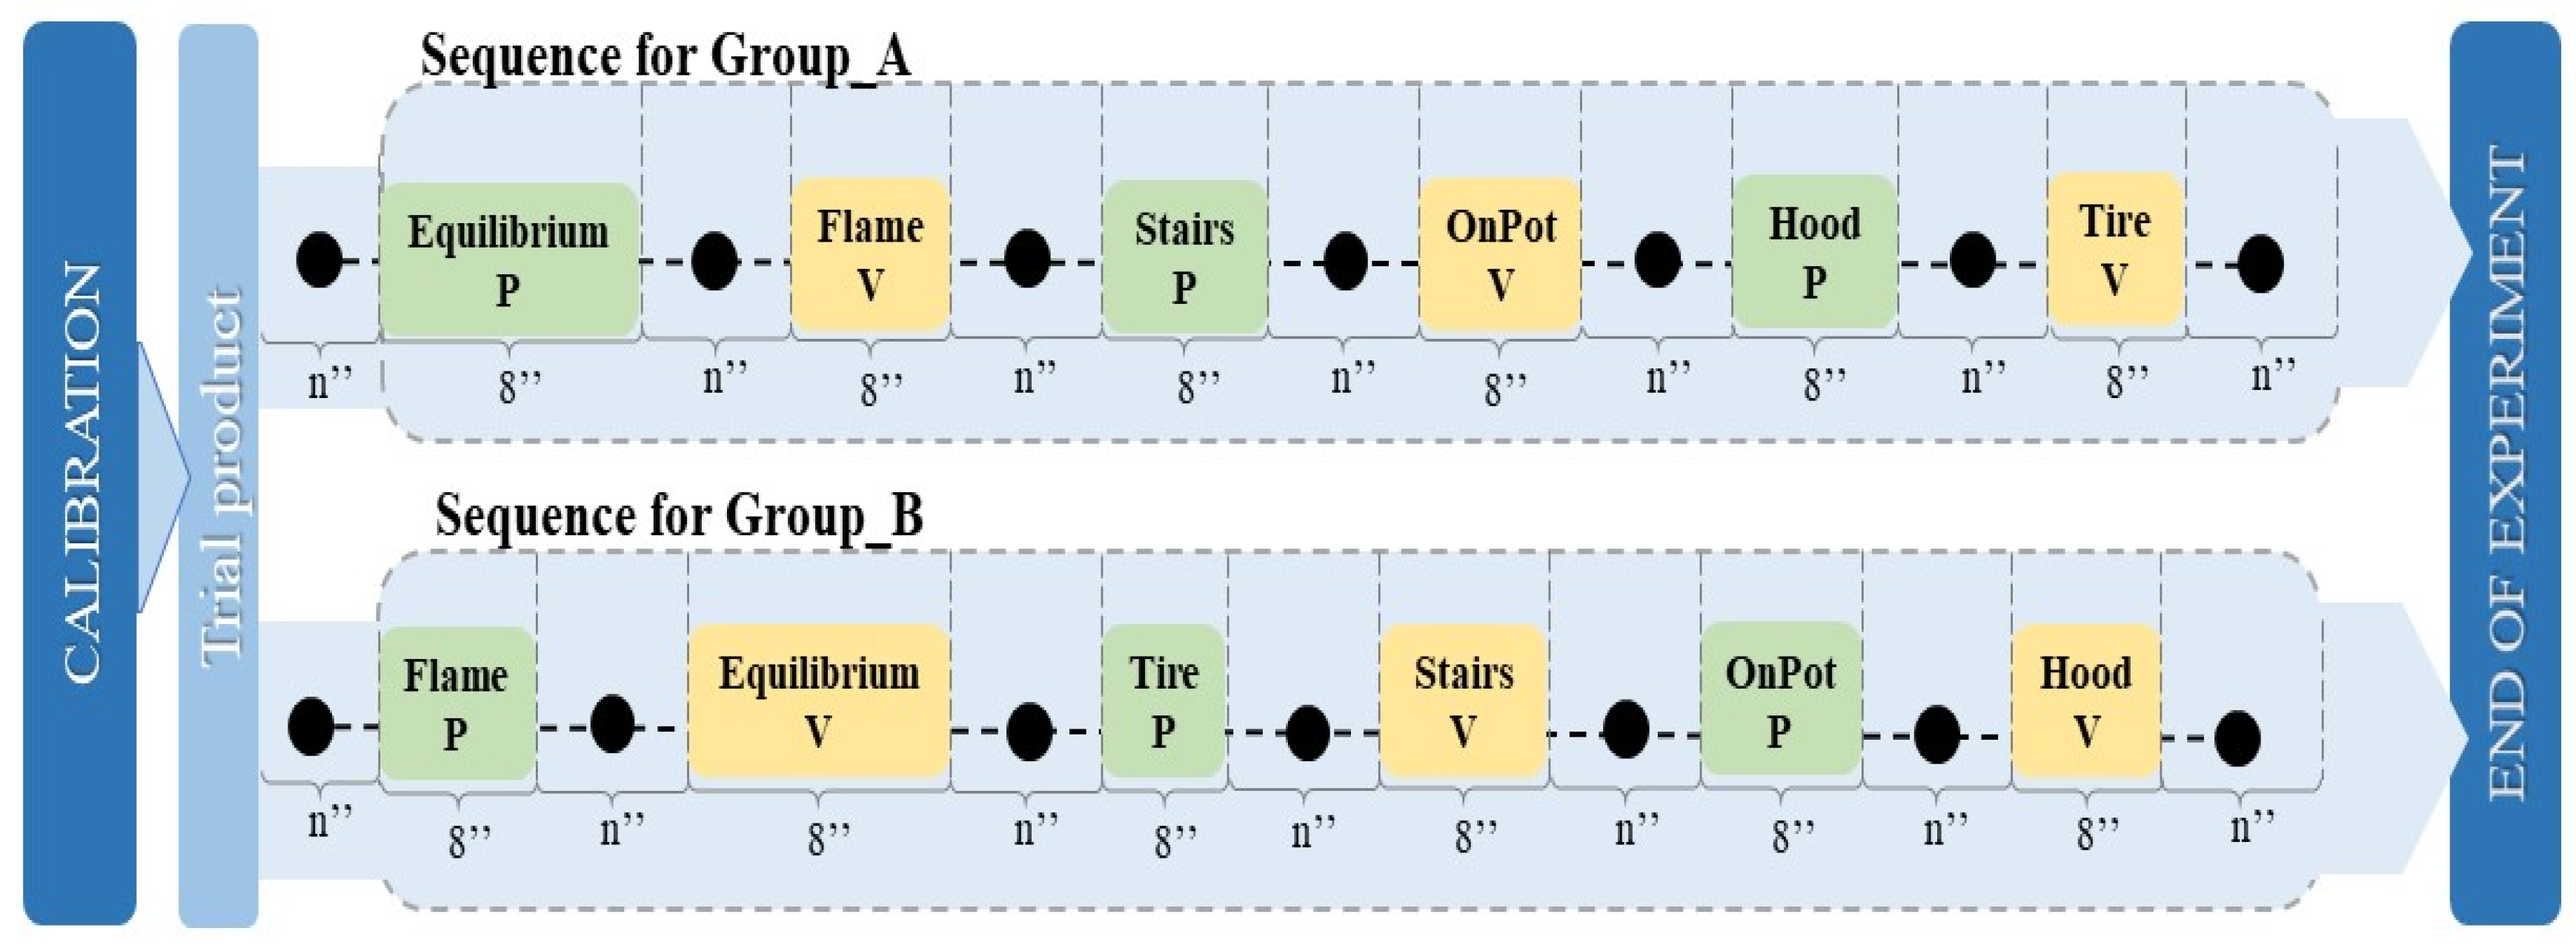
3.3. Procedure
4. Data Acquisition and Elaboration
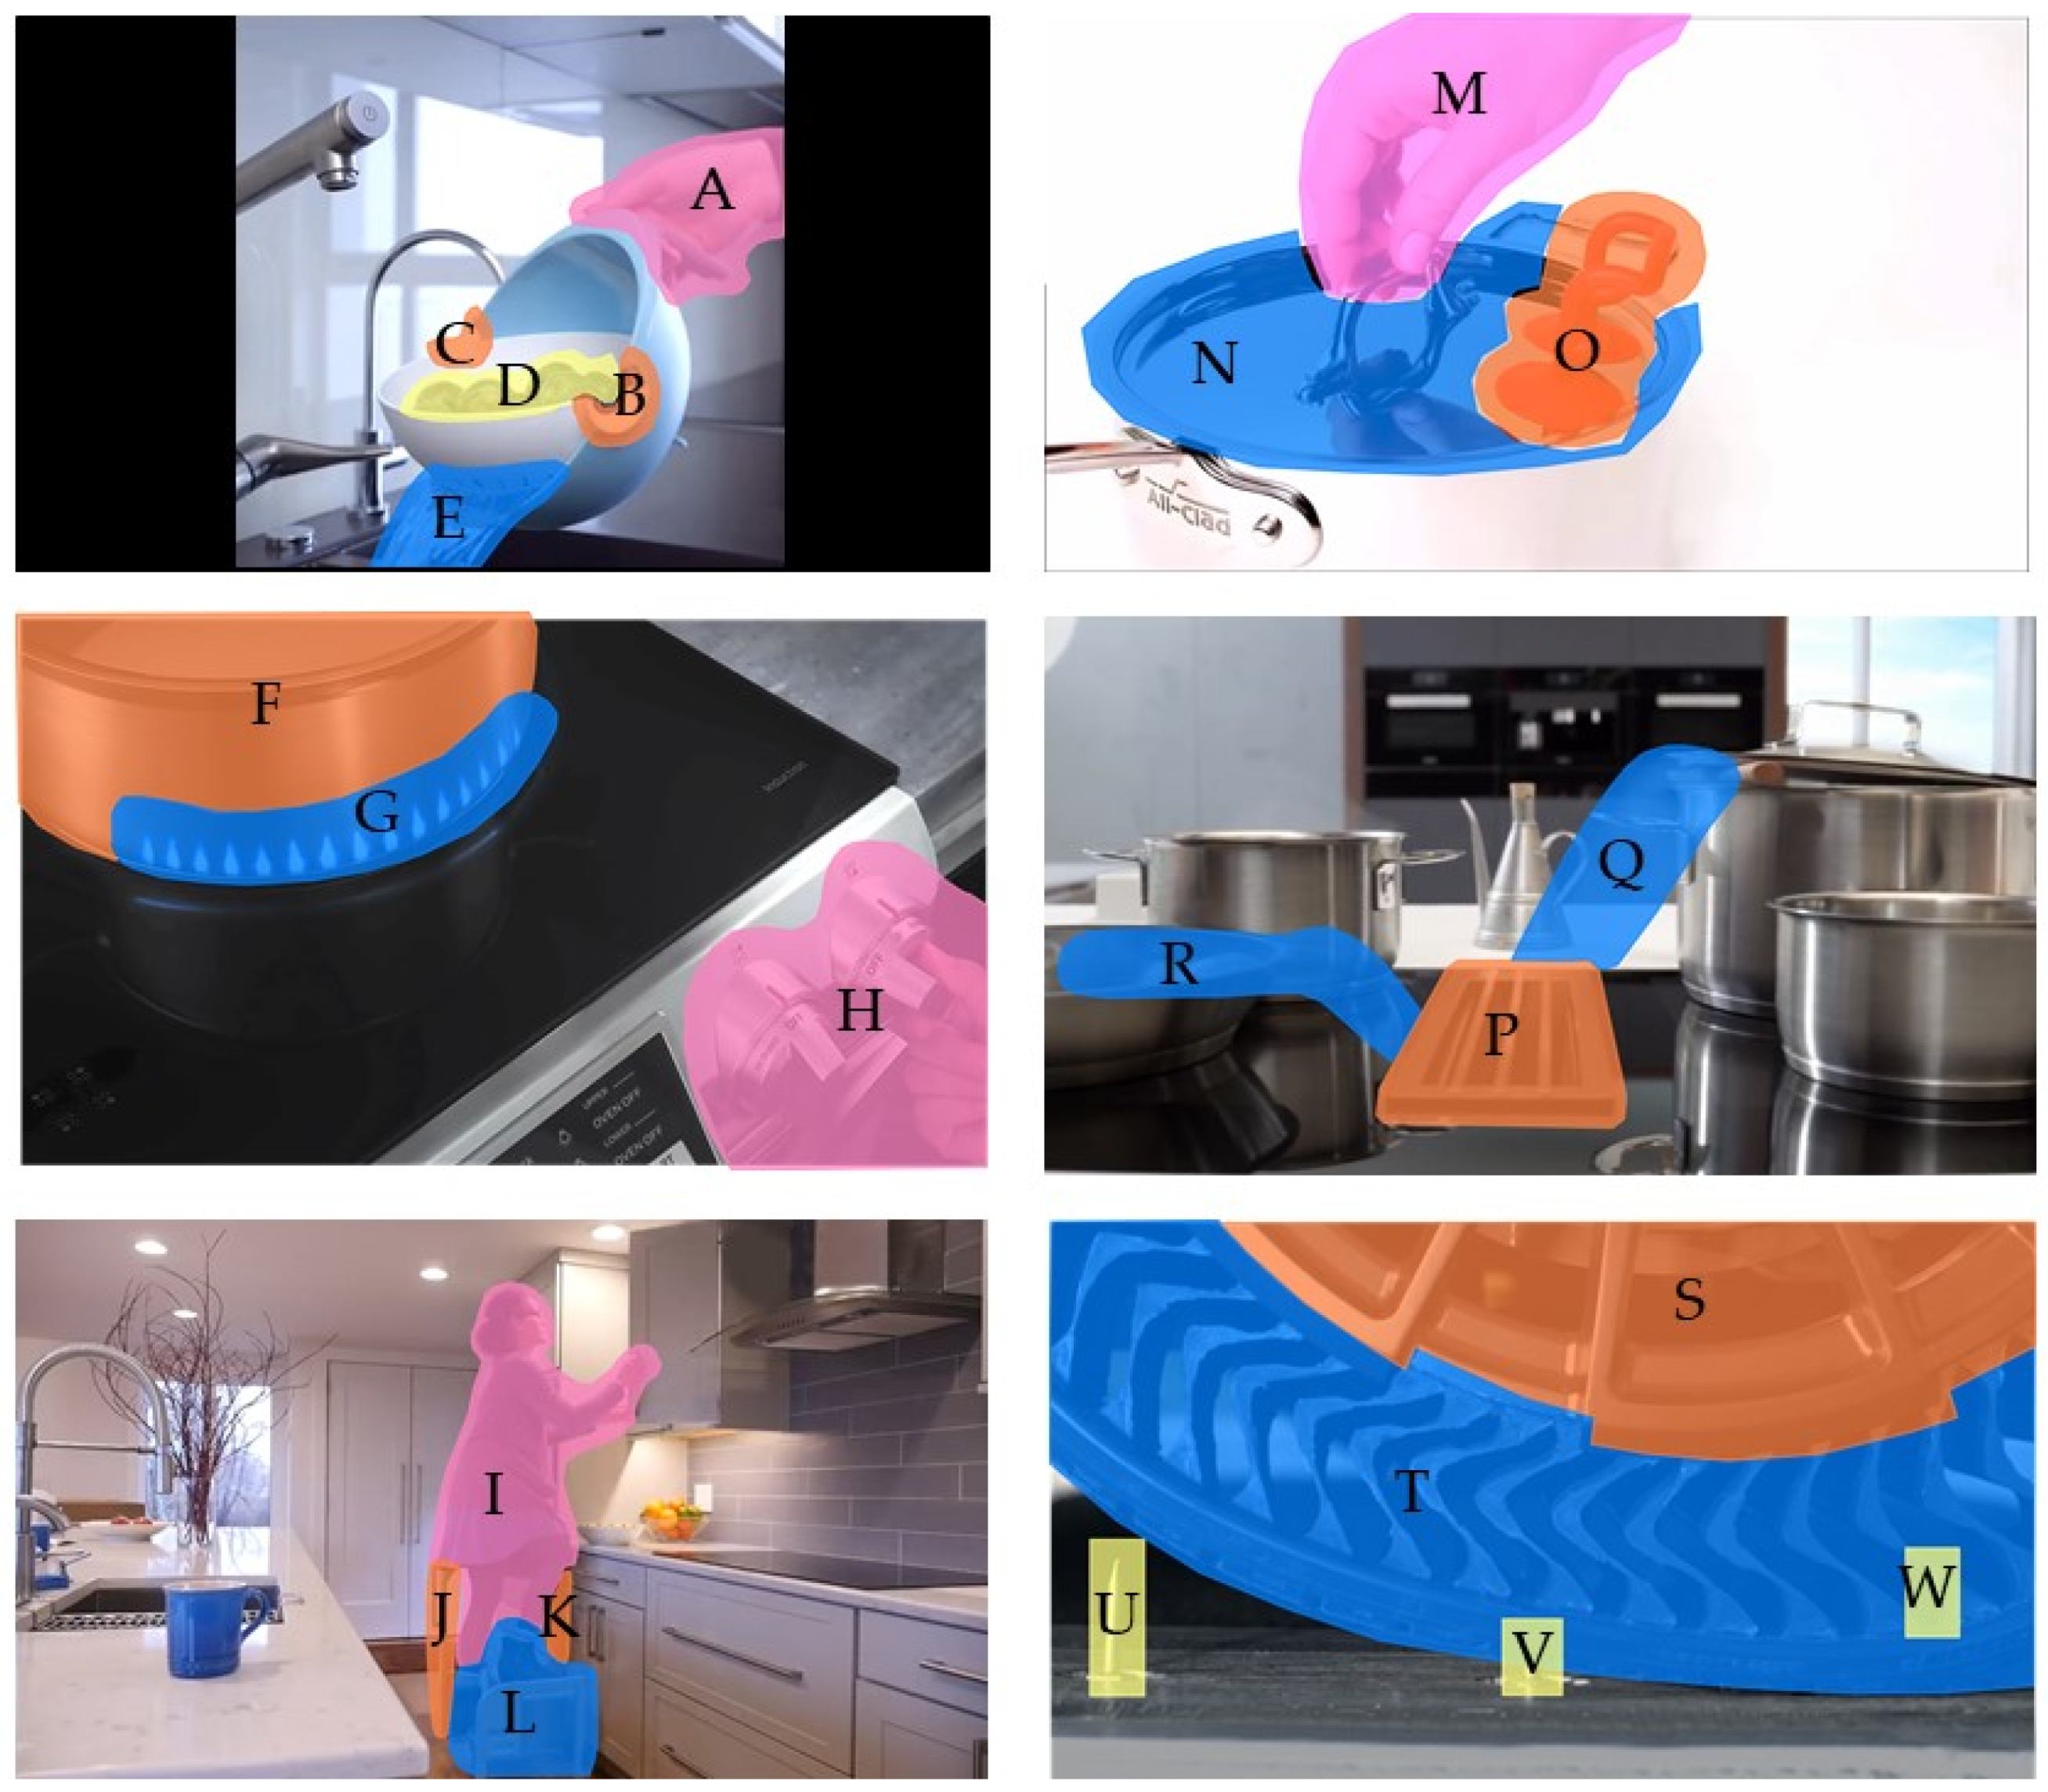
4.1. Areas of Interest and Eye-Tracking Data
4.2. Data Elaboration
5. Discussions and Limitations
- The number of leveraged products is limited, as well as the sample of participants is not representative of any population. Despite the latter, many significant differences between attention focused by pictures and videos emerged.
- The choice of products along with the corresponding videos was largely arbitrary. The level of creativity and technological sophistication can differ across the chosen products, as well as, although they refer to supposedly common contexts (home, kitchen, means of transportation), they can be featured by different familiarity. With respect to the unusualness of the products chosen, the selection can be considered successful, as no participant spontaneously stated that they were overall familiar with the depictions.
- Pictures were made out of the first frame of corresponding videos, but they did not necessarily coincide with the most explicative frame of the same videos. As the latter criterion could have introduced additional arbitrariness, the former was chosen.
- Both pictures and videos depicted the products in their final stage of design, as all the displayed products are marketed. The products are shown in their context of use in all stimuli, and they depict real, physical, and non-simulated environments. The backgrounds of pictures and videos have not been checked for consistency in terms of presence of potentially misleading elements. Pictures and videos showing creative products in intermediate design phases could have affected the results.
- The background of participants is known just in a subset of cases (engineering, industrial design) and its effect is worth taking into account in future studies along with other demographic data.
- The duration of videos and corresponding pictures’ exposition was arbitrary, although consistent.
- The task participants had to carry out is not a standard one. Results would have been likely different if participants had been left free to observe products and videos. The relationship between TVD on AOIs and the understanding of products’ original elements could be beneficially analyzed.
- The sequences were standardized for the sake of convenience, but they could be randomized in future studies.
- The TVD was here chosen as a measure of attention and interest aroused by AOIs, but other ET variables are common in design studies to represent gaze and observation phenomena, see [83].
6. Conclusions and Outlook
Supplementary Materials
Author Contributions
Funding
Acknowledgments
Conflicts of Interest
References
- Christoforakos, L.; Diefenbach, S. Idealization Effects in UX Evaluation at Early Concept Stages: Challenges of Low-Fidelity Prototyping. In Proceedings of the AHFE 2018 International Conferences on Usability & User Experience and Human Factors and Assistive Technology, in Loews Sapphire Falls Resort at Universal Studios, Orlando, FL, USA, 21–25 July 2018; Ahram, T., Falcão, C., Eds.; Springer: Cham, Switzerland, 2018; Volume 794, pp. 3–14. [Google Scholar] [CrossRef]
- Samantak, R.; Choi, Y.M. Employing design representations for user feedback in the product design lifecycle. In Proceedings of the 21st International Conference on Engineering Design (ICED17), Vancouver, BC, Canada, 21–25 August 2017; Maier, A., Škec, S., Eds.; The Design Society: Glasgow, Scotland, 2017; Volume 4, pp. 563–572. [Google Scholar]
- Kushniruk, A.; Nøhr, C. Participatory Design, User Involvement and Health IT Evaluation. Stud. Health Technol. Inform. 2016, 222, 139–151. [Google Scholar] [CrossRef] [PubMed]
- Tiwari, V.; Kumar, P.; Tandon, P. Product design concept evaluation using rough sets and VIKOR method. Adv. Eng. Inform. 2016, 30, 16–25. [Google Scholar] [CrossRef]
- Arrighi, P.A.; Maurya, S.; Mougenot, C. Towards Co-designing with Users: A Mixed Reality Tool for Kansei Engineering. In Proceedings of the IFIP International Conference on Product Lifecycle Management, Doha, Quatar, 19–21 October 2015; Bouras, A., Eynard, B., Foufou, S., Thoben, K.-D., Eds.; Springer International Publishing: Cham, Switzerland, 2015; Volume 467, pp. 751–760. [Google Scholar] [CrossRef]
- Mengoni, M.; Peruzzini, M.; Germani, M. Virtual vs. Physical: An Experimental Study to Improve Shape Perception. In Proceedings of the ASME International Design Engineering Technical Conferences and Computers and Information in Engineering Conference, San Diego, CA, USA, 30 August–2 September 2009; ASME Digital Collection: New York, NY, USA, 2009; pp. 1495–1506. [Google Scholar] [CrossRef]
- Dong, Y.; Liu, W. Research on UX evaluation method of design concept under multi-modal experience scenario in the earlier design stages. Int. J. Interact. Des. Manuf. 2018, 12, 505–515. [Google Scholar] [CrossRef]
- Khalaj, J.; Pedgley, O. Comparison of semantic intent and realization in product design: A study on high-end furniture impressions. Int. J. Des. 2014, 8, 79–96. [Google Scholar]
- Chen, M.; Mata, I.; Fadel, G. Interpreting and tailoring affordance based design user-centered experiments. Int. J. Des. Creat. Innov. 2019, 80, 46–68. [Google Scholar] [CrossRef]
- Gibson, I.; Gao, Z.; Campbell, I. A comparative study of virtual prototyping and physical prototyping. Int. J. Manuf. Technol. Manag. 2004, 6, 503–522. [Google Scholar] [CrossRef]
- Bacciotti, D.; Borgianni, Y.; Cascini, G.; Rotini, F. Product Planning techniques: Investigating the differences between research trajectories and industry expectations. Res. Eng. Des. 2016, 27, 367–389. [Google Scholar] [CrossRef]
- Borgianni, Y.; Cascini, G.; Rotini, F. Investigating the future of the fuzzy front end: Towards a change of paradigm in the very early design phases? J. Eng. Des. 2018, 29, 644–664. [Google Scholar] [CrossRef]
- Diefenbach, S.; Hassenzahl, M.; Eckoldt, K.; Laschke, M. The impact of concept (re)presentation on users’ evaluation and perception. In Proceedings of the 6th Nordic Conference on Human-Computer Interaction, Reykjavik, Iceland, 16 October–10 November 2010; Association for Computing Machinery: New York, NY, USA, 2010; pp. 631–634. [Google Scholar] [CrossRef]
- Du, P.; MacDonald, E.F. Products’ Shared Visual Features Do Not Cancel in Consumer Decisions. J. Mech. Des. 2015, 137, 1–11. [Google Scholar] [CrossRef]
- Kim, M. Digital product presentation, information processing, need for cognition and behavioral intent in digital commerce. J. Retail. Consum. Serv. 2019, 50, 362–370. [Google Scholar] [CrossRef]
- Koivunen, K.; Kukkonen, S.; Lahtinen, S.; Rantala, H.; Sharmin, S. Towards deeper understanding of how people perceive design in products. In Proceedings of the Computers in Art and Design Education Conference, Malmö, Sweden, 29 June–1 July 2004; Copenhagen Business School, CBS, Denmark and Malmö University, Eriksen, M.A., Malmborg, L., Nielsen, J., Eds.; 2014. [Google Scholar]
- Guo, F.; Ding, Y.; Liu, W.; Liu, C.; Zhang, X. Can eye-tracking data be measured to assess product design? Visual attention mechanism should be considered. Int. J. Ind. Ergon. 2016, 53, 229–235. [Google Scholar] [CrossRef]
- Yang, X.; He, H.; Wu, Y.; Tang, C.; Chen, H.; Liang, J. User intent perception by gesture and eye tracking. Cogent Eng. 2016, 3, 1–10. [Google Scholar] [CrossRef]
- Yang, C.; An, F.; Chen, C.; Zhu, B. The effect of product characteristic familiarity on product recognition. In IOP Conference Series: Materials Science and Engineering; IOP Publishing: Bristol, UK, 2017; Volume 231, p. 012016. [Google Scholar] [CrossRef]
- Avanzini, C.; Mantelet, F.; Aoussat, A.; Jeanningros, F.; Bouchard, C. Evaluating Perceived Quality through Sensory Evaluation in the Development Process of New Products: A Case Study of Luxury Market. In Proceedings of the 7th International Conference on Kansei Engineering and Emotion Research. KEER 2018, Kuching, Sarawak, Malaysia, 19–22 March 2018; Lokman, A., Yamanaka, T., Lévy, P., Chen, K., Koyama, S., Eds.; Springer: Singapore, 2018; Volume 739, pp. 379–388. [Google Scholar] [CrossRef]
- Du, P.; MacDonald, E.F. Eye-Tracking Data Predict Importance of Product Features and Saliency of Size Change. J. Mech. Des. 2014, 136, 081005. [Google Scholar] [CrossRef]
- Lou, S.; Feng, Y.; Tian, G.; Lv, Z.; Li, Z.; Tan, J. A Cyber-Physical System for Product Conceptual Design Based on an Intelligent Psycho-Physiological Approach. IEEE Access 2017, 5, 5378–5387. [Google Scholar] [CrossRef]
- Kovačević, D.; Brozović, M.; Možina, K. Do prominent warnings make packaging less attractive? Saf. Sci. 2018, 110, 336–343. [Google Scholar] [CrossRef]
- Razzaghi, M.; Nouri, M. Communicative affordance of industrial design sketching. In Proceedings of the 12th International Conference on Engineering and Product Design Education: When Design Education and Design Research Meet, Trondheim, Norway, 2–3 September 2010; Boks, W., Ion, W., McMahon, C., Parkinson, B., Eds.; The Design Society: Glasgow, Scotland, 2010; pp. 150–155. [Google Scholar]
- Boa, D.R.; Ranscombe, C.; Hicks, B. Determining the similarity of products using pairwise comparisons and eye tracking. In Proceedings of the 20th International Conference on Engineering Design, ICED, Milan, Italy, 27–30 July 2015; Weber, C., Husung, S., Cascini, G., Cantamessa, M., Marjanovic, D., Rotini, F., Eds.; The Design Society: Glasgow, Scotland, 2015; Volume 5, pp. 225–234. [Google Scholar]
- Ishak, S.M.; Sivaji, A.; Tzuaan, S.S.; Hussein, H.; Bujang, R. Assessing eye fixation behavior through design evaluation of Lawi Ayam artefact. J. Teknol. 2015, 77. [Google Scholar] [CrossRef]
- Rojas, J.-C.; Contero, M.; Bartomeu, N.; Guixeres, J. Using Combined Bipolar Semantic Scales and Eye-Tracking Metrics to Compare Consumer Perception of Real and Virtual Bottles. Packag. Technol. Sci. 2015, 28, 1047–1056. [Google Scholar] [CrossRef]
- Hyun, K.H.; Lee, J.-H.; Kim, M. The gap between design intent and user response: Identifying typical and novel car design elements among car brands for evaluating visual significance. J. Intell. Manuf. 2017, 28, 1729–1741. [Google Scholar] [CrossRef]
- Kukkonen, S. Exploring eye tracking in design evaluation. In Proceedings of the Joining Forces, University of Art and Design Helsinki, Helsinki, Finland, 22–24 September 2005; pp. 119–126. [Google Scholar]
- Wang, H.; Wang, J.; Zhang, N.N.; Sun, G.B.; Huang, H.L.; Zhao, H.B. Automobile Modeling Evaluations Based on Electrophysiology. Adv. Mater. Res. 2010, 118, 454–458. [Google Scholar] [CrossRef]
- Aurup, G.M.; Akgunduz, A. Pair-Wise Preference Comparisons Using Alpha-Peak Frequencies. J. Integr. Des. Process Sci. 2012, 16, 3–18. [Google Scholar] [CrossRef]
- Boa, D.; Hicks, B.; Nassehi, A. A comparison of product preference and visual behaviour for product representations. In Proceedings of the 19th International Conference on Engineering Design (ICED13), Seoul, Korea, 19–22 August 2013; Lindemann, U., Srinivasan, V., Kim, Y.S., Lee, S.W., Clarkson, J., Cascini, G., Eds.; The Design Society: Glasgow, Scotland, 2013; Volume 7, pp. 487–496. [Google Scholar]
- Khushaba, R.N.; Wise, C.; Kodagoda, S.; Louviere, J.; Kahn, B.E.; Townsend, C. Consumer neuroscience: Assessing the brain response to marketing stimuli using electroencephalogram (EEG) and eye tracking. Expert Syst. Appl. 2013, 40, 3803–3812. [Google Scholar] [CrossRef]
- Sylcott, B.; Cagan, J.; Tabibnia, G. Understanding Consumer Tradeoffs between Form and Function Through Metaconjoint and Cognitive Neuroscience Analyses. J. Mech. Des. 2013, 135, 101002. [Google Scholar] [CrossRef]
- Ueda, K. Neural Mechanisms of Evaluation and Memory of Product. In Proceedings of the ASME 2014 International Design Engineering Technical Conferences and Computers and Information in Engineering Conference, Buffalo, NY, USA, 17–20 August 2014; ASME: New York, NY, USA, 2014; Volume 1, pp. 1–5. [Google Scholar] [CrossRef]
- Yılmaz, B.; Korkmaz, S.; Arslan, D.B.; Güngör, E.; Asyalı, M.H. Like/dislike analysis using EEG: Determination of most discriminative channels and frequencies. Comput. Methods Programs Biomed. 2014, 113, 705–713. [Google Scholar] [CrossRef] [PubMed]
- Khalighy, S.; Green, G.; Scheepers, C.; Whittet, C. Quantifying the qualities of aesthetics in product design using eye-tracking technology. Int. J. Ind. Ergon. 2015, 49, 31–43. [Google Scholar] [CrossRef]
- Rojas, J.-C.; Contero, M.; Camba, J.D.; Castellanos, M.C.; García-González, E.; Gil-Macián, S. Design Perception: Combining Semantic Priming with Eye Tracking and Event-Related Potential (ERP) Techniques to Identify Salient Product Visual Attributes. In Proceedings of the ASME 2015 International Mechanical Engineering Congress and Exposition, Houston, TX, USA, 13–19 November 2015; ASME: New York, NY, USA, 2015; Volume 11. [Google Scholar] [CrossRef]
- Telpaz, A.; Webb, R.; Levy, D.J. Using EEG to Predict Consumers’ Future Choices. J. Mark. Res. 2015, 52, 511–529. [Google Scholar] [CrossRef]
- Valencia-Romero, A.; Lugo, J.E. Part-Worth Utilities of Gestalt Principles for Product Esthetics: A Case Study of a Bottle Silhouette. J. Mech. Des. 2016, 138, 1–9. [Google Scholar] [CrossRef]
- Laohakangvalvit, T.; Ohkura, M. Relationship Between Physical Attributes of Spoon Designs and Eye Movements Caused by Kawaii Feelings. In Proceedings of the AHFE 2017 International Conference on Affective and Pleasurable Design, The Westin Bonaventure Hotel, Los Angeles, CA, USA, 17–21 July 2017; Chung, W.J., Shin, C.S., Eds.; Springer: Cham, Switzerland, 2017; Volume 585, pp. 245–257. [Google Scholar] [CrossRef]
- Li, B.R.; Wang, Y.; Wang, K.S. A novel method for the evaluation of fashion product design based on data mining. Adv. Manuf. 2017, 5, 370–376. [Google Scholar] [CrossRef]
- Nagai, Y.; Fukami, T.; Kadomatsu, S.; Tera, A. A Study on Product Display Using Eye-Tracking Systems. In Proceedings of the ICoRD 2017 International Conference on Research into Design, Guwahati, India, 9–17 January 2017; Chakrabarti, A., Chakrabarti, D., Eds.; Springer: Singapore, 2017; Volume 1, pp. 547–555. [Google Scholar] [CrossRef]
- Dogan, K.M.; Suzuki, H.; Gunpinar, E. Eye tracking for screening design parameters in adjective-based design of yacht hull. Ocean Eng. 2018, 166, 262–277. [Google Scholar] [CrossRef]
- She, J.; MacDonald, E.F. Exploring the Effects of a Product’s Sustainability Triggers on Pro-Environmental Decision-Making. J. Mech. Des. 2018, 140. [Google Scholar] [CrossRef]
- Maccioni, L.; Borgianni, Y.; Basso, D. Value Perception of Green Products: An Exploratory Study Combining Conscious Answers and Unconscious Behavioral Aspects. Sustainability 2019, 11, 1226. [Google Scholar] [CrossRef]
- Tan, Z.; Zhu, Y.; Zhao, J. Research on User’s Perceptual Preference of Automobile Styling. In Proceedings of the AHFE 2018 International Conference on Applied Human Factors and Ergonomics, Orlando, FL, USA, 21–25 July 2018; Fukuda, S., Ed.; Springer: Cham, Switzerland, 2018; Volume 774, pp. 41–52. [Google Scholar] [CrossRef]
- Carbon, C.C.; Hutzler, F.; Minge, M. Innovativeness in design investigated by eye movements and pupillometry. Psychol. Sci. 2006, 48, 173–186. [Google Scholar]
- Park, J.; DeLong, M.; Woods, E. Exploring product communication between the designer and the user through eye-tracking technology. Int. J. Fash. Des. Technol. Educ. 2012, 5, 67–78. [Google Scholar] [CrossRef]
- Lo, C.H.; Wang, I.J.; Huang, S.H.; Chu, C.H. Evaluating appearance-related product prototypes with various facial characteristics. In Proceedings of the 19th International Conference on Engineering Design, (ICED13), Seul, Korea, 19–22 August 2013; Lindemann, V., Srinivasan, Y.S., Kim, S.W., Lee, J., Clarkson, G., Cascini, G., Eds.; The Design Society: Glasgow, Scotland, 2013; Volume 7, pp. 227–236. [Google Scholar]
- Köhler, M.; Falk, B.; Schmitt, R. Applying Eye-Tracking in Kansei Engineering Method for Design Evaluations in Product Development. Int. J. Affect. Eng. 2015, 14, 241–251. [Google Scholar] [CrossRef]
- Seshadri, P.; Bi, Y.; Bhatia, J.; Simons, R.; Hartley, J.; Reid, T. Evaluations That Matter: Customer Preferences Using Industry-Based Evaluations and Eye-Gaze Data. In Proceedings of the ASME 2016 International Design Engineering Technical Conferences and Computers and Information in Engineering Conference, Charlotte, NC, USA, 21–24 August 2016; ASME: New York, NY, USA, 2016; Volume 7. [Google Scholar] [CrossRef]
- Li, W.; Wang, L.; Wang, L.; Jing, J. A model based on eye movement data and artificial neutral network for product styling evaluation. In Proceedings of the 24th International Conference on Automation & Computing (ICAC), Newcastle upon Tyne, UK, 6–7 September 2018; IEEE: Piscataway, NJ, USA, 2018; Volume 794, pp. 1–6. [Google Scholar] [CrossRef]
- Schmitt, R.; Köhler, M.; Durá, J.V.; Diaz-Pineda, J. Objectifying user attention and emotion evoked by relevant perceived product components. J. Sens. Sens. Syst. 2014, 3, 315–324. [Google Scholar] [CrossRef]
- Burlamaqui, L.; Dong, A. Eye gaze experiment into the recognition of intended affordances. In Proceedings of the ASME 2017 International Design Engineering Technical Conferences and Computers and Information in Engineering Conference IDETC/CIE 2017, Cleveland, OH, USA, 6–9 August 2017; ASME: New York, NY, USA, 2017; Volume 7. [Google Scholar] [CrossRef]
- Kim, J.; Bouchard, C.; Ryu, H.; Omhover, J.F.; Aoussat, A. Emotion finds a way to users from designers: Assessing product images to convey designer’s emotion. J. Des. Res. 2012, 10, 307–323. [Google Scholar] [CrossRef]
- Ho, C.; Lu, Y. Can pupil size be measured to assess design products? Int. J. Ind. Ergon. 2014, 44, 436–441. [Google Scholar] [CrossRef]
- Hsu, C.; Fann, S.; Chuang, M. Relationship between eye fixation patterns and Kansei evaluation of 3D chair forms. Displays 2017, 50, 21–34. [Google Scholar] [CrossRef]
- Green, A.; Chattaraman, V. Creating an Affective Design Typology for Basketball Shoes Using Kansei Engineering Methods. In Proceedings of the AHFE 2018 Advances in Intelligent Systems and Computing, Orlando, FL, USA, 24–28 July 2018; Advances in Affective and Pleasurable Design. Fukuda, S., Ed.; Springer: Cham, Switzerland, 2018; Volume 774, pp. 355–361. [Google Scholar] [CrossRef]
- Yoon, S.Y. Usability in Context: A Framework for Analyzing the Impact of Virtual Reality in Design Evaluation Context. In Proceedings of the 11th International Conference on Computer Aided Architectural Design Research in Asia, Kumamoto, Japan, 30 March–2 April 2006; pp. 371–377. [Google Scholar]
- Hsiao, S.-W.; Hsu, C.-F.; Lee, Y.-T. An online affordance evaluation model for product design. Des. Stud. 2012, 33, 126–159. [Google Scholar] [CrossRef]
- He, C.; Ji, Z.; Gu, J. Research on the Effect of Mechanical Drawings’ Different Marked Way on Browse and Search Efficiency Based on Eye-Tracking Technology. In Proceedings of the 18th International Conference on International Conference on Man-Machine-Environment System Engineering MMESE, Jinggangshan, China, 21–23 October 2017; Long, S., Dhillon, B.S., Eds.; Springer: Singapore, 2017; Volume 456, pp. 515–523. [Google Scholar] [CrossRef]
- Suzianti, A.; Rengkung, S.; Nurtjahyo, B.; Al Rasyid, H. An analysis of cognitive˗ based design of yogurt product packaging. Int. J. Technol. 2015, 6, 659. [Google Scholar] [CrossRef]
- Du, P.; MacDonald, E.F. A Test of the Rapid Formation of Design Cues for Product Body Shapes and Features. J. Mech. Des. 2018, 140, 071102. [Google Scholar] [CrossRef]
- Naef, M.; Payne, J. AutoEval mkII—Interaction design for a VR design review system. In Proceedings of the IEEE Symposium on 3D User Interfaces, Charlotte, NC, USA, 10–11 March 2007; IEEE: Piscataway, NJ, USA, 2007; pp. 45–48. [Google Scholar] [CrossRef]
- Papagiannidis, S.; See-To, E.; Bourlakis, M. Virtual test-driving: The impact of simulated products on purchase intention. J. Retail. Consum. Serv. 2014, 21, 877–887. [Google Scholar] [CrossRef]
- Ergan, S.; Radwan, A.; Zou, Z.; Tseng, H.A.; Han, X. Quantifying Human Experience in Architectural Spaces with Integrated Virtual Reality and Body Sensor Networks. J. Comput. Civ. Eng. 2019, 33, 04018062. [Google Scholar] [CrossRef]
- Valencia-Romero, A.; Lugo, J.E. An immersive virtual discrete choice experiment for elicitation of product aesthetics using Gestalt principles. Des. Sci. 2017, 3, 1–24. [Google Scholar] [CrossRef]
- Ferrise, F.; Bordegoni, M.; Graziosi, S.A. Method for designing users’ experience with industrial products based on a multimodal environment and mixed prototypes. Comput. Aided Des. Appl. 2013, 461–474. [Google Scholar] [CrossRef]
- Graziosi, S.; Ferrise, F.; Bordegoni, M.; Ozbey, O. A method for capturing and translating qualitative user experience into design specifications: The haptic feedback of appliance interfaces. In Proceedings of the 19th International Conference on Engineering Design, ICED, Seoul, Korea, 19–22 August 2013; Lindemann, U., Srinivasan, V., Yong, S.K., Lee, S.W., Clarkson, J., Cascini, G., Eds.; Design Society: Glasgow, Scotland, 2013; pp. 427–436. [Google Scholar]
- Normark, C.J.; Gustafsson, A. Design and evaluation of a personalisable user interface in a vehicle context. J. Des. Res. 2014, 12, 308–329. [Google Scholar] [CrossRef]
- Mahut, T.; Bouchard, C.; Omhover, J.F.; Favart, C.; Esquivel, D. Interdependency between user experience and interaction: A Kansei design approach. Int. J. Interact. Des. Manuf. 2018, 12, 105–132. [Google Scholar] [CrossRef]
- Mahlke, S.; Rösler, D.; Seifert, K.; Krems, J.F.; Thüring, M. Evaluation of Six Night Vision Enhancement Systems: Qualitative and Quantitative Support for Intelligent Image Processing. Human Factors: J. Hum. Factors Ergon. Soc. 2007, 49, 518–531. [Google Scholar] [CrossRef]
- Jeong, G.; Self, J. Mode-of-use Innovation in Interactive Product Development. Arch. Des. Res. 2017, 30, 41–59. [Google Scholar] [CrossRef]
- Gaspar, J.; Fontul, M.; Henriques, E.; Silva, A. User satisfaction modeling framework for automotive audio interfaces. Int. J. Ind. Ergon. 2014, 44, 662–674. [Google Scholar] [CrossRef]
- Mussgnug, M.; Lohmeyer, Q.; Meboldt, M. Raising designers’ awareness of user experience by mobile eye tracking records. In Proceedings of the 16th International Conference on Engineering and Product Design Education: Design Education and Human Technology Relations, University of Twente, Enschede, The Netherlands, 4–5 September 2014; Bohemia, E., Eger, A., Eggink, W., Kovacevic, A., Parkinson, B., Wits, W., Eds.; The Design Society: Glasgow, Scotland, 2014; pp. 99–104. [Google Scholar]
- Mussgnug, M.; Singer, D.; Lohmeyer, Q.; Meboldt, M. Automated interpretation of eye–hand coordination in mobile eye tracking recordings. Künstliche Intell. 2017, 31, 331–337. [Google Scholar] [CrossRef]
- Huang, F. Understanding user acceptance of battery swapping service of sustainable transport: An empirical study of a battery swap station for electric scooters, Taiwan. Int. J. Sustain. Transp. 2019, 1–14. [Google Scholar] [CrossRef]
- Borgianni, Y.; Maccioni, L.; Basso, D. Exploratory study on the perception of additively manufactured end-use products with specific questionnaires and eye-tracking. Int. J. Interact. Des. Manuf. IJIDeM 2019, 13, 743–759. [Google Scholar] [CrossRef]
- Gaspar, J.; Fontul, M.; Henriques, E.; Ribeiro, A.; Silva, A.; Valverde, N. Psychoacoustics of in-car switch buttons: From feelings to engineering parameters. Appl. Acoust. 2016, 110, 280–296. [Google Scholar] [CrossRef]
- Lin, F.-H.; Tsai, S.-B.; Lee, Y.-C.; Hsiao, C.-F.; Zhou, J.; Wang, J.; Shang, Z. Empirical research on Kano’s model and customer satisfaction. PLoS ONE 2017, 12, e0183888. [Google Scholar] [CrossRef]
- Hurley, R.A.; Galvarino, J.; Thackston, E.; Ouzts, A.; Pham, A. The effect of modifying structure to display product versus graphical representation on packaging. Packag. Technol. Sci. 2013, 26, 453–460. [Google Scholar] [CrossRef]
- Borgianni, Y.; Maccioni, L. Review of the use of neurophysiological and biometric measures in experimental design research. Artif. Intell. Eng. Des. Anal. Manuf. AIEDAM 2020, in press. [Google Scholar] [CrossRef]
- Nonis, F.; Dagnes, N.; Marcolin, F.; Vezzetti, E. 3D Approaches and Challenges in Facial Expression Recognition Algorithms—A Literature Review. Appl. Sci. 2019, 9, 3904. [Google Scholar] [CrossRef]
- Pusiol, G.; Esteva, A.; Hall, S.S.; Frank, M.; Milstein, A.; Fei-Fei, L. Vision-Based Classification of Developmental Disorders Using Eye-Movements. In Proceedings of the international Conference on Medical Image Computing and Computer-Assisted Intervention MICCAI, Shenzhen, China, 13–17 October 2016; Ourselin, S., Joskowicz, L.M., Sabuncu, R., Unal, G., Wells, W., Eds.; Springer: Cham, Switzerland, 2016; Volume 9901, pp. 317–325. [Google Scholar] [CrossRef]
- Kok, E.M.; Jarodzka, H. Before your very eyes: The value and limitations of eye tracking in medical education. Med. Edu. 2017, 51, 114–122. [Google Scholar] [CrossRef]
- Fox, S.E.; Faulkner-Jones, B.E. Eye-tracking in the study of visual expertise: Methodology and approaches in medicine. Front. Learn. Res. 2017, 5, 43–54. [Google Scholar] [CrossRef]
- Mark, J.; Curtin, A.; Kraft, A.; Sands, T.; Casebeer, W.D.; Ziegler, M.; Ayaz, H. Eye Tracking-Based Workload and Performance Assessment for Skill Acquisition. In Proceedings of the AHFE 2019 International Conference on Neuroergonomics and Cognitive Engineering, Washington, DC, USA, 24–28 July 2019; Ayaz, H., Ed.; Springer: Cham, Switzerland, 2019; Volume 953, pp. 129–141. [Google Scholar] [CrossRef]
- Montero Perez, M. Pre-learning vocabulary before viewing captioned video: An eye-tracking study. Lang. Learn. J. 2019, 47, 460–478. [Google Scholar] [CrossRef]
- Stone, A.; Bosworth, R.G. Exploring Infant Sensitivity to Visual Language using Eye Tracking and the Preferential Looking Paradigm. J. Vis. Exp. JoVE 2019, 147, 1–9. [Google Scholar] [CrossRef] [PubMed]
- Gerpott, F.H.; Lehmann-Willenbrock, N.; Silvis, J.D.; Van Vugt, M. In the eye of the beholder? An eye-tracking experiment on emergent leadership in team interactions. Leadersh. Q. 2018, 29, 523–532. [Google Scholar] [CrossRef]
- Foulsham, T.; Dewhurst, R.; Nyström, M.; Jarodzka, H.; Johansson, R.; Underwood, G. Holmqvist, K. Comparing scanpaths during scene encoding and recognition: A multi-dimensional approach. J. Eye Mov. Res. 2012, 5, 1–14. [Google Scholar] [CrossRef]
- Petersen, H.; Nielsen, J. The eye of the user: The influence of movement on users’ visual attention. Digit. Creat. 2002, 13, 109–121. [Google Scholar] [CrossRef]
- Hernández-Méndez, J.; Muñoz-Leiva, F. What type of online advertising is most effective for eTourism 2.0? An eye tracking study based on the characteristics of tourists. Comput. Hum. Behav. 2015, 50, 618–625. [Google Scholar] [CrossRef]
- Berni, A.; Maccioni, L.; Borgianni, Y. An Eye-Tracking supported investigation into the role of forms of representation on design evaluations and affordances of original product features. In Proceedings of the Design Society: DESIGN Conference, Cavtat, Croatia, 18–21 May 2020. [Google Scholar]
- Del Fatto, V.; Dignös, A.; Raimato, G.; Maccioni, L.; Borgianni, Y.; Gamper, J. Visual time period analysis: A multimedia analytics application for summarizing and analyzing eye-tracking experiments. Multimed. Tools Appl. 2019, 78, 32779–32804. [Google Scholar] [CrossRef]
- Van Os, G.; van Beurden, K. Emogram: Help (student) design researchers understanding user emotions in product design. In Proceedings of the 21st International Conference on Engineering and Product Design Education (E&PDE 2019), University of Strathclyde, Glasgow, UK, 12–13 September 2019. [Google Scholar] [CrossRef]
- Tornincasa, S.; Vezzetti, E.; Moos, S.; Violante, M.G.; Marcolin, F.; Dagnes, N.; Ulrich, L.; Fantini Tregnaghi, G. 3D Facial Action Units and Expression Recognition using a Crisp Logic. Comput. Aided Des. Appl. 2019, 16, 256–268. [Google Scholar] [CrossRef]
- Nigam, R.; Kumar, N.; Mondal, S. Emotion detection of human face. Int. J. Eng. Adv. Technol. 2019, 9, 5521–5524. [Google Scholar] [CrossRef]
- Jaiswal, S.; Virmani, S.; Sethi, V.; De, K.; Roy, P.P. An intelligent recommendation system using gaze and emotion detection. Multimed. Tools Appl. 2019, 78, 14231–14250. [Google Scholar] [CrossRef]


| Stimuli | Form of Representation | User Experience | Satisfaction | Cognitive Perception | Preferences | Attractiveness | Value Perception | Affordances | Emotions |
|---|---|---|---|---|---|---|---|---|---|
| Static | Text | [1,13] | [13] | [14] | [1,15] | ||||
| Static | Images | [1,7,13,16,17,18,19,20] | [2,16,21,22,23] | [19,20,24,25,26,27,28] | [14,18,21,29,30,31,32,33,34,35,36,37,38,39,40,41,42,43,44,45,46,47] | [1,15,16,17,18,20,22,23,25,37,40,41,42,44,48,49,50,51,52,53] | [22,24,38,54] | [26,42,55] | [34,47,51,54,56,57,58,59] |
| Static | Text + Images | [2,7,8,13,60,61] | [2,8,62] | [8,13] | [14,34] | [8] | [8] | [34] | |
| Dynamic | Video | [7] | |||||||
| Dynamic | Text + Video | [7,13] | [13] | ||||||
| Dynamic | Virtual Prototype | [2] | [2,22] | [17,63,64] | |||||
| Dynamic | Virtual Reality | [60,65,66,67] | [60,66] | [27,67,68] | [68] | [27,67,68] | [66] | [6,67] | |
| Physical | Augmented Reality/ Mixed Reality/ Mixed Prototype | [2,69,70,71] | [2,71] | [72] | [69,70] | [71] | [72] | ||
| Physical | Prototype | [13,73] | [73,74] | [13] | [74] | [6,73] | [6,74] | ||
| Physical | End-use product | [20,75,76,77,78,79] | [75,78,80,81] | [20,75,80] | [45,75,80,82] | [20,75,79,82] | [20,75] | [79] | [75,78] |
| Product | AOI ID | AOI Name | Reason Behind Studying the AOI |
|---|---|---|---|
| Equilibrium | A | Hand | It suggests where/how the user should hold/handle the product |
| Equilibrium | B | Hinge-1 | Thanks to this feature, the product can perform its original function |
| Equilibrium | C | Hinge-2 | Thanks to this feature, the product can perform its original function |
| Equilibrium | D | Fruit | It is the object on which the product’s main function is performed |
| Equilibrium | E | Water | It is the object that undergoes the product’s main function |
| Flame | F | Pot | It is the object on which the product’s main function is performed |
| Flame | G | Flame | Thanks to this feature, the product can perform its original function |
| Flame | H | Handle | It suggests where/how the user should hold/handle the product |
| Stairs | I | User | It suggests how the user should use the product |
| Stairs | J | Frame-1 | Thanks to this feature, the product can perform its original function |
| Stairs | K | Frame-2 | Thanks to this feature, the product can perform its original function |
| Stairs | L | Stairs | It is the object that performs the product’s main function |
| OnPot | M | Hand | It suggests where/how the user should hold/handle the product |
| OnPot | N | Cap | It is the object on which the product’s main function is performed |
| OnPot | O | OnPot | It is the object that performs the product’s main (and original) function |
| Hood | P | Hood | It is the object that performs the product’s main (and original) function |
| Hood | Q | Steam-1 | It is the object on which the product’s main function is performed |
| Hood | R | Steam-2 | It is the object on which the product’s main function is performed |
| Tire | S | Rim | It is a structural part that makes it possible to understand the product better |
| Tire | T | Tire | It is the object that performs the product’s main (and original) function |
| Tire | U | Nail-1 | It is an object that makes it possible to understand the product’s original function |
| Tire | V | Nail-2 | It is an object that makes it possible to understand the product’s original function |
| Tire | W | Nail-3 | It is an object that makes it possible to understand the product’s original function |
| Product | AOI ID | AOI Name | Form | TVD Sum | TVD Average | TVD SD | TVD Diff% | Significant Increase |
|---|---|---|---|---|---|---|---|---|
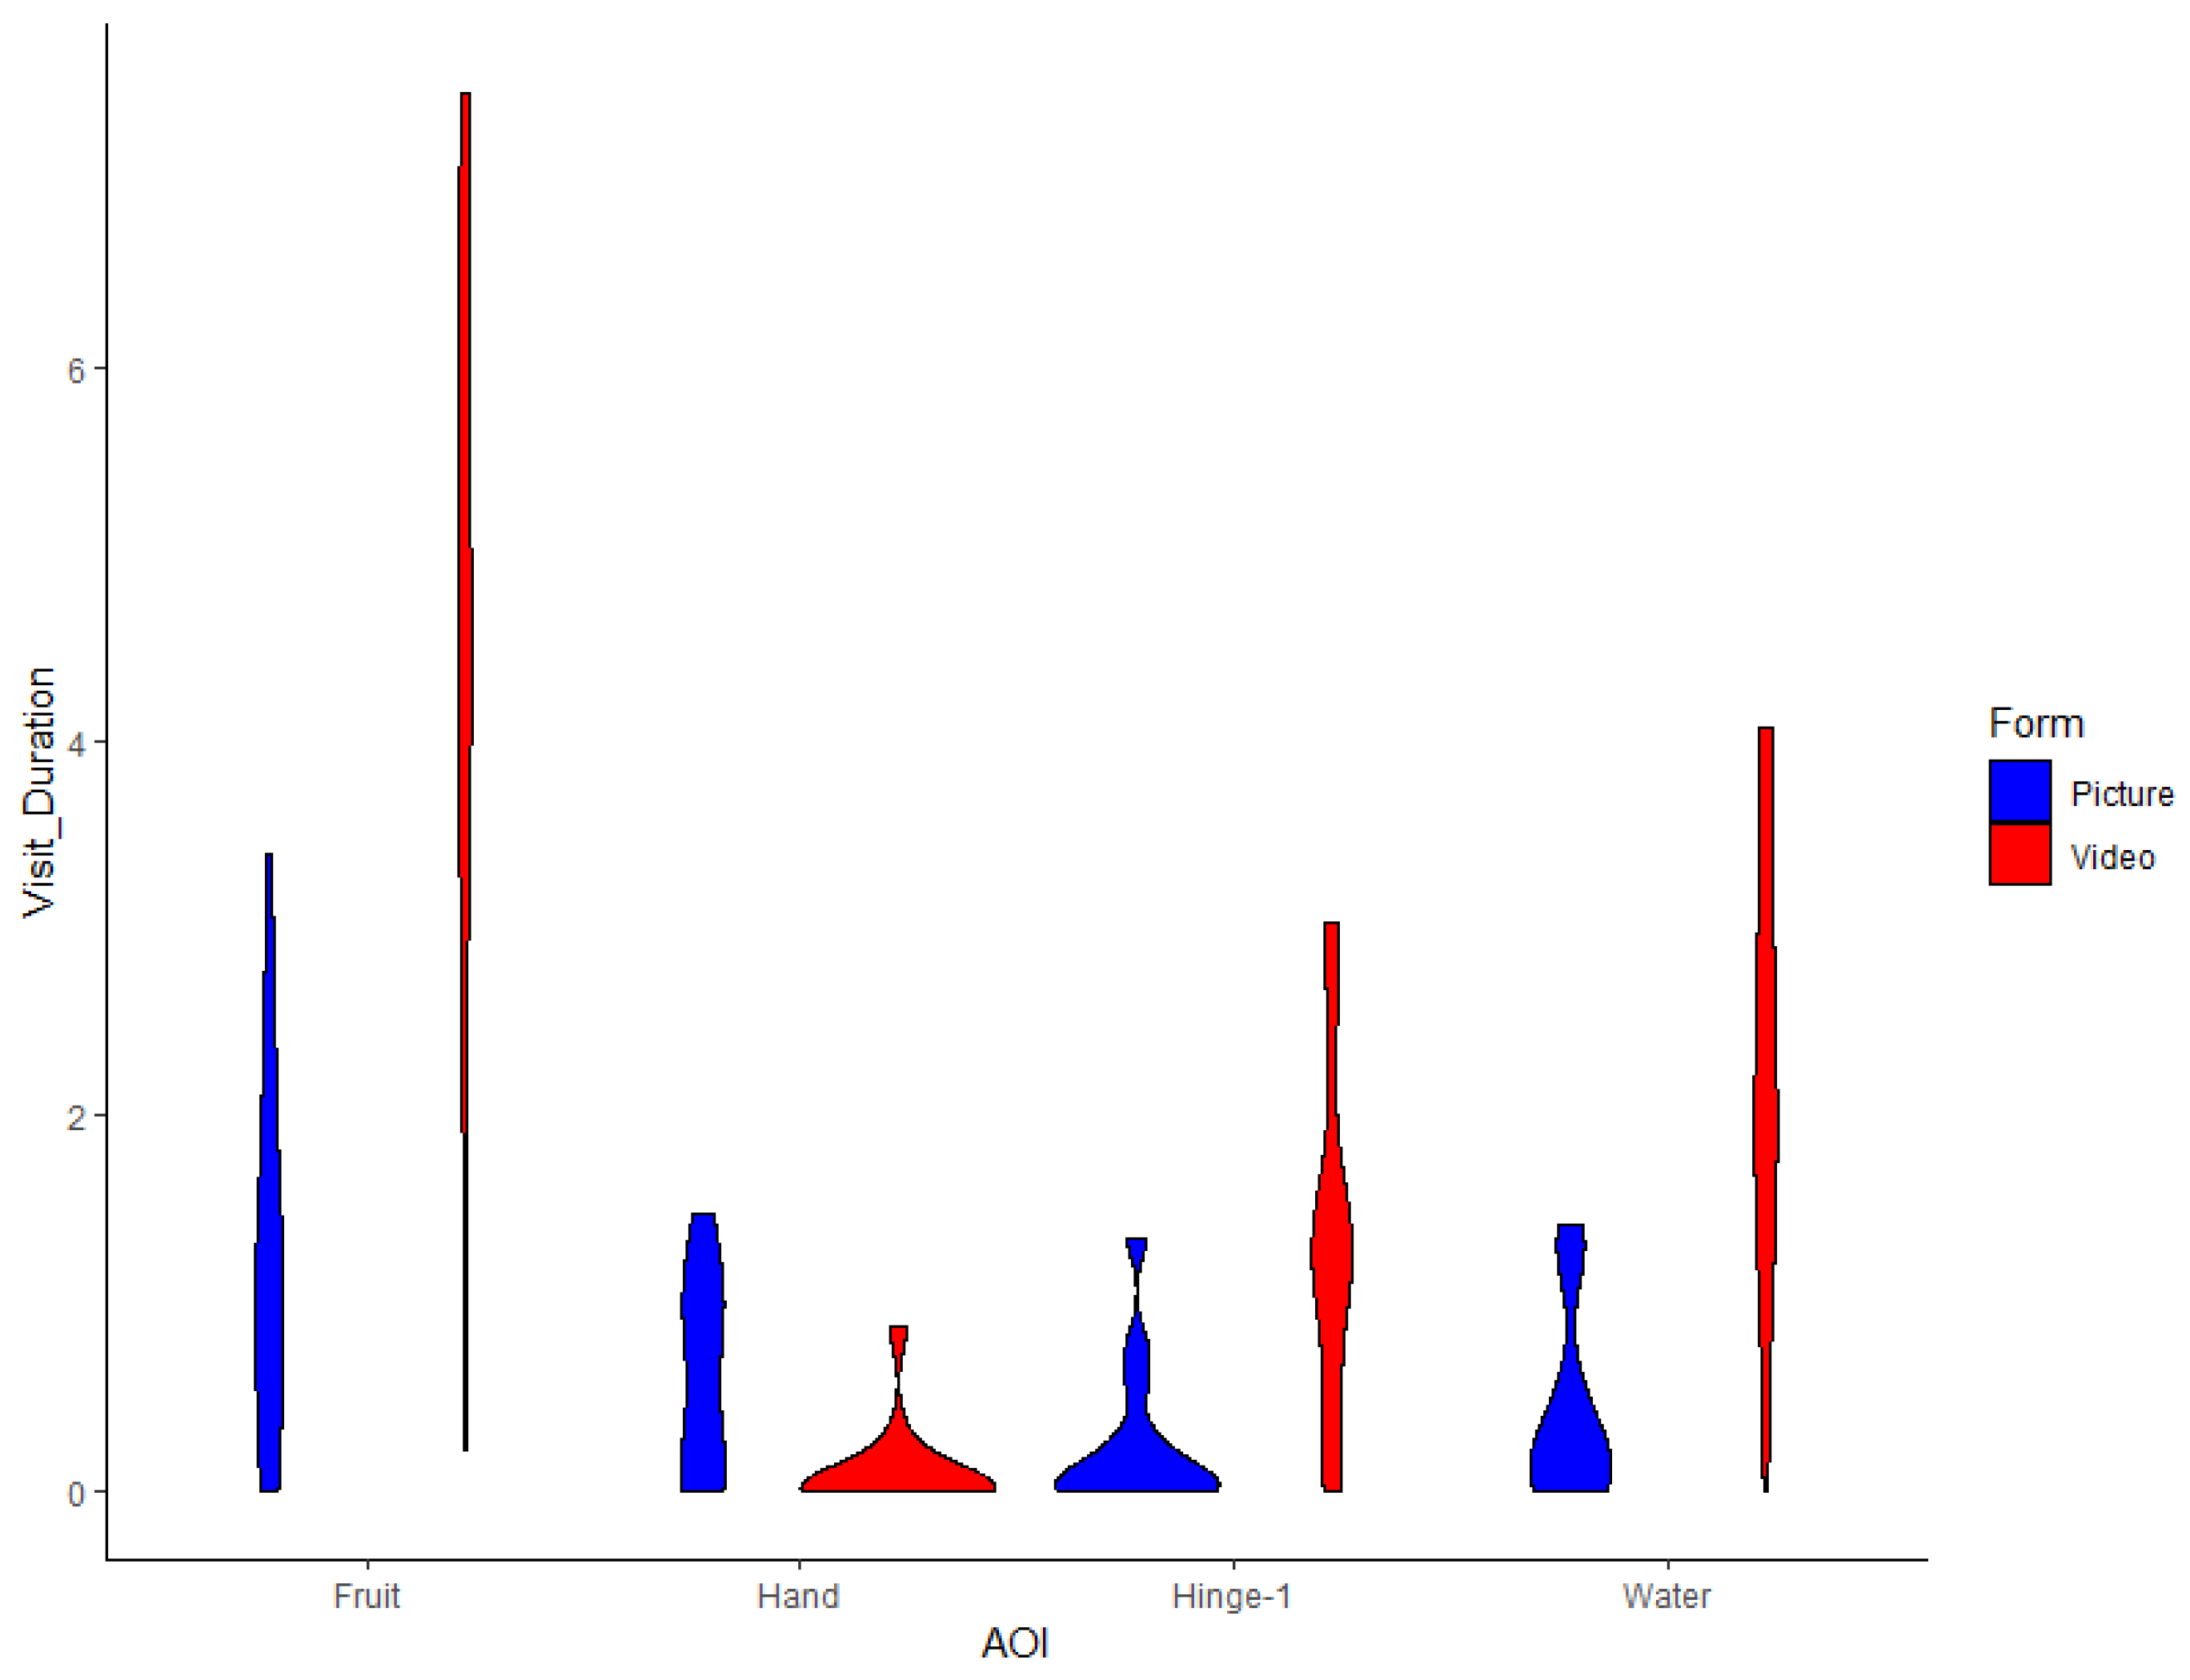
| Equilibrium | A | Hand | Picture | 8.57 | 0.61 | 0.51 | +591 | ** |
| Equilibrium | A | Hand | Video | 1.24 | 0.09 | 0.23 | −86 | |
| Equilibrium | B | Hinge-1 | Picture | 3.43 | 0.25 | 0.38 | −82 | |
| Equilibrium | B | Hinge-1 | Video | 18.77 | 1.34 | 0.92 | +447 | *** |
| Equilibrium | C | Hinge-2 | Picture | 1.76 | 0.13 | 0.28 | +53 | |
| Equilibrium | C | Hinge-2 | Video | 1.15 | 0.08 | 0.13 | −35 | |
| Equilibrium | D | Fruit | Picture | 17.44 | 1.25 | 0.95 | −73 | |
| Equilibrium | D | Fruit | Video | 65.76 | 4.70 | 2.06 | +277 | *** |
| Equilibrium | E | Water | Picture | 5.79 | 0.41 | 0.50 | −82 | |
| Equilibrium | E | Water | Video | 32.00 | 2.29 | 1.14 | +453 | *** |
| Flame | F | Pot | Picture | 9.57 | 0.68 | 0.90 | +28 | |
| Flame | F | Pot | Video | 7.45 | 0.53 | 0.59 | −22 | |
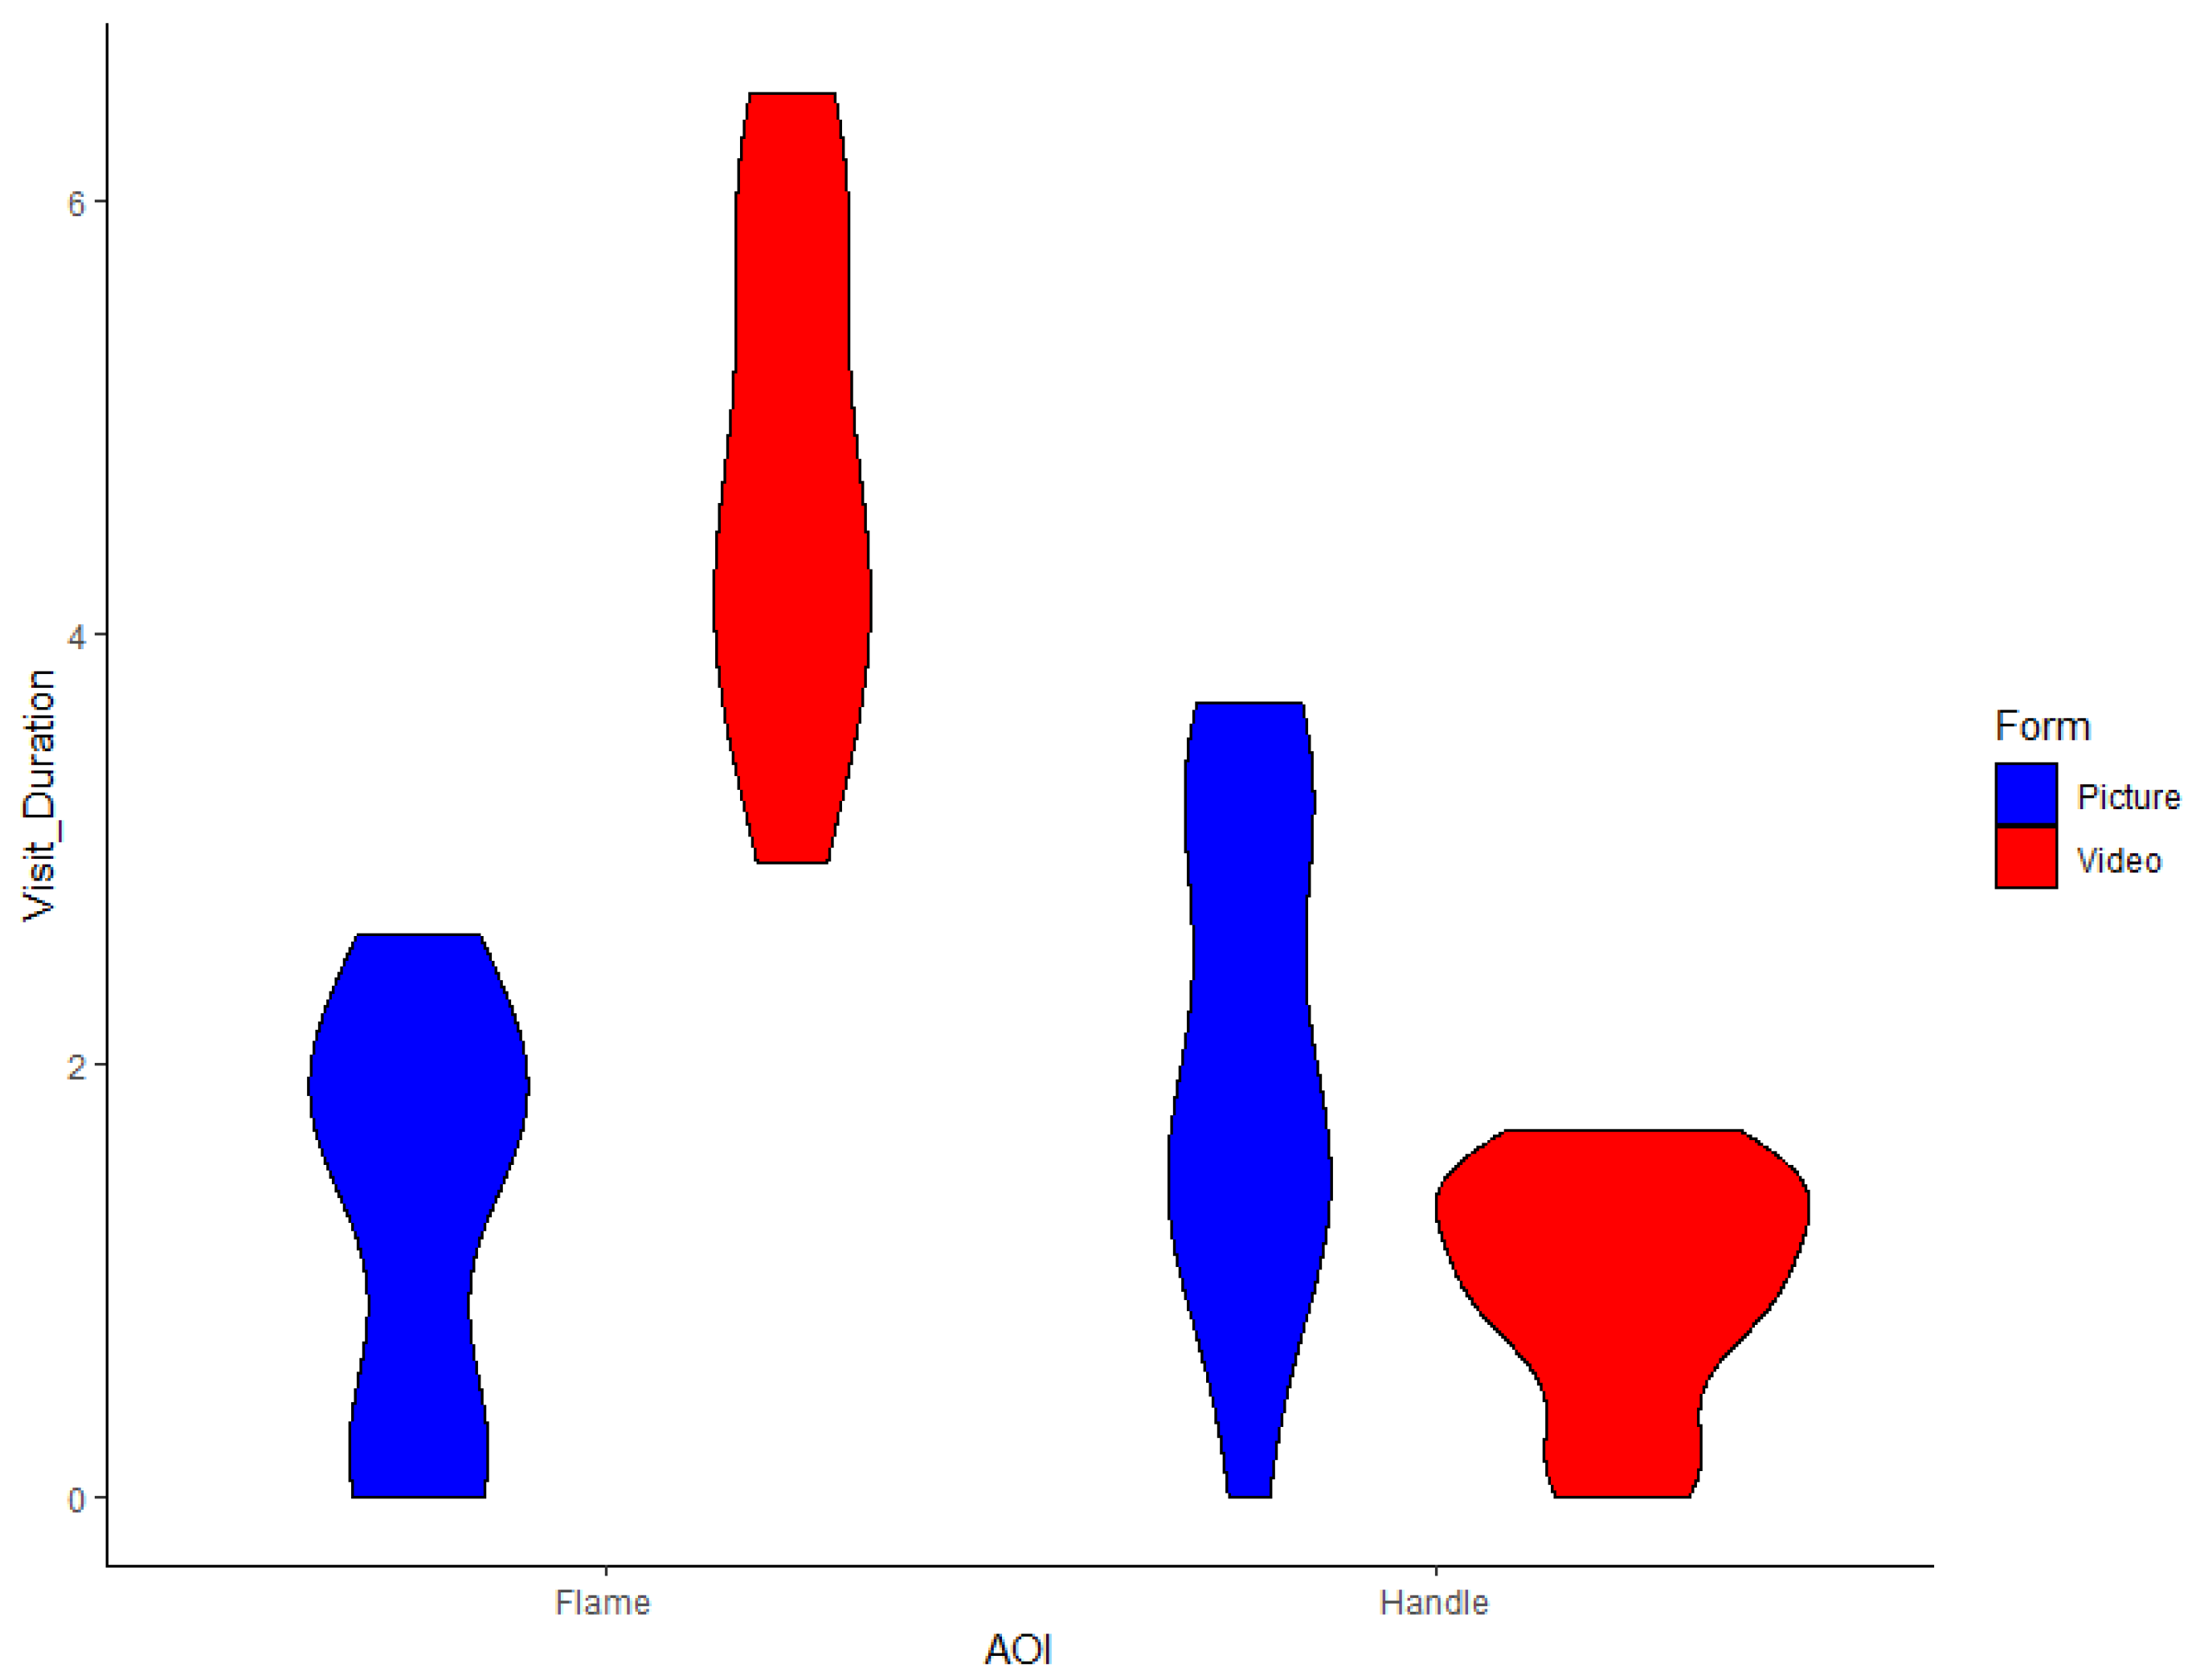
| Flame | G | Flame | Picture | 18.76 | 1.34 | 0.91 | −72 | |
| Flame | G | Flame | Video | 66.19 | 4.73 | 1.09 | +253 | *** |
| Flame | H | Handle | Picture | 29.09 | 2.08 | 1.09 | +109 | ** |
| Flame | H | Handle | Video | 13.92 | 0.99 | 0.52 | −52 | |
| Stairs | I | User | Picture | 14.10 | 1.01 | 0.37 | −26 | |
| Stairs | I | User | Video | 19.04 | 1.36 | 1.06 | +35 | |
| Stairs | J | Frame-1 | Picture | 4.32 | 0.31 | 0.42 | +13 | |
| Stairs | J | Frame-1 | Video | 3.81 | 0.27 | 0.29 | −12 | |
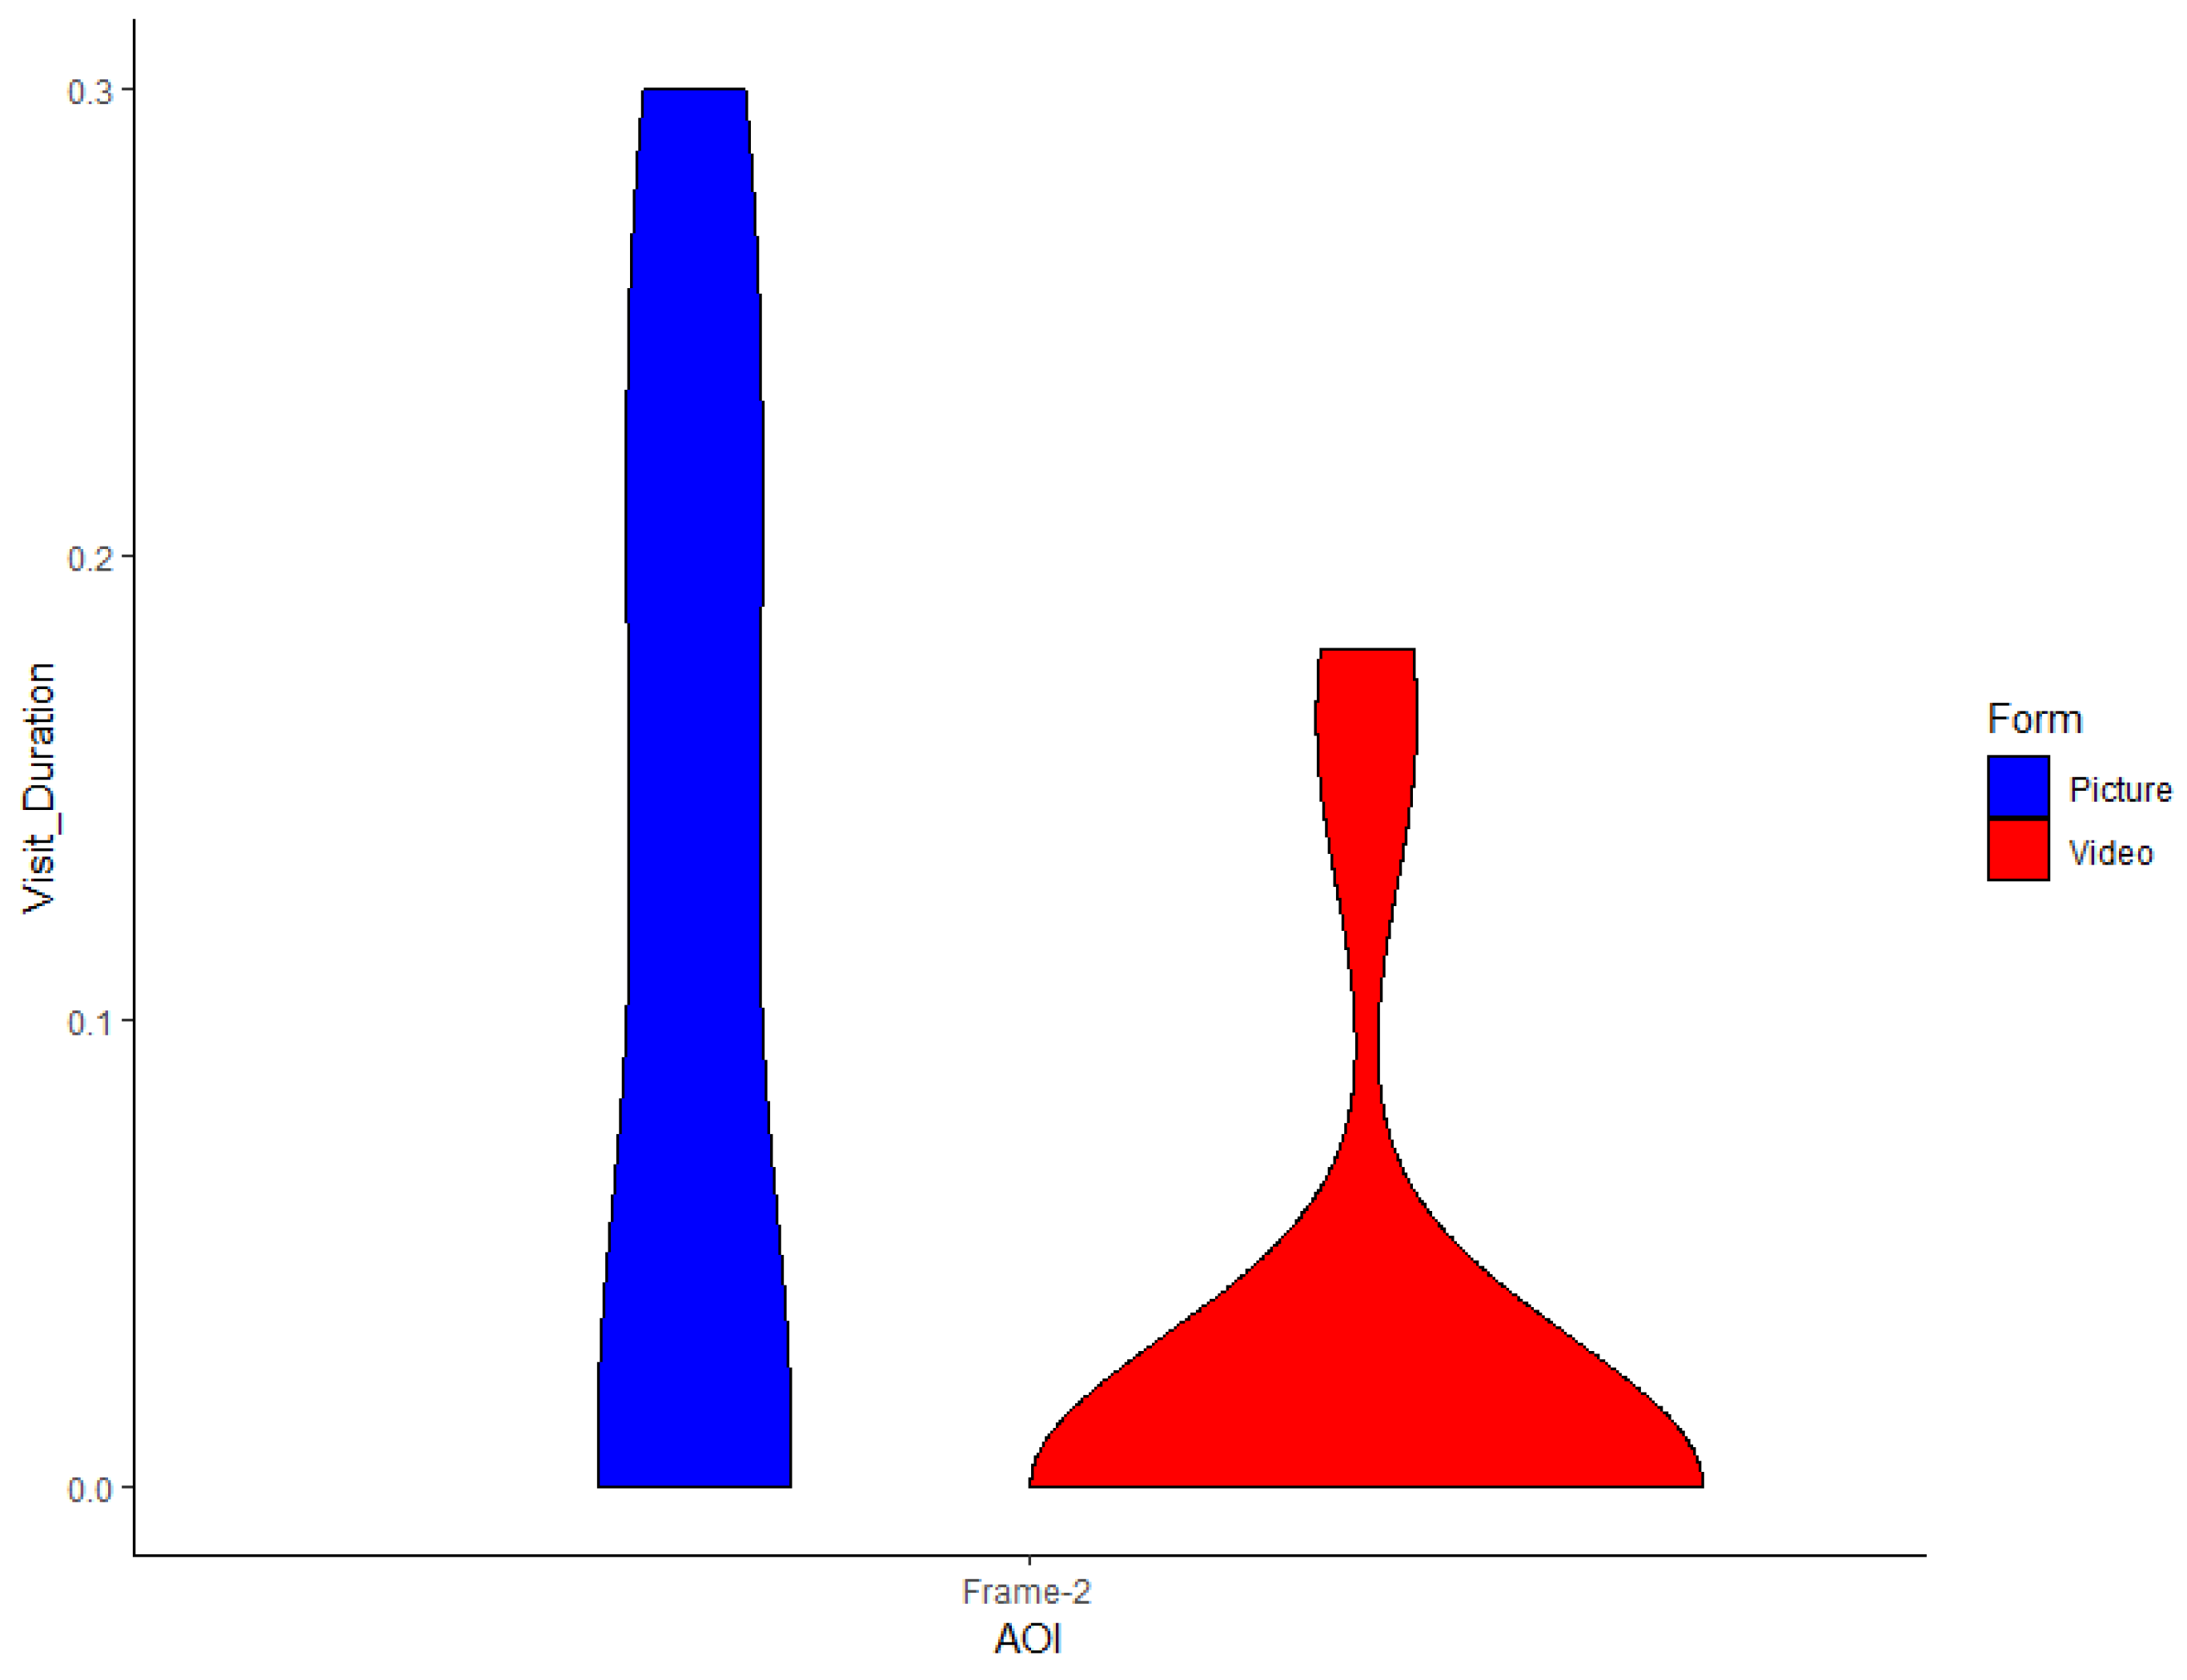
| Stairs | K | Frame-2 | Picture | 1.61 | 0.12 | 0.11 | +388 | * |
| Stairs | K | Frame-2 | Video | 0.33 | 0.02 | 0.06 | −80 | |
| Stairs | L | Stairs | Picture | 31.27 | 2.23 | 1.69 | +13 | |
| Stairs | L | Stairs | Video | 27.72 | 1.98 | 1.05 | −11 | |
| OnPot | M | Hand | Picture | 9.06 | 0.65 | 0.63 | −23 | |
| OnPot | M | Hand | Video | 11.76 | 0.84 | 0.52 | +30 | |
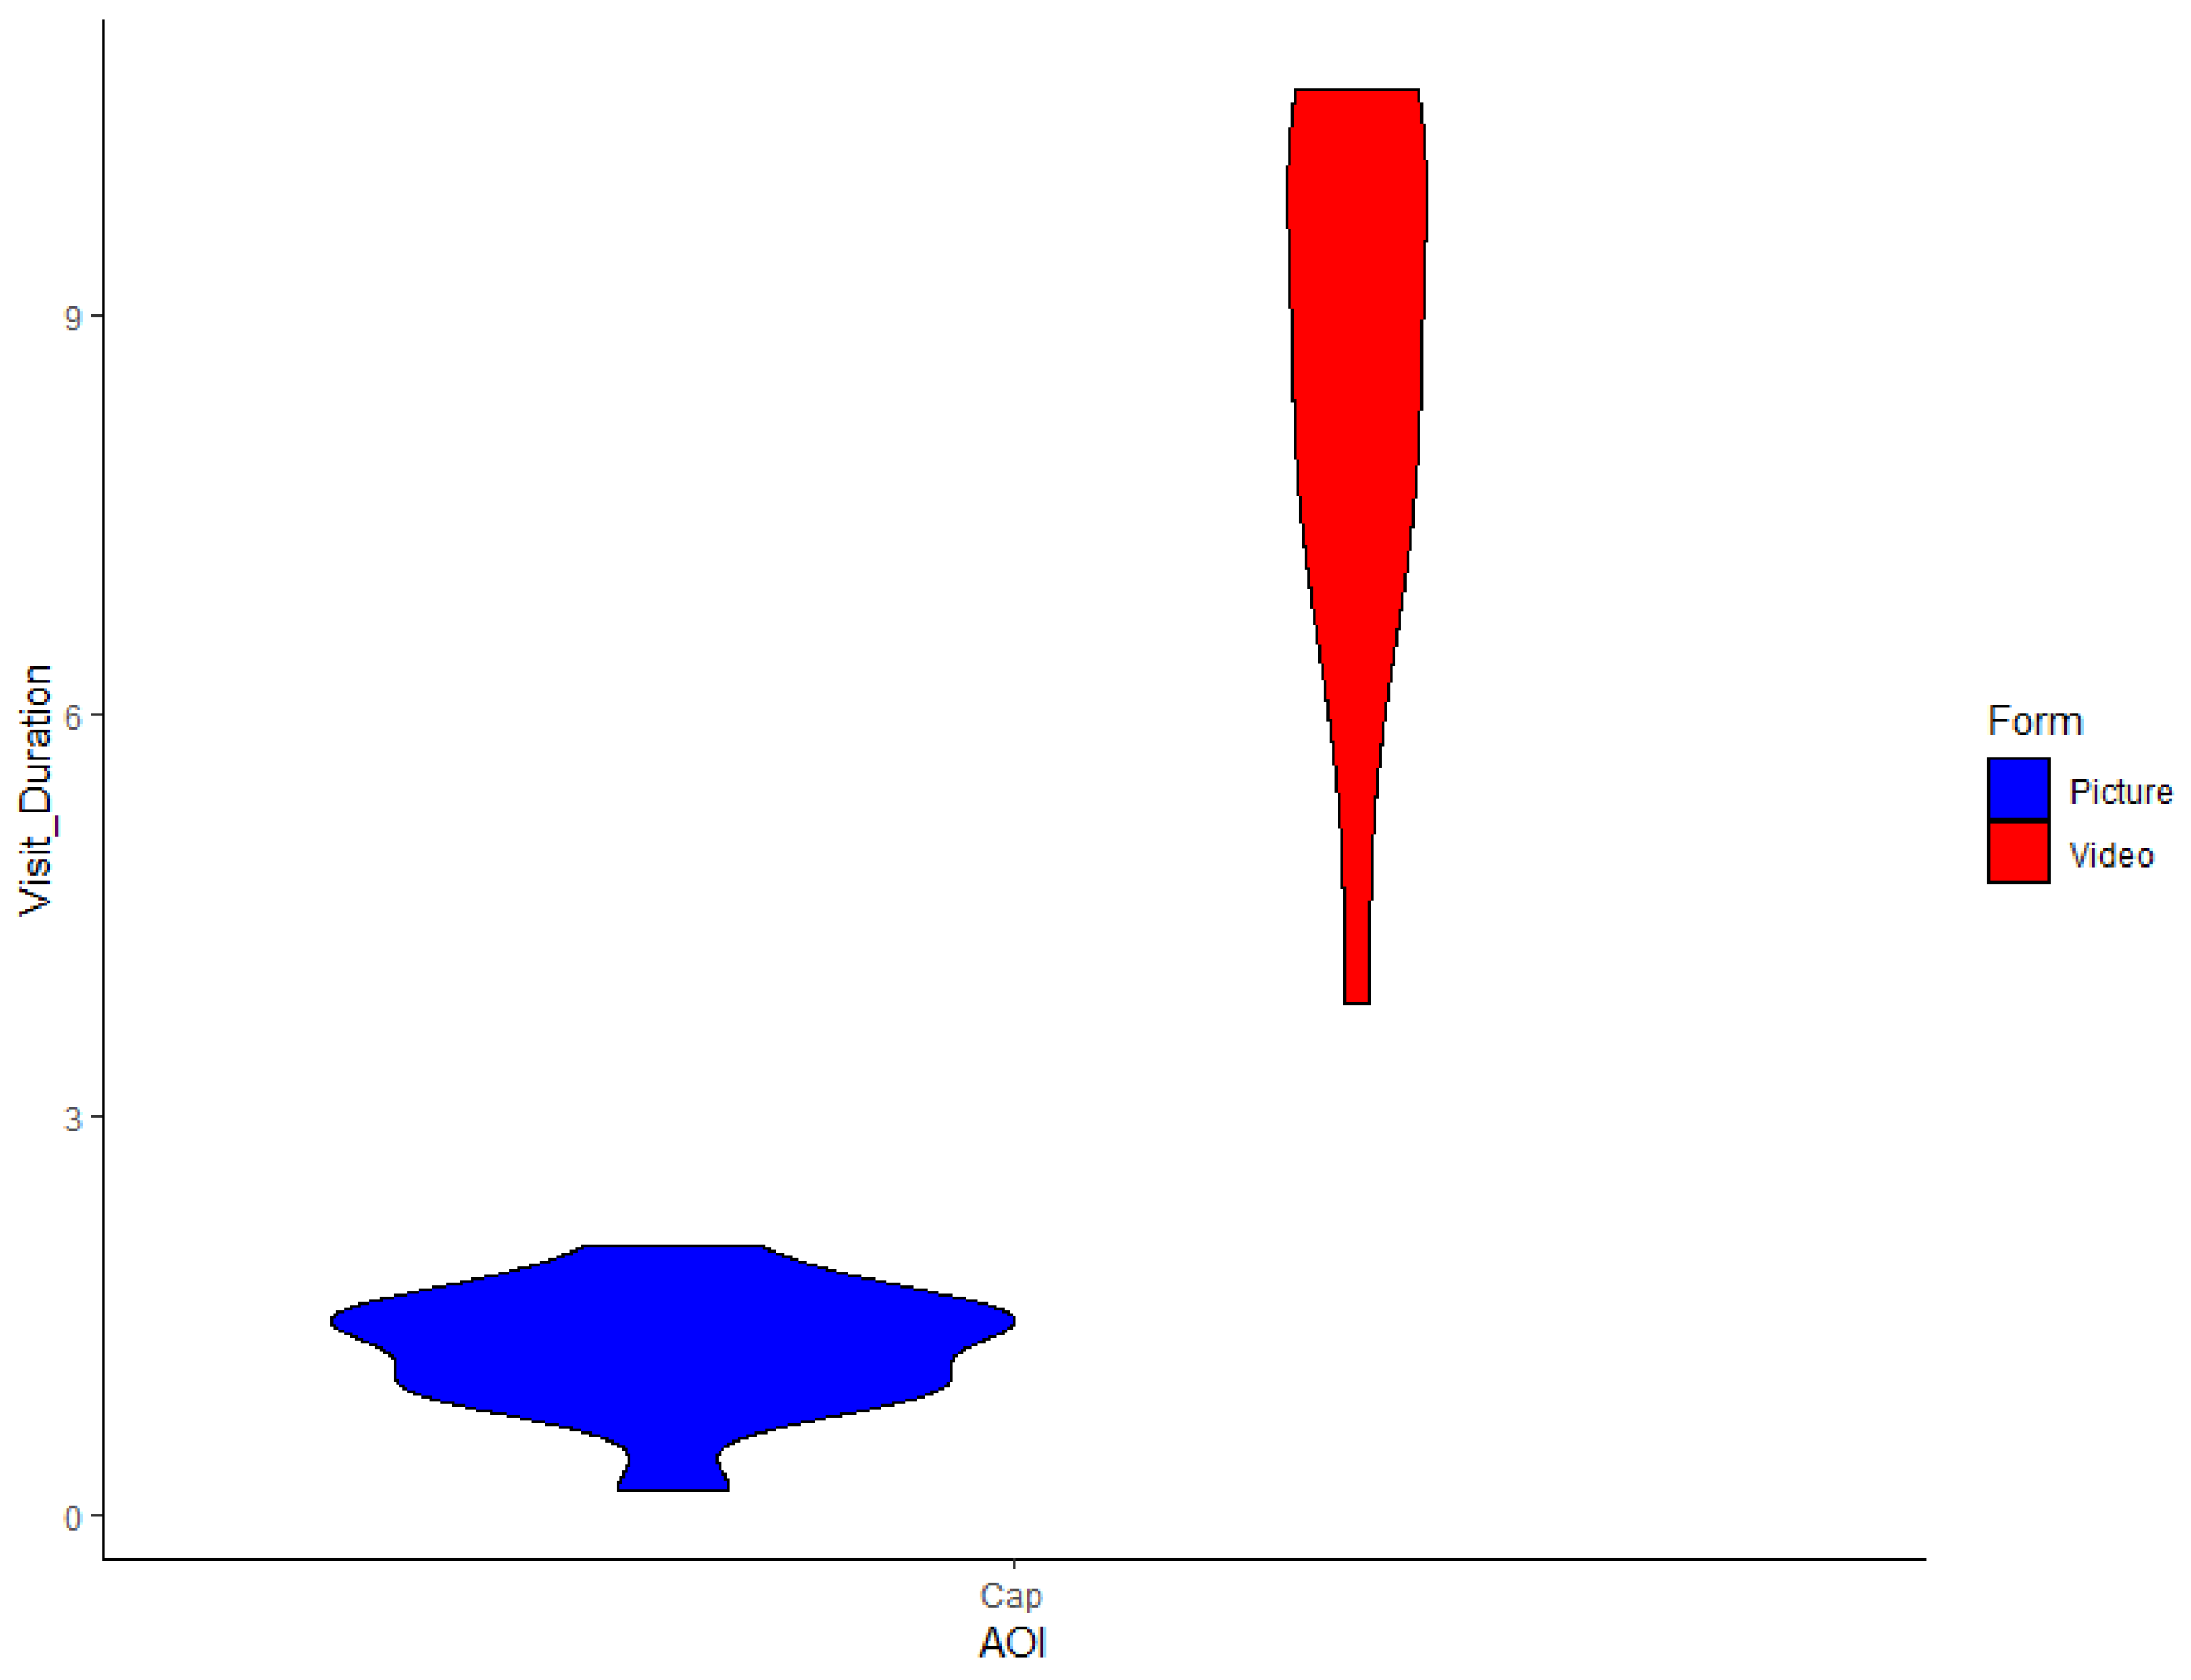
| OnPot | N | Cap | Picture | 17.58 | 1.26 | 0.44 | −85 | |
| OnPot | N | Cap | Video | 119.60 | 8.54 | 1.95 | +580 | *** |
| OnPot | O | Onpot | Picture | 58.13 | 4.15 | 1.23 | +49 | ** |
| OnPot | O | Onpot | Video | 39.13 | 2.80 | 1.15 | −33 | |
| Hood | P | Hood | Picture | 13.74 | 0.98 | 0.52 | −74 | |
| Hood | P | Hood | Video | 53.53 | 3.82 | 1.86 | +290 | *** |
| Hood | Q | Steam-1 | Picture | 13.41 | 0.96 | 0.95 | −59 | |
| Hood | Q | Steam-1 | Video | 32.81 | 2.34 | 1.2 | +145 | ** |
| Hood | R | Steam-2 | Picture | 4.76 | 0.34 | 0.53 | −15 | |
| Hood | R | Steam-2 | Video | 5.60 | 0.40 | 0.36 | +18 | |
| Tire | S | Rim | Picture | 12.94 | 0.92 | 0.54 | −66 | |
| Tire | S | Rim | Video | 37.86 | 2.70 | 1.16 | +193 | *** |
| Tire | T | Tire | Picture | 69.03 | 4.93 | 1.24 | −57 | |
| Tire | T | Tire | Video | 159.29 | 11.38 | 2.51 | +131 | *** |
| Tire | U | Nail-1 | Picture | 4.02 | 0.29 | 0.32 | −39 | |
| Tire | U | Nail-1 | Video | 6.58 | 0.47 | 0.45 | +64 | |
| Tire | V | Nail-2 | Picture | 7.82 | 0.56 | 0.49 | −65 | |
| Tire | V | Nail-2 | Video | 22.54 | 1.61 | 0.71 | +188 | *** |
| Tire | W | Nail-3 | Picture | 0.00 | 0.00 | 0.00 | −100 | |
| Tire | W | Nail-3 | Video | 0.59 | 0.04 | 0.13 | − |
© 2020 by the authors. Licensee MDPI, Basel, Switzerland. This article is an open access article distributed under the terms and conditions of the Creative Commons Attribution (CC BY) license (http://creativecommons.org/licenses/by/4.0/).
Share and Cite
Berni, A.; Maccioni, L.; Borgianni, Y. Observing Pictures and Videos of Creative Products: An Eye Tracking Study. Appl. Sci. 2020, 10, 1480. https://doi.org/10.3390/app10041480
Berni A, Maccioni L, Borgianni Y. Observing Pictures and Videos of Creative Products: An Eye Tracking Study. Applied Sciences. 2020; 10(4):1480. https://doi.org/10.3390/app10041480
Chicago/Turabian StyleBerni, Aurora, Lorenzo Maccioni, and Yuri Borgianni. 2020. "Observing Pictures and Videos of Creative Products: An Eye Tracking Study" Applied Sciences 10, no. 4: 1480. https://doi.org/10.3390/app10041480
APA StyleBerni, A., Maccioni, L., & Borgianni, Y. (2020). Observing Pictures and Videos of Creative Products: An Eye Tracking Study. Applied Sciences, 10(4), 1480. https://doi.org/10.3390/app10041480