1. Introduction
Currently, many wearable devices make use of the photoplethysmography (PPG) to measure some physiological parameters, such as as heart rate [
1], blood pressure [
2], oxygen saturation [
3], and left ventricular ejection time (LVET) [
4]. However, motion artifacts and other different types of noise will easily corrupt the PPG signals, especially when these devices are used in an intense physical activity. When the corrupted PPG signals are acquired and processed to measure certain specific physiological parameters for medical decision, the accuracy of these parameters would be reduced. This result would let physicians make some serious consequences.
Unfortunately, the PPG signal is often measured under a motion status for the most PPG applications [
5]. Due to this reason, some signal processing methods, such as the independent component analysis [
6], empirical mode decomposition [
7], wavelet transform [
8], and adaptive filtering [
9], have been employed to detect or reduce the motion artifacts from the corrupted PPG signals. It is found that the undesired motion artifact is overlapped on the dominant frequency components of the PPG signal [
10]. This is a big challenge to process the overlapped phenomenon when the PPG signal was used to measure the physiological parameters. In a real application, the accuracy of the different physiological parameters measured from the PPG signal would be affected according to the types and degrees of motion artifacts; for example, the heart rate measurement needs the accurate main peak of the PPG signal, and the oxygen saturation measurement needs the accurate amplitude of the PPG signal. However, these types of motion artifacts usually depend on the sensor’s placed position, body gesture, respiration rate and involuntary tremor. So, a comprehensive approach to assess the quality of the PPG signal for measuring physiological parameters needs to be addressed.
Since the PPG signal represents the change of blood volume in the peripheral artery, its waveform bears regular morphological characteristics [
11,
12]. The quality of the PPG signal will affect the accuracy of physiological parameters detected by the PPG sensors [
13,
14]. Therefore, when the PPG signals are used to measure these parameters, the value of its signal quality index (SQI) may be used to quantify the corruption of PPG pulses. Liu et al. have employed the fuzzy rules to determine the SQI [
15], and Fischer et al. have applied the characteristics of PPG waveform and the decision tree to classify the SQI [
16]. Li et al. have used the Bayesian hypothesis testing method to analyze the SQI [
5]. However, these techniques all require manually setting the thresholds of characteristics of the PPG pulse to classify its quality.
Kubicek et al. have proposed a non-invasive measurement technique to measure the cardiac hemodynamic parameters using the impedance cardiography (ICG) method [
17]. High-frequency current signals are inputted through the surface electrodes to detect changes in the capacitive impedance of the thoracic cavity caused by heart beats in order to assess the stroke volume (SV) [
18]. In the SV calculation with the ICG technology, LVET is one of important parameters that is measured by the ICG signal. However, when the ICG signal has a low signal-to-noise ratio and motion artifacts, the accuracy of LVET is frequently reduced. Liu et al. have used a PPG sensor placed on the neck to measure the LVET [
4]. Their results show that the LVET measured by a good PPG signal is more accurate than that by a good ICG signal. Therefore, they manually select the good PPG pulses to measure the LVET.
According to previous mentions, the higher the SQI of the PPG signal, the more accurate the physiological parameters measured by the PPG signal. Thus, the purpose of this study is to develop a new SQI algorithm to access the quality of PPG pulse. The PPG pulse with the higher SQI would be utilized to measure the cardiac SV. This SQI algorithm fundamentally consists of pre-process and post-process steps. The pre-process step used the rule-based method to delete the severe corrupted pulses, and the post-process step applied the self-constructing neural fuzzy inference network (SoNFIN) to determine the level of SQI for each PPG pulse. A commercial medical device, medis
® CS2000, using the ICG technique was used to measure the SV as the reference. Ten healthy adult males participated in this experiment. The beat-to-beat SVs were measured by our device [
4] and medis
® CS2000 about three minutes, simultaneously. Then, we used the error rate of measuring SVs to define the levels of SQI for each PPG pulse. The error rate represents the accuracy of SV measurement. The results showed that the SVs measured by the PPG pulses with the higher SQIs had the lower error than SVs by the PPG pulses with the lower SQIs.
2. Stroke Volume (SV) Measurement
From the ICG signals, cardiac SV can be calculated by the following equation proposed by Kubicek [
16]:
where
rhob is the blood impedance that is assumed to be a constant value of 150 ohm-cm,
L is the distance between the neck and chest electrodes,
Z0 is the impedance of thoracic cavity, and d
Z⁄d
t(max) is the maximum change of the ICG impedance signal. According to Equation (1), the SV has an absolute linear relationship with the LVET and d
Z⁄d
t(max). Liu et al. have proved that the PPG signal was better than ICG signal to measure the LVET [
4].
Figure 1 shows the relationship of four signals, including the ICG, differential ICG (DICG), PPG, and differential PPG (DPPG) signals. In the DPPG signal, the LVET is defined as the time interval between the first zero crossing point and the minimum point. Therefore, the corrupted PPG signal will undoubtedly affect the accuracy of the LVET measurement.
3. Signal Quality Index Algorithm
In the study, an SQI algorithm was developed to find out whether a PPG pulse was high quality or not. The flowchart of the proposed algorithm consists of several process steps, including the digital filtering, the Gaussian filtering, the segmentation, the pre-process, the parameter extraction, the post-process, and the SQI calculation, as shown in
Figure 2. Our designed ICG device was described in reference [
4], in which analog ICG and PPG signals all were digitalized with a 500 Hz sampling frequency. The PPG signal would be filtered to remove the wandering noise of the baseline and the high-frequency noise using a second-order Butterworth bandpass filter in which the lower and upper cutoff frequencies were 0.2 Hz and 10 Hz, respectively. A Gaussian filter was adopted smoothing the PPG signal. The smoothed PPG signal without the motion artifact is similar to a sinusoidal signal. Thus, we segmented the PPG pulse according to the sinusoidal signal. The rigorously corrupted PPG pulses would be detected and deleted in the pre-process procedure. Four parameters were extracted from the smoothed PPG pulse, which were used to determine the level of SQI for each PPG pulse with the SoNFIN algorithm. The levels were high, middle, and low.
3.1. Smoothing of PPG Signal
Obviously, the primary peak of the PPG pulse looked similar to a Gaussian curve. By using the Gaussian filter, the PPG pulse was smoothed before proceeding with the segmentation procedure. According to Equation (2), the smoothed PPG pulses,
r, could be derived as shown in
Figure 3.
where
G is the Gaussian curve and
y is the PPG signal. A Gaussian curve,
G(
n), is described in Equation (3),
where
n is between –(L − 1)/2 and (L − 1)/2, σ is (L − 1)/2α,
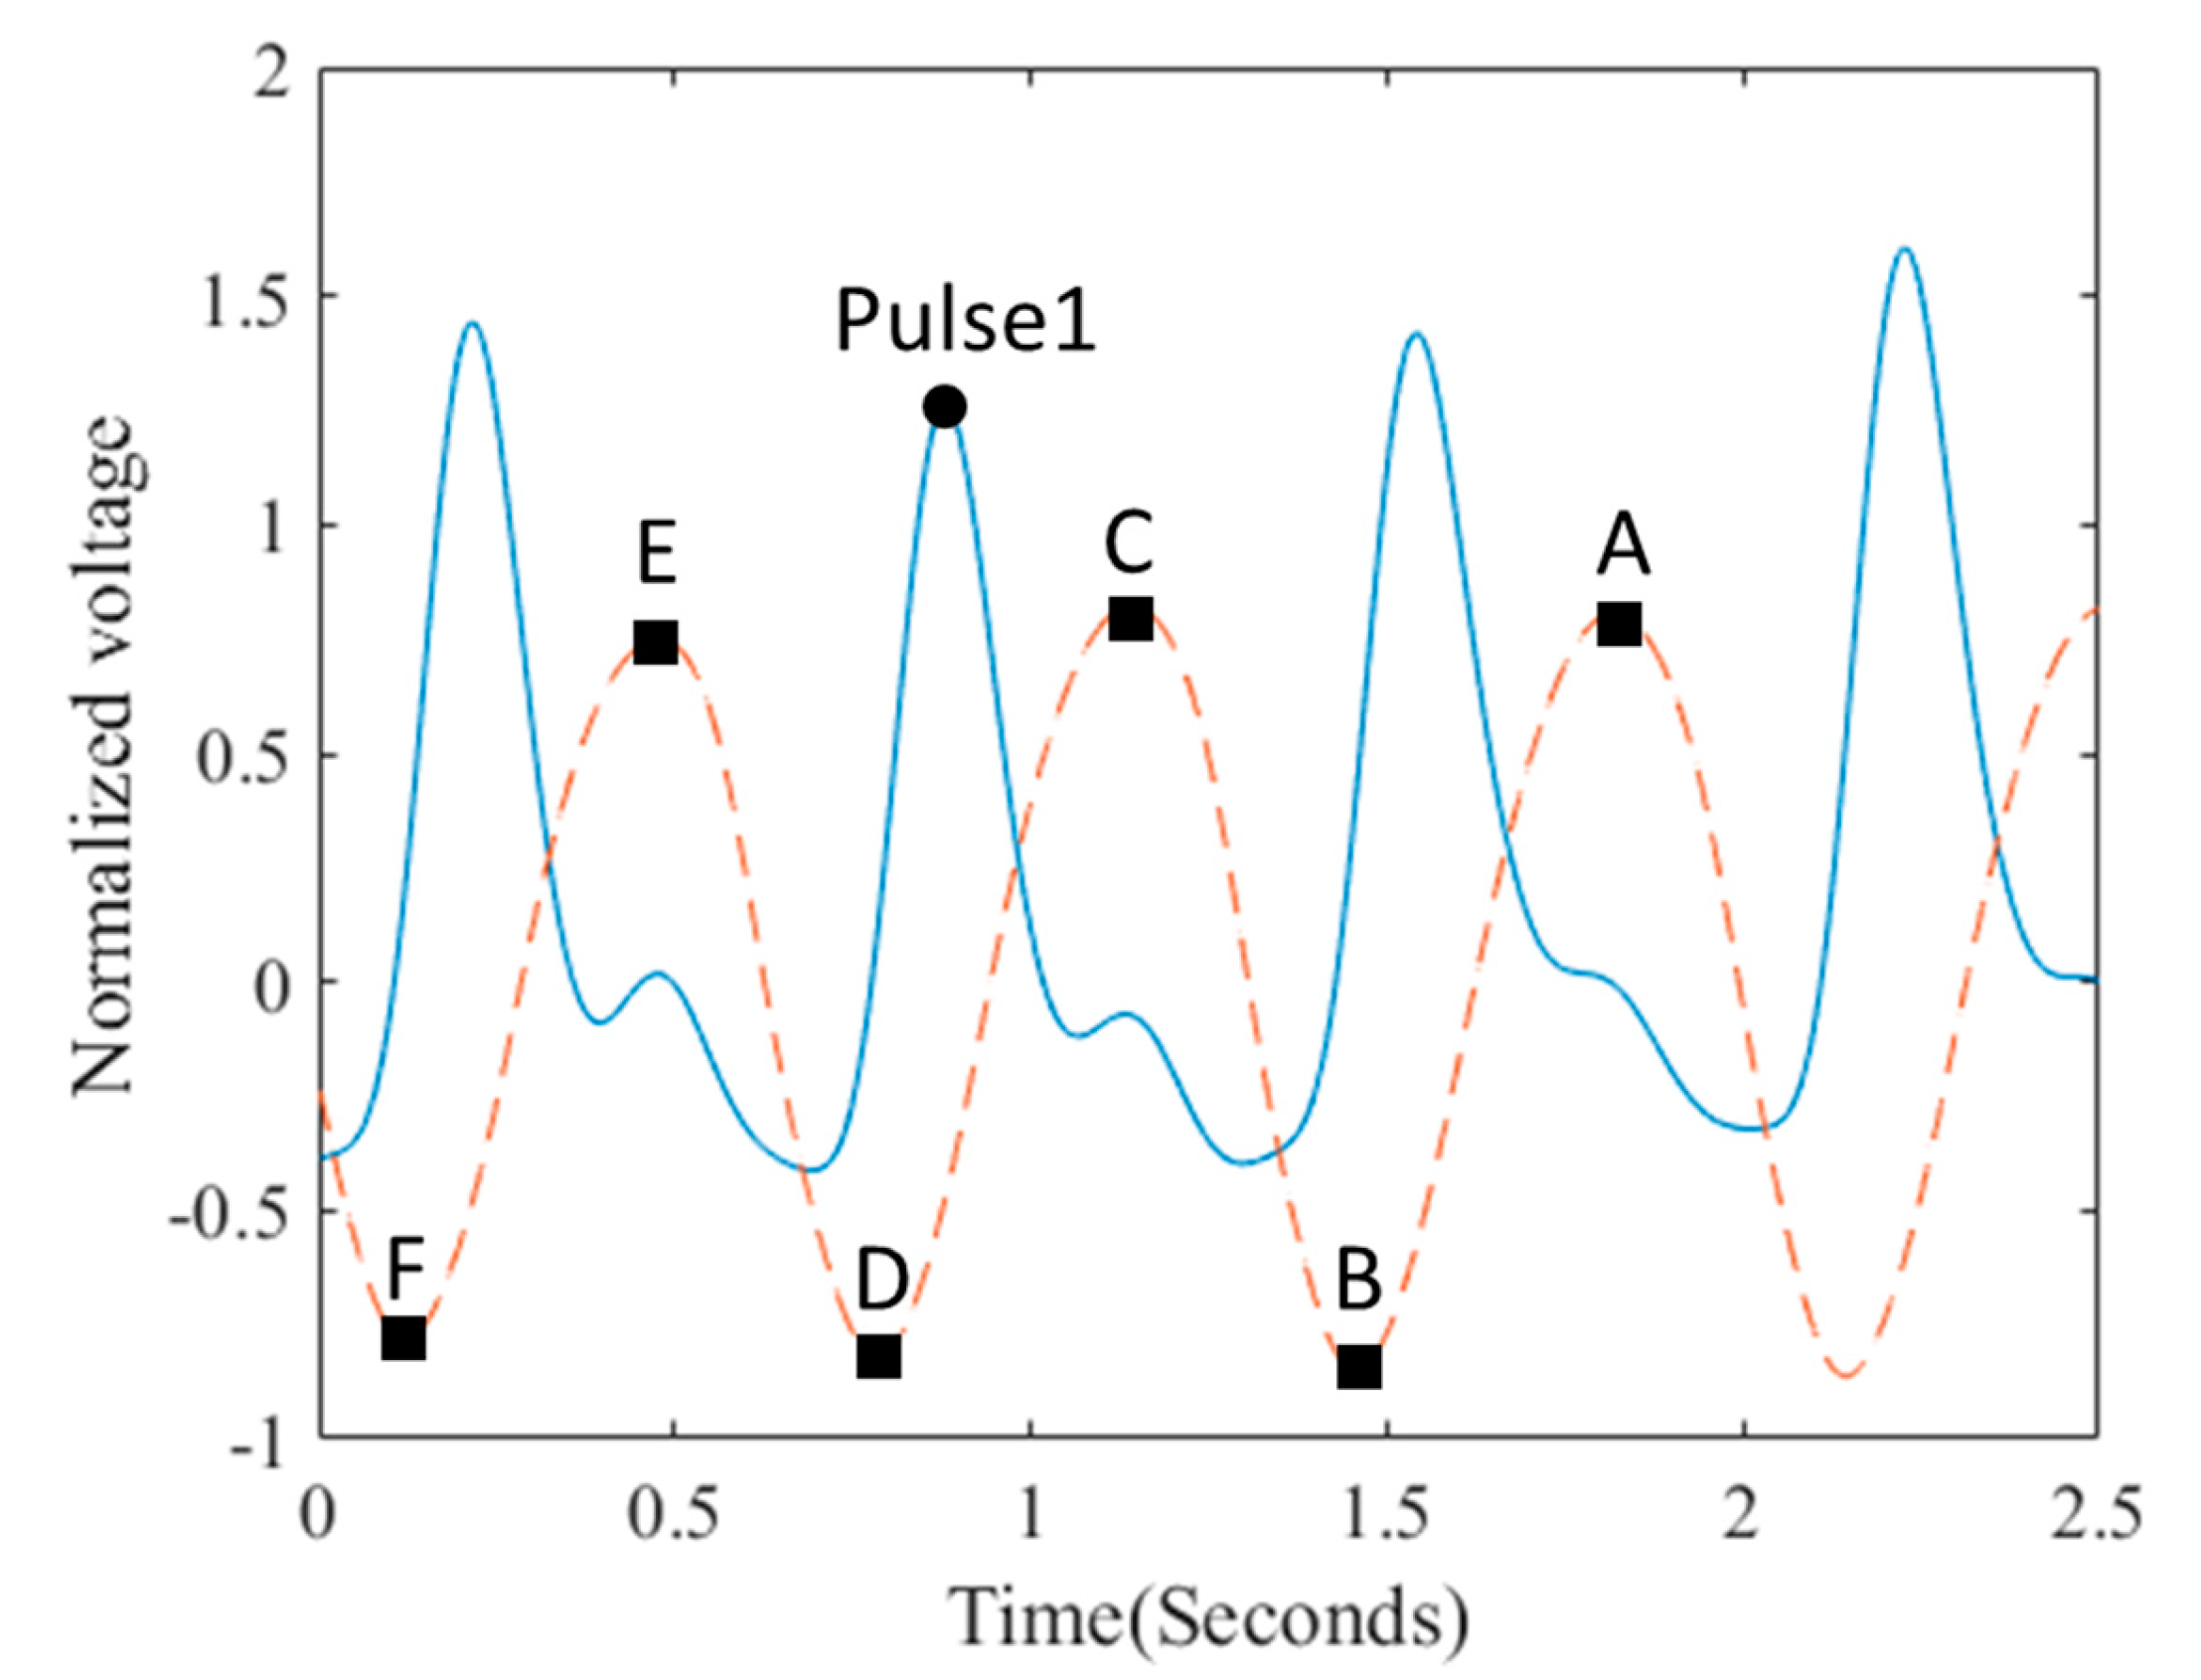
L is the width of the curve, and α is the regulating factor. In our study, L is 450 points and α is 2.5. From the smoothed PPG signal, the maximum peak and minima valley of the PPG pulse could be found at the duration between D and B points, as shown in
Figure 3. Then, a PPG pulse was segmented.
3.2. Pre-Process
The PPG pulses were segmented from the smoothed PPG signal according to the previous mentioned procedure. However, the Gaussian filter cannot be affected by the wandering noise. In
Figure 4, the PPG signal (solid line) is corrupted by the wandering noise, but its smoothed signal (dashed line) is same as the smoothed PPG signal without the wandering noise. Therefore, in the pre-process, the segmented pulses must be verified regarding whether their baselines were corrupted by the wandering noise or not. If the PPG pulse is corrupted by the wandering noise, it will be deleted. As shown in
Figure 4, when the peak and two side valleys of a PPG pulse have the same signs, or the two side valleys have different signs, this PPG pulse is considered to be owning severe wandering noise, and it is deleted.
3.3. Parameter Extraction
In the study, four significant parameters were extracted from the original and smoothed PPG pulses. The four parameters included the number of zero crossing points for the differential PPG pulse, the difference ratio for the intervals of two PPG pulses, the difference ratio for the magnitudes of two smoothed pulses, and the smoothness for the peak of the smoothed pulse. These four parameters that could describe the signal quality of a specific PPG pulse were used as the input vector of the SONFIN to classify the SQIs of PPG pulses. The number of zero crossing points was found from the beginning of the differential PPG pulse to 300 ms after the main peak of the PPG pulse. Once the three continuous pulses were distinguished from the PPG signal, both Interval1 and Interval2 were found, as shown in
Figure 5a. In the study, the difference ratio of intervals (dI) can be computed with Equation (4):
when the magnitudes of two smoothed PPG were found, the difference ratio of magnitude (dM) is defined by Equation (5):
where M1 is the magnitude between the levels C and D, and M2 is the magnitude between the levels C and E for the smoothed PPG signal, as shown in
Figure 5b.
The smoothness for the peak of the smoothed pulse was to use a mask curve according to Equation (6) to calculate two correlation coefficients between the mask curve and the points B and C of the smoothed PPG signal, respectively. The smaller correlation coefficient would be adopted as the parameter of smoothness.
3.4. Post-Process
In the post-process, the SQIs of the PPG pulses were classified by a SoNFIN [
19]. SoNFIN is a five-layer fuzzy neural network, whose fundamental framework is shown in
Figure 6. In addition, the fuzzy model of the SoNFIN can be represented by the following expression [
20]:
where
xi is the input variable,
yj is the output variable,
Aij is a fuzzy set, and
is the traditional TSK model. The five layers are described in detail as follows.
Layer 1: No computation is performed in this layer. Each node in this layer corresponds to one input variable. Only input values containing the four parameters are transmitted forward to the next layer directly:
Layer 2: For the fuzzy set
Aij, a Gaussian membership function is used to describe the degree that the input variable
xj belongs to the
i-th fuzzy set. Its mathematical function is defined as follows:
where
mij and
σij are the center and width of the membership function, respectively. This function is implemented by each node.
Layer 3: A node in this layer represents one fuzzy logic rule and performs the precondition matching of a rule. Here, we employ the following product operation for each Layer 3 node:
Layer 4: Nodes in this layer are called the consequent nodes. Each node is linked to Layer 3 output, and the linear association of the weights in this layer is as follows:
Layer 5: Each node in this layer corresponds to one output variable. The node integrates all the actions recommended by Layer 5 and acts as a defuzzifier with
The number of output nodes is equal to that of classification. In the study, the number of the output node is one, and its value represents SQI.
Two types of training (structure and parameter training) were used concurrently to construct the SoNFIN. Initially, there were no rules in the SoNFIN, with all rules constructed by the online structure training. For the structure training, a predefined threshold, H, was used as a criterion for the generation of fuzzy rules. When the output of Layer 3 was below H for every rule, a new rule was generated. Therefore, more rules were generated for a larger value of H. The initial width of each generated Gaussian fuzzy set was decided by a predefined constant σ. To train the parameters, the objective is to minimize the error function (
Verror),
where
d is the designed output. The consequent part and the fuzzy-set parameters were tuned by a recursive least-squares algorithm and a gradient-descent algorithm, respectively. The details of the training algorithm were found elsewhere [
19]. In the study, the threshold
H was set to 10
−11, the initial value of the parameter
σ was set to 0.05, and 2000 times of iteration were performed in the training procedure. The consequent learning rate was set to 0.001.
4. Experimental Protocol
This study recruited 10 healthy male subjects without cardiovascular disease or injured limbs. Their age was between 22 and 27 years (23.5 ± 1.7 years, mean ± standard deviation), weight was between 49 and 96 Kg (66.0 ± 13.1 Kg), and height was between 163 and 185 cm (172.6 ± 5.8 cm). A commercial medical device (medis® CS2000, medis, Ilmenau, Germany) with the ICG technology was utilized to measure the beat-to-beat SV that would be considered as the reference value in the study. This experiment was approved by the Research Ethics Committee of China Medical University & Hospital (No. CMUH107-REC3-061), Taichung, Taiwan.
The measurement duration for each subject lasted for three minutes. During the measurement, four electrodes of medis
® CS2000 were placed at the left side of body. The other four electrodes of our designed ICG device were put at the right side of body, and the PPG sensor was arranged upon the right carotid artery, as shown in
Figure 7. The details of the measurement for the placement of those ICG electrodes were found elsewhere [
4]. We would synchronize the beats of medis
® CS2000 and our ICG device.
5. Statistical Analysis
The quantitative data are expressed as mean ± SD. The SV for each heartbeat measured with the medis® CS2000 device was used as reference. In the study, when the error percentage between the SV measured by our ICG device and the SV measured by the medis® CS2000 device was less than 40%, such a PPG pulse was considered to be of high quality. There were 1007 pulses. When the error percentage was between 40% and 45%, such a PPG pulse was considered to be of middle quality, there were 71 pulses. When the error percentage was larger than 45%, such a PPG pulse was considered to be of low quality. There were 388 pulses. With the proposed algorithm, a PPG pulse was considered true positive (TP) if its quality level was correctly identified, false positive (FP) if its quality level was incorrectly identified, true negative (TN) if its quality level was correctly rejected, and false negative (FN) if its quality level was incorrectly rejected. Here, the performance of the proposed algorithm was evaluated using accuracy, (TP + TN)/(TP + FP + FN + TN), precision, TP/(TP + FP), sensitivity, TP/(TP + FN), and specificity, TN/(FN + TN).
7. Discussion
The main peak of the pulse and the dicrotic notch on the down slope of each cycle are the two primary characteristics for the contour of each PPG pulse. However, when PPG pulses are used to measure the heart rate and oxygen saturation, previous studies always focus on whether the main peak of the PPG pulse is clear and the baseline is drifted or not [
10,
14,
16]. The reason is that the amplitude of pulsatile waveform and the baseline are used to measure the peripheral oxygen saturation [
3]. Thus, they used the rule-based algorithms to determine the SQI of each PPG pulse. The quality level of each PPG pulse was defined by experts in a manual fashion. However, in the validation of their algorithms, a direct comparison of performance between two published algorithms is restricted because the cognitive abilities of experts are different. Thus, the main characteristics of the PPG pulse for the high SQI depends on the measuring physiological parameters. In our study, we adopt a kind of expert system, SoNFIN, to evaluate the quality level of each individual PPG pulse, and the SVs measured by our ICG device are compared with those (as reference) by the medis
® CS2000. We use three levels of the error percentage (that is, less than 40%, between 40% and 45%, and larger than 45%) to define each PPG pulse belonging to high, middle, or low SQI categorization. This approach can readily quantify the quality level of individual PPG pulses. The current show that the proposed algorithm can effectively pick up PPG pulses belonging to high SQI and increase the accuracy in the SV measurement of ICG.
LVET is the time interval initiated at the opening of the aortic valve and terminated at the closing of the aortic valve. During the LVET, the blood is pumped from the left ventricle to the aorta. Thus, in the ICG waveform, the starting ejection point is the first zero crossing point of its differential waveform during systole. The ending ejection point is the time for the first maximum valley of its differential waveform during systole, which happens before the dicrotic notch. According to the study by Liu et al. [
4], only a stable PPG signal can provide a reliable LVET. If the SQI of PPG waveform is applied to indirectly calculate LVET, the starting ejection point, dicrotic notch, and baseline drift are the main characteristics of pulse waveform. Unfortunately, a corrupted PPG signal is mainly caused by the body motions, in which an unstable differential PPG signal would provide an inaccurate LVET measurement. Moreover, it is found that the motion artifact more easily corrupts the signal baseline of the reflective PPG sensor than the transmissive PPG sensor. Therefore, in the study, we employ not only the rule-based algorithm to delete the severely corrupted pulses, but we also use the SoNFIN to help determine the SQI of individual PPG pulses. We only used 201 PPG pulses to train the SoNFIN, but a total of 1466 PPG pulses were used in the testing phase. When the SVs were measured using those PPG pulses with high SQI, we gained a relatively small mean statistic error of 6.4 ± 12.8 mL as compared with the reference. On the other hand, when the SVs are measured using the PPG pulses with low SQI, a large statistic error of −39.5 ± 17.1 mL was obtained. This method was very different for those in previous studies. The results show that the proposed algorithm could be used to the actual ICG applications, since the PPG pulses with high SQI could provide more accurate SV measurements. The number of PPG pulses in the border (moderate accuracy) region was less than that in the positive (high accuracy) or negative (low accuracy) region in clinical trials. In this study, only 70 of the 1466 PPG pulses belong to the middle SQIs. Alternatively, there are 861 and 535 PPG pulses belonging to the high and low SQIs, respectively.
Figure 9 shows a 9-s record of the PPG signal and its differential signal for Subject 5. The data of the first and third rows are the SVs measured by the medis
® CS 2000 and our ICG device, respectively, and the data of the second and fourth rows are the LVET measured by the medis
® CS 2000 and our ICG device, respectively. The data of the fifth row are the classified results, in which ‘1’ represents the pulse with high SQI, ‘2’ represents the pulse with middle SQI, and ‘3’ represents the pulse with low SQI. For the first pulse, it belongs to one of the pulses with low SQI because its starting ejection zone does not have a sharp valley. Thus, the LVET measured by the differential waveform is larger than the reference value, 368 ms versus 225 ms. For the fourth pulse, because it has a sharp valley in the starting ejection zone and a clear dicrotic notch, the SV measured with this pulse is very close to the reference SV, 56 mL versus 59 mL. However, this pulse has a serious baseline drift during diastole. Thus, the next pulse belongs to one of the low SQI pulses. For the second pulse, although it has a good sharp valley and a clear dicrotic notch, it results in an error of 9 mL in the SV measurement due to a middle SQI pulse. Therefore, the pulses with the middle SQIs belong to border classification, which are difficult to identify the qualities of these pulses. With respect to the reference, the pulses with middle SQIs offer a statistic error of 3.5 ± 16.1 mL, which is very close to that of 6.4 ± 12.8 mL for those pulses with high SQI.
When the baseline of the PPG signal wandered seriously, our proposed algorithm can ignore this segment, as shown in
Figure 10. However, for a PPG pulse with distinct and clean contour, if its baseline is not so badly drifted, then the SQI of such a PPG pulse will be considered high. For instance, although a baseline drift is present in the ninth PPG pulse in
Figure 10, it is still considered to be high SQI. The reason is that the LVET is measured from the differential waveform, and the differential signal is similar to a signal filtered by a high-pass filter. Thus, the baseline drift phenomenon in the PPG signal would be reduced in the differential signal.
It is difficult to precisely determine the SQI level of a PPG pulse only by a rule-based algorithm. In such a rule-based method, the thresholds of waveform parameters are adjusted usually by the researchers’ experience. In other words, there is no standard criterion in selecting those thresholds. In this study, we only adopt the rule-based algorithm to classify the segments that have the serious baseline drift. There were 1466 pulses to validate the performance of the proposed algorithm. The performance of our method for the pulses with low SQIs was better than it for the pulses with high SQIs: the sensitivities were 0.84 versus 0.81, and the specificities were 0.93 versus 0.90. The reason could be that the sample size for the high SQI, 1007 pulses, was larger than the sample size for the low SQI, 388 pulses. The accuracies for pulses with high and low SQIs were 0.83 and 0.86, respectively. The precisions for pulses with high and low SQIs were 0.94 and 0.97, respectively.
Kebede et al. [
21] used a multilayer neural network with an autoencoder to boot the accuracy of the classification of malware programs. They transferred the malware programs to the images, and their results showed that the autoencoder could increase the performance of the multilayer neural network for the classification. Although the proposed SoNFIN belongs to one of the multilayer neural networks, it employs the neural network to do the fuzzy inference. Thus, it is not suitable to implement an autoencoder in the TSK model. However, if we consider each PPG pulse and its differential signal as an image, a deep learning architecture will be used to do the classification of SQI. However, the autoencoder and the feature selection-based clustering approach could be utilized in the deep learning architecture to enhance its performance of classification [
22].


