Article

The Relationship between the Facial Expression of People in University Campus and Host-City Variables

1
Northeast Institute of Geography and Agroecology, Chinese Academy of Sciences, Changchun 130102, China
2
College of Natural Resources, University of Wisconsin–Stevens Point, 800 Reserve St., Stevens Point, WI 54481, USA
3
China Center for Public Sector Economy Research, Jilin University, Room 3007, Kuang, Yaming Building, 2699 Qianjin Road, Chaoyang District, Changchun 130012, China
*
Author to whom correspondence should be addressed.
Appl. Sci. 2020, 10(4), 1474; https://doi.org/10.3390/app10041474
Submission received: 1 February 2020 / Revised: 18 February 2020 / Accepted: 19 February 2020 / Published: 21 February 2020

Abstract

:

Featured Application

This work supplies a theoretical approach to evaluate public attitude towards university campuses and to detect the relationship with host-city variables using data about facial expression scores on social network services at the national scale.

Abstract

Public attitudes towards local university matters for the resource investment to sustainable science and technology. The application of machine learning techniques enables the evaluation of resource investments more precisely even at the national scale. In this study, a total number of 4327 selfies were collected from the social network services (SNS) platform of Sina Micro-Blog for check-in records of 92 211-Project university campuses from 82 cities of 31 Provinces across mainland China. Photos were analyzed by the FireFACETM-V1.0 software to obtain scores of happy and sad facial expressions and a positive response index (PRI) was calculated (happy-sad). One-way analysis of variance indicated that both happy and PRI scores were highest in Shandong University and lowest in Harbin Engineering University. The national distribution of positive expression scores was highest in Changchun, Jinan, and Guangzhou cities. The maximum likelihood estimates from general linear regression indicated that the city-variable of the number of regular institutions of higher learning had the positive contribution to the happy score. The number of internet accesses and area of residential housing contributed to the negative expression scores. Therefore, people tend to show positive expression at campuses in cities with more education infrastructures but fewer residences and internet users. The geospatial analysis of facial expression data can be one approach to supply theoretical evidence for the resource arrangement of sustainable science and technology from universities.

1. Introduction

Since 2008 more than half of the world population lived in cities and this is expected to reach 70% by 2050 [1]. Cities are widely regarded as important areas in the pursuit of global sustainability [2]. A sustainable society comprises five distinct elements for every human-being such as the proper education, a clean environment, a well-balanced safety, abundant resources for future generation, and contribution to a sustainable world [3]. Easy to collect metrics that rate environmental, economic, educational, and social variables are important to evaluate the global strategies for urban transformation towards sustainability that builds upon national and local scales [4]. A sustainable city should respond to residents’ needs through sustainable solutions for social and economic aspects [1]. The tradeoff between resource consumption and citizens’ demand can be sustainably solved by the use of information and communication technologies (ICT) and the internet of things (IoT), which can be accessed in a smart local university campus [5,6]. Therefore, a future-like relationship emerges between city variables and public attitude towards local university campuses.
Universities have a central role to create knowledge and tools to transfer information for societal transformations towards sustainability [2,7]. Universities can be a driving force to provide urban sustainable development by embedding knowledge to the local social and economic networks [8,9,10]. Besides the responsibilities of teaching and research, universities are increasingly expected to turn knowledge into innovation [11]. Universities can also be a partner with their host-city to develop the transformation to a smart community [1,5,6,7]. To test design principles, a university campus can be taken as a socioeconomic organization like a mini-city and the management and demands for resources therein can be acquired by the using data through the IoT. In China a model is being implemented to construct cities that are famous due to universities therein, but many of these programs are not successful as expected because of the poor educational outcomes and economic productivity [12]. The shortage of objective evaluation on local universities was at least partly responsible for the failure. People around the campus are frontiers that can give a precise evaluation on universities hence their attitude is the key to evaluate the university in its host-city.
City variables are known to affect the satisfaction of residents towards local universities [13,14]. An investigation using self-reported scores revealed that most undergraduates indicated satisfaction with settings of the city where their campus was located [13]. The group of variables out of these settings includes socializing [2,14], resident environment [2,13,14,15,16], socio-economic status [8,13,17], and industrialization [8] that have all been detected to have some relationship with perceived satisfaction towards campus although the magnitude was ever either positive or negative. The model of multiple city variables was proposed to measure the performance in the creativity of universities in cities [18]. This means that the multivariable model may also have contributions to the perceived satisfaction of people in university campuses. In addition, the current development of ICT can enable new methods and metrics to assess perceived satisfaction instead of questionnaire methodology. However, results about public attitude towards university campus were limited by the testing method and information that have been published on this matter.
Traditionally, questionnaires provided a common method to evaluate people perception. Evaluation through self-reported scores has several apparent biases from subjective emotion of respondents, real-time mood, problematic questions, and social-role restricted results [19]. Facial expression represents an emotional response to a stimulus and/or a communicative behavior in a social situation, which can be termed as Duchenne (a felt expression with an emotion cue) and non- Duchenne ways (an unfelt expression with a communicative cue), respectively [20]. The facial expression of a visitor’s photo at a place provides a novel way to show performative emotional satisfaction in the location. A selfie taken and shared by a person through social media is one way to collect the information of emotional expressions that would like to be exposed to the public. Facial expression scores with a check-in-recorded location enable geographical analysis of posed emotion towards environments in a visited location. Highly popularized social networking service (SNS) results in millions of facial-expression images uploaded to the data-cloud [21,22]. Therefore, to collect and analyze facial images from SNS with check-in locations supplies a new approach to assess satisfaction of people with a wide range of geographical locations. Regarding that people expose their selfies with check-in records to show posed facial expression at the location, all variables about the city where visitors is located can be used as the explanatory independent factors in a regression model together to build the relationship with expressional scores. To utilize data from SNS enables the precise evaluation of public attitude towards universities at the large geographical scale. However, to the best of our knowledge, the use of this methodology has not been tested.
In mainland China, 116 universities are classified in the ‘211-Project’. These universities were authorized by Ministry of Education of the People’s Republic of China (MEPRC) and are being distributed in 82 cities from 31 Provinces [23]. All universities within the 211-Project derive more financial and political support than other universities with an expectation of greater corresponding outcomes of science and technology. Therefore, cities with 211-Project universities are generally promoted by an enhanced scholar population, public services, daily livelihood, and social infrastructures. In this study, campuses of key universities in the 211-Project from mainland China were chosen as the research plots wherein selfies at check-in locations at campuses were collected and analyzed for intended facial expressions. We aimed to assess scores of happy and sad expressions of people in 211-Project universities and map them at the national scale. It was hypothesized that (i) people would pose more positive facial expressions at university campuses in cities with more development in economy and technology, and (ii) city variables about socializing and socio-economy had contrasting contributions to intended positive and negative expressions in university campuses.

2. Materials and Methods

2.1. Universities

In this study, key universities in the 211-Project were chosen as study locations. A total of 96 campuses of key universities were included in this study (Table S1). Campuses of some universities were also excluded in this study because the sample size of suitable images (as described below) was too small to support the data collection and therefore 96 universities in the 211-Project were included in this study. Overall, a total of 92 campuses of 211-Project universities were selected as the check-in-recorded locations exited for these from 82 cities in 31 provinces across mainland China. These 92 universities are also top scholar institutions in mainland China.

2.2. Photo Collection

The Sina Micro-Blog (SMB; Sina Inc., Beijing, China) was chosen as the platform of SNS to collect facial photos using the method of Wei et al. [19]. SMB is widely used by Chinese web-users and functions similar to Twitter (NYSE: TWTR, San Francisco, CA, USA) that supplies a platform to pose real-time mini-blogs to the internet with comments and images (photos). Both personal computer and mobile device terminals can enable users to pose blogs, but only mobile terminals can attach check-in location records. According to the policy of SMB, the use of text and photos in blogs published in SMB are open to the public if no private limit was claimed by the user. As of August 2018, SMB had 0.43 billion active users with 0.19 billion daily submissions of micro-blogs by active users [24]. SMB supplied an open platform to upload photos with check-in data through microblogs and to check and download images. All university campuses chosen in this study had been listed in the location records of SMB.
Photos were collected in the process following three phases:
(i)
All microblogs with uploaded photos with check-in data about geography of target university campuses were blocked by time between 15 February and 15 June 2019. This time was chosen because it covered the spring semester period for most universities we studied.
(ii)
Blogs with selfies were screened and only photos with young adult portraits were collected. Age of subjects in selfies was visually evaluated through the photo. Many users’ age information was hidden by a classified statement in SMB. This resulted in only a few of users’ age information published, but the number of revealed ages was too small to support a meaningful statistical analysis. Nearly all (95%) of initially collected selfies were uploaded by young adults. Therefore, we chose to use this part of photos for further analysis to keep the uniformity of age among users. Significant differences of perception and habit between international and Chinese students exist [25], thus, selfies with western-style faces were excluded. It was hard to distinguish nationalities among Eastern Asia countries in photos, hence it was assumed that all Asian faces were Chinese.
(iii)
Only photos clearly showing facial features were selected for analysis. Photos were excluded when makeup obscured facial expression (e.g., excessively beautified, over whitened, additionally decorated) or the face feature was twisted.

2.3. Face Expression Analysis

Collected photos were modified by cropping and rotating before analysis. Since some photos included more than one face, each face was separated from the original photo by cropping to generate a new photo file with one unique face. It was necessary to rotate photos to make the nose axis vertical to the horizon. Rotating was necessary for analysis precision of facial expressions. Photos were analyzed by the FireFACETM-V1.0 software (Zhilunpudao Agric. Sci. Inc., Changchun, China). This software was calibrated by training the computer program to recognize faces using the independent variables of oriental faces with posed facial expressions. Initially, about 30,000 photos were documented for training the machine to recognize basic expressions (happy, sad, and neutral) with about 10,000 photos for each of them. Photos were recognized and classified into files of known expressions manually then engineers wrote codes to enable the communication between computer and these files. The training was terminated until the machine has been tested to pass the aimed accuracy of 85% for happy and sad expressions and 80% for neutral expression (Figures S1 and S2). To train the software with high accuracy for recognizing faces of Chinese people, posed photos were recognized and classified into perceived expressions by Chinese experts. A total number of 4327 selfies (one person per photo) were analyzed for facial expressional scores.

2.4. Data about City Variables

Data depicting the variables of all 82 cities were obtained from the latest database of National Bureau of Statistics of China [26]. We employed city variables that were documented officially for all cities since the time of July 2019. As a result, four parameters (e.g., economy, public facility, habitation, and environments) were used in this study (Table 1). Economic parameters included government expenditure and resident income, which may affect financial status of local universities through tax investment at the national and local scales, respectively [27,28]. Public facilities covered aspects of communication, transportation, health care, education, and regional culture, which were all related to university students [29,30,31]. Parameters of habitation included the aspects that reflected the socializing and life utilities, which were found to be closely related to perceived satisfaction at campus [2,14]. Environment parameters (e.g., air pollution, water pollution, and garbage disposal) that may impact satisfaction under some given industrialization were extracted from databases of each local bureau [2,13,14,15,16].

2.5. Statistical Analysis

In addition to happy and sad expressions, we involved the positive response index (PRI) as a scoring metric to evaluate the net positive emotion [32]. PRI is defined as the difference between scores for happy and sad expressions.
SAS (ver. 9.4 64-bit, SAS Institute, Cary, NC, USA) software was used for data analysis. Data about happy and sad scores and PRI values were tested for the normal distribution, which was not found across universities campuses. Therefore, data were ranked to obtain a new set of distribution-free scores [33]. Ranked data were further analyzed by one-way analysis of variance (ANOVA) with the variation of universities as a source of variance. When a significant effect was found, means were arranged and compared by the Duncan Multiple Comparison test at α = 0.05 level. To detect the relationship between multiple city-variables and facial expressions, a model of maximum likelihood estimate on the general linear regression was made using the GENMOD procedure with multiple city-variables as the independent variables and facial expression scores as the dependent variables. Data used for the regression were pooled using averaged means for cities (n = 32); thereafter dependent variables were found to be normally distributed across cities and independent variables were log-transformed. The probability of a chi-square test was determined to be significant at α = 0.05 level for every estimated parameter. We did not distinguish observations from subjects therefore the negative effect of pseudoreplication on our results might happen [34,35]. To assess the possible impact of collinearity on regression, variance inflation (VIF) was detected in SAS by the REG procedure in advance.

3. Results

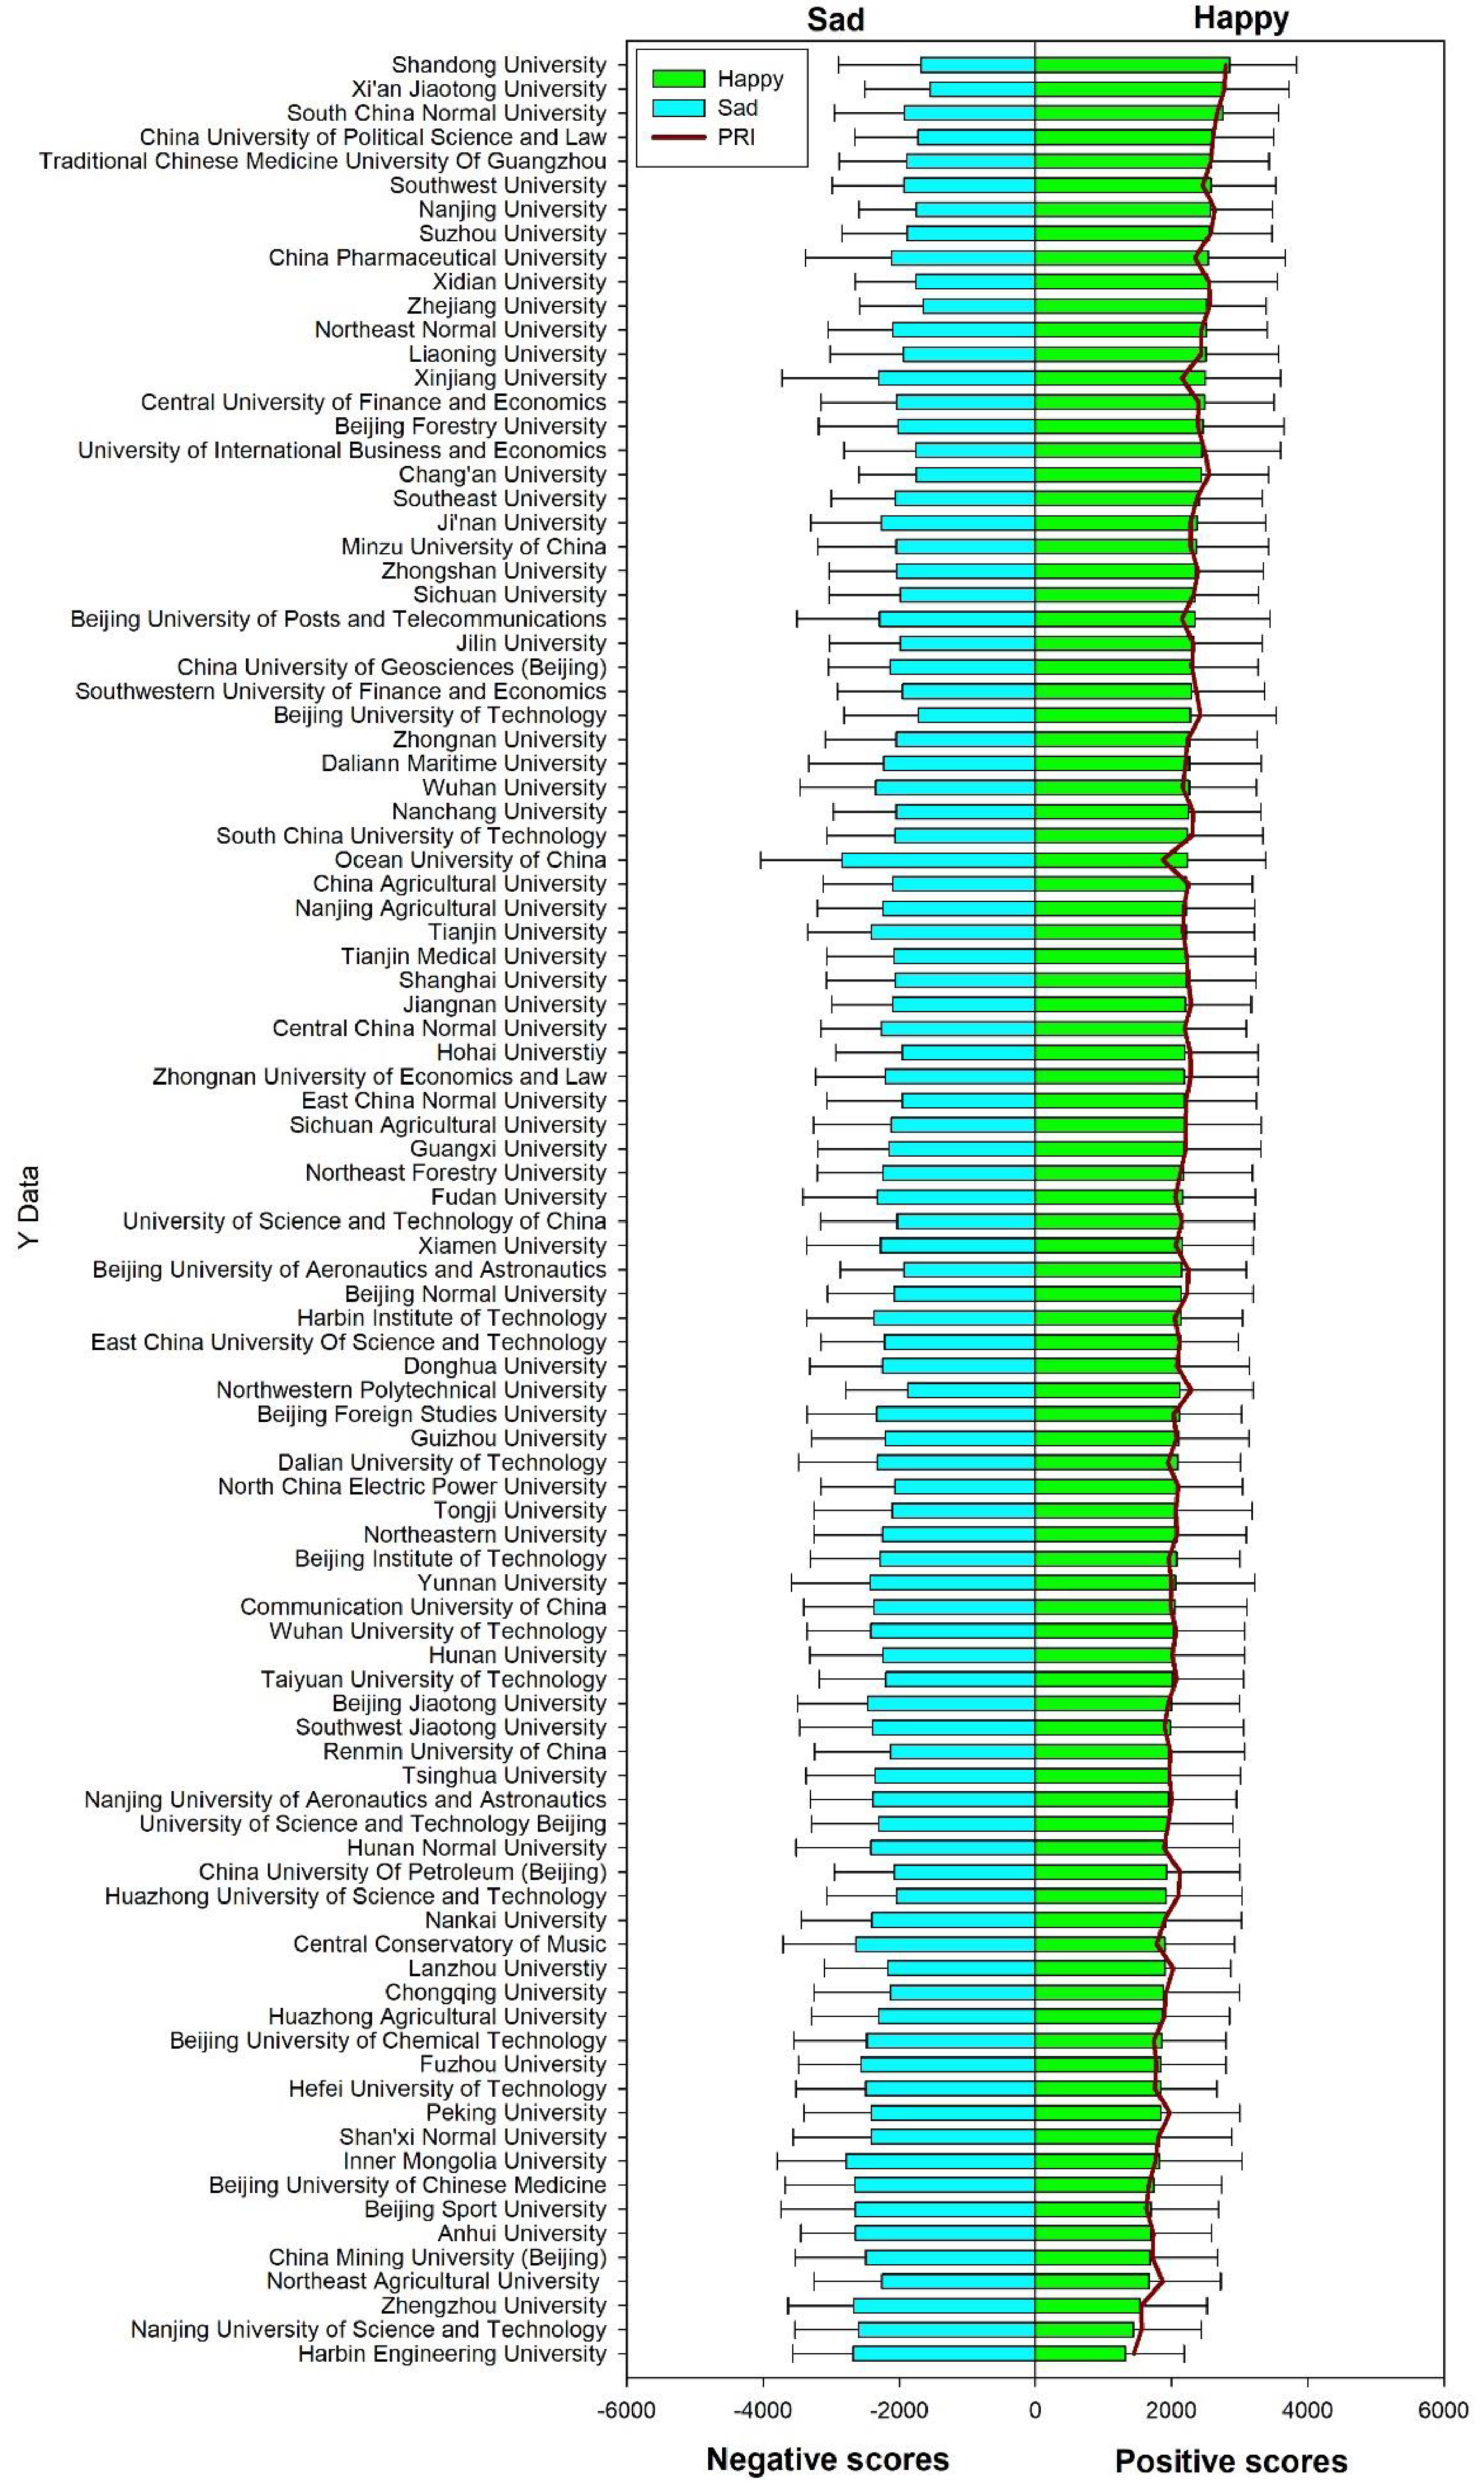
3.1. Facial Expressoin Scores among Universities

Results about analysis of one-way ANOVA on facial expression scores across university campuses are shown in Table 2. Happy expression scores were higher in Shandong University, Xi’an Jiaotong University, and South China University than those in most of other universities (Figure 1). Harbin Engineering University had the lowest happy score. On the other hand, Ocean University of China, Inner Mongolia University, and Harbin Engineering University tended to have the highest sad expression scores, while sad scores appeared to be lower in Shandong University, Zhejiang University, and Xi’an Jiaotong University (Figure 1). The PRI generally showed the similar trend of happy score but had some distinctive inverses (Figure 1). For example, PRI in China Pharmaceutical University, Xinjiang University, and Ocean University of China were reduced by the relatively higher level of sad scores. In contrast, the sudden increase of PRI, such as that in Northwestern Polytechnical University, was caused by the relatively lower sad scores.

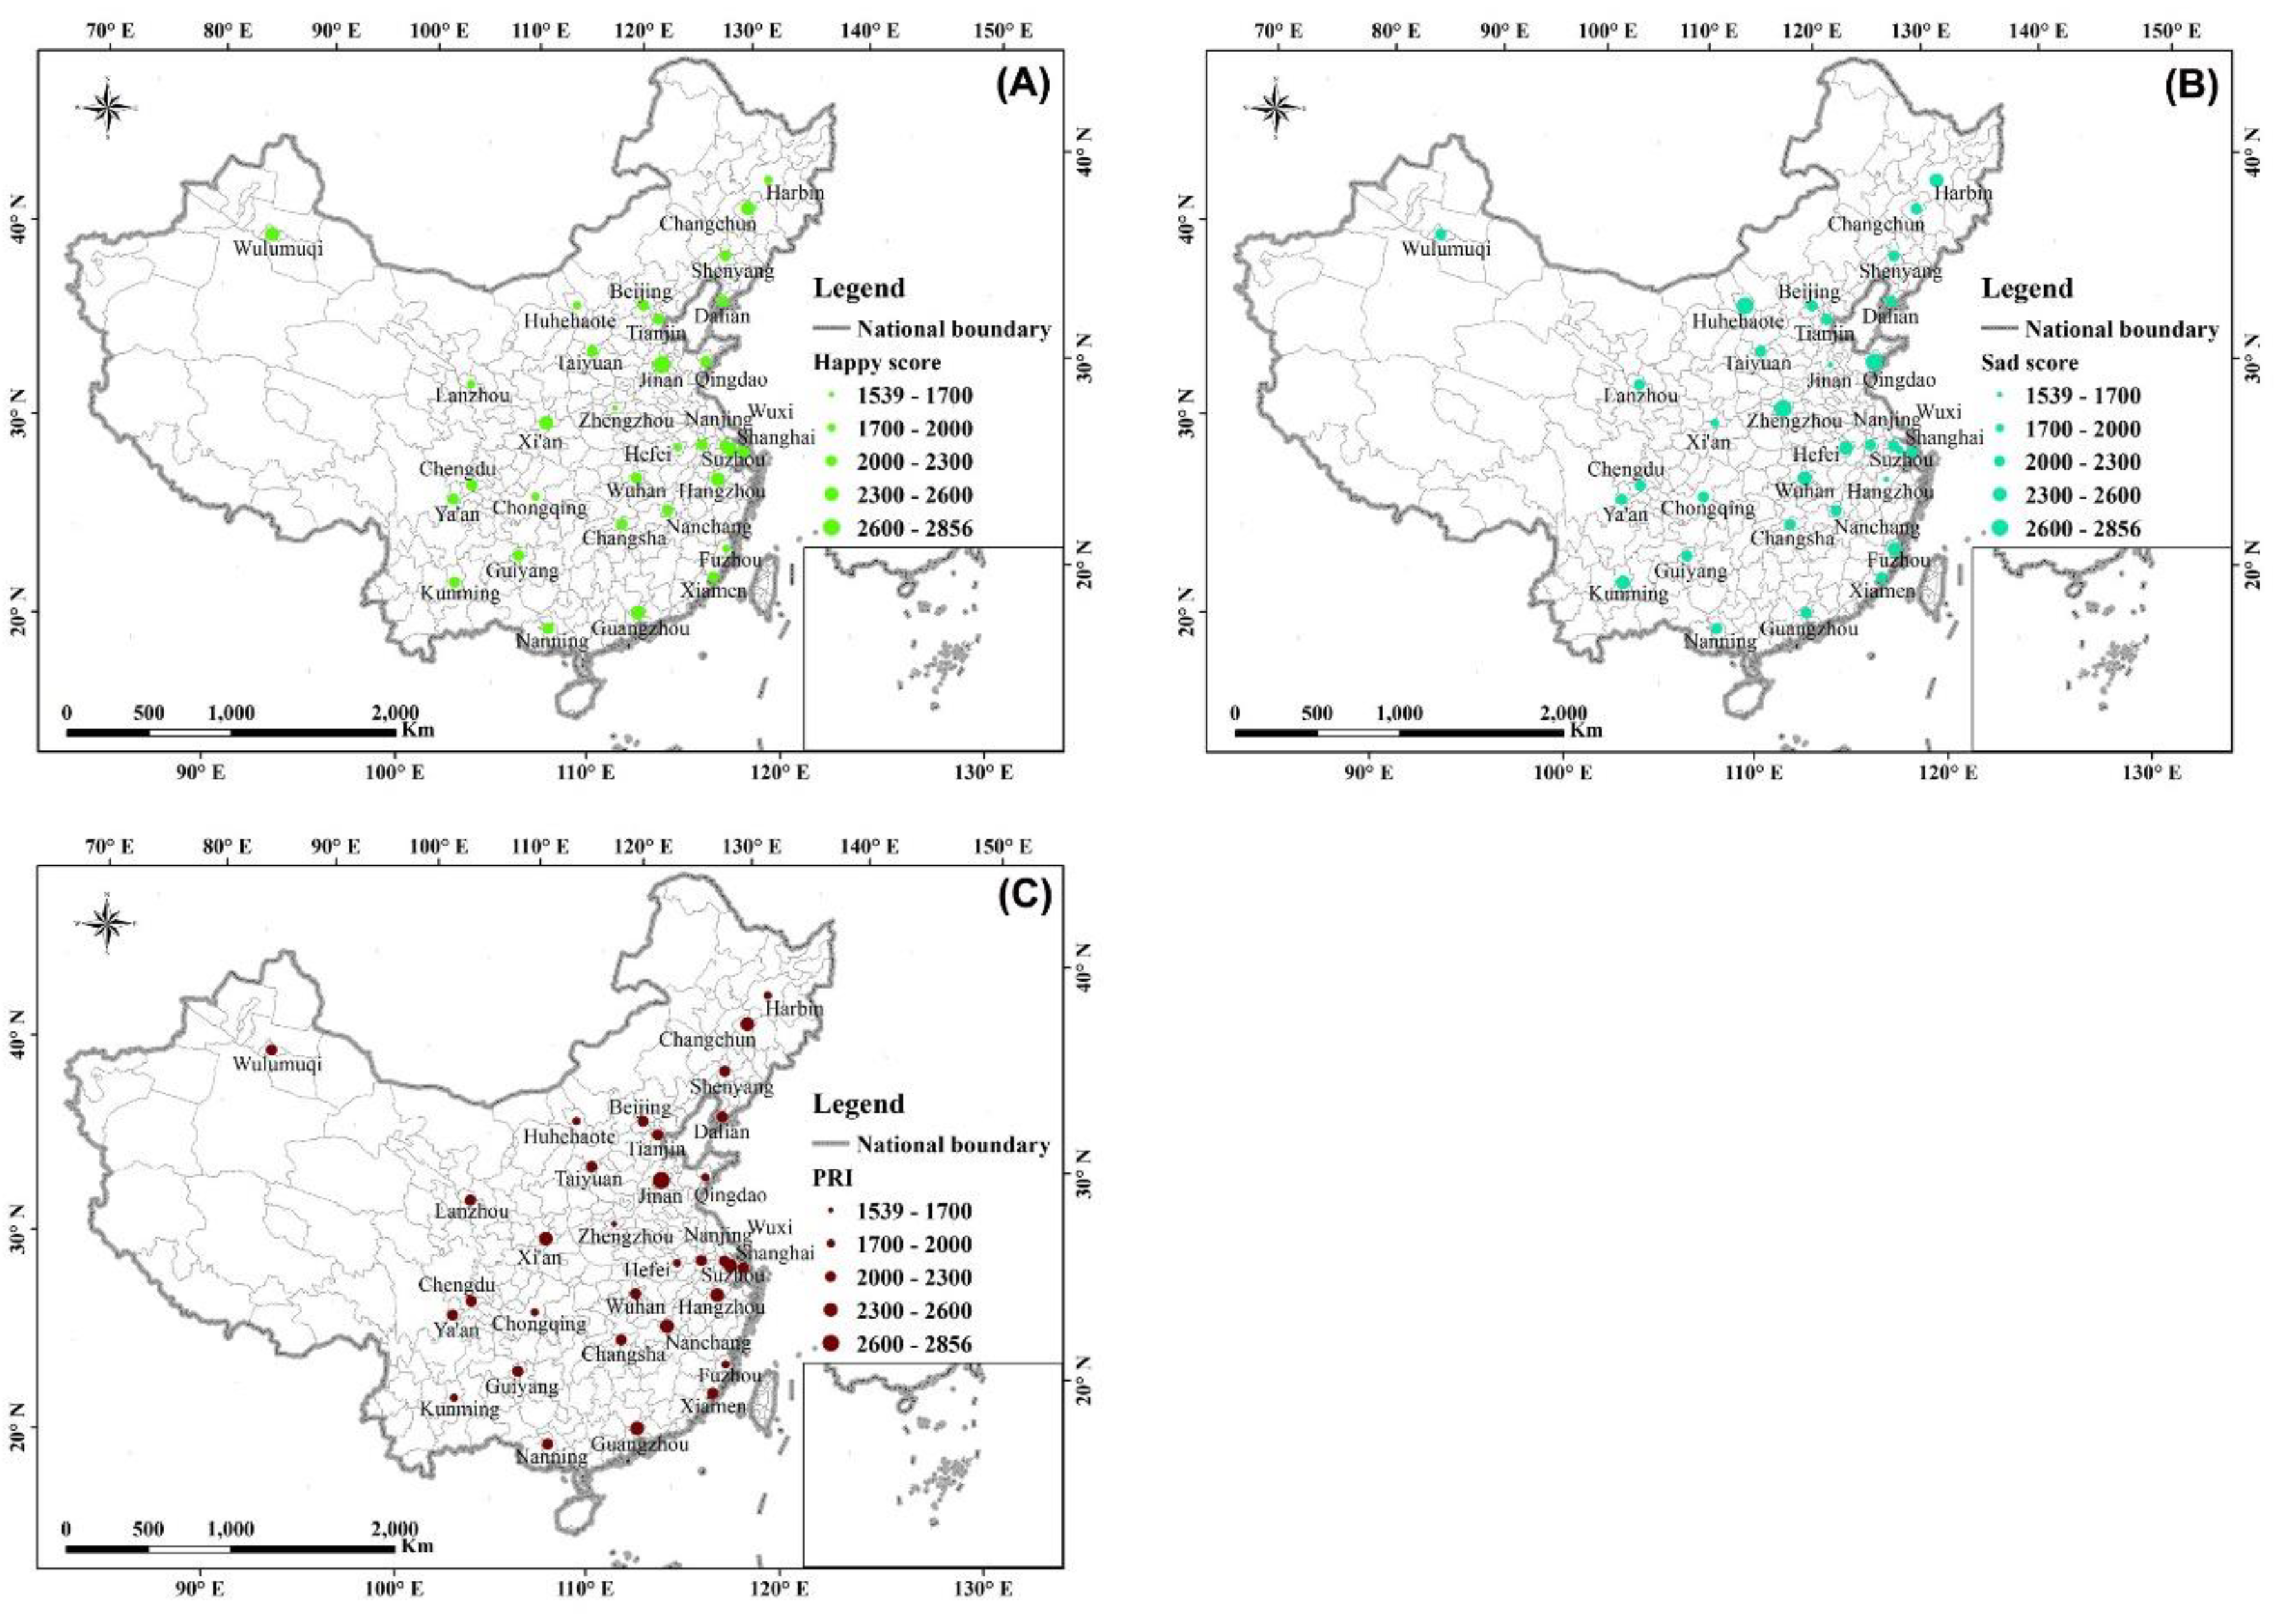
3.2. Geographical Distribution of Expression Scores among Host-Cities

Happy scores were distributed divisionally with higher values in central-northeast, northern East-China, and Southern China (Figure 2A). Cities of Changchun, Jinan, Wulumuqi, Xi’an, and Hangzhou tended to have higher happy scores, while those of Harbin, Huhetaote, and Chongqing tended to have low happy scores. Cities of Huhetaote, Zhengzhou, and Kunming tended to have high sad scores (Figure 2B). Cities of Hangzhou, Suzhou, and Xi’an tended to have low sad scores. As a result of interplay between happy and sad scores, PRI was highest in Cities of Jinan, and moderately higher in Changchun, Xi’an, Hangzhou, Shanghai, and Guangzhou.

3.3. The Bias of Collinearity

Analysis on VIF shows that the happy expression scores had the high risk of collinearity from variables of public financial expenditure, corporate profit of enterprises above designated scale, and average wage of enrolled employees of work-units (Table 3). Sad expression scores showed possible collinearity from variables of corporate profit of enterprises above designated scale and disposal of household garbage. PRI exhibited potential collinearity from public financial expenditure and average wage of enrolled employees of work-units.

3.4. The Regression Analysis

Nearly all parameters about the economy had significant contribution to the happy score but their estimated coefficients were too small to be detectable (Table 4). Among variables of public facilities, number of internet wideband access had a negative contribution to the happy score while number of regular institutions of higher learning had a positive contribution. Neither of these two variables exhibited issues with collinearity. None of the rest of parameters was indicated to have any significant contributions.
In the economic field, parameters of the corporate profit of enterprises above designated scale and number of employees of city and town (C&T) work-units were indicated to have significant contributions to the sad scores but their estimated coefficients were too small to be detected (Table 5). The variable of corporate profit of enterprises above designated scale also suffered showed collinearity. In the field of habitation, the parameter of area of resident lands had a positive contribution to sad scores.
The variable of public financial expenditure showed collinearity (Table 6). Area of resident lands and numbers of regular institutions of higher learning from the public facility had negative and positive contributions to PRI, respectively (Table 6). The absolute value of estimated number of regular institutions of higher learning was about 10-time higher than that of residential area.

4. Discussion

The most significant result in our study is that the happy score in Shandong university (Shandong Province) was highest among universities while geographical distribution also revealed that positive scores tended to be higher in Jinan City (Shandong Province). We surmise that the high happy expression score in a city was the result of the happy expression score in the campus therein. Another example is Changchun City, which obtained a medium-high happy score while the happy scores in the two universities in Jilin Province were medium or high. However, the facial expression score for the city may be null to be indicated by that for the universities therein. For example, overall universities in Beijing City showed a moderate score of positive expressions although some university campuses therein obtained higher happy expression scores (e.g., China University of Political Science and Law). In contrast, the positive expression score in some other universities at Beijing City was lower than the average level (e.g., China Mining University and Beijing Sport University). Changchun, Jinan, and Guangzhou were three cities with high scores for both happy expression and PRI and hence university campuses in these three cities result can be taken to have the highest perceived satisfaction.
Student satisfaction with a university can affect student enrollment and retention. Hajrasouliha [36] investigated quality scores of university campuses in the United States and the scores were associated with freshman retention and graduation rates. The authors also revealed the geographical distribution of scores in selected campuses across the United States and found higher scores in the northeastern cities. Thus, both results from our study and Hajrasouliha [36] revealed no response of distribution to a geographical gradient.
Several public facility parameters were tested for a relationship with facial expression scores. The number of regular institutions of higher education within a city was one parameter that had positive contribution to values of both a happy score and PRI. From the SNS platform of SMB we aimed to collect selfies about young people who can mainly come from students or a new teacher enrolled in the university. Undergraduates and most mater candidates look young, but some PhD candidates may look old as they may have spent several years to earn their degree. For students, it was found that faculty, advising staff, and the class itself all had significant impact on their perceived satisfaction in higher learning institutions [37]. Some lecturers and even associate and full-time professors can also look young if they achieved high scholar scores at young age. Therefore, all young adults who would like to pose their selfies in a campus are likely to feel the emotional cue that originated from campus-life. Our results can be interpreted that young adults as either students or tutors would enjoy the city with more educational institutions where they may show Duchenne expressions as they felt being accompanied by large group of other youths. Other studies also reported that variables about the learning organization could account for the significant satisfaction for both teachers and researchers of higher learning institution [38]. A concentration of university campuses may result in more socializing opportunities, leading to greater satisfaction with a campus through more socializing of young people in their generation group [2,14].
It is surprising that a number of internet accesses had a negative contribution to the happy score. This suggests more internet users in a host-city decreased the ratio of showing happy expression of youths in university campuses. Youths of intense internet users were found to have overconfidence in the web-world, but they were also reported depressive symptomatology, problem behavior, and targeting of traditional bullying in the real world [39]. Another investigation reported that adolescents as frequent internet users reported depression by isolation from their family members [40]. In addition, more internet access may result in a user’s habitual internet use and might result in a greater population of “internet addicts”. Internet addiction tended to evoke perceived stress, which our results were consistent with less happy expressions [41]. People with an internet gaming disorder manifested in above average time spent with this activity were found to have different kinds of unconscious neutral facial expressions, which depressed the expression of a smiling face [42]. Thus, these studies were all consistent with our results with the higher probability of a reduction with a happy expression in a population with higher ratio of internet users. More direct and explanatory evidence is needed to further verify these results and it is also possible the concentration on an activity itself depresses a happy face.
In our study, the sad expression score was positively correlated with the area of residential lands adjoining a university. These findings concur with those found in England [43] and South Africa [44], where residential housing-density was negative to the perceived satisfaction of neighbors. This negative relationship should be more apparent for a residence-surrounded university campus because of more open space in the campus than in resident communities. However, we detected a weak effect of the area of green space in urban parks on sad expression. Urban green space has been shown to alleviate perceived stress [16]. This may be because people in our study were mainly grouped in the university campus rather than spending time in the green space of parks at the city scale. Or if they did any residual affect was not detected in this study.
We found no environmental variables were associated with our scores of happy, sad, or the PRI. This is because our data showed an obvious ceiling that cities with heavy contamination were unlikely to be included to the database. It is not recommended to install industries with heavy contamination for a city, which has been assigned to develop mainly through intellectual promotion of local universities. A sustainable and healthy community has effective ways to dispose of garbage and sewage, which can increase human disease if not abated [45,46]. Likewise, excessive levels of air pollution and particulate matter from industrial dust can reduce human health [47]. In this study, it is likely that a person would not see these variables and as such no effect on facial images seems reasonable.
This study may have been limited by several aspects. The first may come from the number of users in the selfies. The initially collected selfies were either taken by a single person in a photo or a person cropped from selfies with a group of people. Since individuals can more accurately perceive emotions expressed than in-group members [48], our facial expressions that were analyzed from selfies should have been controlled by the individual and in-group participants. However, this was not available in this study because many factors failed to be concerned, such as the number of people that were separated from a group, genders of them (this probably matters), failure of selfies for cropping (un-intact image of face, unclear face, deflected faces), group of young and mature adults, etc. Therefore, our results may have suffered some bias from the difference between faces of individual and in-group persons. As we omitted this bias for all check-in locations, it was reasonable to assume the technical error was uniform for all campuses.
Another limit to this study comes from the negative impact from pseudoreplication on our data, which resulted in a pretended independence. According to Waller et al. [34], pseudoreplication can occur when more than one datum was observed per individual. It can also occur when data points result from the same stimulus. Both situations were also found in ecological studies [35]. Our data may have suffered a pseudoreplication impact because different types of facial expressions may have been rated from the same subject. More than one facial expression score may have been collected from the same person in a university campus. This would impact the significance of difference of facial expression scores across universities and city variables because some of the replicated observations were not independent. A gross summary suggested that the incidence of pseudoreplication ranged between 12% and 40% in studies on primate communication research [34]. The incidence in our study was far lower than this range by manual screening of selfies. Therefore, it is reasonable to assume the impact from pseudoreplication on our data points can be negligible due to the review of each person. However, we still suggest future work can employ a process of excluding more than one observation from the same individual or at the same location to eliminate any potential pseudoreplication bias.

5. Conclusions

In this study, we examined how facial expressions of young adults varied at key universities in the 211-Project across mainland China. Selfies were downloaded from SMB and photos were analyzed by the FireFACETM-V1.0 software to obtain scores of happy and sad expressions. Our results indicated that the geographical distribution of facial expression scores showed divisional patterns and higher positive scores were distributed in Changchun, Jinan, and Guangzhou cities. The formation of facial expression distribution among cities was related to that in universities within host-cities. Regression analysis indicated that number of regular institutions of higher learning had the positive contribution to the happy score and a number of internet accesses and area of resident lands contributed to the negative expression scores. Therefore, if the city planner aimed to promote the perceived satisfaction of young people in the campus of universities, the promotion of educational institution numbers with confining resident communities and broadband accesses would benefit the positively emotional expressions. Our study can be applied for budget and regime planners to establish sustainable development of universities with efficient evaluation using current techniques.

Supplementary Materials

The following are available online at https://www.mdpi.com/2076-3417/10/4/1474/s1, Figure S1: The panel of FireFACETM-V1.0 software to recognize photos with typically happy, sad, and neutral facial expressions. Figure S2: The copyright of the FireFACETM-V1.0 software that is authorized in mainland China. Table S1: The list of key universities in the 211-Project of mainland China with province and city names. Table S2: Letters that are marked for different means of ranked happy scores in visitors in university campuses across mainland China. Table S3: Letters that are marked for different means of ranked sad scores in visitors in university campuses across mainland China. Table S4: Letters that are marked for different means of ranked positive response index (PRI) scores in visitors in university campuses across mainland China.

Author Contributions

Conceptualization, H.W. and X.Z.; methodology, H.W.; software, H.W.; validation, X.Z.; formal analysis, X.Z. and H.W.; investigation, X.Z.; resources, X.Z.; data curation, X.Z.; writing—original draft preparation, H.W.; writing—review and editing, R.J.H. and X.Z.; visualization, X.Z. All authors have read and agreed to the published version of the manuscript.

Funding

This research was funded by the Secondary-Class Support of China Postdoctoral Science Foundation Grants (grant number 2019M651220), the National Natural Science Foundation of China (grant number 41971122; 41861017; 31600496), the Strategic Priority Research Program of the Chinese Academy of Sciences (grant number XDA23070503), the Regional Key Project in S&T Services Network Program of Chinese Academy of Sciences (grant number KFJ-STS-QYZD-044; KFJ-STS-ZDTP-048), the National Key Research and Development Program of China (grant number 2016YFC0500300), and the Fund for Jilin Environmental Science (grant number 2017-16).

Acknowledgments

Authors acknowledge Xin Chen for her contribution to use the software of facial analysis. Feng Zhu (Zhilunpudao Agric. S&T Ltd., Changchun, China) is kindly acknowledged for his authorization for us to use the FireFACETM-V1.0 software.

Conflicts of Interest

The authors declare no conflict of interest.

References

  1. Albino, V.; Berardi, U.; Dangelico, R.M. Smart cities: Definitions, dimensions, performance, and initiatives. J. Urban Technol. 2015, 22, 3–21. [Google Scholar] [CrossRef]
  2. Trencher, G.; Bai, X.M.; Evans, J.; McCormick, K.; Yarime, M. University partnerships for co-designing and co-producing urban sustainability. Glob. Environ. Chang. 2014, 28, 153–165. [Google Scholar] [CrossRef]
  3. De Kerk, G.V.; Manuel, A.R. A comprehensive index for a sustainable society: The SSI—the sustainable society index. Ecol. Econ. 2008, 66, 228–242. [Google Scholar] [CrossRef]
  4. Nevado-Pena, D.; Lopez-Ruiz, V.R.; Alfaro-Navarro, J.L. The effects of evironmental and social dimensions of sustainability in response to the economic crisis of European cities. Sustainability 2015, 7, 8255–8269. [Google Scholar] [CrossRef] [Green Version]
  5. Fortes, S.; Santoyo-Ramon, J.A.; Palacios, D.; Baena, E.; Mora-Garcia, R.; Medina, M.; Mora, P.; Barco, R. The campus as a smart city: University of Malaga environmental, learning, and research approaches. Sensors 2019, 19, 23. [Google Scholar] [CrossRef] [Green Version]
  6. Villegas-Ch, W.; Palacios-Pacheco, X.; Lujan-Mora, S. Application of a smart city model to a traditional university campus with a big data architecture: A sustainable smart campus. Sustainability 2019, 11, 28. [Google Scholar] [CrossRef] [Green Version]
  7. Keeler, L.W.; Beaudoin, F.; Wiek, A.; John, B.; Lerner, A.M.; Beecroft, R.; Tamm, K.; Seebacher, A.; Lang, D.J.; Kay, B.; et al. Building actor-centric transformative capacity through city-university partnerships. Ambio 2019, 48, 529–538. [Google Scholar] [CrossRef]
  8. Aguilar, R.M.M. The relationship university-city epistemological approach. Bitacora Urbano Territ. 2011, 18, 127–138. [Google Scholar]
  9. Kolesova, O.V.; Minaev, N.N.; Oplakanskaya, R.V. Siberian university cities: Trends of development, challenges, opportunities. Tomsk State Univ. J. 2019, 106–111. [Google Scholar] [CrossRef]
  10. Russo, A.P.; van den Berg, L.; Lavanga, M. Toward a sustainable relationship between city and university—A stakeholdership approach. J. Plan. Educ. Res. 2007, 27, 199–216. [Google Scholar] [CrossRef]
  11. Romein, A.; Fernandez-Maldonado, A.M.; Trip, J.J. Delft blues: The long road from university town to knowledge city. Int. J. Knowl. Based Dev. 2011, 2, 148–165. [Google Scholar] [CrossRef]
  12. Sum, C.Y. A great leap of faith: Limits to China’s university cities. Urban Stud. 2018, 55, 1460–1476. [Google Scholar] [CrossRef]
  13. Chow, H.P.H. Life satisfaction among university students in a Canadian prairie city: A multivariate analysis. Soc. Indic. Res. 2005, 70, 139–150. [Google Scholar] [CrossRef]
  14. Insch, A.; Sun, B. University students’ needs and satisfaction with their host city. J. Place Manag. Dev. 2013, 6, 178–191. [Google Scholar] [CrossRef]
  15. Espinosa-Garcia, A.C.; Diaz-Avalos, C.; Gonzalez-Villarreal, F.J.; Val-Segura, R.; Malvaez-Orozco, V.; Mazari-Hiriart, M. Drinking water quality in a Mexico city university community: Perception and preferences. EcoHealth 2015, 12, 88–97. [Google Scholar] [CrossRef]
  16. Grahn, P.; Stigsdotter, U.K. The relation between perceived sensory dimensions of urban green space and stress restoration. Landsc. Urban Plan. 2010, 94, 264–275. [Google Scholar] [CrossRef]
  17. Moos, M.; Revington, N.; Wilkin, T.; Andrey, J. The knowledge economy city: Gentrification, strudentification and youthification, and their connections to universities. Urban Stud. 2019, 56, 1075–1092. [Google Scholar] [CrossRef]
  18. Rodrigues, M.; Franco, M. Measuring the performance in creative cities: Proposal of a multidimensional model. Sustainability 2018, 10, 21. [Google Scholar] [CrossRef] [Green Version]
  19. Wei, H.X.; Hauer, R.J.; Chen, X.; He, X.Y. Facial expressions of visitors in forests along the urbanization gradient: What can we learn from selfies on social networking services? Forests 2019, 10, 14. [Google Scholar] [CrossRef] [Green Version]
  20. Surakka, V.; Hietanen, J.K. Facial and emotional reactions to Duchenne and non-Duchenne smiles. Int. J. Psychophysiol. 1998, 29, 23–33. [Google Scholar] [CrossRef]
  21. Nakashima, Y.; Koyama, T.; Yokoya, N.; Babaguchi, N. Facial expression preserving privacy protection using image melding. In Proceedings of the 2015 IEEE International Conference on Multimedia & Expo, Turin, Italy, 29 June–3 July 2015; The IEEE Press: New York, NY, USA, 2015; pp. 13–29. [Google Scholar]
  22. D’Ambrosio, S.; de Pasquale, S.; Iannone, G.; Malandrino, D.; Negro, A.; Patimo, G.; Scarano, V.; Spinelli, R.; Zaccagnino, R. Privacy as a proxy for Green Web browsing: Methodology and experimentation. Comput. Netw. 2017, 126, 81–99. [Google Scholar]
  23. China Education On-line Retrieved from 2019. Available online: https://daxue.eol.cn/211.shtml (accessed on 12 July 2019).
  24. Sina Technology Retrieved from 2018. Available online: https://tech.sina.com.cn/i/2018-08-08/doc-ihhkuskt9903395.shtml (accessed on 8 August 2018).
  25. Fincher, R.; Shaw, K. Enacting separate social worlds: ‘International’ and ‘local’ students in public space in central Melbourne. Geoforum 2011, 42, 539–549. [Google Scholar] [CrossRef]
  26. National Bureau of Statistics of China. Annals of Cities in China, 2017 ed.; China Statistics Press: Beijing, China, 2017. [Google Scholar]
  27. Daim, T.U.; Ozdemir, D. Impact of US economic crises on university research and development investments. J. Knowl. Econ. 2015, 6, 13–27. [Google Scholar] [CrossRef]
  28. Goodspeed, T.J. The relationship between state income taxes and local property taxes: Education finance in New Jersey. Natl. Tax J. 1998, 51, 219–238. [Google Scholar]
  29. Upadhyay, U.D.; Cartwright, A.F.; Johns, N.E. Access to medication abortion among California’s public university students. J. Adolesc. Health 2018, 63, 249–252. [Google Scholar] [CrossRef]
  30. Levey, R.L.; Connors, A.W.; Martin, L.L. Public university use of social infrastructure public-private partnerhips (P3s): An exploratory examination. Public Works Manag. Policy 2020. [Google Scholar] [CrossRef]
  31. Babatunde, S.O.; Perera, S. Public-private partnership in university female students’ hostel delivery analysis of users’ satisfaction in Nigeria. Facilities 2017, 35, 64–80. [Google Scholar] [CrossRef]
  32. Kerrihard, A.L.; Khair, M.B.; Blumberg, R.; Feldman, C.H.; Wunderlich, S.M. The effects of acclimation to the United States and other demographic factors on responses to salt levels in foods: An examination utilizing face reader technology. Appetite 2017, 116, 315–322. [Google Scholar] [CrossRef]
  33. SAS Institute Inc. Nonparametric analysis of variance. In SAS/STAT® 14.3 User’s Guide; SAS Institute Inc.: Cary, NC, USA, 2017; p. 113. [Google Scholar]
  34. Waller, B.M.; Warmelink, L.; Liebal, K.; Micheletta, J.; Slocombe, K.E. Pseudoreplication: A widespread problem in primate communication research. Anim. Behav. 2013, 86, 483–488. [Google Scholar] [CrossRef]
  35. Ramage, B.S.; Sheil, D.; Salim, H.M.W.; Fletcher, C.; Mustafa, N.Z.A.; Luruthusamay, J.C.; Harrison, R.D.; Butod, E.; Dzulkiply, A.D.; Kassim, A.R.; et al. Pseudoreplication in tropical forests and the resulting effects on biodiversity conservation. Conserv. Biol. 2013, 27, 364–372. [Google Scholar] [CrossRef]
  36. Hajrasouliha, A. Campus score: Measuring university campus qualities. Landsc. Urban Plan. 2017, 158, 166–176. [Google Scholar] [CrossRef]
  37. Hammeed, A.; Amjad, S. Students’ satisfaction in higher learning institutions: A case study of COMSATS Abbottabad, Pakistan. Iran. J. Manag. Stud. 2011, 4, 63–77. [Google Scholar]
  38. Ali, A.K. Academic staff’s perceptions of characteristics of learning organization in a higher institution. Int. J. Educ. Manag. 2012, 26, 55. [Google Scholar]
  39. Ybarra, M.L.; Mitchell, K.J. Online aggressor/targets, aggressors, and targets: A comparison of associated youth characteristics. J. Child Psychol. Psychiatry 2004, 45, 1308–1316. [Google Scholar] [CrossRef] [PubMed]
  40. Sanders, C.E.; Field, T.M.; Diego, M.; Kaplan, M. The relationship of Internet use to depression and social isolation among adolescents. Adolescence 2000, 35, 237–242. [Google Scholar] [PubMed]
  41. Chen, Z.; Poon, K.T.; Cheng, C. Deficits in recognizing disgust facial expressions and Internet addiction: Perceived stress as a mediator. Psychiatry Res. 2017, 254, 211–217. [Google Scholar] [CrossRef]
  42. Peng, X.Z.; Cui, F.; Wang, T.; Jiao, C. Unconscious processing of facial expressions in individuals with internet gaming disorder. Front. Psychol. 2017, 8, 9. [Google Scholar] [CrossRef]
  43. McCulloch, A. Housing density as a predictor of neighbourhood satisfaction among families with young children in urban England. Popul. Space Place 2012, 18, 85–99. [Google Scholar] [CrossRef]
  44. Landman, K.; du Tolt, J. Residents’ perceptions of the importance of outdoor spaces and neighbourliness for medium-density mixed-housing in South Africa. Town Region. Plan. 2014, 65, 23–34. [Google Scholar]
  45. Knudsen, A.B.; Slooff, R. Vector-borne disease problems in rapid urbanization - New approaches to vector control. Bull. World Health Organ. 1992, 70, 1–6. [Google Scholar]
  46. McLellan, S.L.; Newton, R.J.; Vandewalle, J.L.; Shanks, O.C.; Huse, S.M.; Eren, A.M.; Sogin, M.L. Sewage reflects the distribution of human faecal Lachnospiraceae. Environ. Microbiol. 2013, 15, 2213–2227. [Google Scholar] [CrossRef] [PubMed] [Green Version]
  47. Dockery, D.W.; Pope, C.A.; Xu, X.P.; Spengler, J.D.; Ware, J.H.; Fay, M.E.; Ferris, B.G.; Speizer, F.E. An association between air-pollution and mortality in 6 United-states cities. N. Engl. J. Med. 1993, 329, 1753–1759. [Google Scholar] [CrossRef] [PubMed] [Green Version]
  48. Kang, S.M.; Lau, A.S. Revisiting the out-group advantage in emotion recognition in a multicultural society: Further evidence for the in-group advantage. Emotion 2013, 13, 203–215. [Google Scholar] [CrossRef] [PubMed]
Figure 1. Ranked scores of happy and sad expressions and the positive response index (PRI) among selected 211-Project university campuses across mainland China. Universities are ordered by the growing score of happy expression. Different letters marked for significant difference are shown in Tables S2–S4.
Applsci 10 01474 g001
Figure 2. The geographical distribution of happy (A), sad (B), and positive response index (PRI; (C)) in cities with 211-Project universities across mainland China.
Applsci 10 01474 g002
Table 1. Specific parameters used in city variables about economy, public facility, habitation, and environment.
VariablesUnitParameter
EconomyYuanGDP per capita
×104 YuanPublic financial expenditure
×104 YuanCorporate profit of enterprises above designated scale 1
IndividualsPopulation of employees of C&T work-units 2
YuanAverage wage of enrolled employees of work-units
Public facility×104 HouseholdsNumber of internet wideband accesses
IndividualsReal number of end-of-year taxicabs
IndividualsNumbers of hospitals and health-centers
IndividualsNumber of regular institutions of higher education 3
×103 IndividualsCollection of books in public libraries
Habitationkm2Total area of residential lands
×104 IndividualsEnd-of-year population of registered residents
haTotal area of green space in C&T parks
×104 TonsDomestic water consumption by residents
×104 Kilowatt-hourElectricity consumption of C&T residents
Environment×104 TonsDischarge of industrial sewage
TonsEmission of industrial SO2
TonsEmission of industrial dust
PercentCentralized disposal of sewage
PercentDisposal of household garbage
Note: 1 Enterprises above designated scale, annual revenue over 20 million Yuan from the primary business of industrial enterprises; 2 C&T, city and town; 3 institutions of higher education, educational institutions that can grant degrees that are higher than high-school education, including university, college, vocational technique university/college, etc.
Table 2. Results of one-way analysis of variance (ANOVA) on ranked scores of happy and sad expressions, and positive response index (PRI) in visitors at university campuses across mainland China.
VariableDegree of FreedomSum of SquaresF Valuep Value
ModelErrorCorrection
Happy9542314326354,720,0952.49<0.0001
Sad276,605,6671.94<0.0001
PRI328,290,1972.28<0.0001
Table 3. The analysis of collinearity among city variables on ranked scores of happy and sad expressions, and positive response index (PRI) in visitors at university campuses across mainland China.
VariableDF 1HappySadPRI
Pr > |t|VIF 2Pr > |t|VIFPr > |t|VIF
Intercept10.320800.782500.01920
GDP per capita10.19928.59490.56818.59490.1348.5949
Public financial expenditure10.00243264.959760.1355264.959760.0033264.95976
Corporate profit of enterprises above designated scale 410.036159.39440.034459.39440.071959.3944
Population of employees of C&T work-units 510.0511221.3030.0547221.3030.0945221.303
Average wage of enrolled employees of work-units10.0395107.130490.9147107.130490.0262107.13049
Number of internet wideband accesses10.108245.014350.95345.014350.089745.01435
Real number of end-of-year taxicabs 10.826174.328910.8198174.328910.7701174.32891
Numbers of hospitals and health-centers10.141858.346080.360558.346080.169258.34608
Number of regular institutions of higher education 610.143814.731090.132314.731090.217214.73109
Collection of books in public libraries10.5681187.983650.316187.983650.4092187.98365
Total area of resident lands10.6997112.745080.0511112.745080.9902112.74508
End-of-year population of registered residents10.343179.377110.480579.377110.392979.37711
Total area of green space in C&T parks10.488669.928690.078369.928690.724569.92869
Domestic water consumption by residents10.726363.860340.896863.860340.727963.86034
Electricity consumption of C&T residents10.5377178.413550.8228178.413550.5412178.41355
Discharge of industrial sewage10.367122.320380.805422.320380.313522.32038
Emission of industrial SO210.77714.734470.379914.734470.908314.73447
Emission of industrial dust10.767510.032240.267610.032240.575410.03224
Centralized disposal of sewage10.09425.492060.57215.492060.05625.49206
Disposal of household garbage10.91161.580690.01561.580690.50841.58069
Note: 1 DF, degree of freedom; 2 VIF, variance inflation; 3 Values in bold font indicate significant VIF; 4 Enterprises above designated scale, annual revenue over 20 million Yuan from the primary business of industrial enterprises; 5 C&T, city and town; 6 institutions of higher education, educational institutions that can grant degrees that are higher than high-school education, including university, college, vocational technique university/college, etc.
Table 4. Maximum likelihood estimation of multiple city variables on happy expression scores of students from key universities of cities across mainland of China.
ParameterDegree of FreedomEstimateStandard ErrorWald 95% ConfidenceWald Chi-SquarePr > Chi-Square
Intercept11−2.9860.9664−4.8802−1.09189.550.002
GDP per capita100002.040.1536
Public financial expenditure1000012.060.0005
Corporate profit of enterprises above designated scale2100005.760.0164
Population of employees of C&T work-units3100005.880.0153
Average wage of enrolled employees of work-units100005.720.0168
Number of internet wideband accesses1−0.00160.0008−0.003104.080.0435
Real number of end-of-year taxicabs 1000000.9914
Numbers of hospitals and health-centers1−0.0010.0005−0.0020.00013.330.068
Number of regular institutions of higher education410.00660.0030.00060.01254.720.0299
Collection of books in public libraries100000.610.4358
Total area of resident lands1−0.00040.0013−0.0030.00220.070.7845
End-of-year population of registered residents10.00040.0004−0.00030.00111.550.2127
Total area of green space in C&T parks100000.990.3188
Domestic water consumption by residents100000.080.7836
Electricity consumption of C&T residents100000.320.5745
Discharge of industrial sewage100001.320.251
Emission of industrial SO2100000.120.7286
Emission of industrial dust100000.070.7971
Centralized disposal of sewage10.00950.005−0.00020.01923.660.0556
Disposal of household garbage1−0.00010.0037−0.00740.007200.9788
Scale10.07560.00530.06590.0867
Note: 1 Values in bold font indicate significant contribution; 2 Enterprises above designated scale, annual revenue over 20 million Yuan from the primary business of industrial enterprises; 3 C&T, city and town; 4 institutions of higher education, educational institutions that can grant degrees that are higher than high-school education, including university, college, vocational technique university/college, etc.
Table 5. Maximum likelihood estimation of multiple city variables on sad expression scores of students from key universities of cities across mainland of China.
ParameterDegree of FreedomEstimateStandard ErrorWald 95% ConfidenceWald Chi-SquarePr > Chi-Square
Intercept11−3.68371.2682−6.1693−1.19828.440.0037
GDP per capita100000.240.6208
Public financial expenditure100002.920.0873
Corporate profit of enterprises above designated scale2100006.30.0121
Population of employees of C&T work-units3100005.40.0201
Average wage of enrolled employees of work-units100000.010.9366
Number of internet wideband accesses100.0009−0.00170.001800.9621
Real number of end-of-year taxicabs 100000.080.7727
Numbers of hospitals and health-centers10.00070.0007−0.00060.001910.3182
Number of regular institutions of higher education 41−0.00660.004−0.01450.00132.680.1018
Collection of books in public libraries100001.950.1624
Total area of resident lands10.00410.00160.00090.00736.460.0110
End-of-year population of registered residents1−0.00030.0004−0.00110.00050.590.4429
Total area of green space in C&T parks10000.00014.130.0421
Domestic water consumption by residents100000.010.9139
Electricity consumption of C&T residents100000.120.7326
Discharge of industrial sewage100000.220.6418
Emission of industrial SO2100001.320.2498
Emission of industrial dust100001.410.2345
Centralized disposal of sewage10.00450.006−0.00730.01620.550.4565
Disposal of household garbage10.01550.0079−0.00010.0313.790.0515
Scale10.03070.00210.02680.0352
Note: 1 Values in bold font indicate significant contribution; 2 Enterprises above designated scale, annual revenue over 20 million Yuan from the primary business of industrial enterprises; 3 C&T, city and town; 4 institutions of higher education, educational institutions that can grant degrees that are higher than high-school education, including university, college, vocational technique university/college, etc.
Table 6. Maximum likelihood estimation of multiple city variables on PRI expression scores of students from key universities of cities across mainland of China.
ParameterDegree of FreedomEstimateStandard ErrorWald 95% ConfidenceWald Chi-SquarePr > Chi-Square
Intercept10.56611.9418−3.23964.37190.090.7706
GDP per capita100000.870.3512
Public financial expenditure1100009.990.0016
Corporate profit of enterprises above designated scale2100007.230.0072
Population of employees of C&T work-units3100007.860.0051
Average wage of enrolled employees of work-units10000.00013.360.067
Number of internet wideband accesses1−0.00280.0015−0.00570.00013.540.0599
Real number of end-of-year taxicabs 100000.140.7117
Numbers of hospitals and health-centers1−0.00220.0025−0.00720.00270.770.3798
Number of regular institutions of higher education410.01470.00560.00370.02566.930.0085
Collection of books in public libraries100000.240.6262
Total area of resident lands1−0.00210.0011−0.004204.030.0448
End-of-year population of registered residents10.00110.0007−0.00030.00242.260.1326
Total area of green space in C&T parks100−0.0001030.0831
Domestic water consumption by residents100000.080.7752
Electricity consumption of C&T residents100000.020.8823
Discharge of industrial sewage10000.00010.780.3771
Emission of industrial SO2100000.50.4802
Emission of industrial dust100000.110.7397
Centralized disposal of sewage10.01290.0096−0.00590.03171.810.1781
Disposal of household garbage1−0.00670.0062−0.01890.00541.190.2751
Scale19.21930.64558.037110.5753
Note: 1 Values in bold font indicate significant contribution; 2 Enterprises above designated scale, annual revenue over 20 million Yuan from the primary business of industrial enterprises; 3 C&T, city and town; 4 institutions of higher education, educational institutions that can grant degrees that are higher than high-school education, including university, college, vocational technique university/college, etc.

