1. Introduction
The social and economic costs of road accidents due to car collisions are continuously increasing, which requires urgent attention. The accidents caused by car collisions can be divided into three categories: front collision, side collision, and rear-end collision, among which the accident incidence rate of rear-end collisions is the highest [
1,
2,
3]. Because neck injuries are the most frequent injuries caused by rear-end collision, the headrest needs to be redesigned to minimize such injuries. Whiplash injuries occur at relatively low velocity changes (typically <25 km/h) [
4,
5] and in impacts from all directions, although rear impacts are most frequently featured in accident statistics [
6]. To this end, several studies focused on investigating the effect of design variables such as stiffness of a car seatback cushion, backseat, and head contact time on the injury, and static and dynamic tests applied for establishing the headrest evaluation criteria are becoming more strict [
7,
8]. In addition, the factors causing neck injuries during rear-end collision were estimated by developing dummies and human models [
9,
10]. Determining neck injury mechanisms and developing methods to measure neck-injury related parameters are of importance for current crash-safety research [
11]. However, the optimization of trajectory and connection structure of the headrest to reduce neck injuries was rarely discussed in the literature. Consequently, it is difficult to include these parameters in the seat design.
Several studies focused on the structural analysis of seats to prevent neck injury by suppressing the relative movement between head and torso [
12,
13]. Furthermore, several test methods based on injury indices were reported to determine the degree of neck injury of the passenger during rear-end collision [
3,
14]. However, the practical implementation of neck injury indices obtained from human bodies may not be appropriate because the measurement accuracy of the existing human body model is limited.
Although similar rules apply to all the tests, when a test is conducted using a human body model, which is normally used in a car collision test, the measurement of test data often fails due to the disconnection of the sensor cable during the test. Furthermore, when the initial verification of the human body model is not completed, in addition to sensor measurement, behavior analysis provides an indicator of injury indices [
15,
16].
In this study, the neck injury indices corresponding to the active and proactive headrests during rear-end collision tests were analyzed. The predictability of injury indices was investigated through the behavior analysis of the head and seat. The characteristics of head–neck behavior and the structure of the headrests were analyzed. Furthermore, the neck injury indices of the two headrests were compared. The predictability of major neck injury indices was examined, which may provide a useful reference for developing an active deployment system to complement the headrest deployment characteristics.
2. Sled Test
2.1. Sled Test Methodology
The Korean new car assessment program (KNCAP) test method was used for the sled test. A pneumatic acceleration sled equipment at Automotive Performance Research Institute at the Korea Transportation Safety Authority was used as the test equipment. The seat and head restraints for testing were located at the center of all mechanisms that could act on them. For seating the dummy, the three-dimensional (3D) mannequin and the head restraint measuring device (HRMD) were first seated to measure the gap between the head support and the HRMD (i.e., rear spacing) and the H-point of the 3D mannequin, and then the sled test for the seat satisfying the static test was conducted.
The biofidelic rear-impact dummy II (BioRID II) was used for the sled test [
12,
17]. Sensors were mounted on BioRID II to evaluate the neck injury, as shown in
Table 1. Furthermore, for assessing the behavior of the human body model with a high-velocity digital camera, the test was conducted by placing a recognition mark on the head and neck.
Relevant pictures were captured to check the seating status of the human body model before and after the test, and, for analyzing the behavior of the this model during the test, a high-velocity camera was installed on a test car used for simulating collision to capture 1000 scenes per second.
To repeat the test for rear-end collisions, test equipment for simulating the collisions was required and acceleration/deceleration pulses of rear-end collision were determined. In this test, a 16-km/h triangular pulse, which is the most common rear-end collision pulse globally, was used. This pulse is shown in
Figure 1. The test waveform had a maximum and average acceleration of 10×
g and 5.5×
g, respectively, which led to a collision velocity of 16 km/h. Waveforms 1–4 shown in
Figure 1 were the waveforms used in the experiment.
Various parameters were analyzed to assess the results of the sled test. As shown in
Table 2, neck injuries were evaluated by measuring seven criteria.
2.2. Headrest Structure
The headrest provides head support in the seat and is a safety device to prevent momentary backward bending of neck bones during a collision. In this paper, two headrest structures, i.e., active and proactive headrests, were used in the sled experiment.
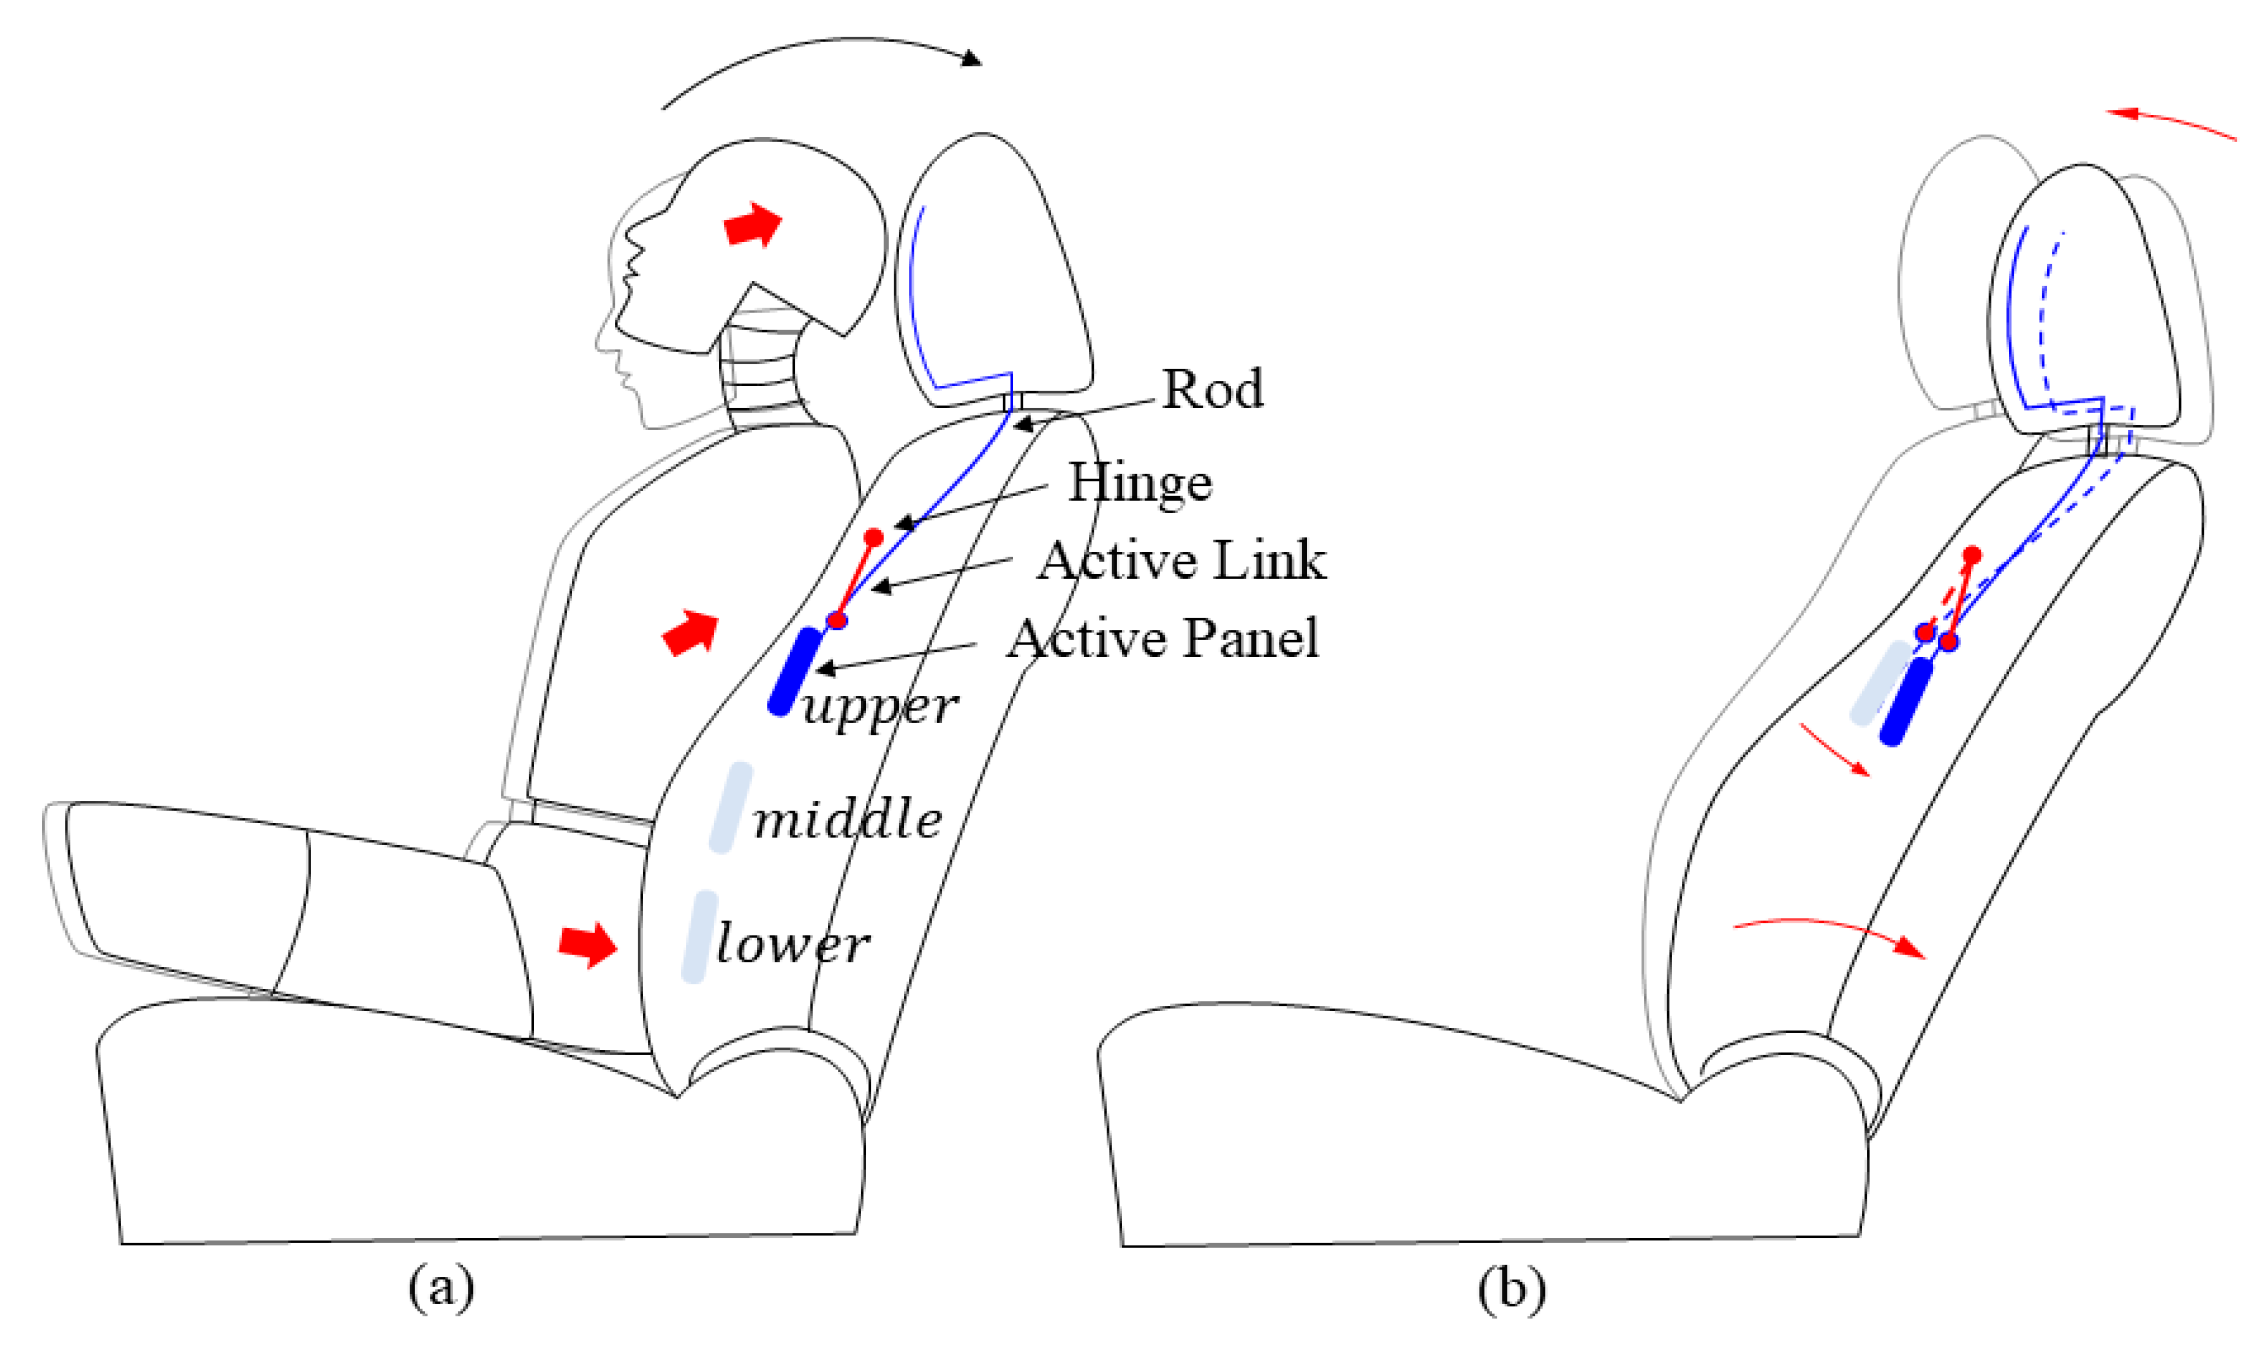
The active headrest exhibits a structure, which supports the passenger’s head by moving the headrest forward through the mechanism connected from the seatback to the headrest using the upper body’s inertia transmitted to the seatback during rear-end collision.
Figure 2 shows the components of the active headrest and the conceptual diagram of its operation. It is evident that the movement of the headrest is determined by the force of the upper body acting on the seatback, and, in some cases, the headrest may not work if the upper body fails to impart a force on the headrest deployment structure located in the seatback. The components of the deployment structure of the active headrest include the link and hinge, which connect the headrest with the active panel located in the seatback. The active panel moves backward due to the inertia of the upper body in the collision.
The proactive headrest uses the deployment signal transmitted from the vehicle’s ECU (electronic control unit) in the event of a rear-end collision to activate the headrest’s actuator or solenoid and to move a part of the headrest in the forward direction to support the passenger’s head.
Figure 3 shows the components of the proactive headrest and the conceptual diagram of its operation. When a collision occurs, the time taken to transmit the signal and deploy the headrest is about 30 ms.
2.3. Seat Behavior Analysis
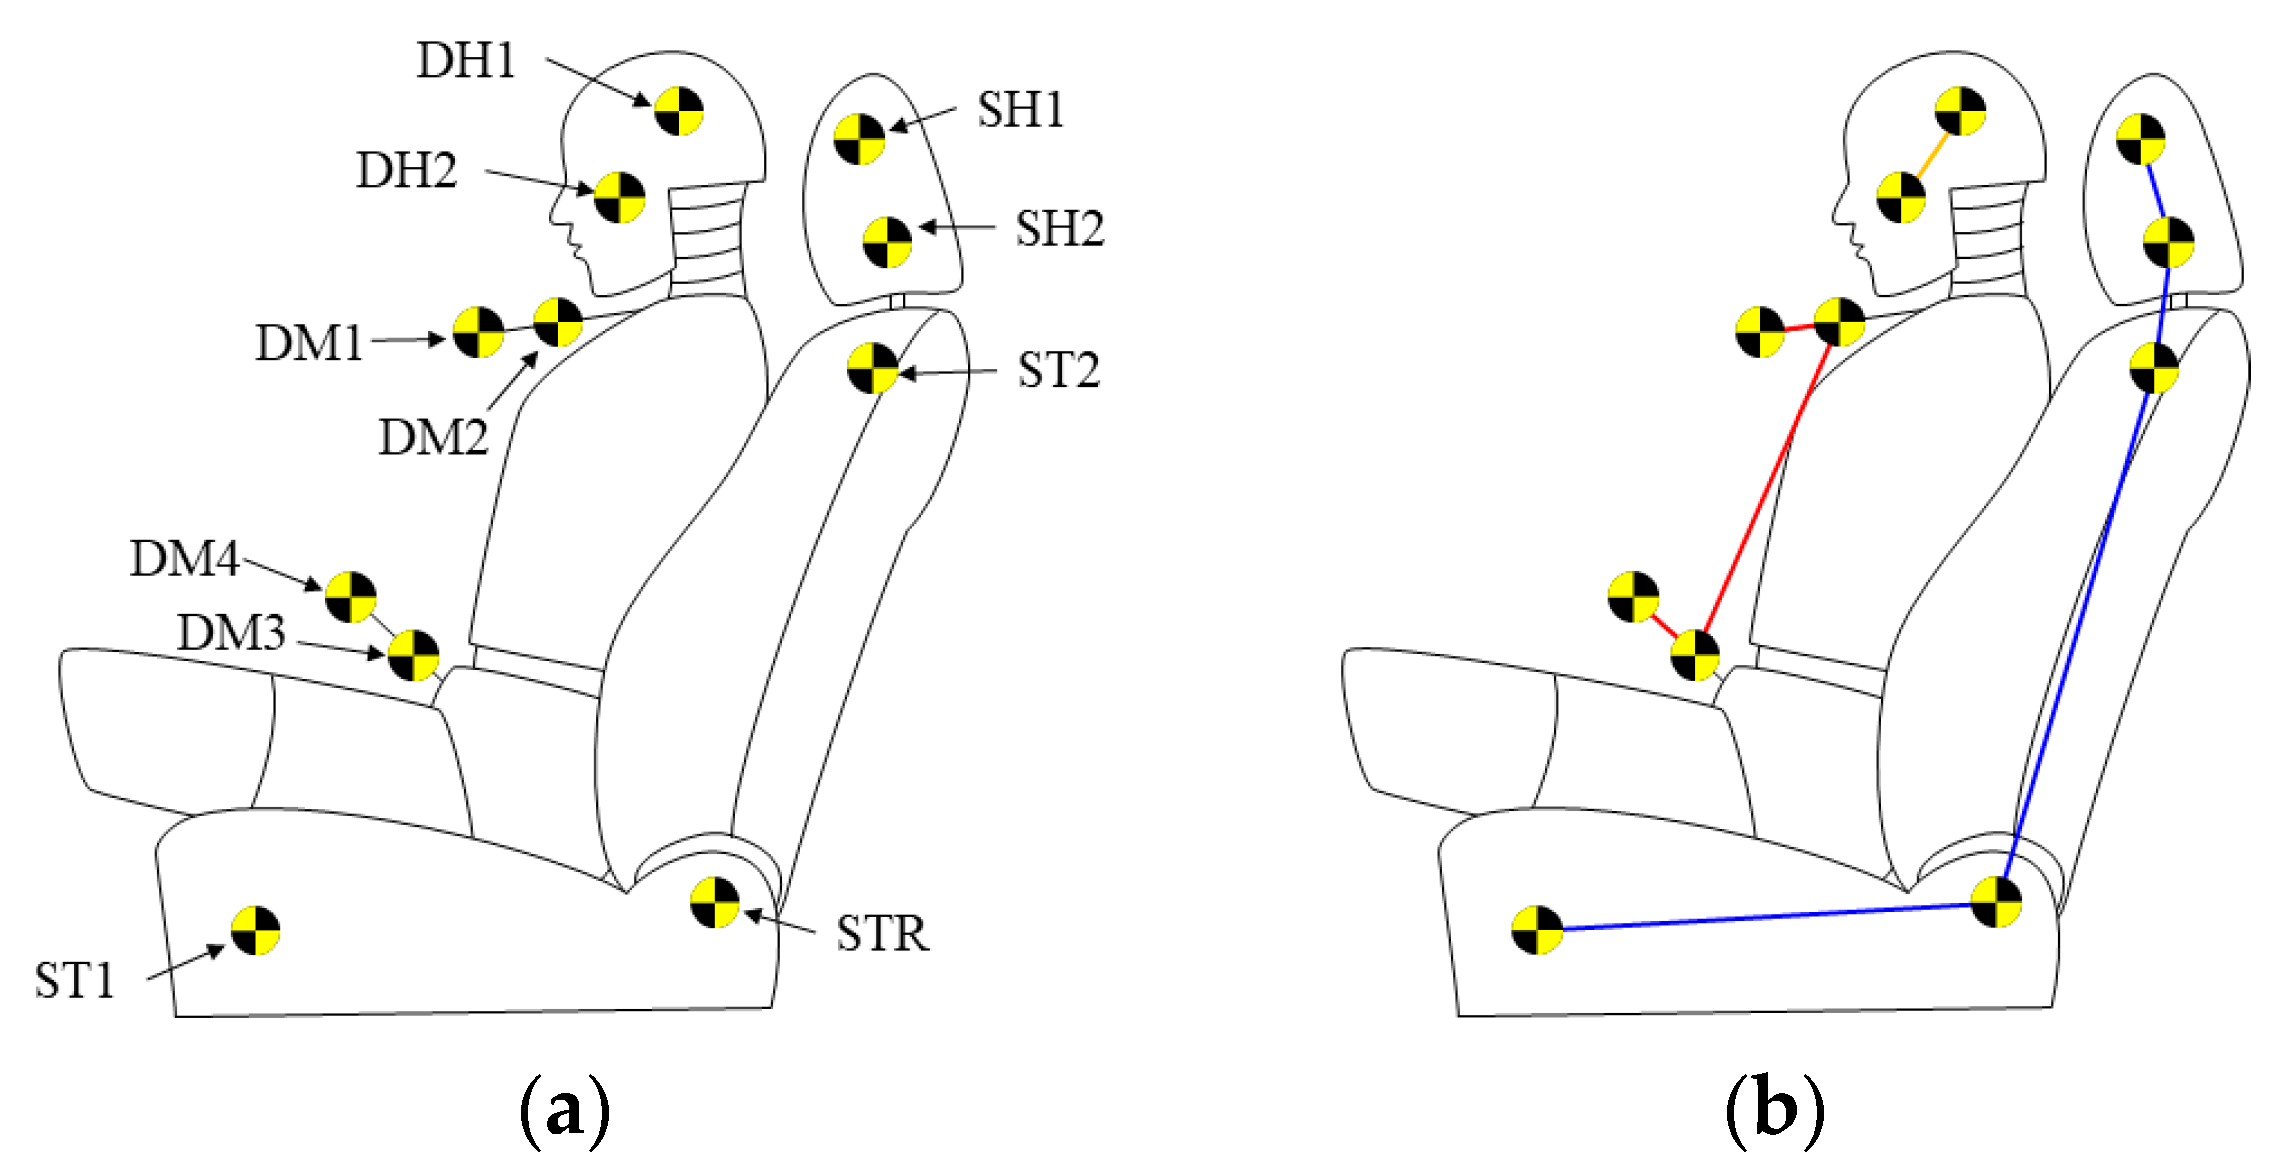
Markers were attached to the seat and dummy to analyze the deformation of the seat and the posture of the dummy before and after the sled test.
Figure 4 shows a schematic of the seat and dummy with attached markers. These markers were attached to confirm the changes in their inclination and position. Six markers were attached to the dummy and five markers were attached to the seat. On the dummy, four markers were attached to the body and two markers were attached to the head; on the seat based on a recliner, one marker was attached to the cushion, one marker was attached to the seatback, and two markers were attached to the headrest.
3. Behavior Analysis of Sled Test Results
3.1. Behavior Analysis of Active Headrest and Dummy
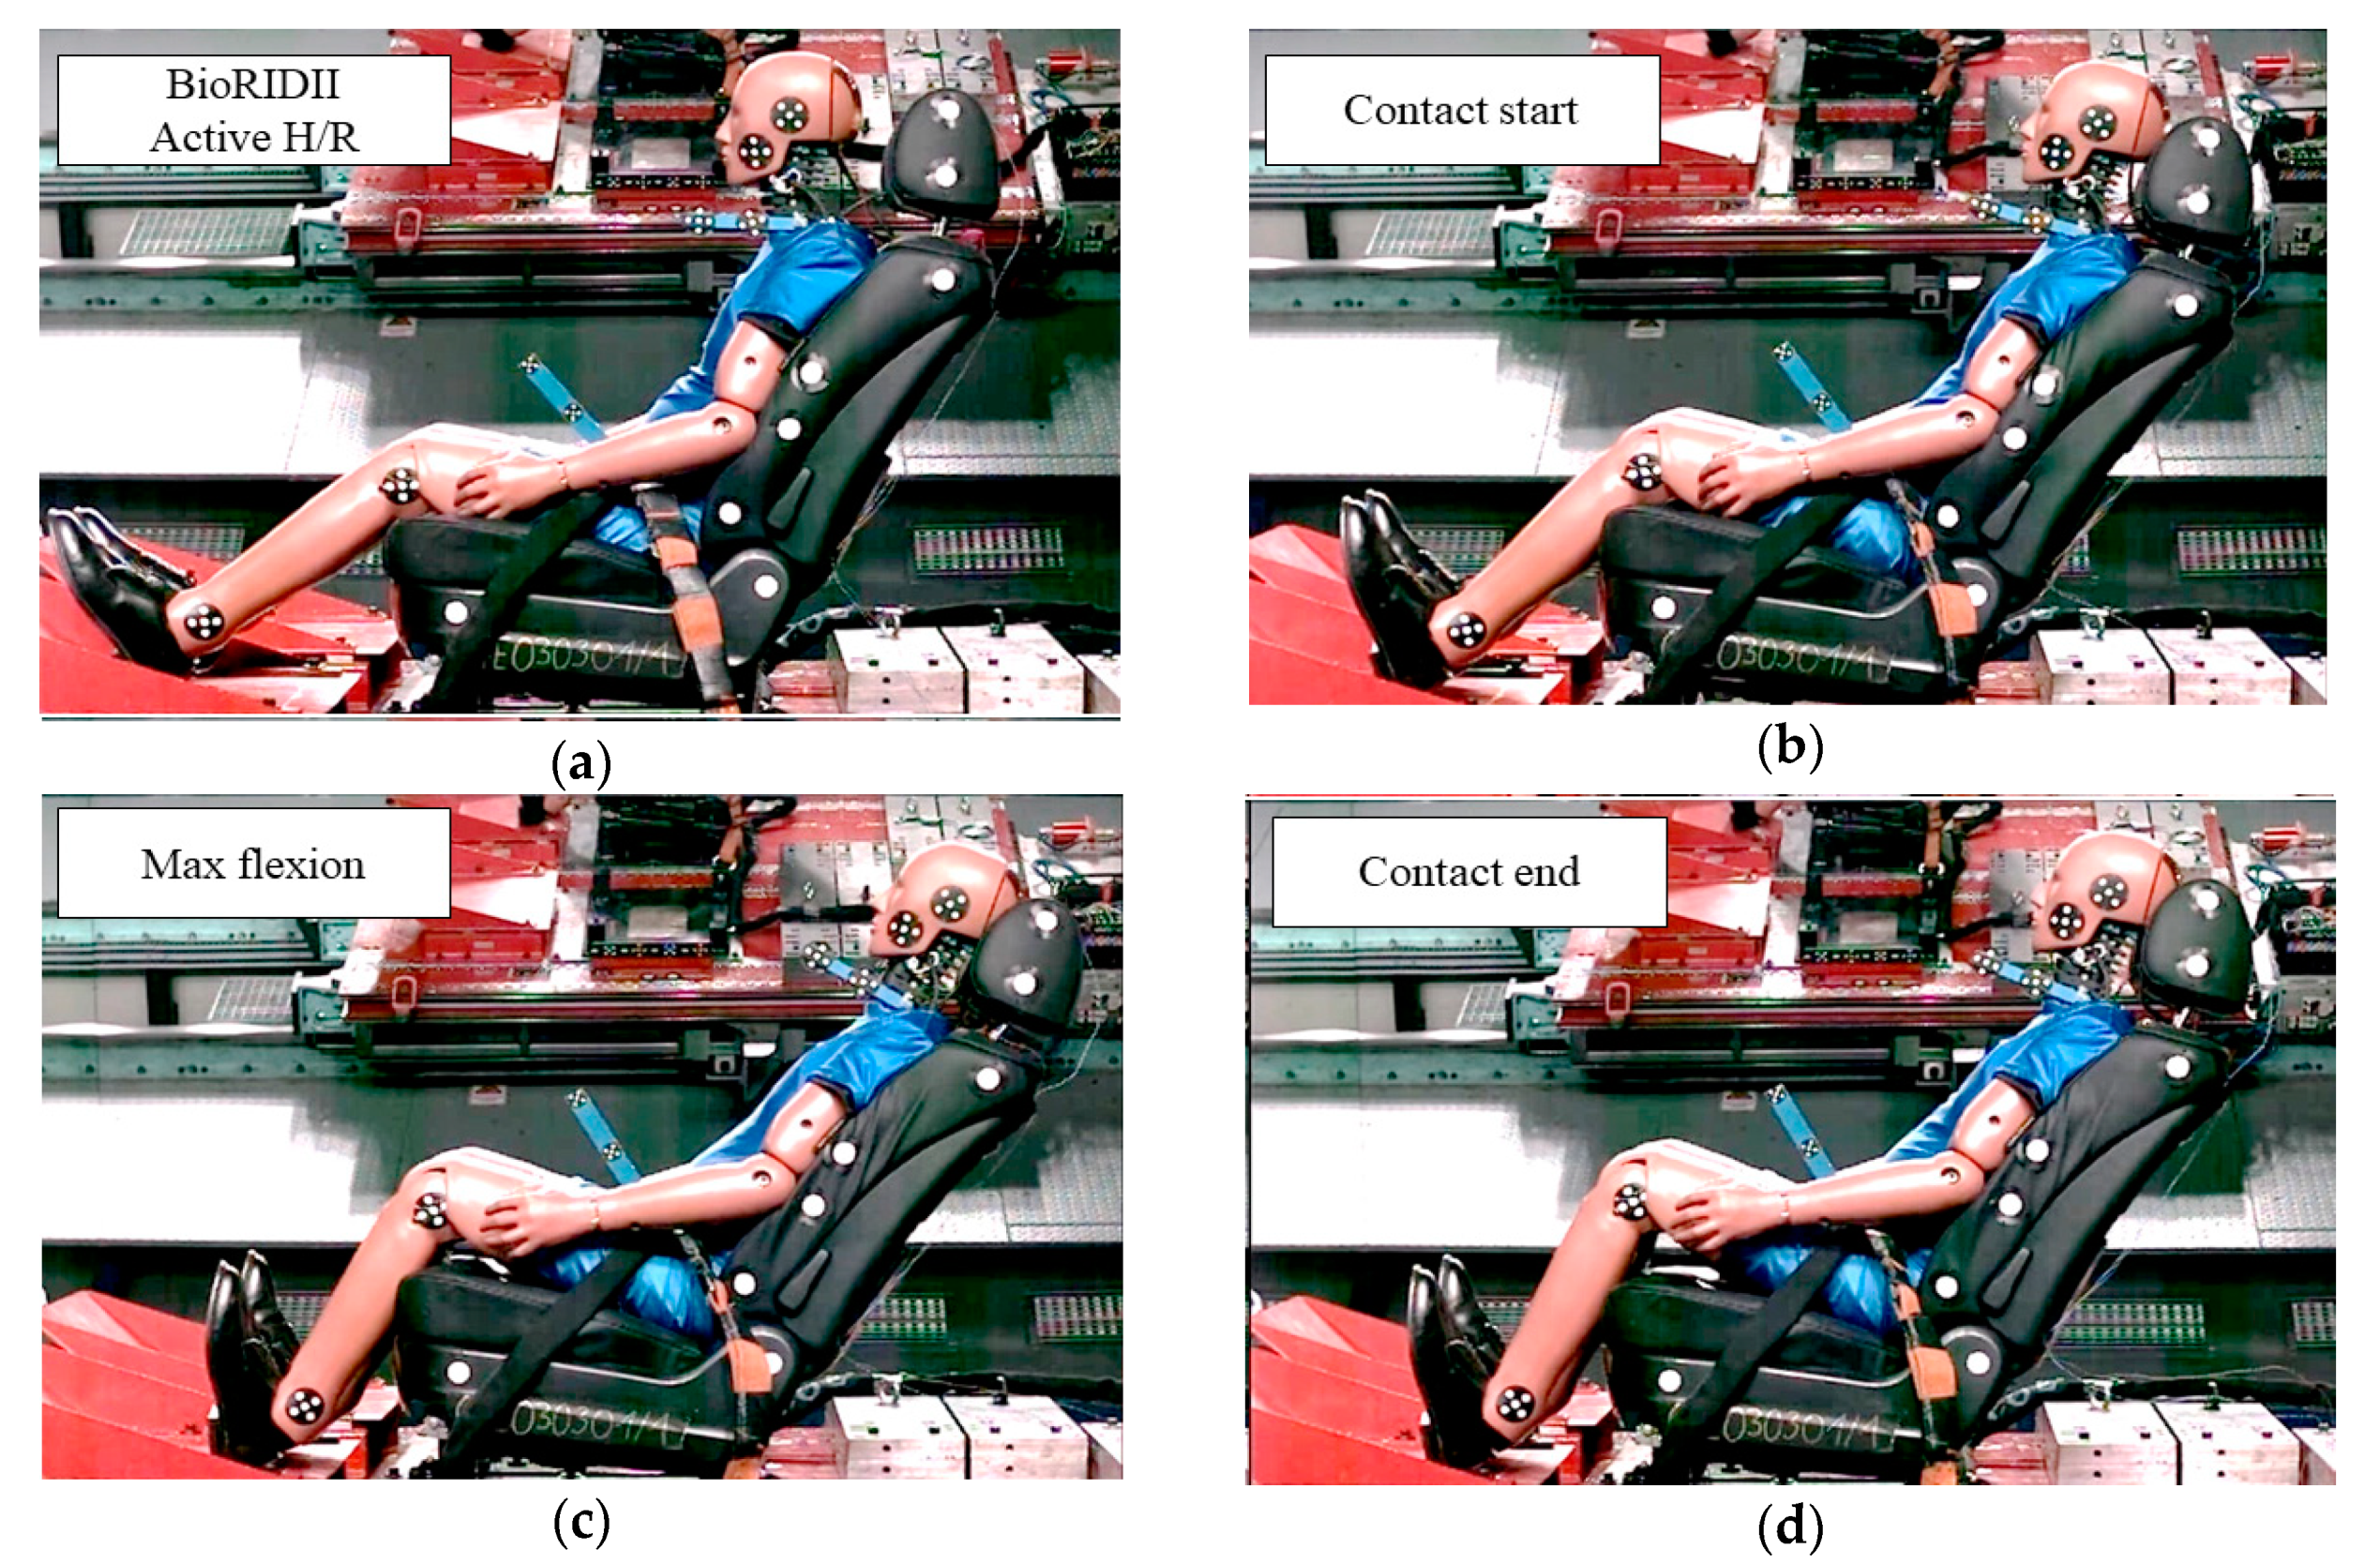
Test images were used to analyze the behavior of the dummy and seat during the sled test of the active headrest.
Figure 5 shows these images, which were captured immediately after the collision signal (0 ms), during the contact between the dummy and the headrest (80 ms), during the maximum buckling of the seatback (134 ms), and during the contact between the dummy and the headrest (160 ms). Immediately after the initial seat was impacted, the dummy and seat moved in the same direction due to inertial motion, while the seatback supported the dummy’s upper body. Consequently, the dummy’s head contacted the headrest. When the dummy and the seat were in contact with each other, the rear side was pulled back, and, after the maximum deformation, it moved to the opposite direction, and the dummy’s head and headrest fell off.
Figure 6 shows the results for the active headrest before and after the sled test was applied to the corresponding seat. The seatback was deformed backward after the test, and the headrest also moved backward according to this deformation.
The behavior of the dummy and seat was analyzed according to direction and velocity. As shown in
Figure 7a, the maximum velocity of the dummy head was achieved in the
x-direction until it came into contact with the headrest, and when the maximum overextension occurred, the velocity changed in the opposite direction. The velocity in the
y-direction was slightly varied before and after the maximum overextension. Although the velocity change of the headrest in the
x-direction and during the deployment exhibited a deceleration effect by forward movement as the dummy upper body pressed the active panel of the seatback, the velocity changes after the maximum overextension event of the seatback and the contact of the dummy head had a minor effect on the velocity. The velocity change in the
y-direction occurred smoothly after the maximum overextension event.
Figure 7b shows the variation in the velocity of the upper body of the dummy, where the velocity reached the maximum in the
x-direction, became zero when maximum overextension occurred, and then changed in the opposite direction, while the velocity change in the
y-direction was negligible. Furthermore, the seatback initially moved in the rear direction and then changed its direction after the dummy head and headrest came into contact with each other to decelerate, which caused the maximum overextension.
Figure 7c shows the variation in the velocity of the head and upper body of the dummy. It is evident that both exhibited the maximum velocity in the
x-direction and in the
y-direction when maximum overextension occurred. Furthermore, we observed that the relative velocity could generate shear and tensile forces in the neck.
Based on the relative velocity between the seatback and the headrest, the dummy’s upper body pushed the seatback, and the active panel was activated such that it decelerated when the headrest operated and accelerated when it supported the head. The velocity in the y-direction was almost unchanged. During the overextension, the velocity in the x-direction was changed due to the contact with the dummy’s head, which caused deformation in the rear direction.
3.2. Dynamic Behavior Analysis of Proactive Headrest and Dummy
The images of the proactive headrest during the sled test were used to analyze the behavior of the dummy and seat, and they were captured in the beginning at headrest deployment (30 ms), during the contact between the dummy and headrest (60 ms), during the maximum buckling of the seatback (135 ms), and during the disengagement of the contact between the dummy and the headrest (190 ms).
Figure 8 shows a test set-up based on the dummy and headrest of the proactive headrest seat. Immediately after the seat was impacted, the dummy and seat began to move in the same direction. The trigger of the headrest received the signal and the headrest began to deploy, making quick contact with the dummy’s head. Subsequently, the dummy came in close contact with the seatback and the headrest, causing overextension in the rear direction, and, after the maximum deformation, the dummy moved in the opposite direction and the dummy’s head and headrest fell off.
Figure 9 compares the results corresponding to the proactive headrest before and after the test was conducted on the seat, where it is clear that the seatback was deformed backward. However, it is possible that the head was supported even after a rear-end collision because the initial position of the headrest shifted forward and upward.
Figure 10a shows the variation in the velocity of the head of the dummy. Here, the maximum velocity was achieved in the
x-direction when it contacted the headrest; the head stopped moving at the overextension event, and then the velocity increased in the same direction, while the velocity in the
y-direction was slightly changed before and after the maximum overextension event.
The velocity of the headrest significantly varied in the x- and y-directions during the deployment, and it was decelerated by contact with the head, and then accelerated in the rear direction to change the direction at maximum overextension.
Figure 10b shows the velocity of the upper body of the dummy. It is evident that the dummy attained the maximum velocity in the
x-direction, stopped when maximum overextension occurred, and then its velocity was changed in the opposite direction, while the velocity in the
y-direction slightly changed in the initial direction. The velocity of the seatback also changed in the opposite direction by deceleration during the overextension.
Figure 10c shows the variation in the relative velocity of the head and torso of the dummy, where the maximum velocity in the
x- and
y-directions was attained during the maximum overextension. It was found that the relative velocity could generate shear and tensile forces in the neck.
Based on the relative velocity between the seatback and the headrest, it is clear that the headrest was suddenly accelerated due to the deployment of the headrest, which moved faster in the y-direction than in the x-direction. The variation in the velocity in the x-direction during the overextension event was due to the contact with the head of the dummy and the deformation in the rear direction.
3.3. Relative Behavior Analysis of Dummy and Headrest
The relative motions and behavior of the active headrest seat, proactive headrest seat, and dummy during the rear collision were analyzed. As shown in
Figure 11a, after the collisions, the upper body of the dummy delivered sufficient pressure to the seatback, and then the headrest deployed to contact with the head; it supported the head and flipped back. It was found that there was a relatively longer movement in the rear direction until the contact occurred, and it was supported for a short time until the maximum overextension occurred. Based on the behavior of the dummy, the upper body generally moved horizontally in the rear direction, and the overextension occurred along the head due to the overextension of the seatback.
Figure 11b shows the relative motion and behavioral characteristics of the proactive headrest during the rear collision. It is clear that, after the collision occurred, the upper body of the dummy put pressure on the seatback, causing the headrest to deploy during the contact to support the head and to flip backward. The movement distance in the rear direction was short until the contact occurred, and it can be confirmed that it was supported for a sufficient time until the maximum overextension occurred after the contact. Based on the behavior of the dummy, the upper body generally moved horizontally in the rear direction, and the upward movement occurred due to the overextension of the seatback.
Comparing the behavior of the heads of the dummies in the active and the proactive headrest seats, the proactive headrest started the contact quickly to support the head and exhibited a relatively short-distance movement.
4. Comparison of Neck Injury Indices for the Two Headrests
Based on the sled test results, the head restraint contact (HRC) time, T1 acceleration, upper neck shear and tensile force (F
x, F
z), head rebound velocity (HRV), neck injury criteria (NIC), and neck force criterion (Nkm) were derived. The measurement range of the neck injury was from t = 0 when the acceleration waveform began to be transmitted through the sled machine until the time when the contact between the head and headrest was lost due to recoil of the seat.
Table 3 presents the values of these parameters derived from the headrest test results. The test data for the active headrest and the proactive headrest are compared here.
In the experiment, the HRC measurement was performed by attaching a contact switch to the head support to electrically measure the time of the contact with a rear cover on the head of the human body. As shown in
Table 3, the minimum and maximum HRC times of the active headrest were 58.9 ms and 99.7 ms, respectively. For the proactive headrest, these values were 52 ms and 64.3 ms, respectively, which are shorter than those for the active headrest. This result is consistent with the previous trajectory analysis.
T1 acceleration is an injury index that examines the acceleration in the lower part of the neck based on the acceleration acting on the T1 node of the thoracic spine. The T1 acceleration of the active headrest ranged from 3.56× g to 7.27× g, and that of the proactive headrest was relatively smaller and ranged from 1.83× g to 3.28× g. In the active headrest, the dummy did not move initially due to inertia, but later moved slowly in the rear direction, and the chest of the dummy was supported by the seatback support. However, the head of the dummy was not supported by the headrest and, thus, continued to move. In this process, T1 acceleration showed an increasing tendency due to the increased relative movement between the head and torso.
Shear force (Fx) at the top of the neck was initially negative when the head was restrained to the headrest, and, when the dummy was recovered by the rebound of the seat, the chest moved farther in the forward direction than the head and Fx became positive. The maximum value of Fx was attained when the contact with the headrest was lost due to the rebound of the head, and it ranged from 4.21 N to 166.07 N. The tension force (Fz) at the top of the neck was negative due to the compressive load acting along the axial direction of the chest when the head was restrained to the headrest, and, as the rebound increased the load in the axial direction, it attained a positive value ranging from 109.65 N to 407.88 N.
Head rebound velocity (HRV) is the difference between the absolute velocity at the center of gravity of the dummy’s head and the absolute velocity of the sled. HRV can be obtained by integrating the measurements from an accelerometer on the head model and the sled acceleration pulse values to convert to the velocity value. The calculated values ranged from 1.24 to 3.07 m/s. Neck injury criteria (NIC) is an injury index that quantitatively identifies the relative behavior difference between the head and neck. In other words, the degree of injury is quantified by the acceleration of the head in the direction of the sled and the acceleration in the horizontal direction with respect to T1. NIC values ranged from 9.74 to 24.12 m2/s2. Finally, the shear index at the top of the neck and the composite index of the moment (Nkm) ranged from 0.12 to 0.49.
Based on the whiplash assessment criteria analysis, the proactive headrest exhibited better results than the active headrest. This is in agreement with the trajectory analysis, which showed that the proactive headrest supported the dummy quickly and consistently.
5. Conclusions
Major injury factors such as the injury index and T1, which are used as neck injury indices, were explored, and a comparative analysis of the distance of horizontal movement and the rotational angle of the dummy head was conducted to confirm the injury indices of the dummy model measured by the sensor and to validate the behavioral characteristics. In previous studies, the visual solution was evaluated by measuring NIC values, but simultaneously analyzed the movement trajectories of the headrest and the dummy. It was confirmed that the trajectory of the head restraint that supports the head continuously in the rear collision alleviated the neck injury. The main results of the study, which can be used to optimize the structural design of headrests for reducing neck injuries, are summarized as follows:
The rear collision test confirmed the behavior of the human body and the seat. Furthermore, the movement of the human model in the x-direction, which was caused by the relative movement of the head and the headrest, the movement of the seatback, and the difference in the distance of headrest’s deployment from the moment of contact between the headrest and the head to the time when the contact was lost, were verified. Overall, we infer that the deployment structure of the headrest should be designed to minimize the relative movement of the head and the upper body.
After a contact was achieved between the headrest and head, it was confirmed that the relative acceleration varied according to the rotation of the head, while the seatback was flipped backward due to inertia. To prevent this, the rotation of the head was suppressed through the upward and forward movement of the headrest during the overextension of the seatback, and it was confirmed that the neck injury could be reduced.
The time range in which the maximum distance of horizontal movement for the head of human body was distributed in the x-direction was similar to that of the neck injury indices of T1, Fx, Fz, and Nkm. By comparing the neck injury indices, it was found that, as the horizontal movement distance in the x-direction increased, Fz and NIC values also increased.
Although the neck injury indices were distributed in similar time zones, the increase in the neck injury indices due to the increase in the movement distance of the head was affected by Fz; thus, the load acting along the axial direction of the neck could be confirmed by the horizontal movement distance of the head in the x-direction; however, it may sometimes be different. Accordingly, the injury indices could be predicted.
Author Contributions
Y.S.Y., Y.S.K., and E.S.J. performed the experiments; Y.S.Y., Y.S.K., and E.S.J. analyzed the data; Y.S.Y., Y.S.K., and E.S.J. contributed reagents/materials/analysis tools; Y.S.Y., Y.S.K., and E.S.J. wrote the paper. All authors have read and agreed to the published version of the manuscript.
Acknowledgments
This work was supported by the research grant of Kongju National University in 2019.
Conflicts of Interest
The authors declare no conflicts of interest.
References
- Umeyama, M. Experimental study of head-on and rear-end collisions of two unequal solitary waves. Ocean Eng. 2017, 137, 174–192. [Google Scholar] [CrossRef]
- Li, X.; Yan, X.; Wu, J.; Radwan, E.; Zhang, Y. A rear-end collision risk assessment model based on drivers’ collision avoidance process under influences of cell phone use and gender—A driving simulator based study. Accid. Anal. Prev. 2016, 97, 1–18. [Google Scholar] [CrossRef] [PubMed]
- Zhao, P.; Lee, C. Assessing rear-end collision risk of cars and heavy vehicles on freeways using a surrogate safety measure. Accid. Anal. Prev. 2018, 113, 149–158. [Google Scholar] [CrossRef] [PubMed]
- Linder, A.; Schick, S.; Hell, W.; Svensson, M.Y.; Carlsson, A.; Lemmen, P.; Schmitt, K.-U.; Gutsche, A.; Tomasch, E. ADSEAT—Adaptive seat to reduce neck injuries for female and male occupants. Accid. Anal. Prev. 2013, 60, 334–343. [Google Scholar] [CrossRef] [PubMed]
- Anders, K.; Linda, E.; Ola, B.; Maria, K. Validation of neck injury criteria using reconstructed real-life rear-end crashes with recorded crash pulses. In Proceedings of the 18th ESV Conference, Nagoya, Japan, 19–22 May 2003; pp. 1–13. [Google Scholar]
- Watanabe, Y.; Ichikawa, H.; Kayama, O.; Ono, K.; Kaneoka, K.; Inami, S. Influence of seat characteristics on occupant motion in low-speed rear impacts. Accid. Anal. Prev. 2000, 32, 243–250. [Google Scholar] [CrossRef]
- Behera, S.K.; Das, D.P.; Subudhi, B. Adaptive nonlinear active noise control algorithm for active headrest with moving error microphones. Appl. Acoust. 2017, 123, 9–19. [Google Scholar] [CrossRef]
- Naumann, R.B.; Dellinger, A.M.; Zaloshnja, E.; Lawrence, B.A.; Miller, T.R. Incidence and Total Lifetime Costs of Motor Vehicle–Related Fatal and Nonfatal Injury by Road User Type, United States, 2005. Traffic Inj. Prev. 2010, 11, 353–360. [Google Scholar] [CrossRef] [PubMed]
- Norris, S.; Watt, I. The prognosis of neck injuries resulting from rear-end vehicle collisions. J. Bone Jt. Surgery. Br. Vol. 1983, 65, 608–611. [Google Scholar] [CrossRef]
- Severy, D.M.; Brink, H.M.; Baird, J.D. Backrest and Head Restraint Design for Rear-End Collision Protection; SAE 680079; Institute of Transportation and Traffic Engineering: Los Angeles, CA, USA, 1968; p. 117. [Google Scholar]
- Boström, O.; Fredriksson, R.; Håland, Y.; Jakobsson, L.; Krafft, M.; Lövsund, P.; Muser, M.H.; Svensson, M.Y. Comparison of car seats in low speed rear-end impacts using the BioRID dummy and the new neck injury criterion (NIC). Accid. Anal. Prev. 2000, 32, 321–328. [Google Scholar] [CrossRef]
- Bourdet, N.; Willinger, R. Coupled head–neck–torso and seat model for car seat optimization under rear-end impact. J. Sound Vib. 2008, 313, 891–907. [Google Scholar] [CrossRef]
- Hitosugi, M.; Koseki, T.; Hariya, T.; Maeda, G.; Moriguchi, S.; Hiraizumi, S. Shorter pregnant women restrained in the rear seat of a car are at risk for serious neck injuries: Biomechanical analysis using a pregnant crash test dummy. Forensic Sci. Int. 2018, 291, 133–137. [Google Scholar] [CrossRef] [PubMed]
- Yoshida, H.; Tsutsumi, S. Experimental analysis of a new flexible neck model for low–speed rear–end collisions. Accid. Anal. Prev. 2001, 33, 305–312. [Google Scholar] [CrossRef]
- Ono, K.; Kanno, M. Influences of the physical parameters on the risk to neck injuries in low impact speed rear-end collisions. Accid. Anal. Prev. 1996, 28, 493–499. [Google Scholar] [CrossRef]
- Siegmund, G.P.; Heinrichs, B.E.; Wheeler, J.B. The influence of head restraint and occupant factors on peak head/neck kinematics in low-speed rear-end collisions. Accid. Anal. Prev. 1999, 31, 393–407. [Google Scholar] [CrossRef]
- Croft, A.C.; Philippens, M.M. The RID2 biofidelic rear impact dummy: A pilot study using human subjects in low speed rear impact full scale crash tests. Accid. Anal. Prev. 2007, 39, 340–346. [Google Scholar] [CrossRef] [PubMed]
© 2020 by the authors. Licensee MDPI, Basel, Switzerland. This article is an open access article distributed under the terms and conditions of the Creative Commons Attribution (CC BY) license (http://creativecommons.org/licenses/by/4.0/).


