Phase Space Reconstruction from a Biological Time Series: A Photoplethysmographic Signal Case Study
Abstract
1. Introduction
2. Materials and Methods
2.1. Biological Data
2.2. Determinism and State Space Representation
2.2.1. Graphical Methods for Assessing the Presence of Determinism
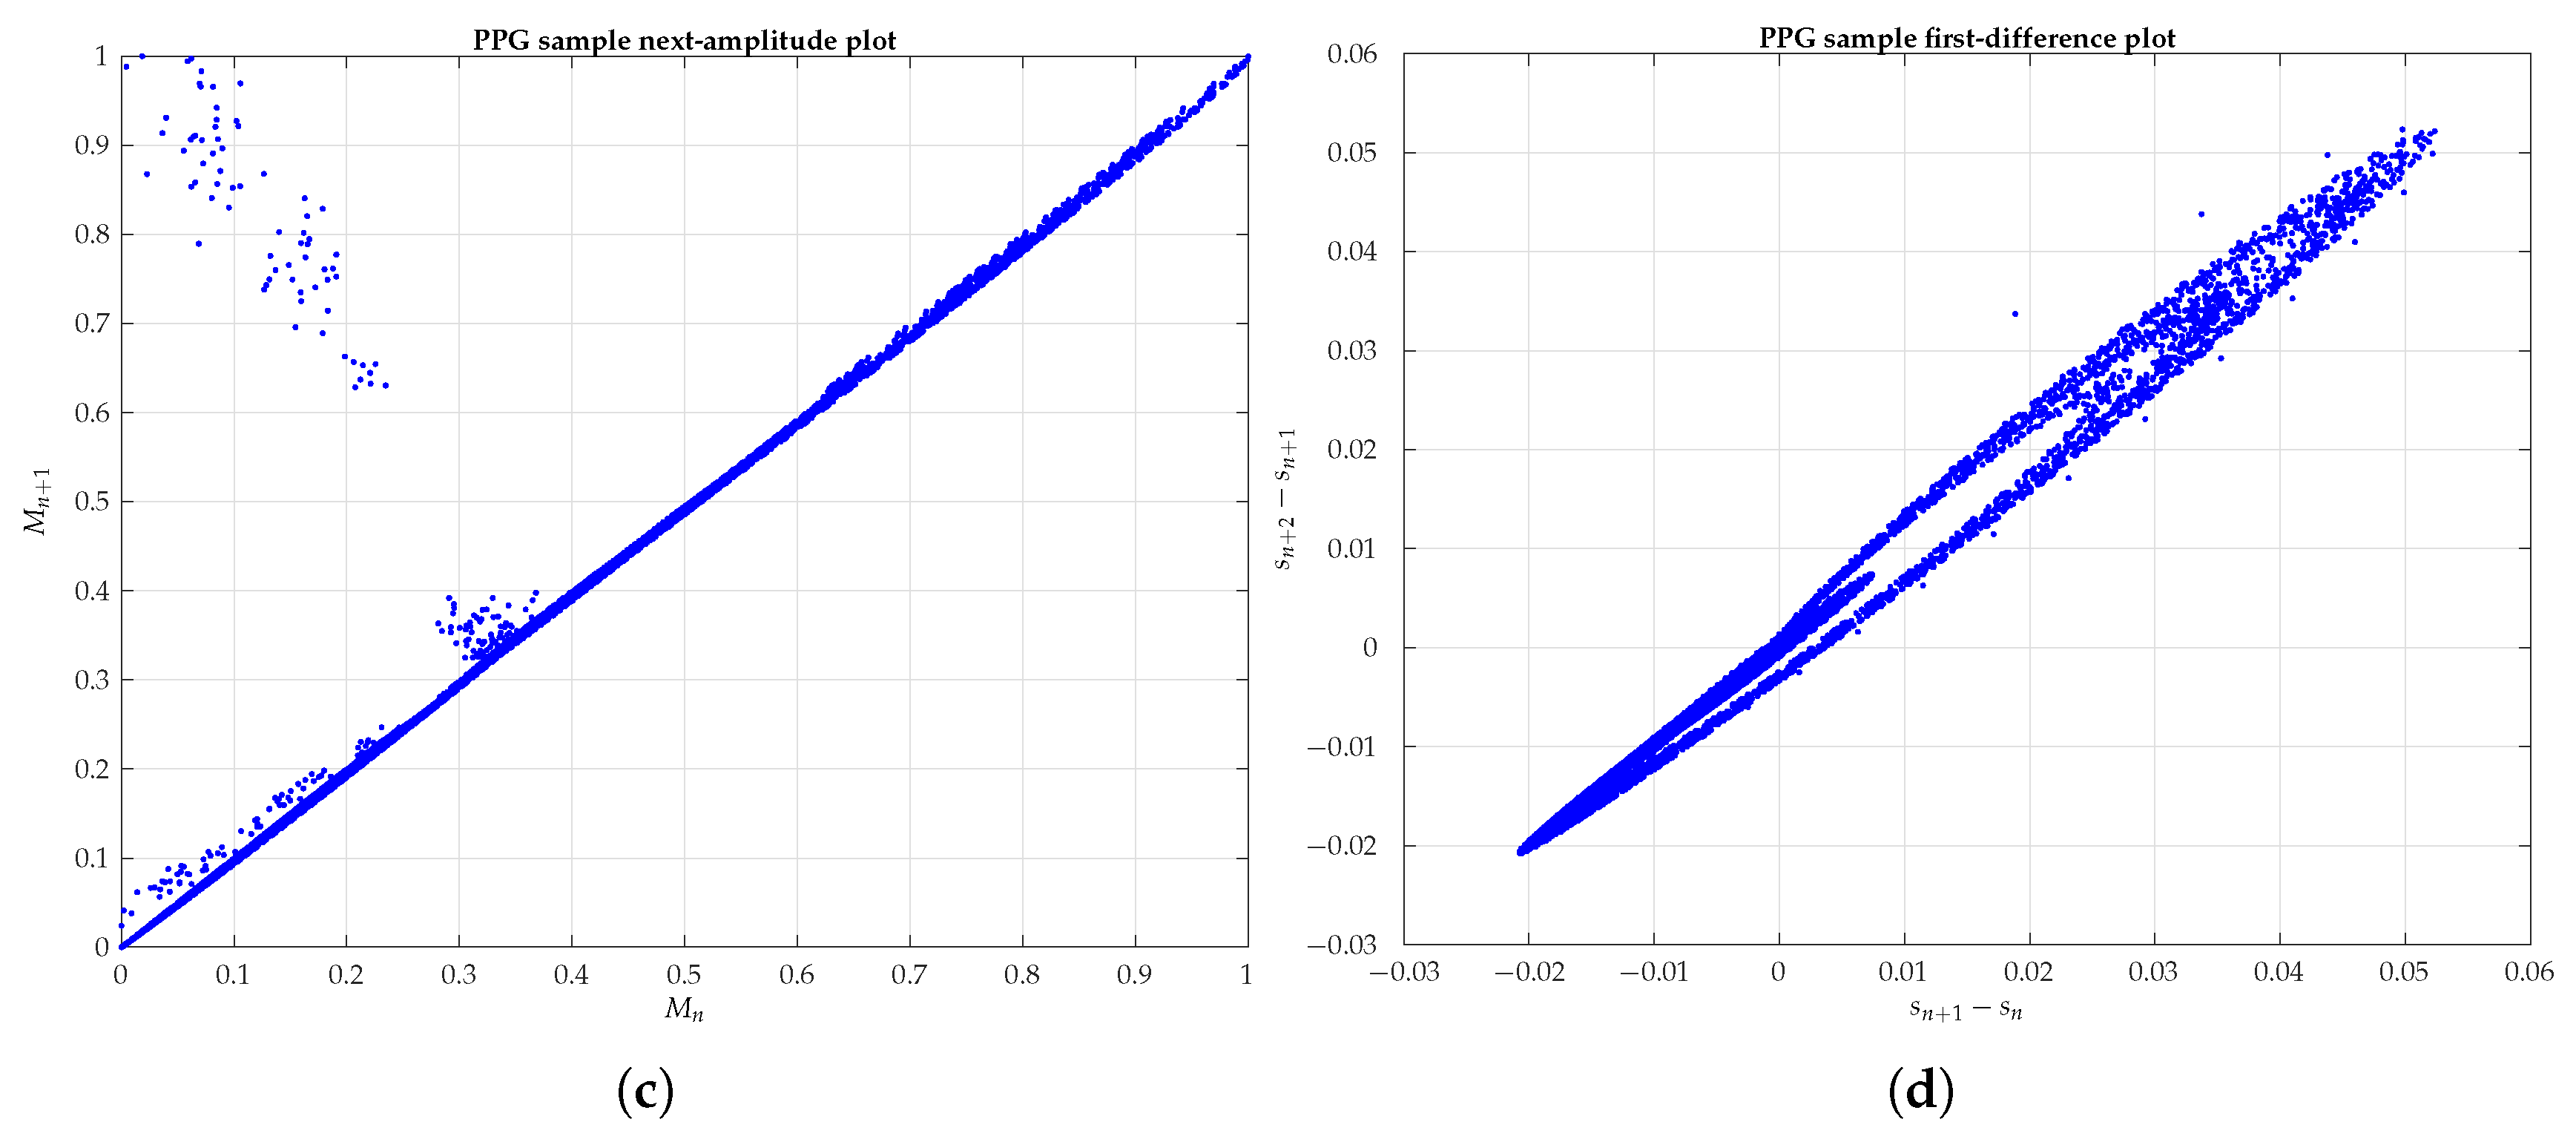
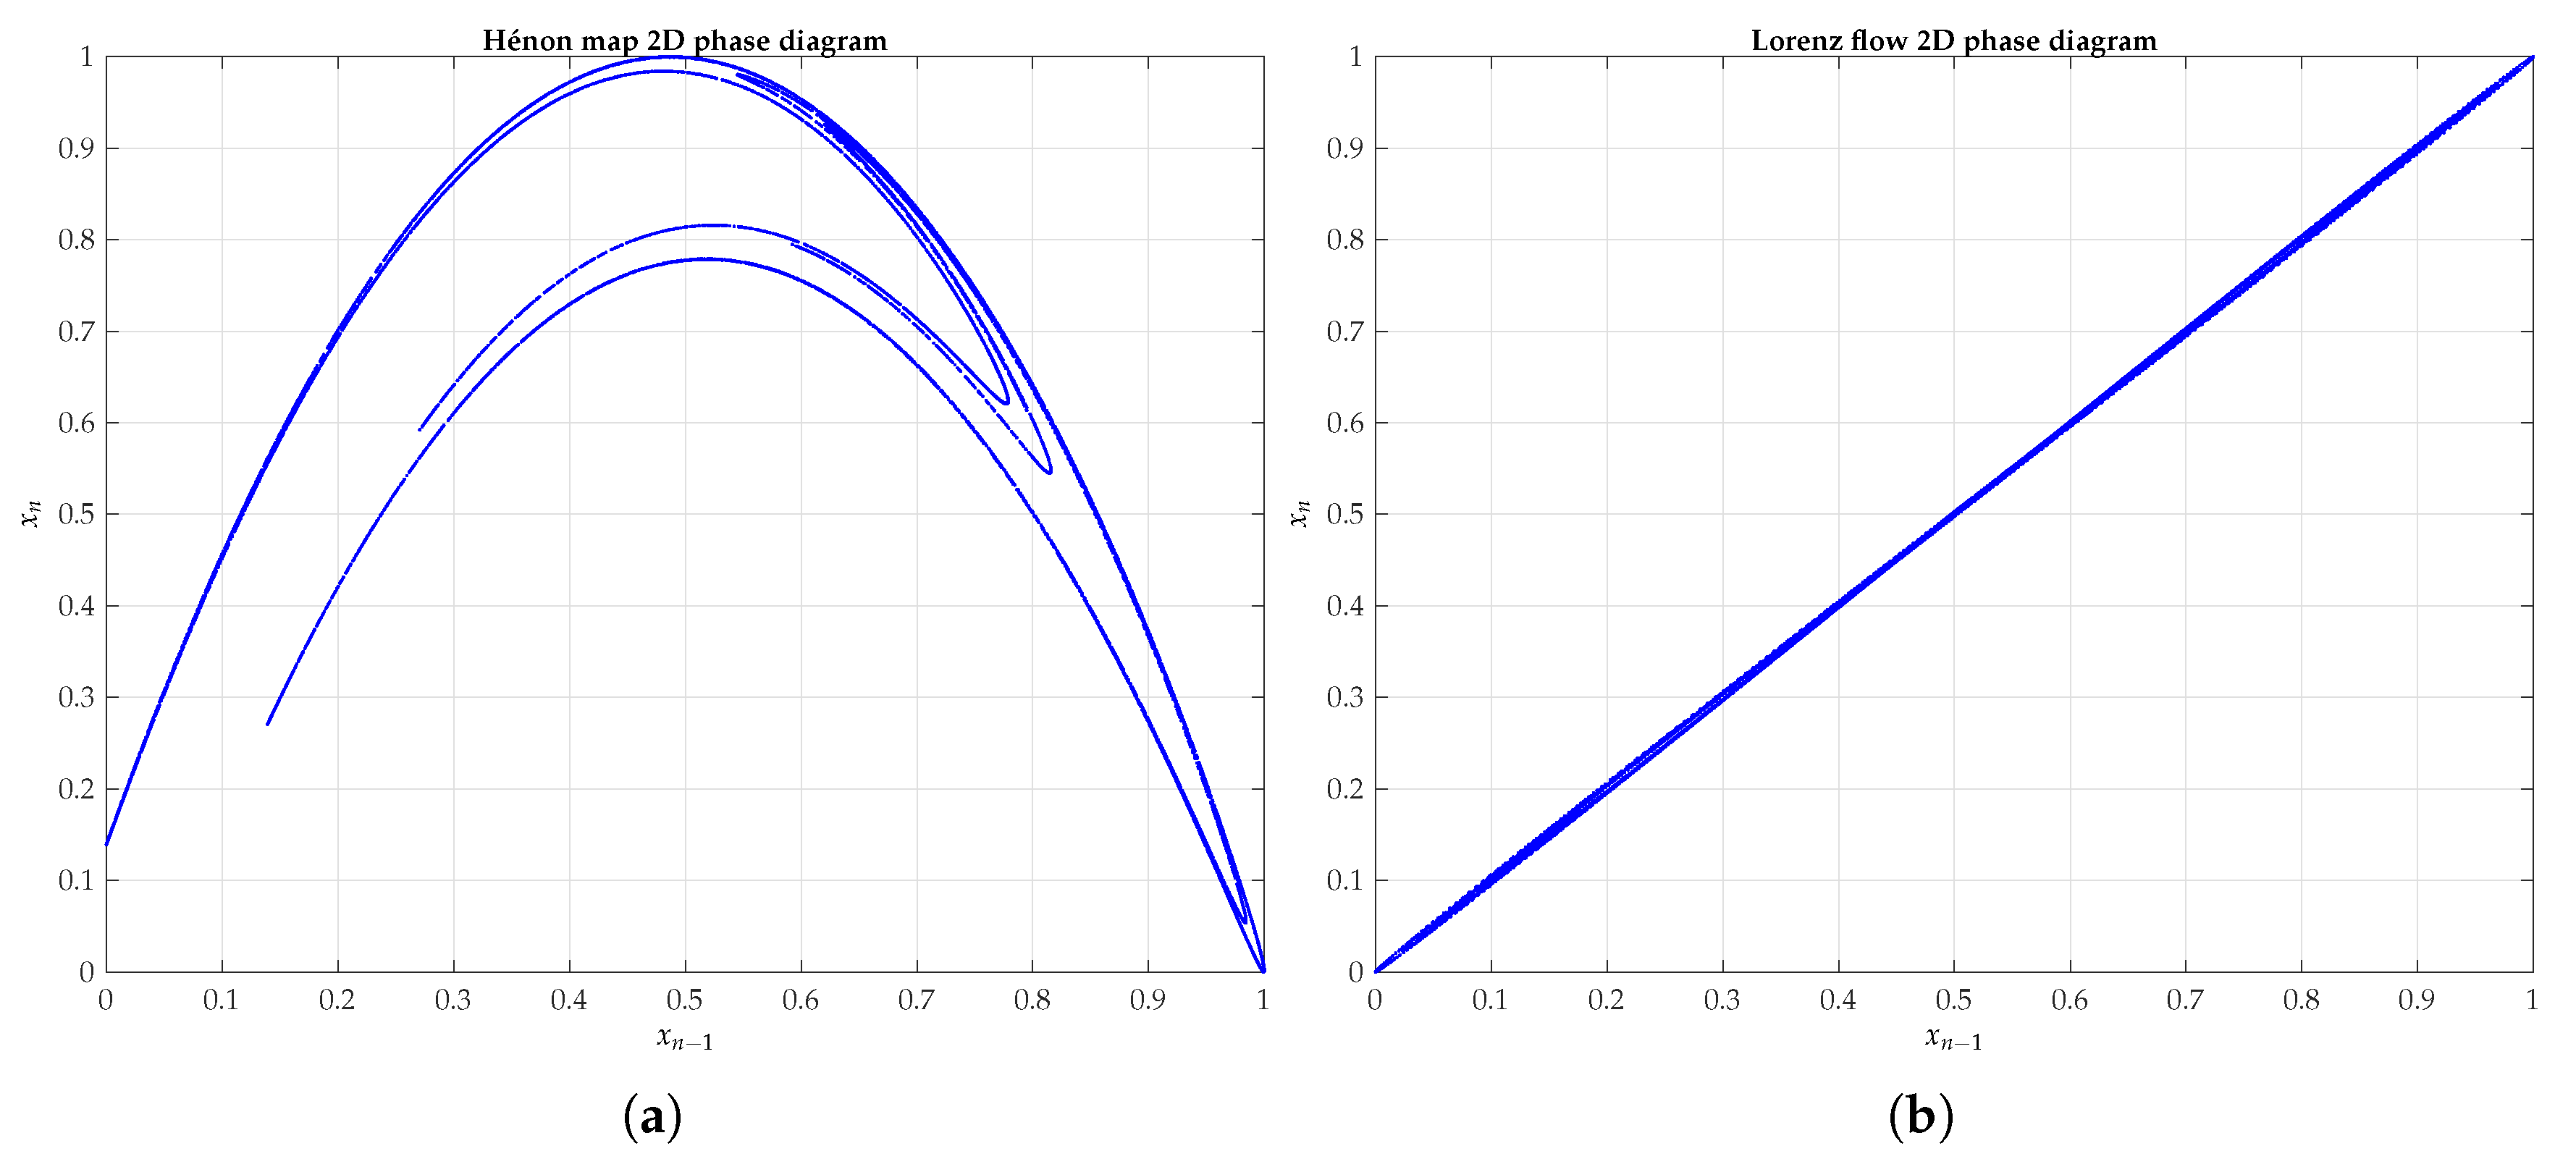
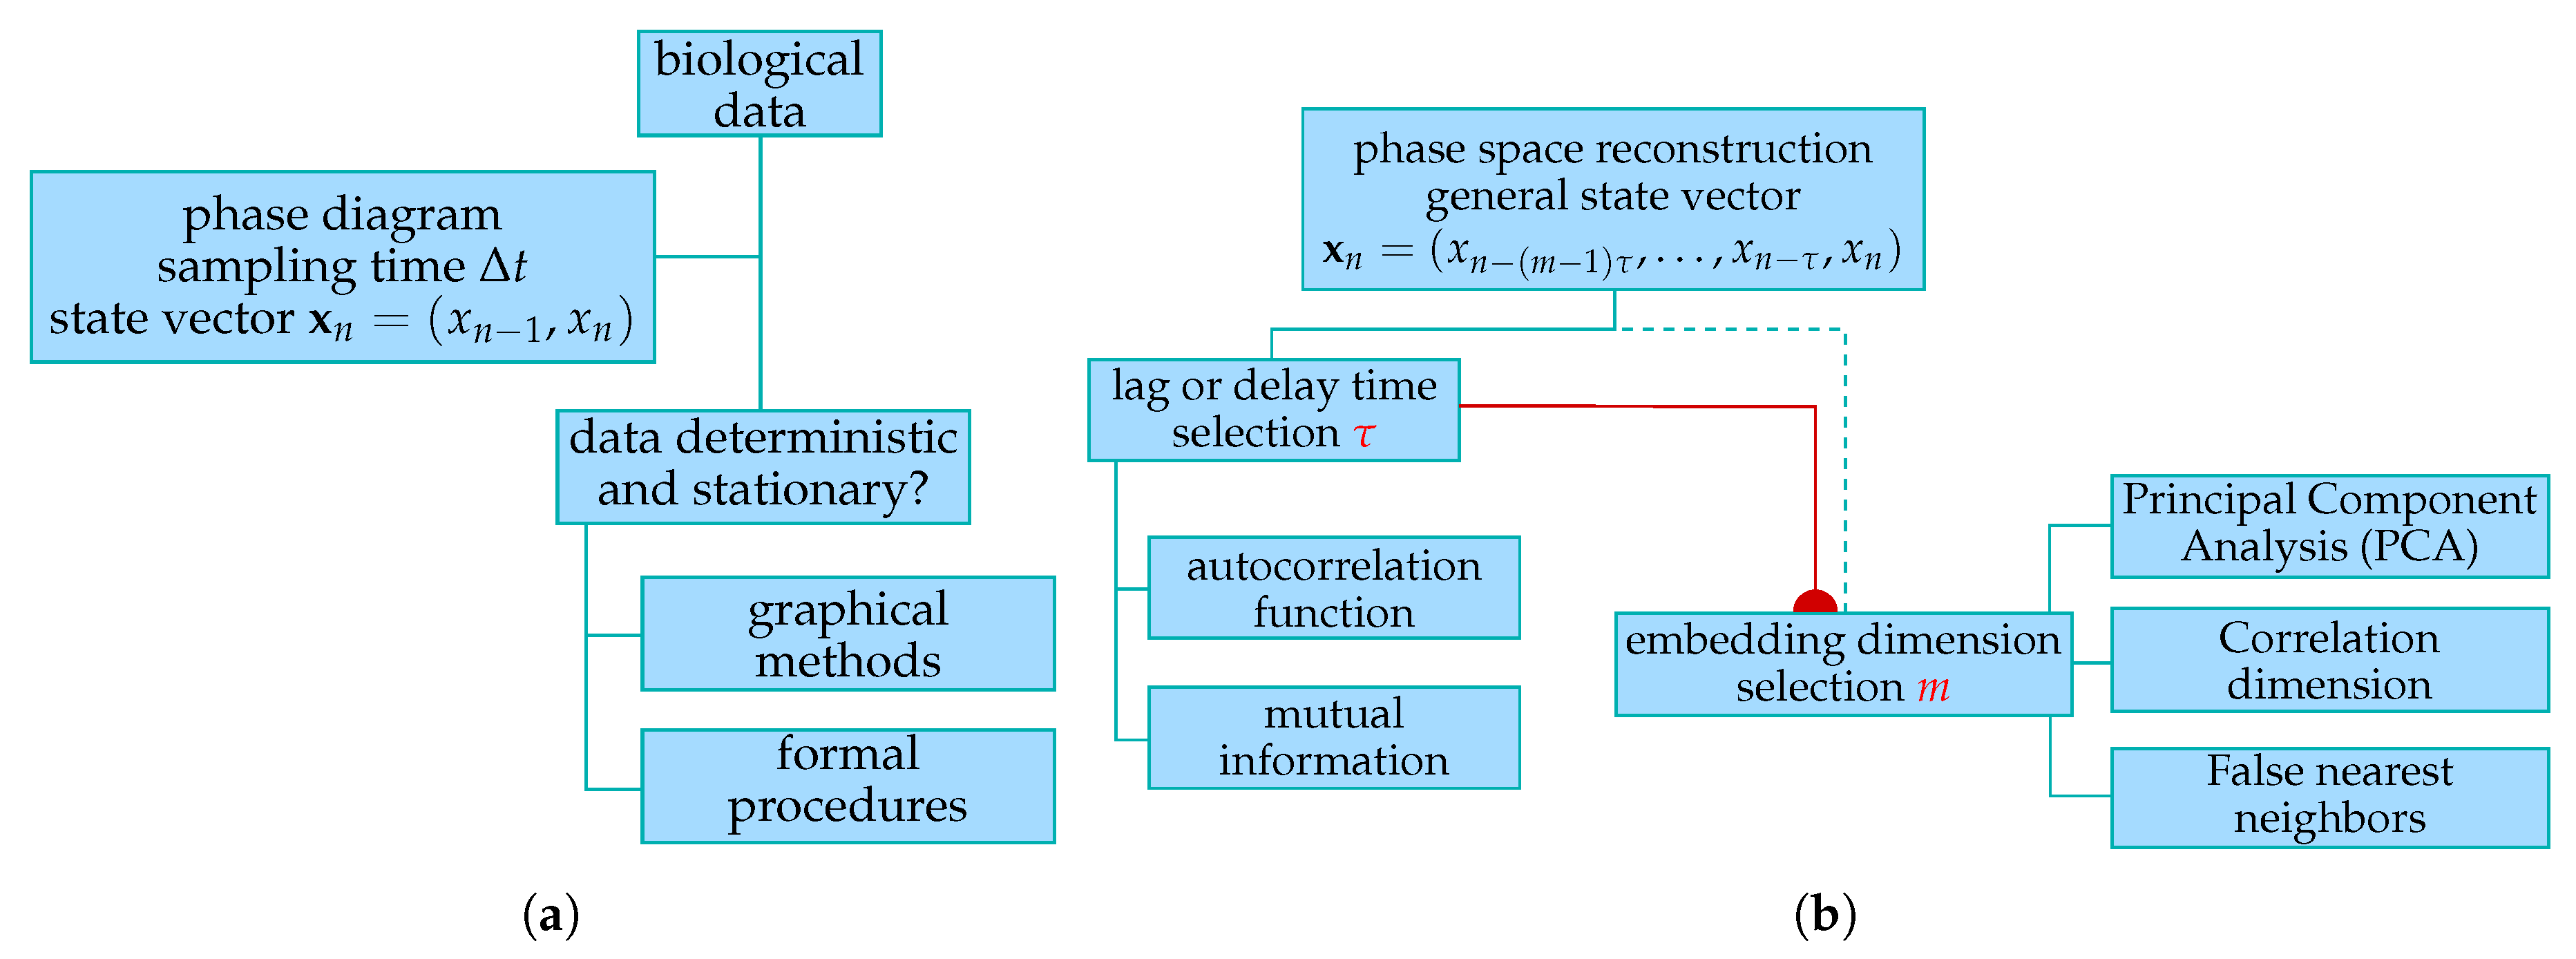
- Next-amplitude plot: From successive maximums detected in time series, each one is represented (abscissa) versus its immediate or subsequent successor times (ordinate) ahead. A well-defined curve, like the one in Figure 4a, could reveal the presence of chaos, although the noise could mask a correct interpretation.
- Difference plot: The graphic’s coordinates are delayed differences between successive observations, whether immediate or separated number of times. On the abscissa axis, it is represented as , and on the ordinate axis, the next difference . In the simplest form, the first difference plot, with a delay , on the abscissa is represented as and on the ordinate . The presence of an infinitely continuous curve, as illustrated in Figure 4b, evidences a high degree of underlying determinism.
2.2.2. Formal Procedures for Assessing the Presence of Determinism and Stationarity
2.3. Phase Space Reconstruction Method
2.3.1. Lag or Delay Time Selection
Autocorrelation Coefficients
Mutual Information
2.3.2. Embedding Dimension Selection
Principal Component Analysis
Correlation Dimension
False Nearest Neighbors
3. Results
4. Discussion
Supplementary Materials
Author Contributions
Funding
Acknowledgments
Conflicts of Interest
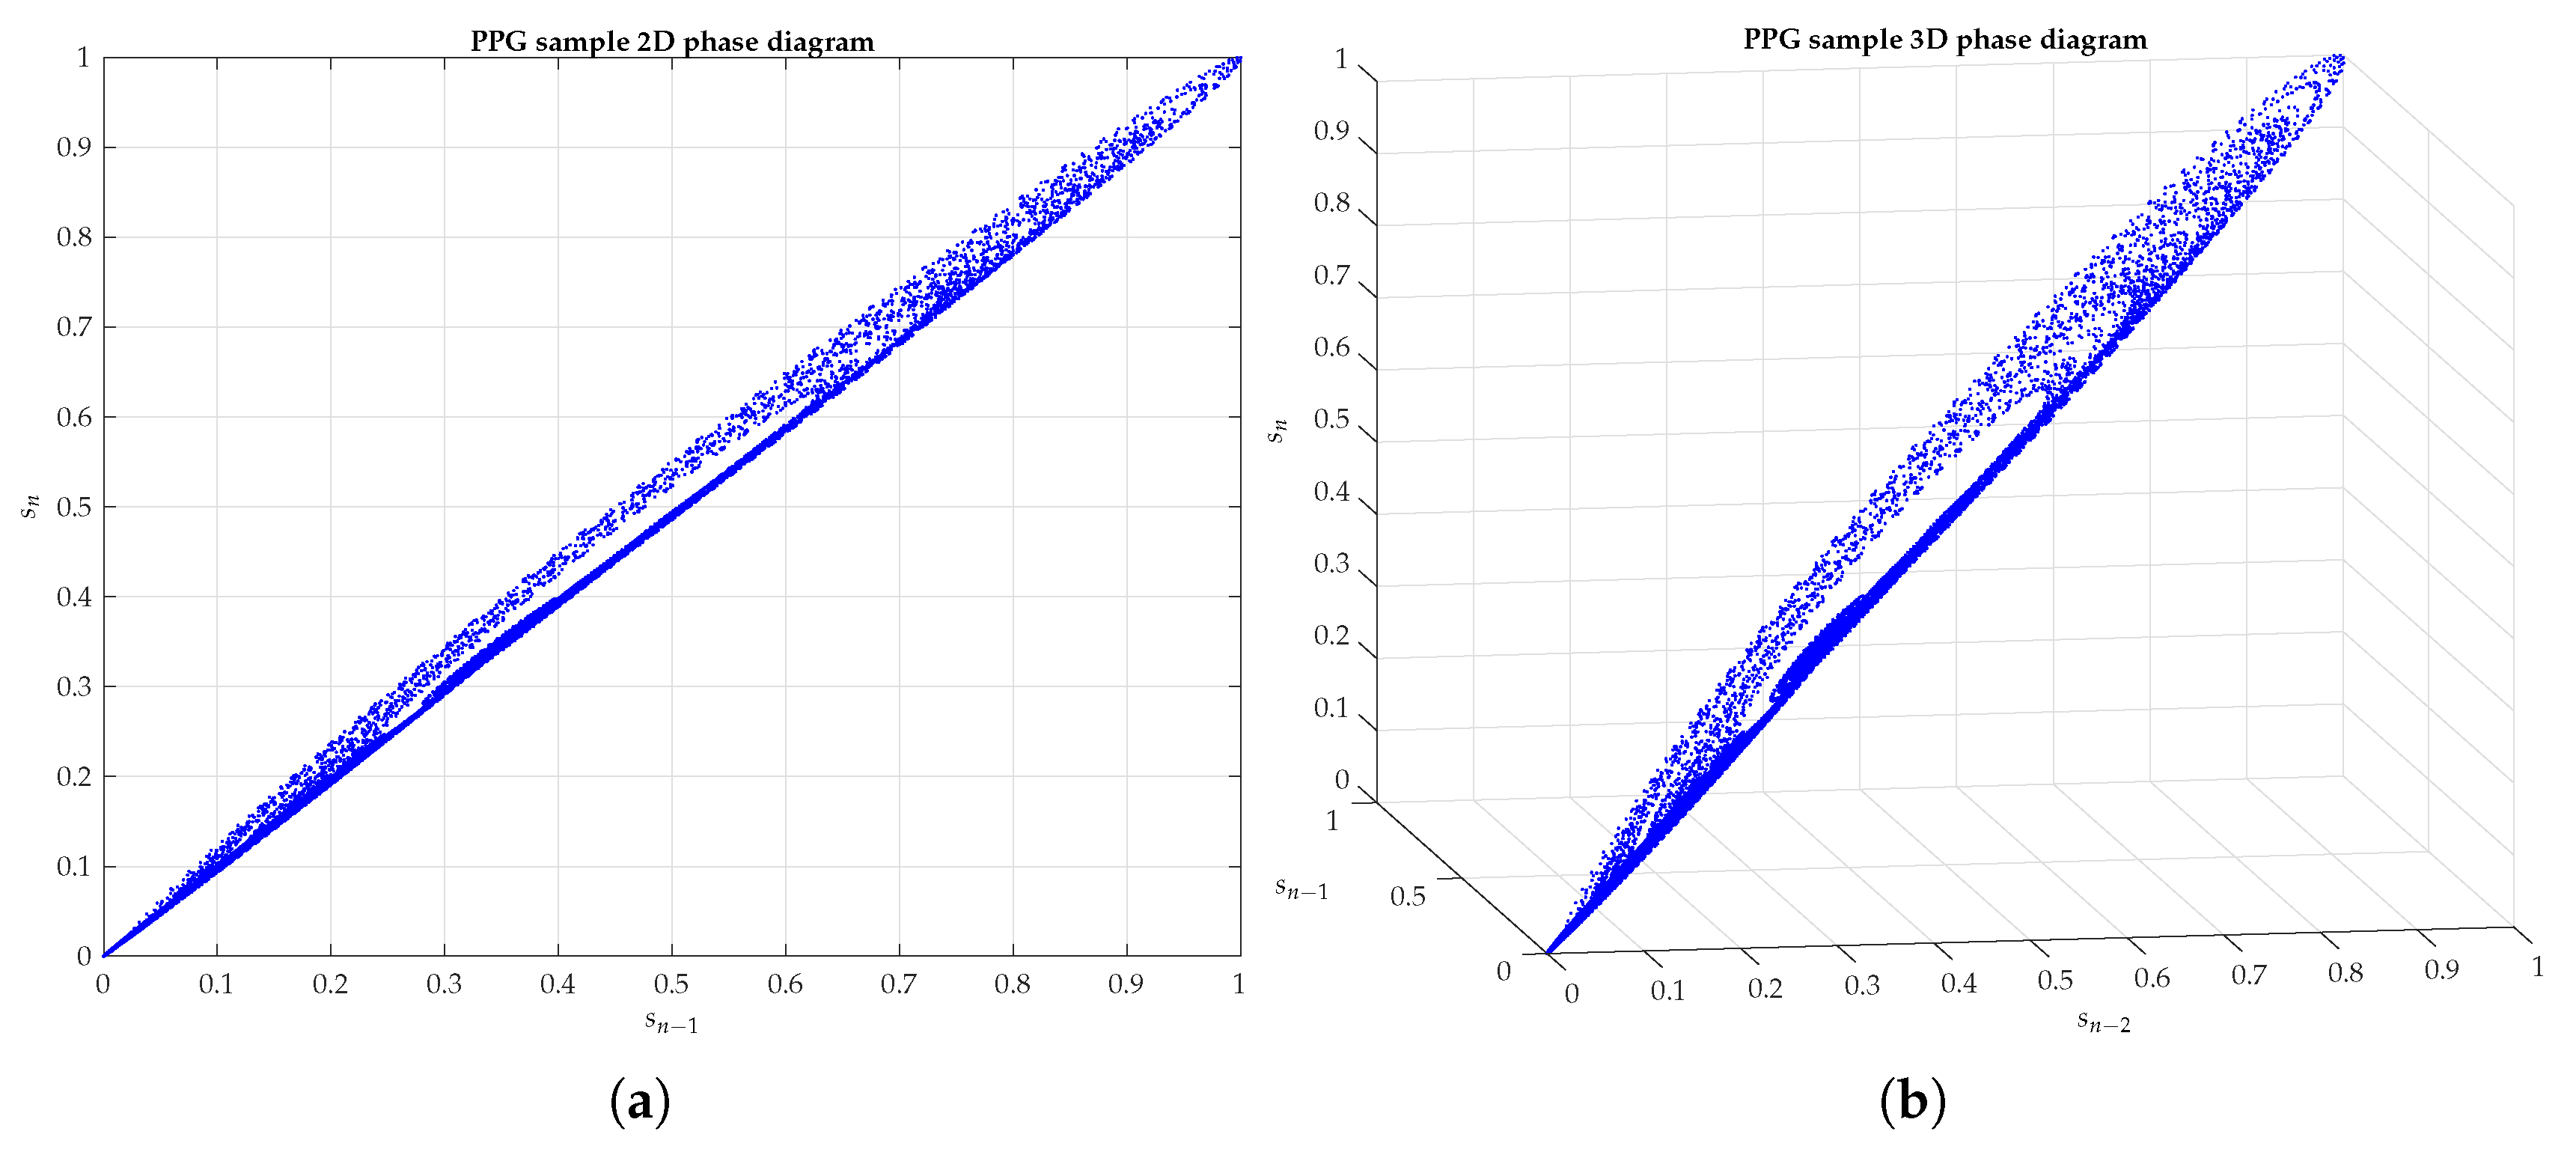
Appendix A. Different Methods of Graphical Representation of a Sample PPG Signal


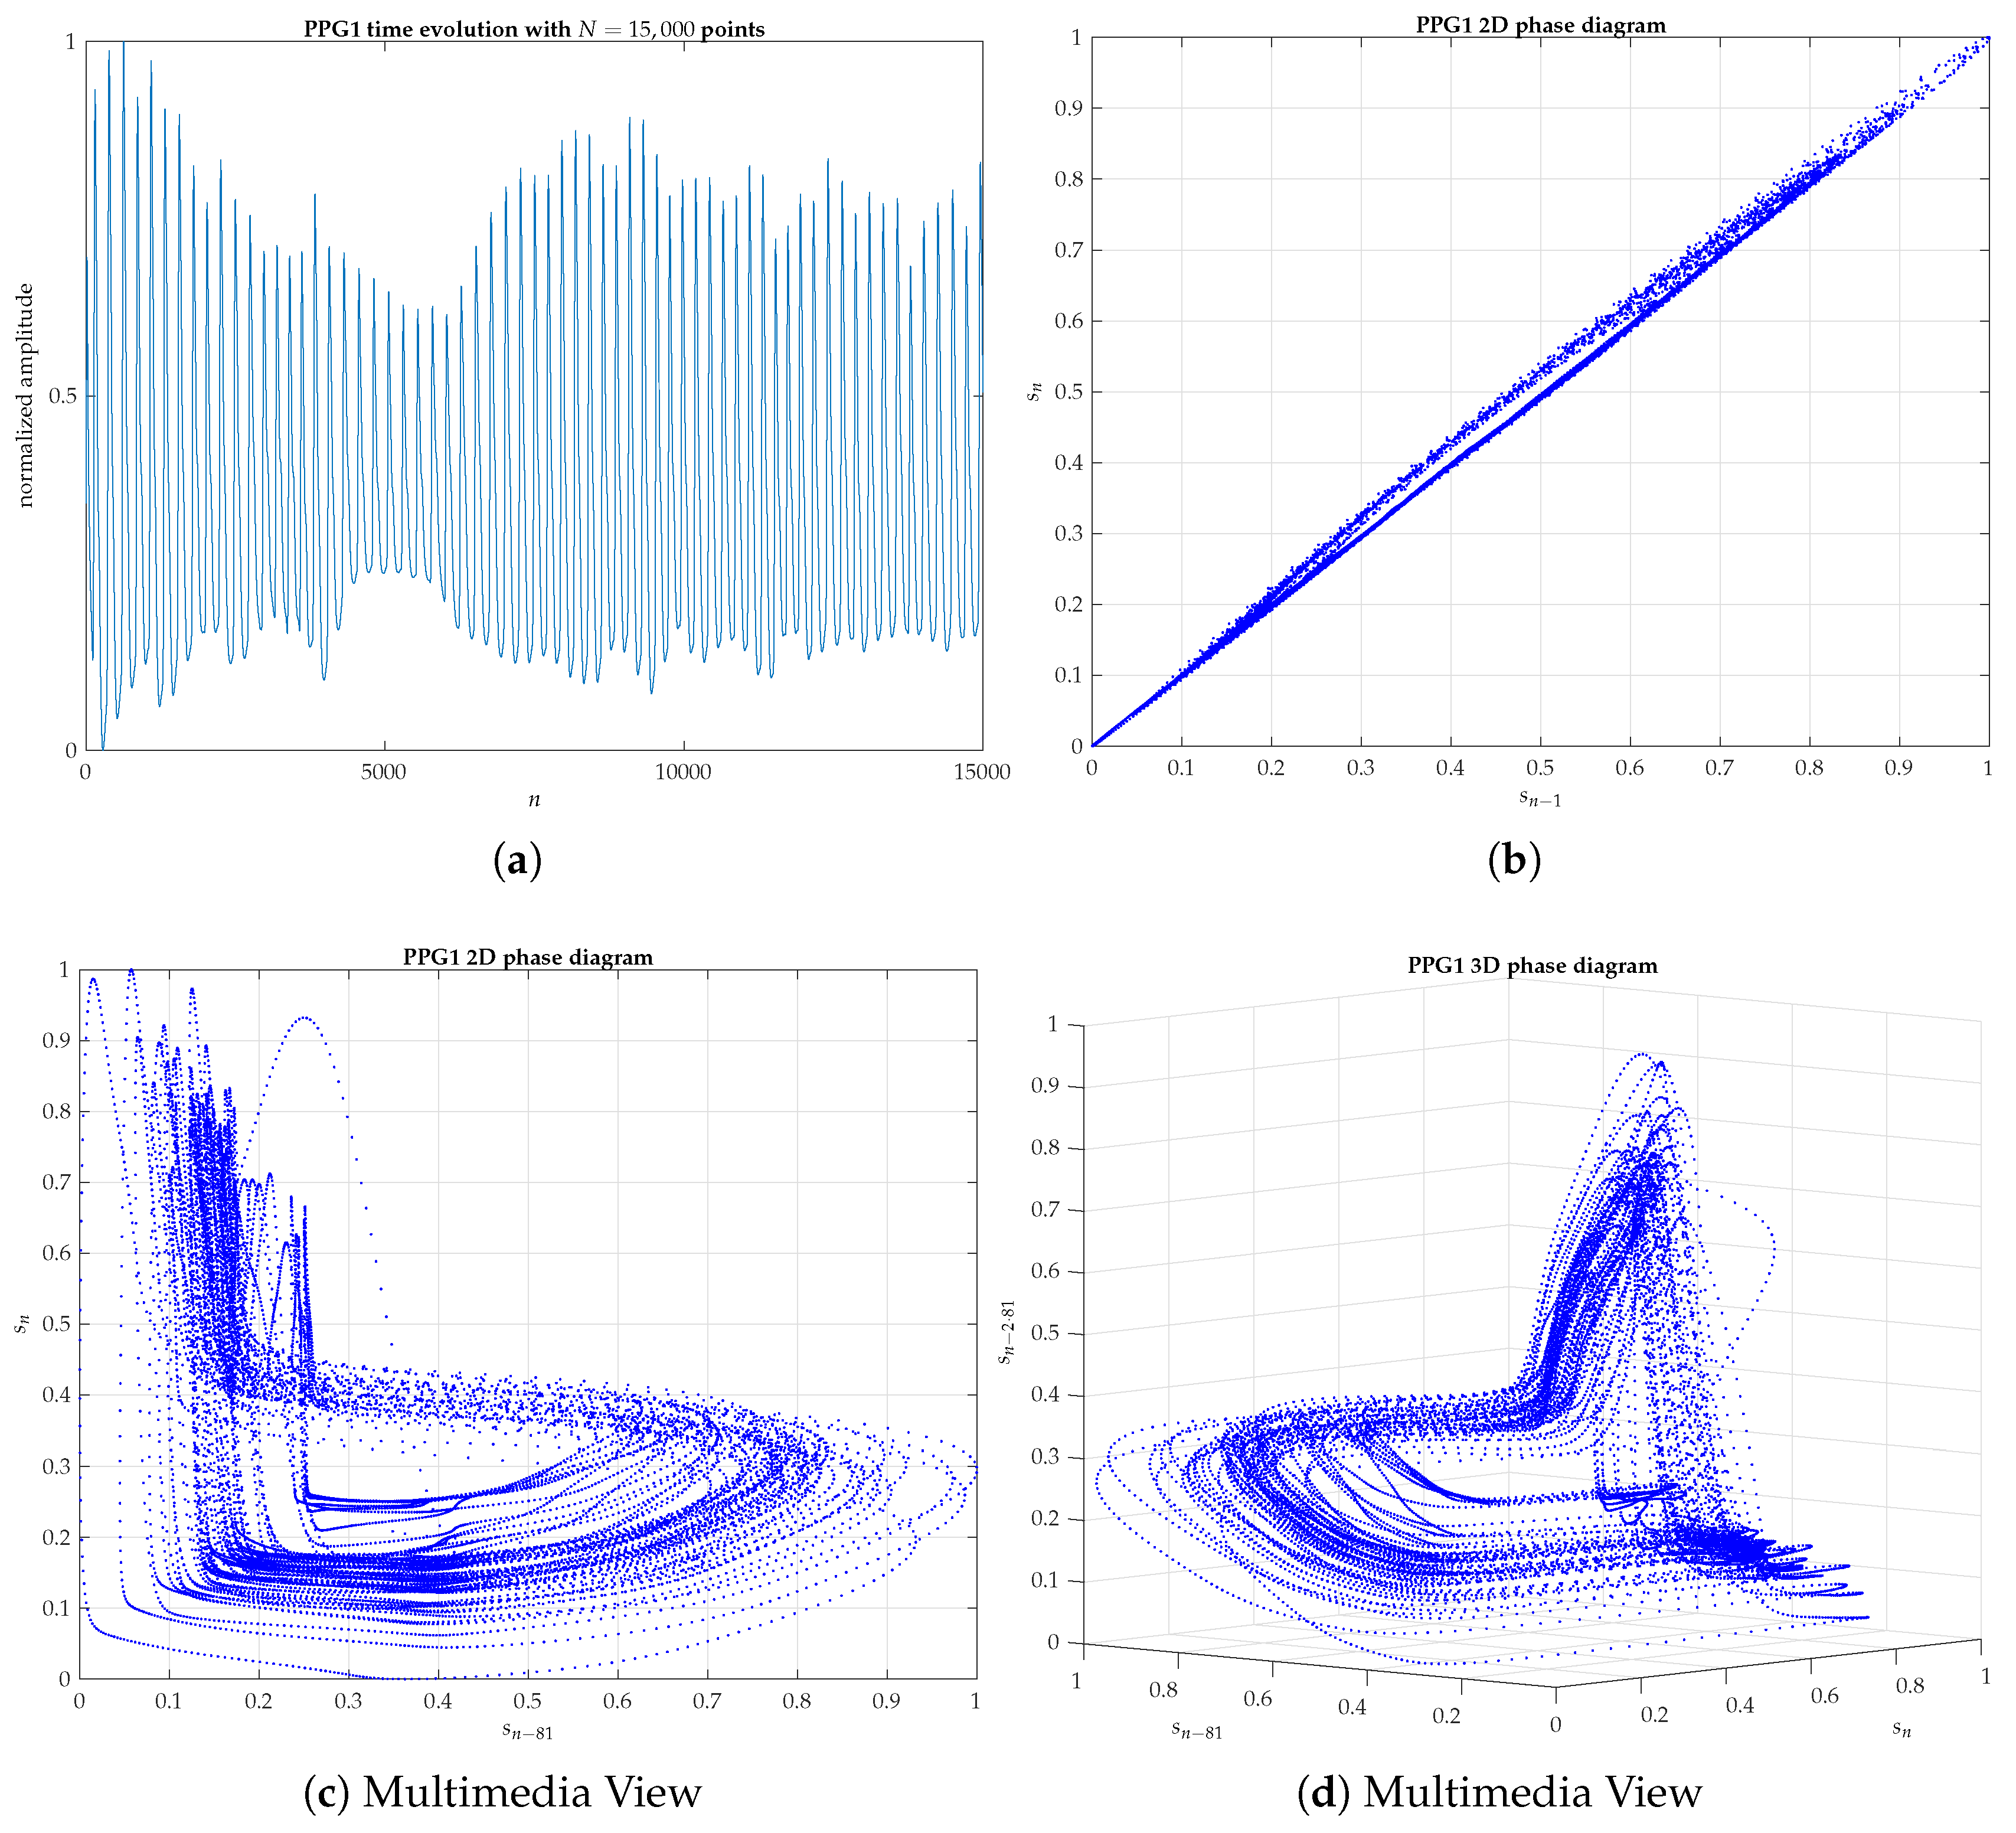
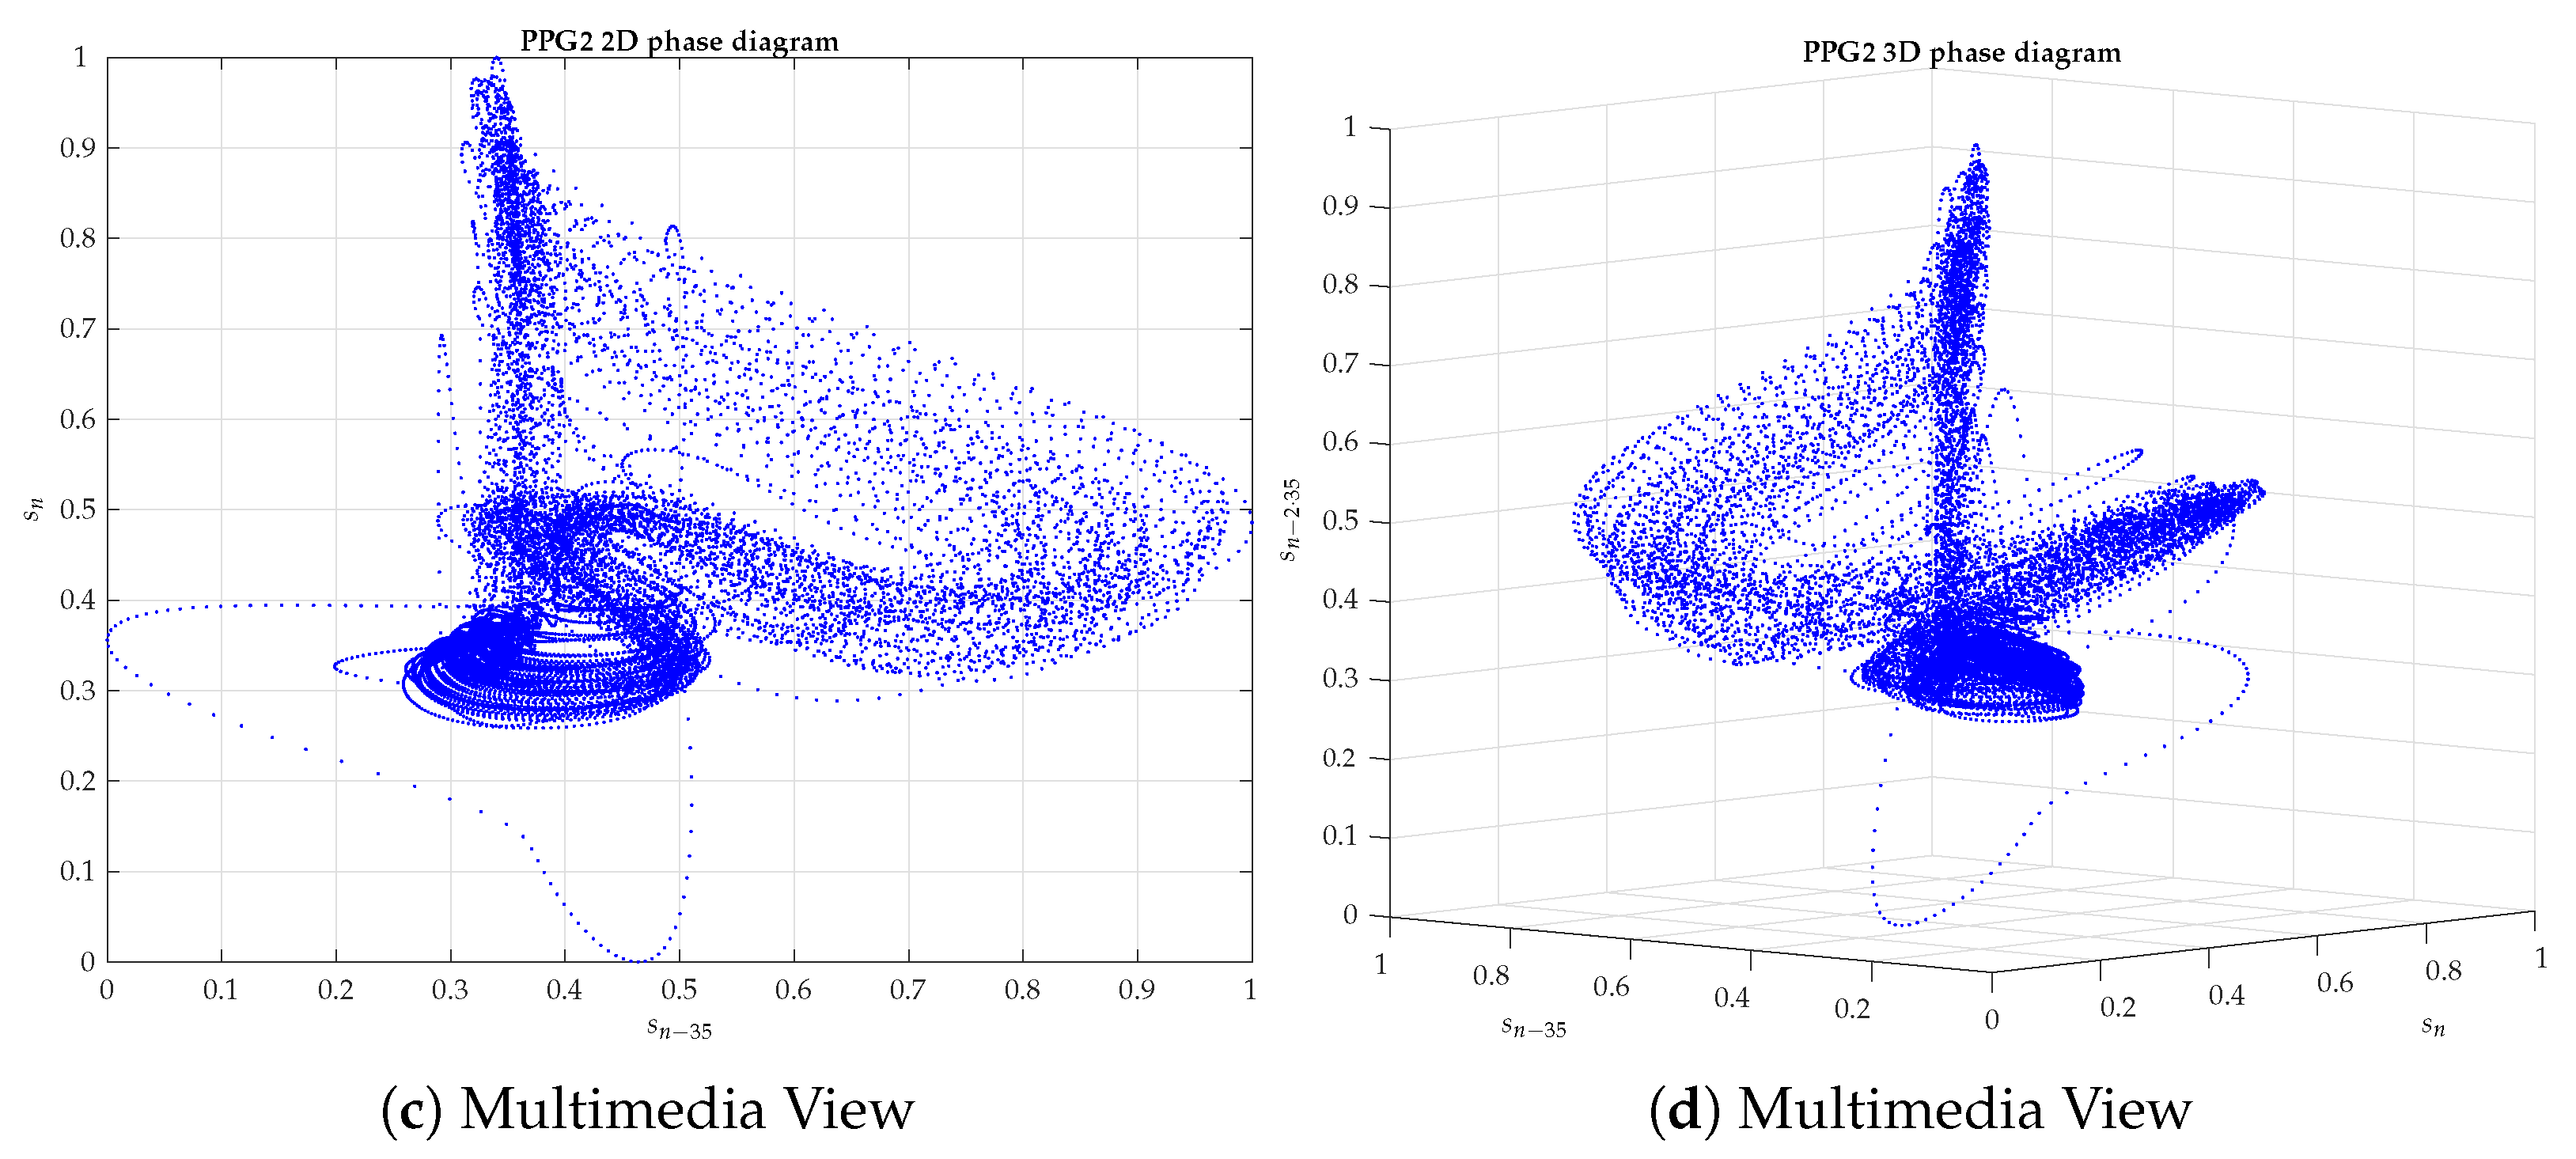
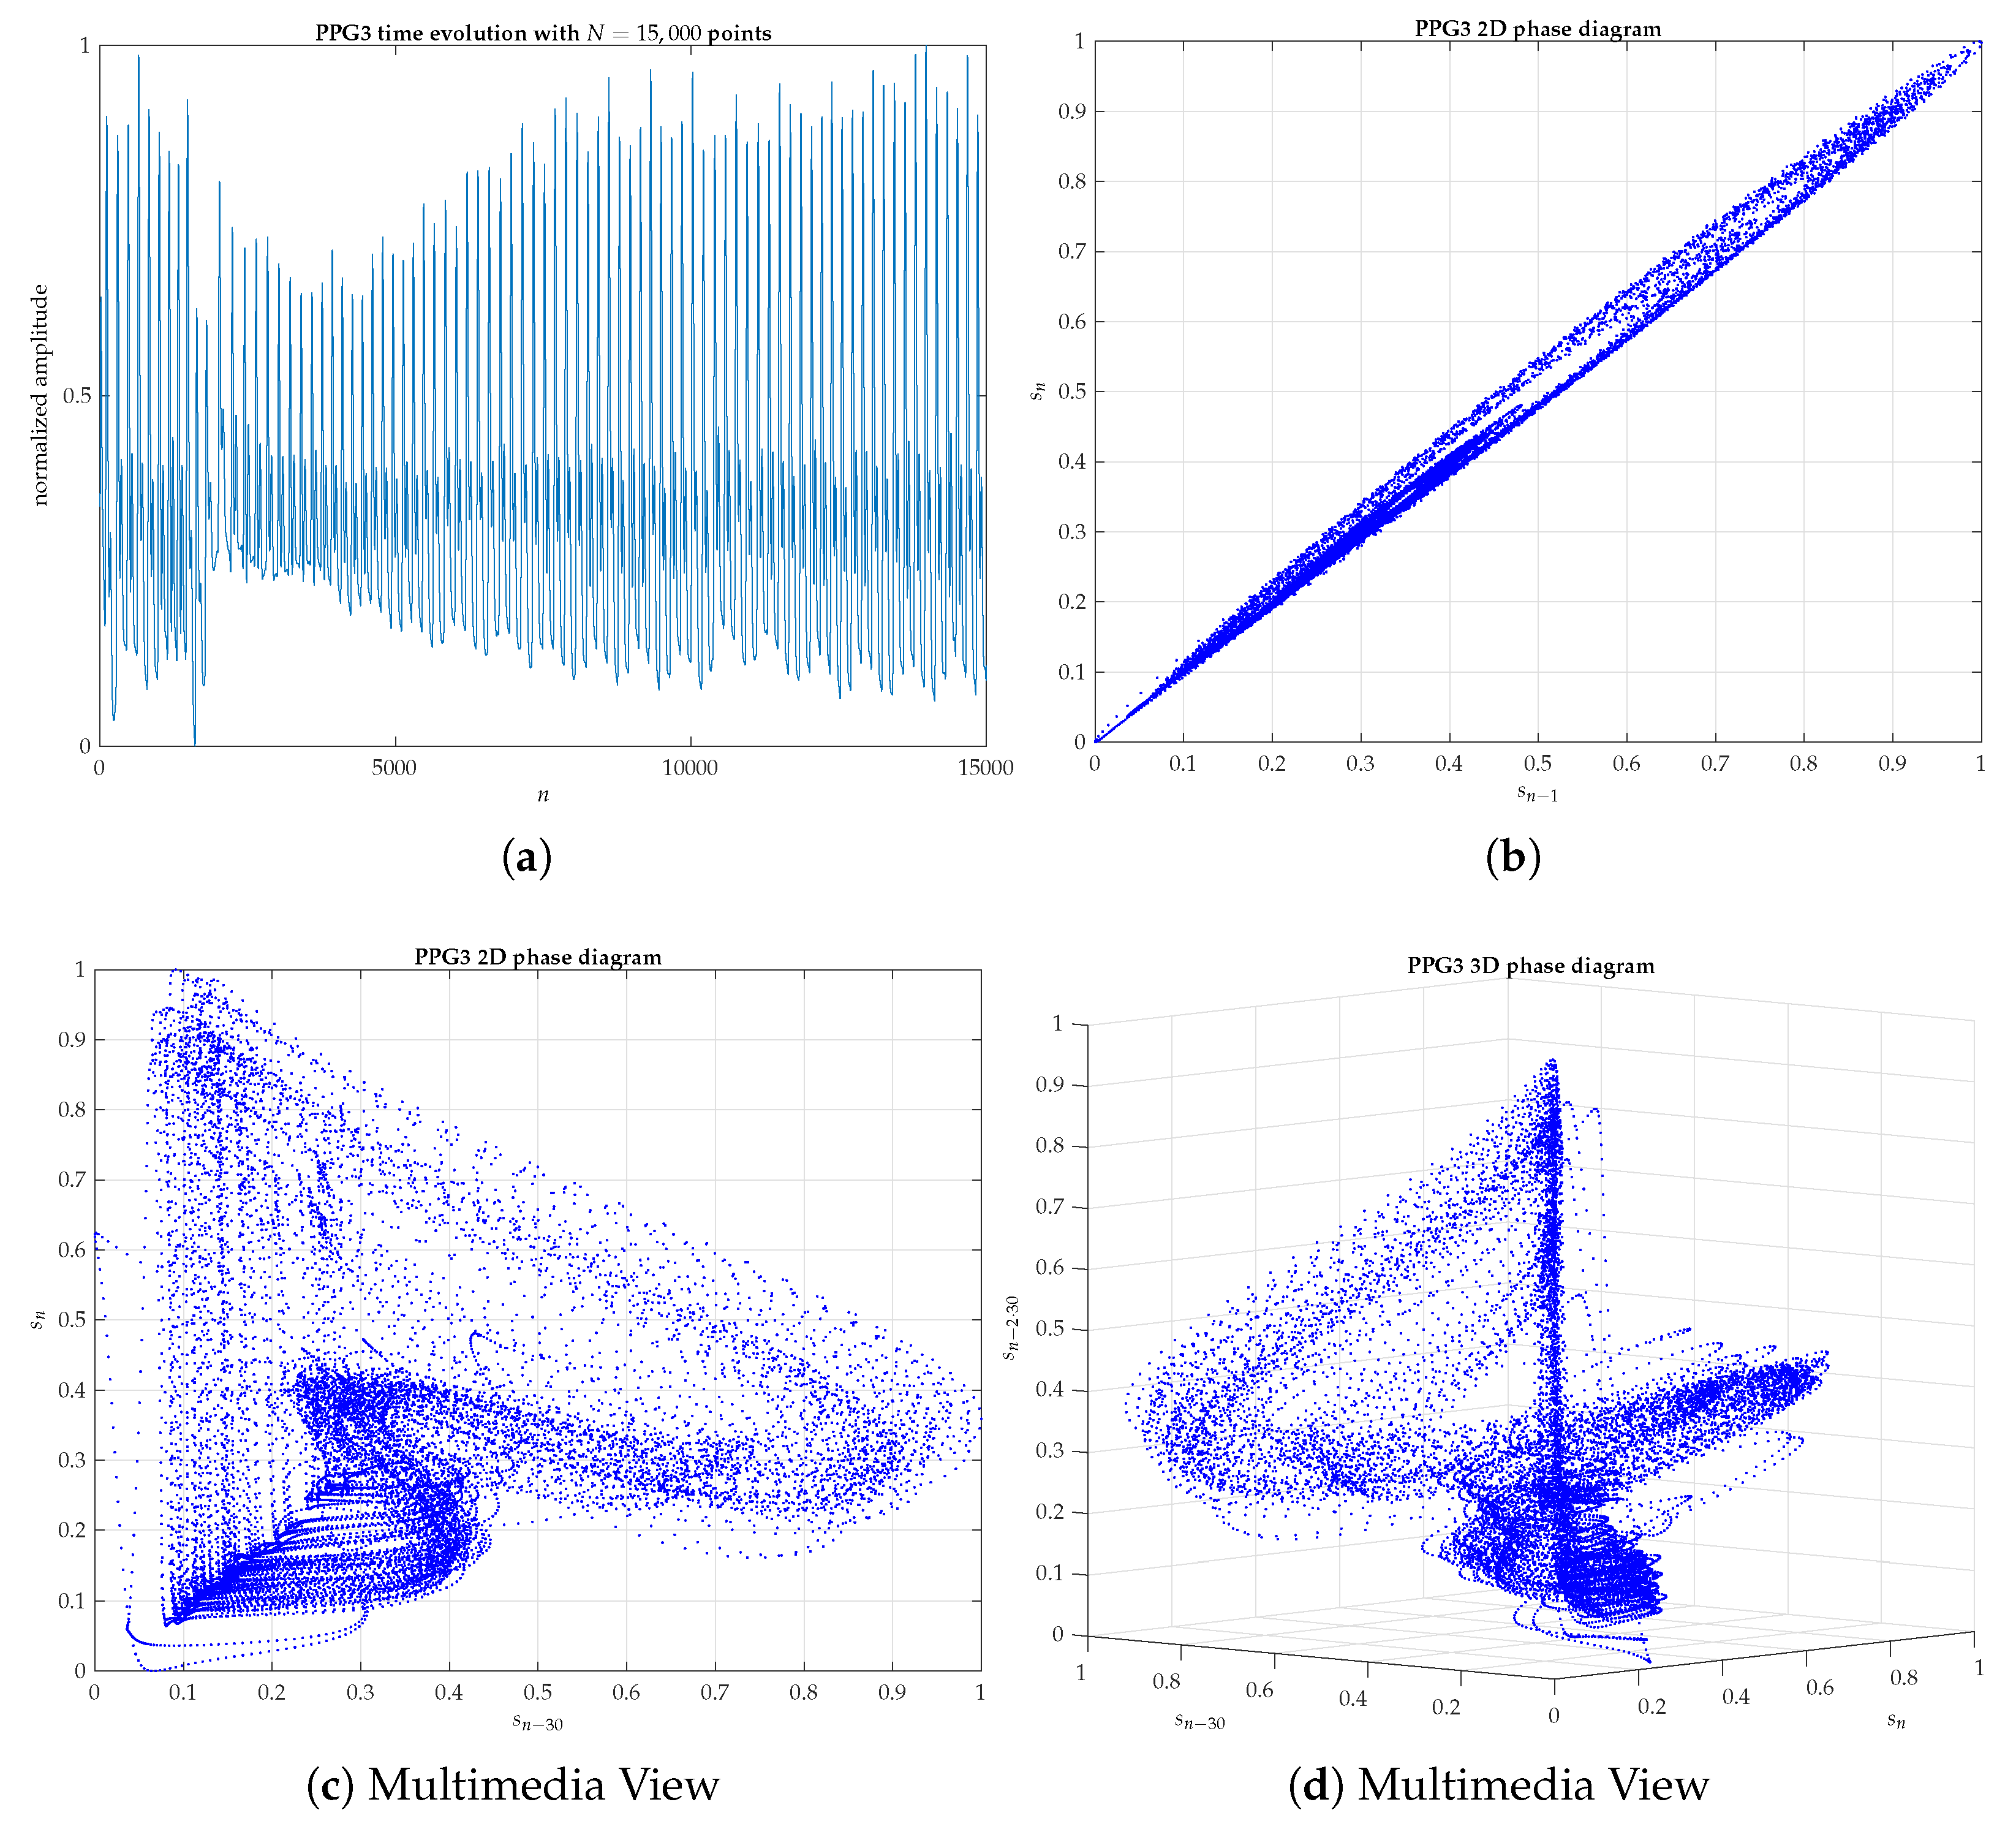
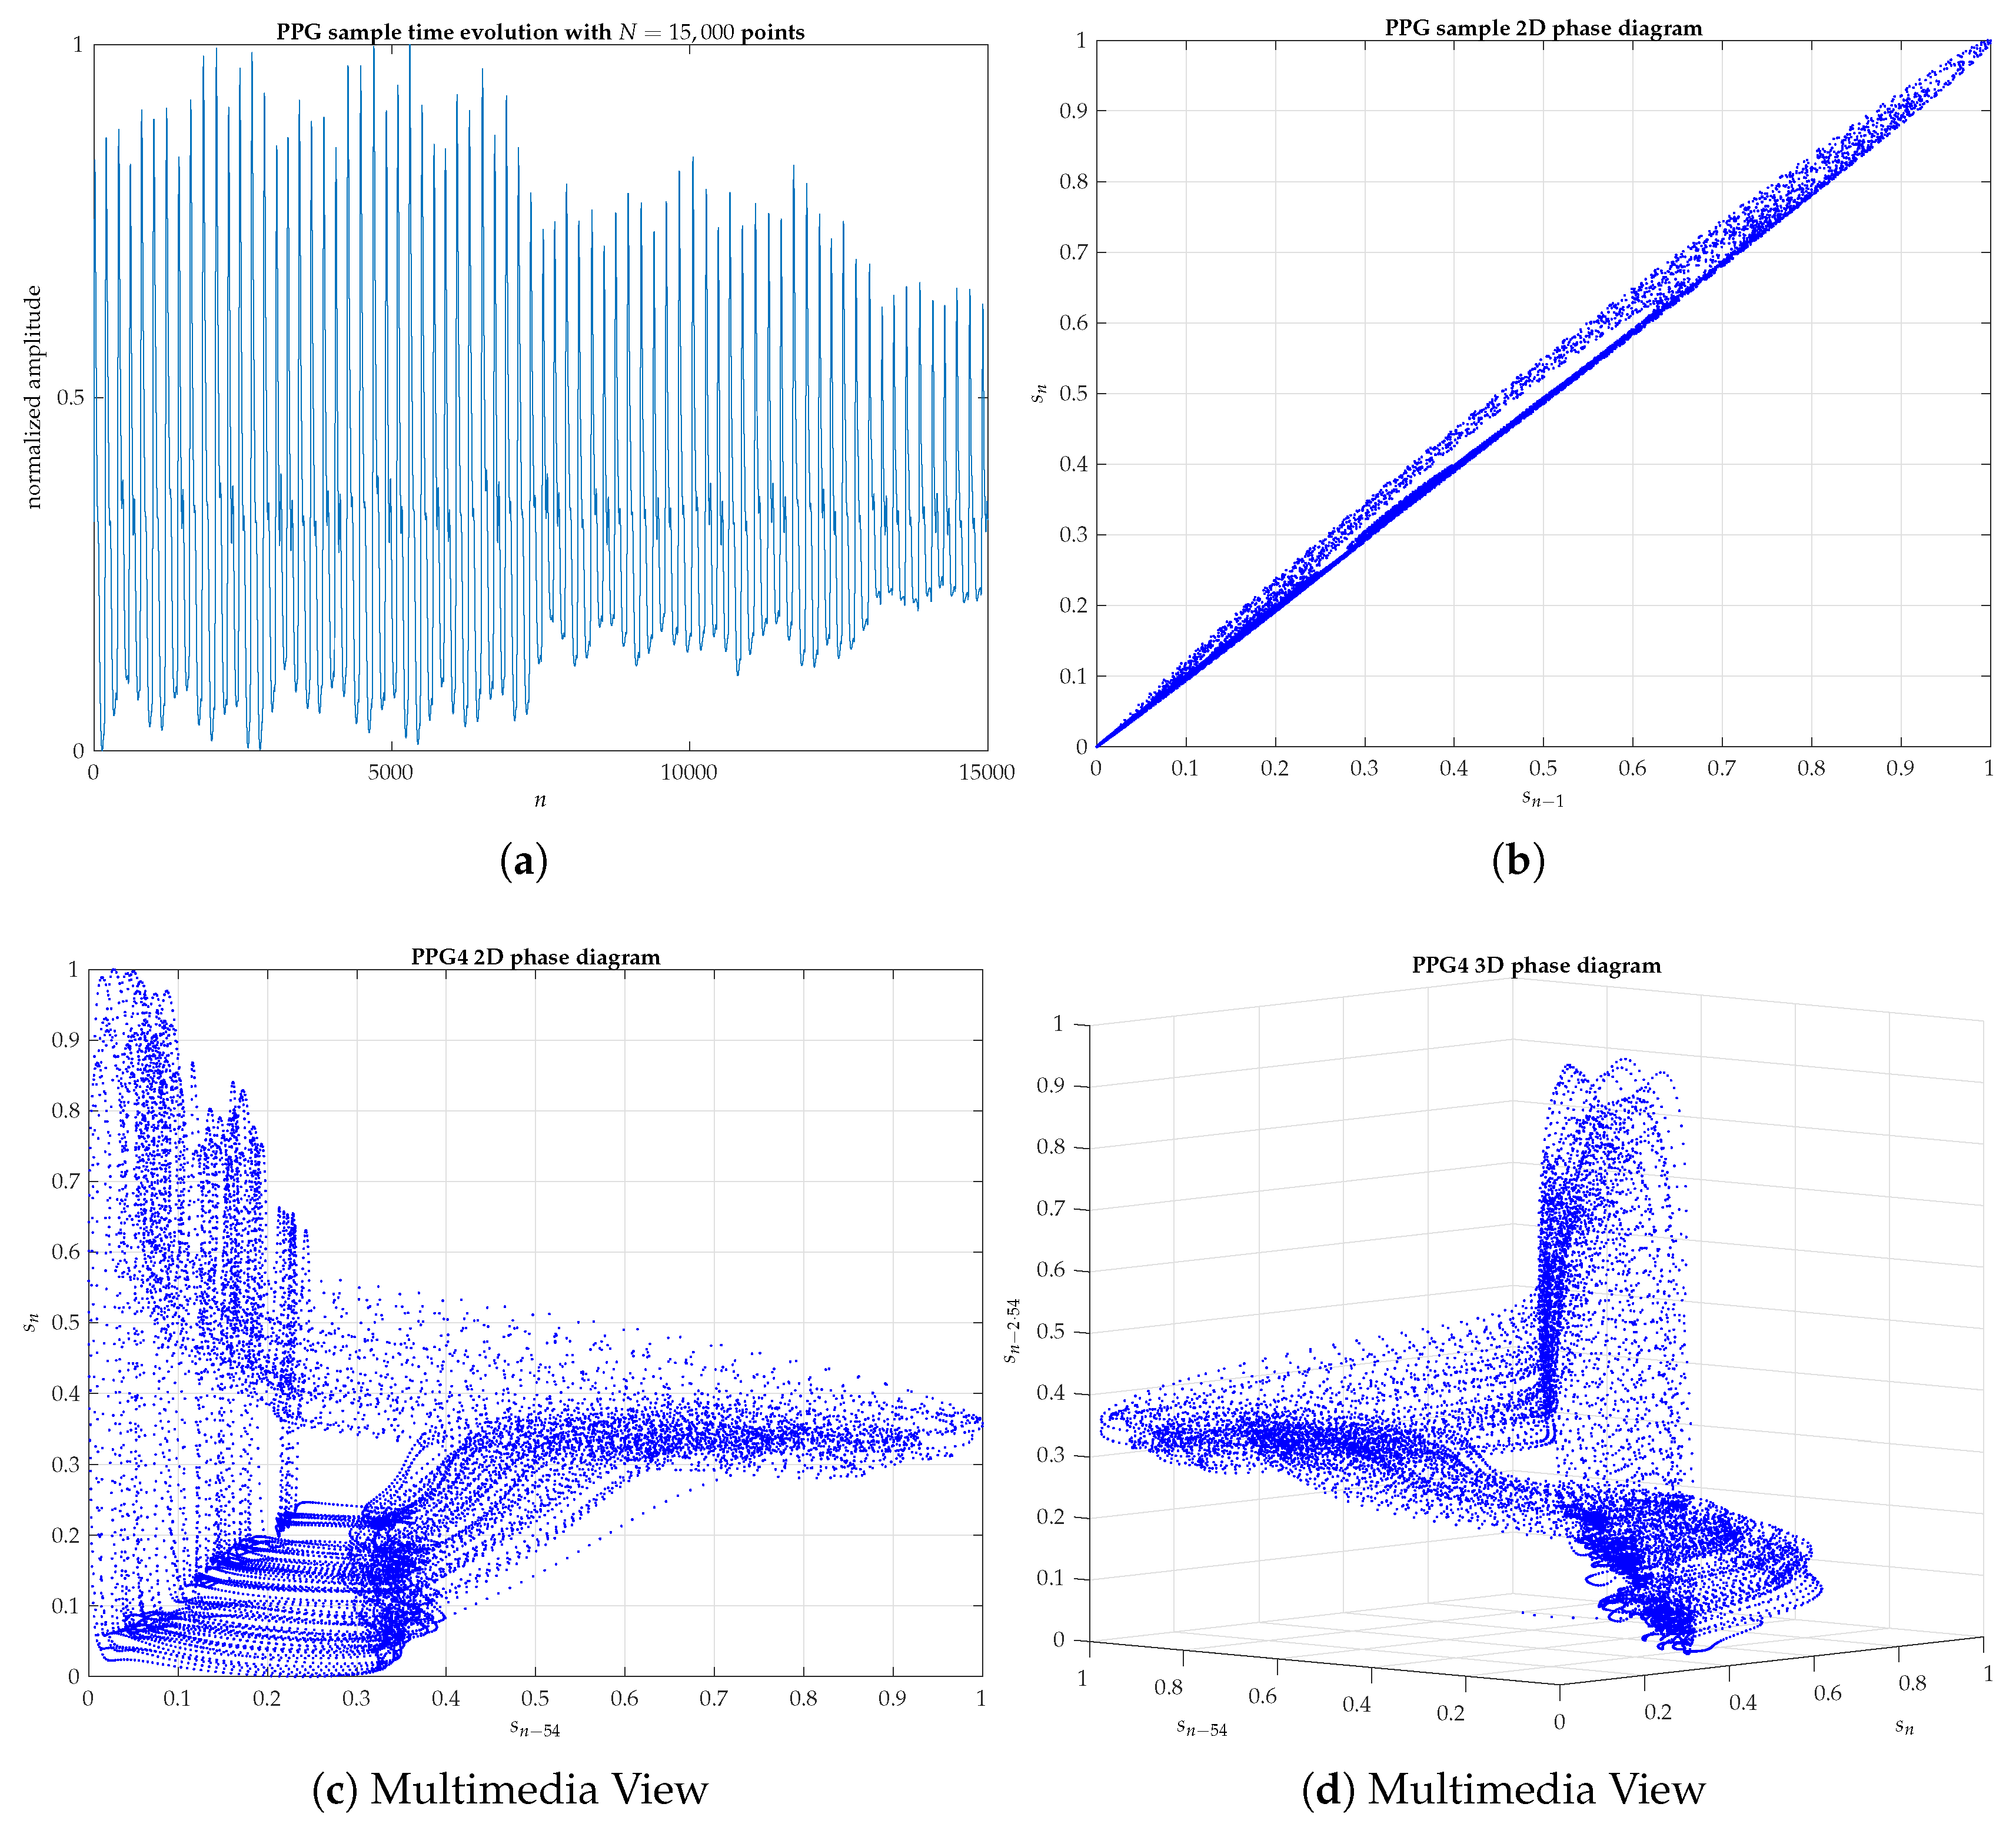
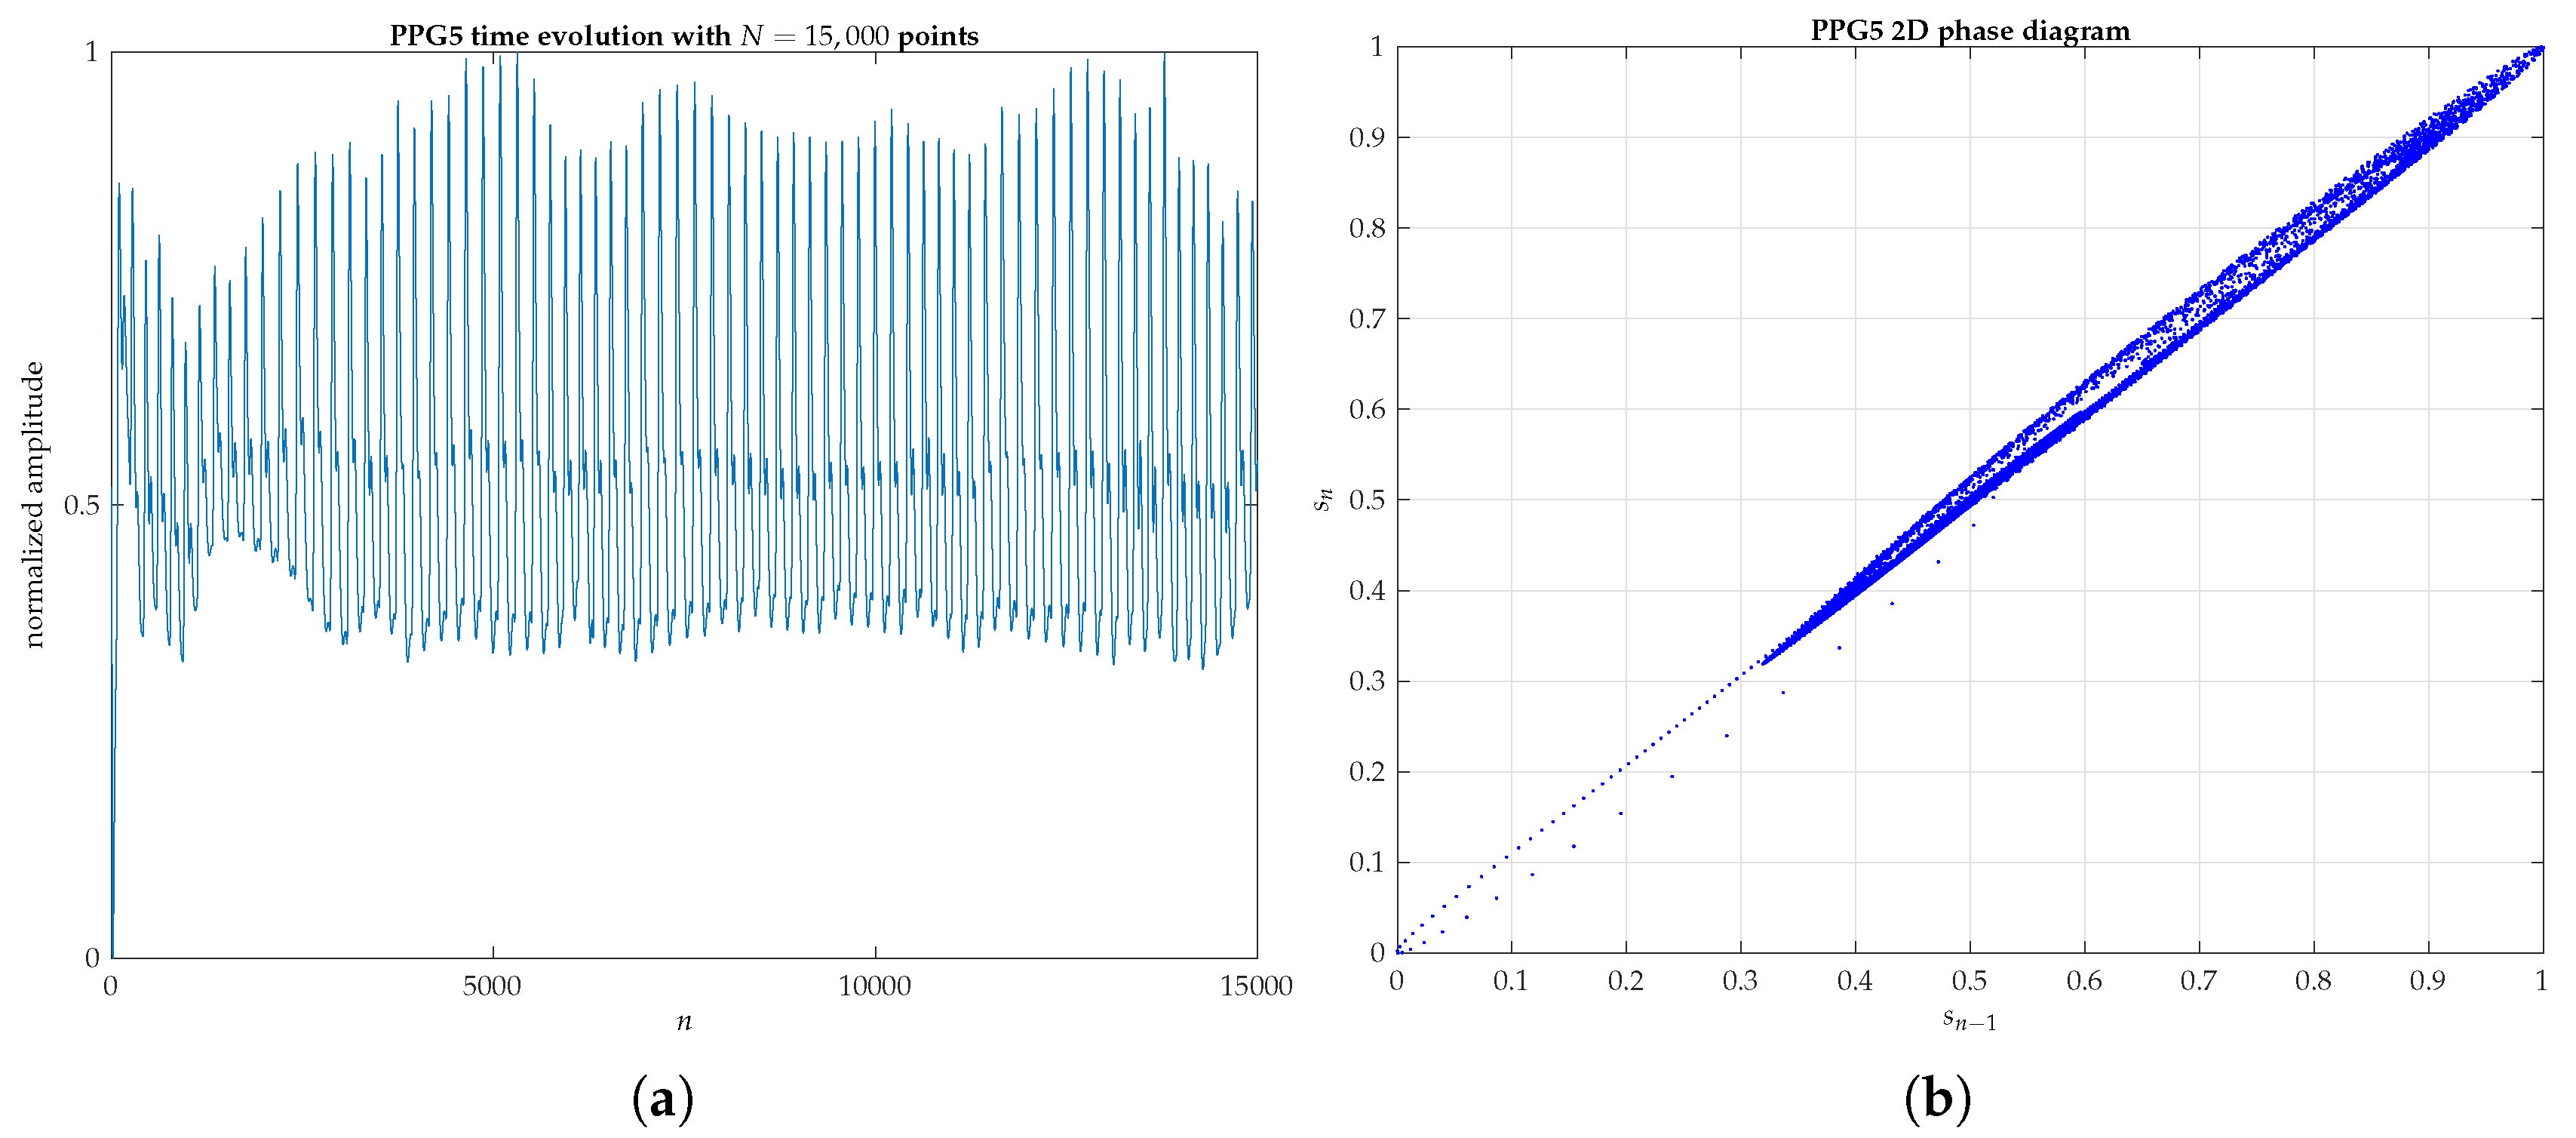
Appendix B. 2D and 3D Phase Diagrams of Five PPG Signals Randomly Chosen


References
- Tsuda, I.; Tahara, T.; Iwanaga, H. Chaotic pulsation in human capillary vessels and its dependence on mental and physical conditions. Int. J. Bifurc. Chaos 1992, 2, 313–324. [Google Scholar] [CrossRef]
- Strogatz, S.H. Nonlinear Dynamics and Chaos; Studies in Nonlinearity; Perseus Books Publishing, LLC: Cambridge, MA, USA, 1994. [Google Scholar]
- Baker, G.L.; Gollub, J.P. Chaotic Dynamics: An Introduction, 2nd ed.; Cambridge University Press: Cambridge, UK, 1996. [Google Scholar]
- Ott, E. Chaos in Dynamical Systems, 2nd ed.; Cambridge University Press: Cambridge, UK, 2002. [Google Scholar]
- Devaney, R.L. An Introduction to Chaotic Dynamical Systems, 2nd ed.; CRC Press: Boca Raton, FL, USA, 2018. [Google Scholar]
- Shelhamer, M. Nonlinear Dynamics in Physiology. A State-Space Approach; World Scientific Publishing: Toh Tuck Link, Singapore, 2007. [Google Scholar]
- Cipra, B. If You Can’t See It, Don’t Believe It. Science 1993, 259, 26–27. [Google Scholar] [CrossRef] [PubMed]
- Liebert, W.; Schuster, H.G. Proper choice of the time delay for the analysis of chaotic time series. Phys. Lett. A 1989, 142, 107–111. [Google Scholar] [CrossRef]
- Yule, G.U. On a Method of Investigating Periodicities in Disturbed Series, with Special Reference to Wolfer’s Sunspot Numbers. Philos. Trans. R. Soc. Lond. Ser. A Contain. Pap. Math. Phys. Character 1927, 226, 267–298. [Google Scholar]
- Takens, F. Detecting strange attractors in turbulence. In Lecture Notes in Mathematics; Springer: Berlin/Heidelberg, Germany, 1981; pp. 366–381. [Google Scholar] [CrossRef]
- Sauer, T.; Yorke, J.A.; Casdagli, M. Embedology. J. Stat. Phys. 1991, 65, 579–616. [Google Scholar] [CrossRef]
- Eckmann, J.P.; Ruelle, D. Ergodic theory of chaos and strange attractors. Rev. Modern Phys. 1985, 57, 617–656. [Google Scholar] [CrossRef]
- Broomhead, D.; King, G.P. Extracting qualitative dynamics from experimental data. Phys. D Nonlinear Phenom. 1986, 20, 217–236. [Google Scholar] [CrossRef]
- Abarbanel, H.D.I.; Brown, R.; Sidorowich, J.J.; Tsimring, L.S. The analysis of observed chaotic data in physical systems. Rev. Modern Phys. 1993, 65, 1331–1392. [Google Scholar] [CrossRef]
- Ruelle, D.; Takens, F. On the nature of turbulence. Comm. Math. Phys. 1971, 20, 167–192. [Google Scholar] [CrossRef]
- Cano-García, G.; González-Marcos, A.P.; Ugena, A.M. Sistema Óptico de detección de la tensión emocional. In XII Reunión Nacional Óptica; Libro de resúmenes; Sociedad Española de Óptica, Universitat Jaume I de Castelló: Castelló, Spain, 2018; p. 218. ISBN 978-84-09-03559-5. [Google Scholar]
- Allen, J. Photoplethysmography and its application in clinical physiological measurement. Physiol. Meas. 2007, 28, R1–R39. [Google Scholar] [CrossRef]
- Mendes, J.J.A., Jr.; Vieira, M.E.M.; Pires, M.B.; Stevan, S.L., Jr. Sensor Fusion and Smart Sensor in Sports and Biomedical Applications. Sensors 2016, 16, 1569. [Google Scholar] [CrossRef]
- Elgendi, M.; Liang, Y.; Ward, R. Toward Generating More Diagnostic Features from Photoplethysmogram Waveforms. Diseases 2018, 6, 20. [Google Scholar] [CrossRef] [PubMed]
- Aguiló, J.; Ferrer-Salvans, P.; García-Rozo, A.; Armario, A.; Corbi, A.; Cambra, F.J.; Bailón, R.; González-Marcos, A.; Caja, G.; Aguiló, S.; et al. Project ES3: Attempting to quantify and measure the level of stress. Rev. Neurol. 2015, 61, 405–415. [Google Scholar] [PubMed]
- Arza, A.; Garzón-Rey, J.M.; Lázaro, J.; Gil, E.; López-Antón, R.; de la Cámara, C.; Laguna, P.; Bailón, R.; Aguiló, J. Measuring acute stress response through physiological signals: Towards a quantitative assessment of stress. Med. Biol. Eng. Comput. 2018, 57, 271–287. [Google Scholar] [CrossRef] [PubMed]
- de Pedro-Carracedo, J.; Ugena, A.; Gonzalez-Marcos, A. Dynamical analysis of biological signals with the 0–1 test. arXiv 2019, arXiv:1906.00782. [Google Scholar]
- Ram, M.R.; Madhav, K.V.; Krishna, E.H.; Komalla, N.R.; Reddy, K.A. A Novel Approach for Motion Artifact Reduction in PPG Signals Based on AS-LMS Adaptive Filter. IEEE Trans. Instrum. Meas. 2012, 61, 1445–1457. [Google Scholar] [CrossRef]
- Hilborn, R.C. Chaos and Nonlinear Dynamics: An Introduction for Scientists and Engineers; Oxford University Press: Oxford, UK, 2001. [Google Scholar]
- Gleick, J. Chaos: Making a New Science; A Penguin Book: Science, Penguin, 1988. [Google Scholar]
- Kantz, H.; Schreiber, T. Nonlinear Time Series Analysis, 2nd ed.; Cambridge Nonlinear Science Series; Cambridge University Press: Cambridge, UK, 2004. [Google Scholar]
- Ruelle, D. Chaotic Evolution and Strange Attractors; Cambridge University Press: Cambridge, UK, 1989. [Google Scholar]
- Jeong, J.; Gore, J.; Peterson, B. A method for determinism in short time series, and its application to stationary EEG. IEEE Trans. Biomed. Eng. 2002, 49, 1374–1379. [Google Scholar] [CrossRef]
- Theiler, J.; Eubank, S.; Longtin, A.; Galdrikian, B.; Farmer, J.D. Testing for nonlinearity in time series: The method of surrogate data. Phys. D Nonlinear Phenom. 1992, 58, 77–94. [Google Scholar] [CrossRef]
- Schreiber, T.; Schmitz, A. Surrogate time series. Phys. D Nonlinear Phenom. 2000, 142, 346–382. [Google Scholar] [CrossRef]
- Packard, N.H.; Crutchfield, J.P.; Farmer, J.D.; Shaw, R.S. Geometry from a time series. Phys. Rev. Lett. 1980, 45, 712–716. [Google Scholar] [CrossRef]
- Casdagli, M.; Eubank, S.; Farmer, J.D.; Gibson, J. State space reconstruction in the presence of noise. Phys. D Nonlinear Phenom. 1991, 51, 52–98. [Google Scholar] [CrossRef]
- Davis, J.C. Statistics and Data Analysis in Geology, 3rd ed.; Wiley India Pvt. Limited: Delhi, India, 2011. [Google Scholar]
- Makridakis, S.; Wheelwright, S.C.; Hyndman, R.J. Forecasting Methods and Applications, 3rd ed.; Wiley India Pvt. Limited: Delhi, India, 2008. [Google Scholar]
- Tsonis, A.A. Chaos: From Theory to Applications; Springer: New York City, NY, USA, 2012. [Google Scholar]
- Fraser, A.M. Reconstructing attractors from scalar time series: A comparison of singular system and redundancy criteria. Phys. D Nonlinear Phenom. 1989, 34, 391–404. [Google Scholar] [CrossRef]
- Grassberger, P.; Procaccia, I. Measuring the strangeness of strange attractors. Phys. D Nonlinear Phenom. 1983, 9, 189–208. [Google Scholar] [CrossRef]
- Liebert, W.; Pawelzik, K.; Schuster, H.G. Optimal Embeddings of Chaotic Attractors from Topological Considerations. EPL (Europhys. Lett.) 1991, 14, 521. [Google Scholar] [CrossRef]
- Kennel, M.B.; Abarbanel, H.D.I. False neighbors and false strands: A reliable minimum embedding dimension algorithm. Phys. Rev. E 2002, 66. [Google Scholar] [CrossRef]
- Pecora, L.M.; Moniz, L.; Nichols, J.; Carroll, T.L. A unified approach to attractor reconstruction. Chaos Interdiscip. J. Nonlinear Sci. 2007, 17, 013110. [Google Scholar] [CrossRef]


| Evaluated Signal | m | ||||
|---|---|---|---|---|---|
| AF | MI | PCA | FNN | ||
| Subject Number 1 (PPG1) | 52 | 81 | 5 | 9 | 5 |
| Subject Number 2 (PPG2) | 37 | 35 | 6 | 5 | 5 |
| Subject Number 3 (PPG3) | 29 | 30 | 5 | 5 | 5 |
| Subject Number 4 (PPG4) | 44 | 54 | 6 | 5 | 5 |
| Subject Number 5 (PPG5) | 44 | 33 | 6 | 5 | 5 |
© 2020 by the authors. Licensee MDPI, Basel, Switzerland. This article is an open access article distributed under the terms and conditions of the Creative Commons Attribution (CC BY) license (http://creativecommons.org/licenses/by/4.0/).
Share and Cite
de Pedro-Carracedo, J.; Fuentes-Jimenez, D.; Ugena, A.M.; Gonzalez-Marcos, A.P. Phase Space Reconstruction from a Biological Time Series: A Photoplethysmographic Signal Case Study. Appl. Sci. 2020, 10, 1430. https://doi.org/10.3390/app10041430
de Pedro-Carracedo J, Fuentes-Jimenez D, Ugena AM, Gonzalez-Marcos AP. Phase Space Reconstruction from a Biological Time Series: A Photoplethysmographic Signal Case Study. Applied Sciences. 2020; 10(4):1430. https://doi.org/10.3390/app10041430
Chicago/Turabian Stylede Pedro-Carracedo, Javier, David Fuentes-Jimenez, Ana María Ugena, and Ana Pilar Gonzalez-Marcos. 2020. "Phase Space Reconstruction from a Biological Time Series: A Photoplethysmographic Signal Case Study" Applied Sciences 10, no. 4: 1430. https://doi.org/10.3390/app10041430
APA Stylede Pedro-Carracedo, J., Fuentes-Jimenez, D., Ugena, A. M., & Gonzalez-Marcos, A. P. (2020). Phase Space Reconstruction from a Biological Time Series: A Photoplethysmographic Signal Case Study. Applied Sciences, 10(4), 1430. https://doi.org/10.3390/app10041430


