Article

Fatigue Performance of Different Rib-To-Deck Connections Using Traction Structural Stress Method

1
School of Civil Engineering, Harbin Institute of Technology, Harbin 150001, China
2
School of Naval Architecture and Ocean Engineering, Harbin Institute of Technology at WeiHai, Weihai 264200, China
3
Department of Naval Architecture and Marine Engineering, University of Michigan, Ann Arbor, MI 48109, USA
*
Author to whom correspondence should be addressed.
Appl. Sci. 2020, 10(4), 1239; https://doi.org/10.3390/app10041239
Submission received: 8 January 2020 / Revised: 31 January 2020 / Accepted: 8 February 2020 / Published: 12 February 2020
(This article belongs to the Section Mechanical Engineering)

Abstract

:
The fatigue performance of an orthotropic steel bridge deck is significantly influenced by the type of the rib-to-deck connection considering the crossbeam. Fatigue fracture of the weld seam at the rib-to-deck connection has been a serious problem in such decks. In this paper, numerical models are developed for the orthotropic steel bridge decks and are analyzed for the fatigue behavior. The traction structural stress method is proven to be more accurate and effective in predicting the fatigue life. Fatigue behavior of three typical rib-to-deck connections are obtained by using traction structural stress method and by considering the effect of crossbeams. Compared to the bridge deck with weld seam of a large root, the fatigue performance of the deck with single-sided weld seam is much better with lower equivalent structural stress. The results indicate that the weld seam size should be strictly controlled for better fatigue resistance. The fatigue performance of the bridge deck with double-sided seam is significantly better than that of the bridge deck with single-sided weld seam. An increase in the thickness of the inner weld seam in the rib-to-deck connection optimizes the distribution of the equivalent structural stress and shifts the fatigue failure location from the weld root of the outer weld seam to the weld toe of the inner weld seam thus demonstrating the effect of the crossbeam. The trends of equivalent structural stress with geometric parameters of the weld seam in the rib-to-deck connection are obtained in this study. The fatigue behavior of the components and the equivalent structural stress are significantly influenced by the bridge deck thickness.

1. Introduction

The orthotropic steel bridge deck (OSBD) consists of a bridge deck, longitudinal ribs, and transverse crossbeams connected with groove weld seams and has been widely applied globally in long-span steel bridges owing to its advantages of light weight and large bearing capacity [1,2,3]. However, fatigue cracks are observed at the connection of the rib-to-deck and rib-to-crossbeam of the OSBD in service under vehicle-induced fatigue loading [4,5]. Various types of fatigue cracks indicate that there are various types of fatigue failure modes [6]. At present, single-sided weld seam based on Eurocde3 are the main types of connection of the rib-to-deck in the OSBD [7]. However, there are some disadvantages of this type of weld seam, such as the asymmetrical force distribution and lower structural stiffness [8,9,10,11].
As an improvement, some scholars have recently proposed double-sided weld seam [12,13] that became possible with the development of the advanced weld technology. The inner weld seam is welded and added to the closed U-rib. For instance, the new type of double-sided weld seam has been applied in the newly constructed long-span bridge in China with advanced weld technology [14].
Despite the wide application of the OSBD, the type of connection of the rib-to-deck and the transverse crossbeam is complex. The orthotropic steel bridge specification as per Eurocode3 prescribes certain values for various design parameters of the OSBD [7]. However, the fatigue performance of the connection of the OSBD is not presented clearly, particularly considering the parameters including the groove angle, radius, bridge deck thickness and U-rib thickness. The reference [7] cannot guide engineers about the fatigue design of the orthotropic steel bridge.
This study investigates the fatigue performance of various types of rib-to-deck connections considering the effect of the crossbeams using traction structural stress method [15,16,17,18,19]. Fatigue behavior of the bridge deck is compared for three types of rib-to-deck connections, namely, traditional single-sided weld seam, weld seam of large root and double-sided weld seam. The weld seam with the best fatigue performance is determined based on the comparative results of various weld seams. Furthermore, this study identifies design parameters that shall be considered to estimate the fatigue behavior and equivalent structural stress of the bridge decks in the OSBD. The relationship of the design parameters with the equivalent structural stress and fatigue failure modes are determined. This study is expected to provide a useful reference for practicing engineers in the design of the OSBD.

2. Validation of the Numerical Simulation Method

2.1. Traction Structural Stress Method

Traditional evaluation methods using the nominal stress method were applied for the fatigue life prediction of the welded components for a long time. The prediction results were usually conservative because the stress concentration effect of welded components was not considered. In the tradition numerical studies, the hot spot stress of the interested zone of the structure was mesh-size sensitive based on the extrapolation method of the stress. Furthermore, the notched stress of the weld toe of the weld seam was determined based the size of the notch.
In order to overcome the limitations of the traditional analysis methods of the weld seam, traction structural stress method was proposed by Dong [17,18,19] based on the fracture structure mechanism and Paris Law. The method was proved to be mesh-size insensitive and accurate for the fatigue performance prediction by comparing the fatigue test results from this method with the traditional methods. The proposed method [17,18,19] explained the crack initiation and propagation direction accurately. Later, the method was applied to predict the fatigue life of coastal pipes and pressure vessels.
The inner stress of the weld toe along the direction of the thickness was divided into the normal stress, σx(y), and shear stress in plane, τxy(y), as shown in Figure 1. Based the equilibrium conditions of forces and moments, the normal stress was simply divided into the membrane stress, σm, and bending stress, σb. The in-plane shear stress was simplified as the vertical shear stress, τm. However, the effect of the shear stress was generally ignored as it would have little influence on the propagation of the fatigue cracks. The traction structural stress was defined as the sum of the membrane stress σm and bending stress σb, as in Equations (1)–(3). The nodal forces and moments of the nodes of the weld seam and weld elements can be obtained, as shown in Figure 2.
σ m = 1 t i = 1 n F i
σ b = 6 t 2 i = 1 n F i × ( y i t / 2 )
σ s = σ m + σ b
The propagation of a fatigue crack considered both short and long cracks. The relative crack length was represented with the combination of short cracks and long cracks using the united Paris Law. The stress intensity factor K in Equation (4) represented the stress intensity of fatigue tip and was calculated as in Equation (4). The equivalent structural stress range could be calculated using Equation (5) by considering the effect of the thickness, t, the ratio of bending stress to traction structural stress, r, and the traction structural stress range, Δσy. Besides, the equivalent structural stress range, ΔSs, versus fatigue cyclic life N, namely the master S-N curve, was determined by considering the parameter Cd, h and m based on the data analysis of the fatigue test results as shown in Equation (6). The parameter r stands for the ratio of the bending structural stress to the structural stress. I(r) is the parameter of loading mode and the thickness of base metal and can be calculated as shown in Equation (7).
d a / d N = C M k n n Δ K n m
Δ S s Δ σ s t ( 2 m ) / 2 m · I ( r ) 1 / m
N = ( Δ S s / C d ) 1 / h
I ( r ) 1 m = 2.155 r 6 5.04 r 5 + 4.80 r 4 2.07 r 3 + 0.56 r 2 + 0.01 r + 1.543
The master S-N curve method was applied for the fatigue behavior prediction of various types of welded structures with the only one curve. The effect of stress concentration on the zone of interest, the thickness of base metal and various loading modes were considered in the master S-N curve. The problems of the S-N curves and the possible stress range near the weld toe were solved with the proposed method. The master S-N curves with different degrees of probabilities were plotted for better application of various fatigue test data. The standard deviation, σ, of the S-N curves was 0.246.
The traction structural stress method has been applied for the fatigue life evaluation of coastal pipes, pressure vessels and the welded components of the orthotropic steel bridges.

2.2. Validation of the Numerical Method

Fatigue tests of rib-to-deck welded connections in orthotropic steel bridge decks were carried out in the literature [8], as shown in Figure 3 Fatigue specimens under two loading cases were loaded and then fatigue cracking process, fatigue failure mode, characteristic fatigue life, and rigidity degradation were investigated. The structural hot spot stresses were investigated for fatigue behavior analysis.
In order to investigate the fatigue behavior of the fatigue test specimen and compare the analysis method of hot spot stress method and traction structural stress method, the numerical simulation method-based traction structural stress is carried out for fatigue behavior analysis. The loading modes overall size of the rib-to-deck connection in OSBD is determined based the literature. The constraint and loading case are set as the fatigue test. The fatigue specimen model was simply supported at the both end of the bridge deck. The fatigue load was applied to the rigid placed on the top side of the bridge deck, as shown in Figure 4.
The finite simulation results, including the equivalent structural stress and fatigue cyclic life, are shown in Figure 5 using the master S-N curve. The marking in the chart, U-rib loading mode I-HSS, represents the hot spot stress of the U-rib connection under the loading I. The label, U-rib loading mode II-SS, represents the equivalent structural stress of the U-rib connection under the loading II. Table 1 plots the fatigue test cyclic life of the fatigue test results and the hot spot stresses obtained during the tests. In addition, the equivalent structural stress of the numerical results using the traction structural stress method is shown in the table. The points in Figure 5 are determined based the actual fatigue test life and numerical stress results, including the hot spot stress and equivalent structural stress.
Compared with the master S-N curve, the predicted results from the hot spot stress is more conservative. The fatigue test results form a narrow band and fall within the 95% confidence interval of the master S-N curve.
The accuracy of the finite element simulation method using traction structural stress has also been validated [20,21] based on the comparison of fatigue test data. The traction structural stress method is proven to be more accurate and effective in predicting the fatigue life when compared to traditional prediction methods.

3. Fatigue Performance of Rib-To-Deck Connection Types in Orthotropic Steel Bridges

3.1. Fatigue Behavior of Three Typical Connections of the Rib-To-Deck

OSBD involves groove welding joints among bridge deck, longitudinal ribs and crossbeams. Due to the differences in the stiffness of the longitudinal rib and the crossbeam, fatigue cracks can occur at various locations and can have different propagation directions. Literature [22] showed that fatigue cracks occurred mainly at the location of the connection of rib-to-deck (30.2%), rib-to-crossbeam (62.4%), and the arc-shaped zone of the crossbeam and other locations (7.6%). Single-sided weld seam is the traditional connection of the rib-to-deck and this type of connection was applied widely in OSBD. Some scholars [12,13] proposed new types of connections of the rib-to-deck, namely large-fillet weld seam and double-sided weld seam.
Traction structural stress method can be effectively used to study the differences in the fatigue behaviors of the traditional and new types of the rib-to-deck connections. The equivalent structural stress range under the fatigue load is considered as a control target in this study. Besides, the effect of the crossbeam on the fatigue performance of the rib-to-deck is considered for more accurate results.
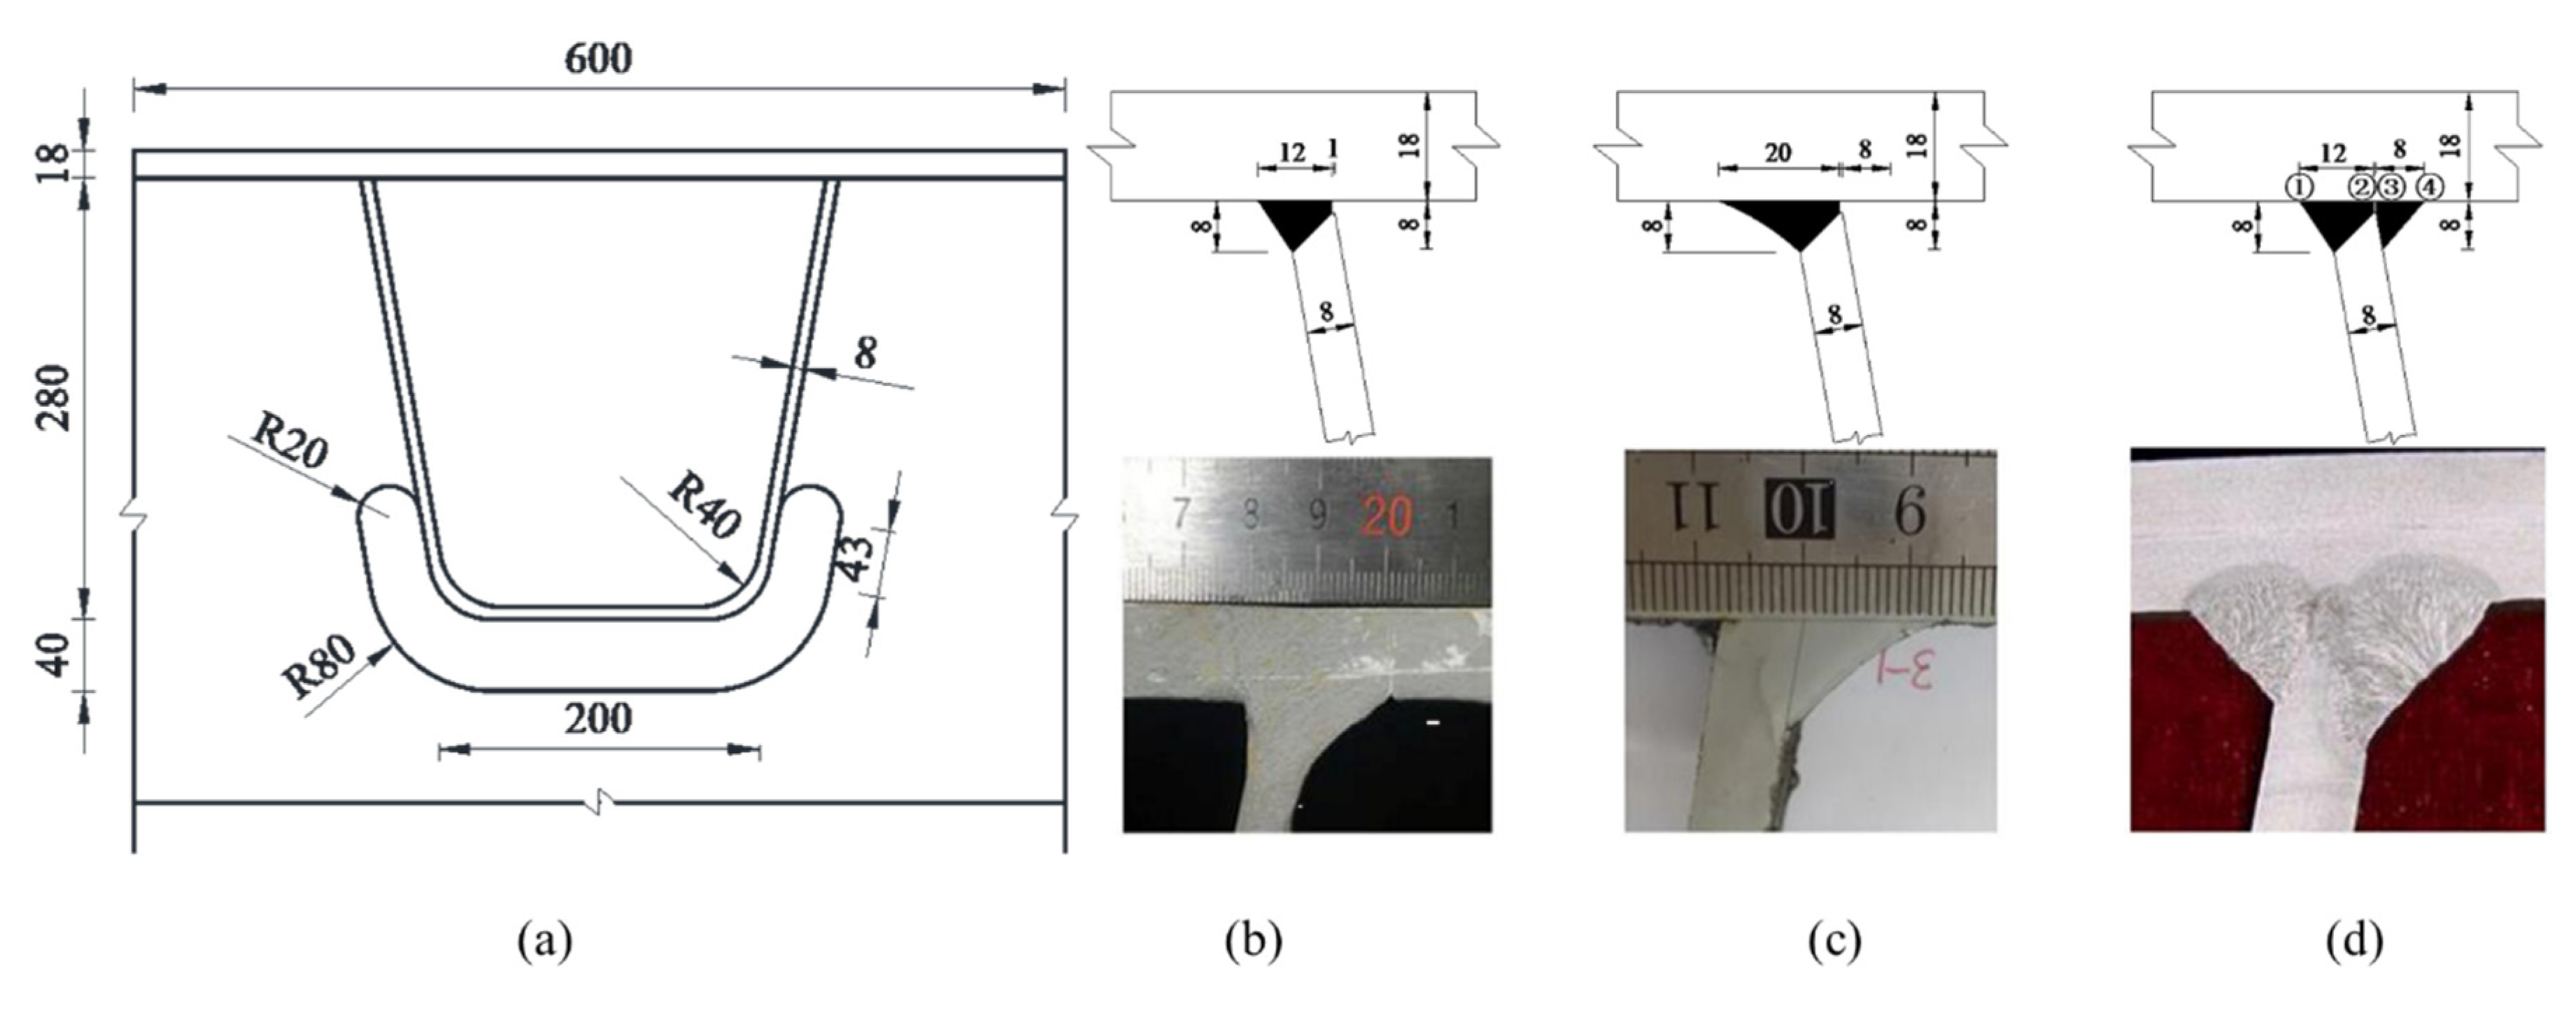
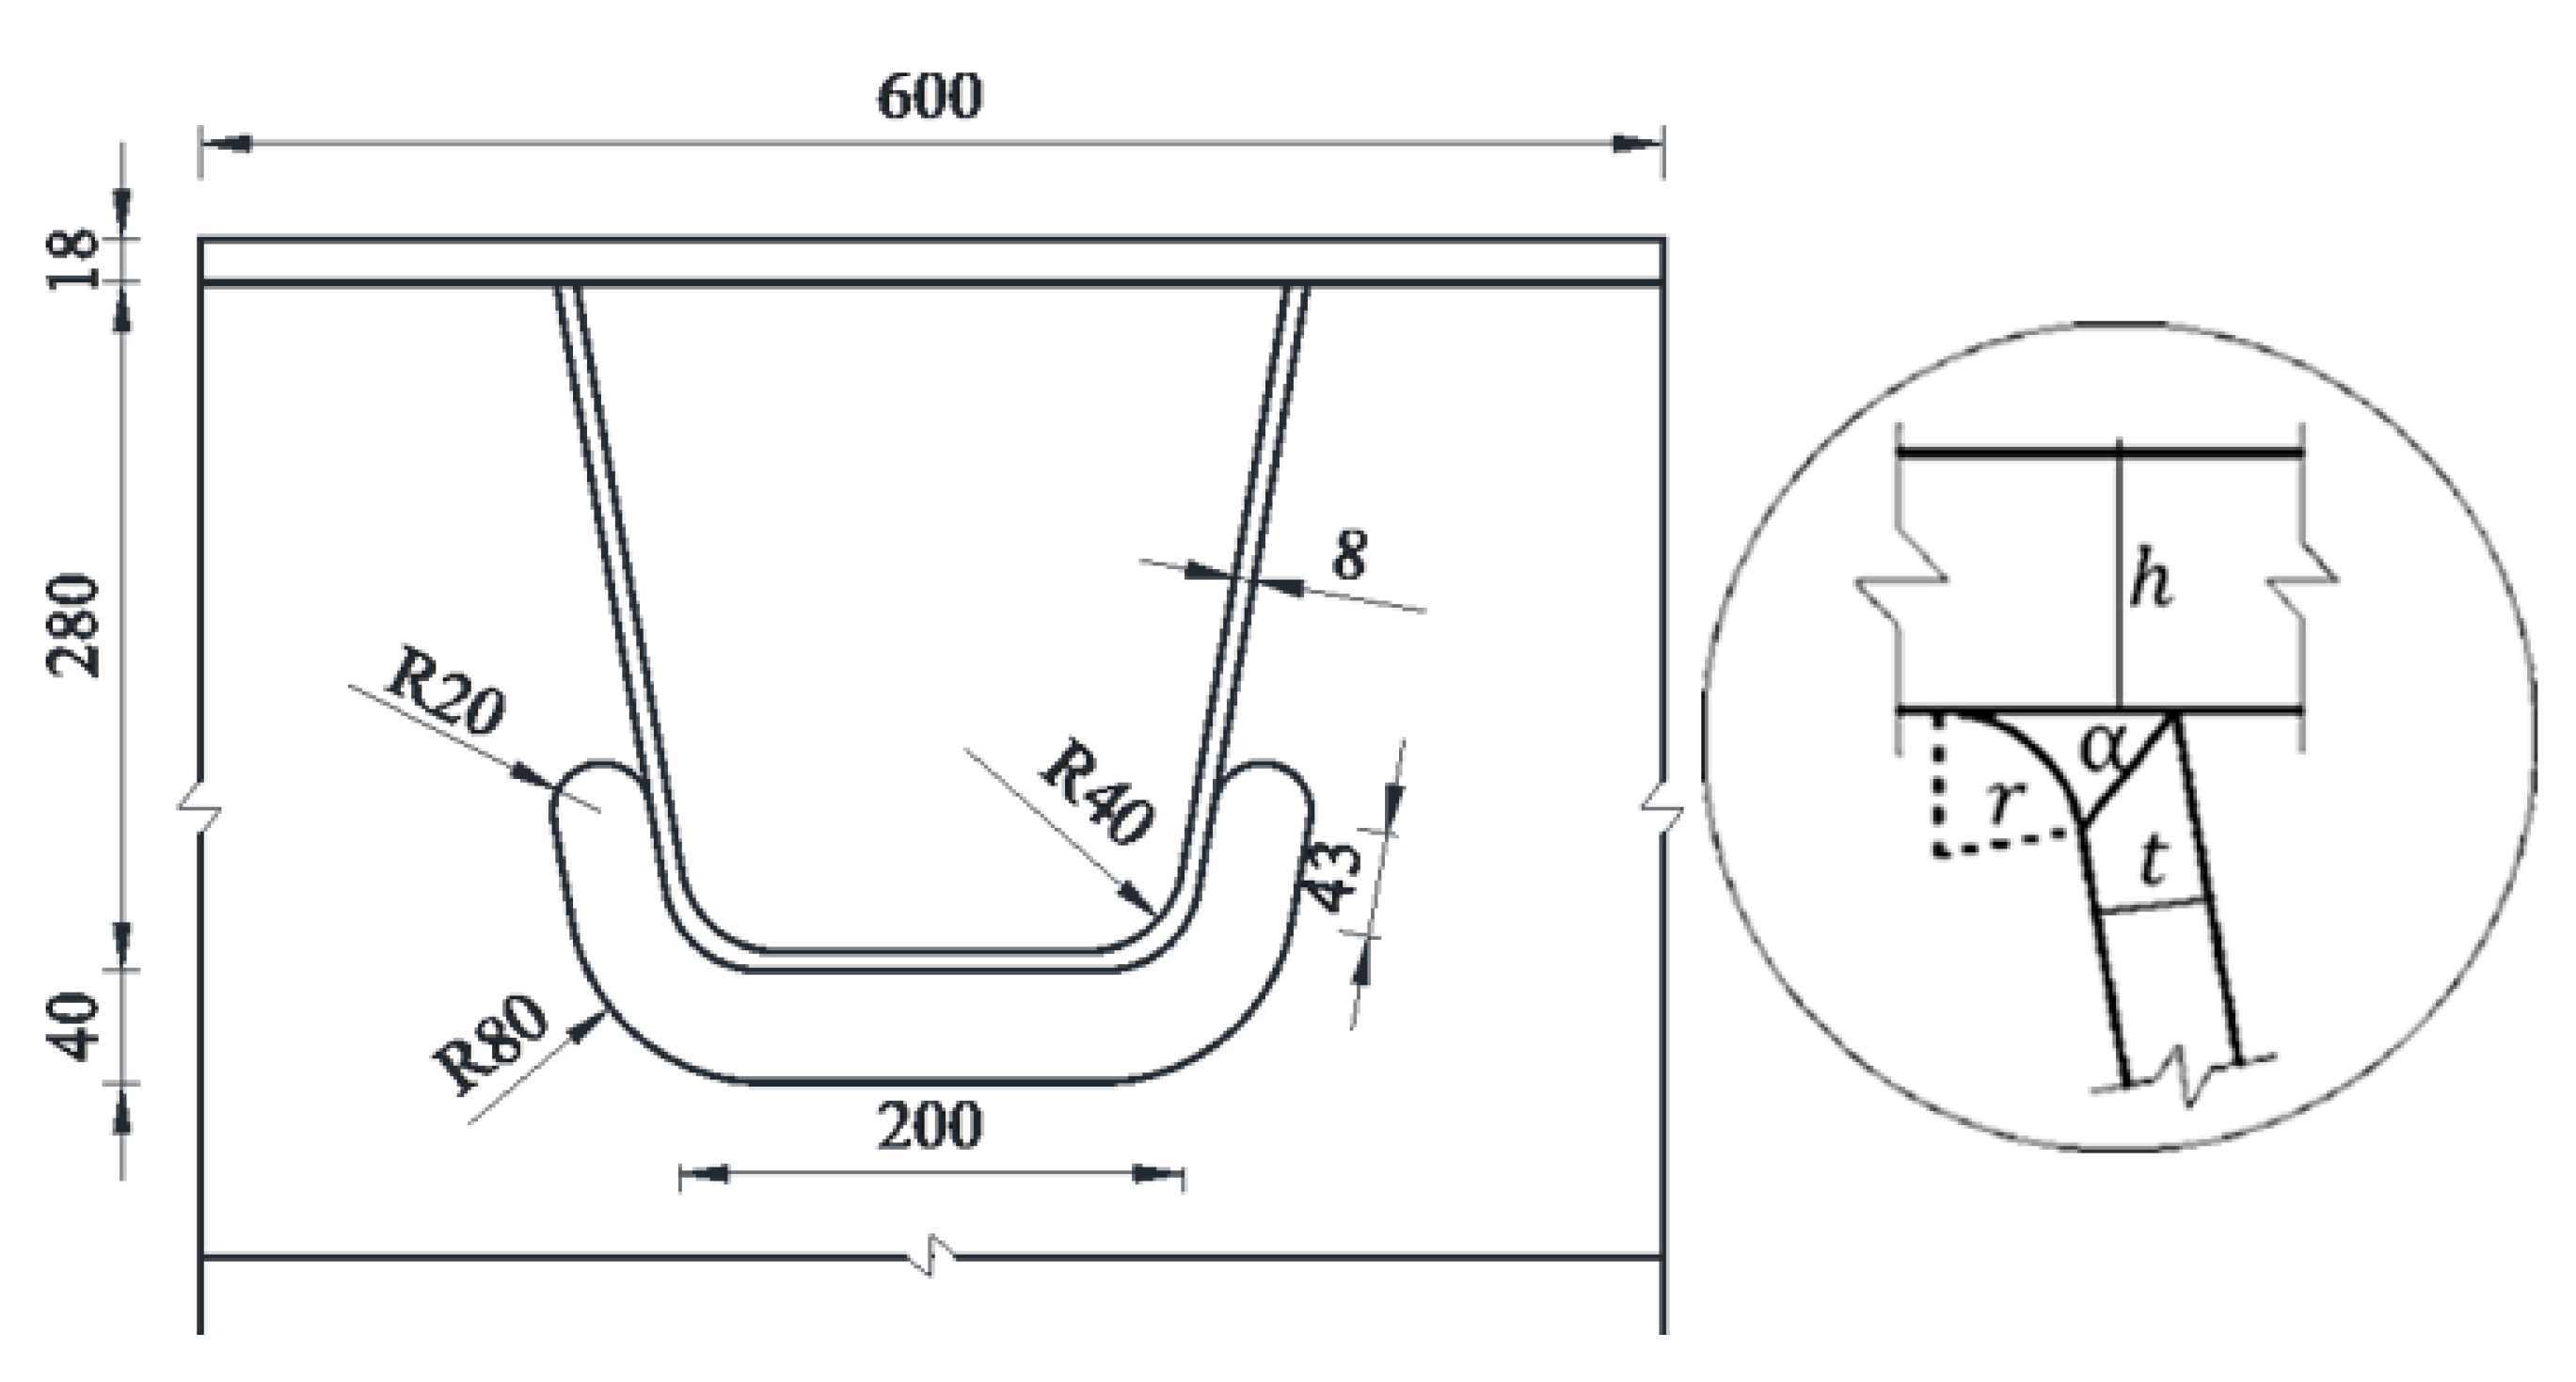
Figure 6 shows a local model of an OSBD constructed with a bridge deck, a U-rib and a crossbeam. The overall size of the local model was 600 mm (length) × 400 mm (height) × 200 mm (width) based on the size of an actual bridge. The sizes of the bridge deck, crossbeam and U-rib were 18 mm, 14 mm and 8 mm, respectively. The model of the OSBD and three typical weld seams of the connections between the bridge deck and U-rib are plotted in Figure 6.
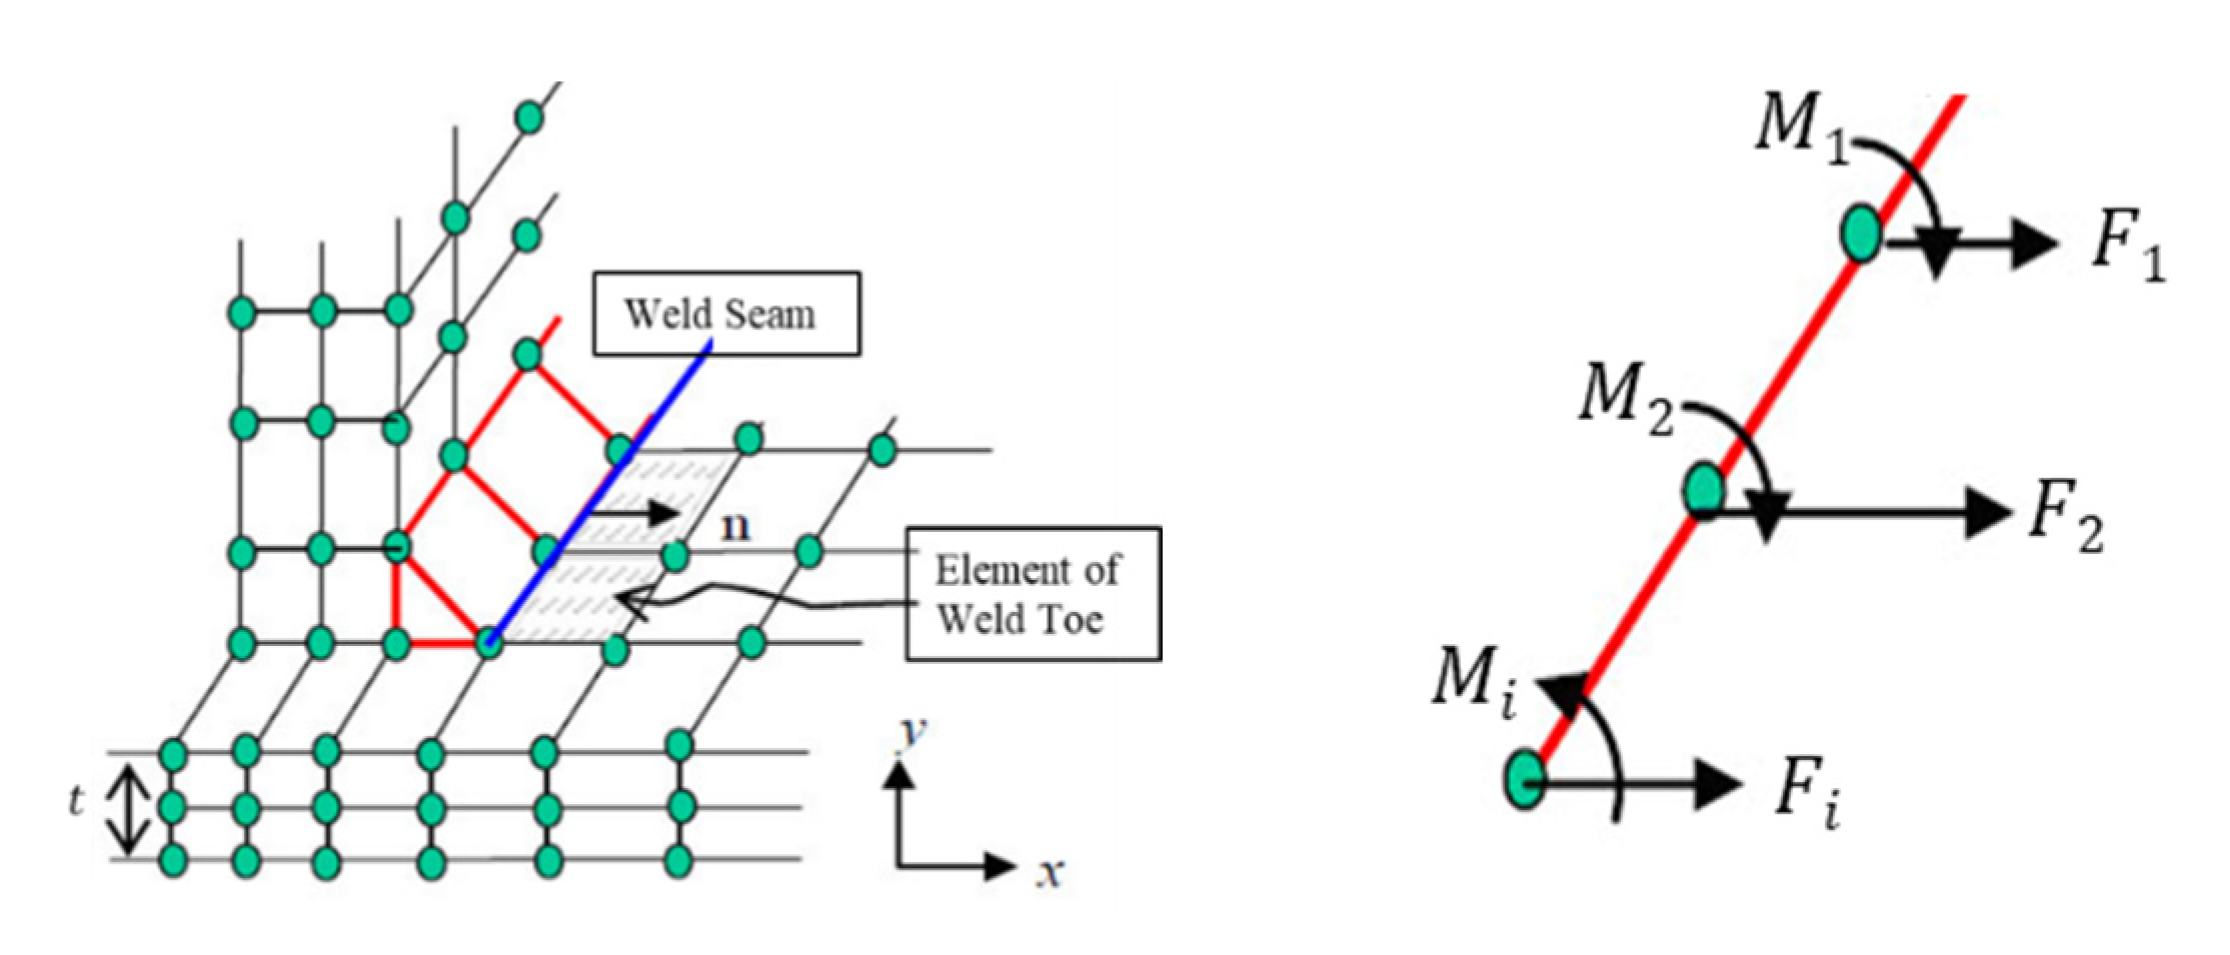
Furthermore, the size of the weld seams, including the size of the weld root and weld throat, are shown in the figure. The equivalent structural stress of the four typical weld seams, including the weld toe of the outer seam, weld root of the outer seam, weld root of the inner seam and weld toe of the inner seam, were identified as the evaluation target. Based on the traction structural stress method, the fatigue performance of the region with higher equivalent structural stress was more significant than other zones with lower stress.
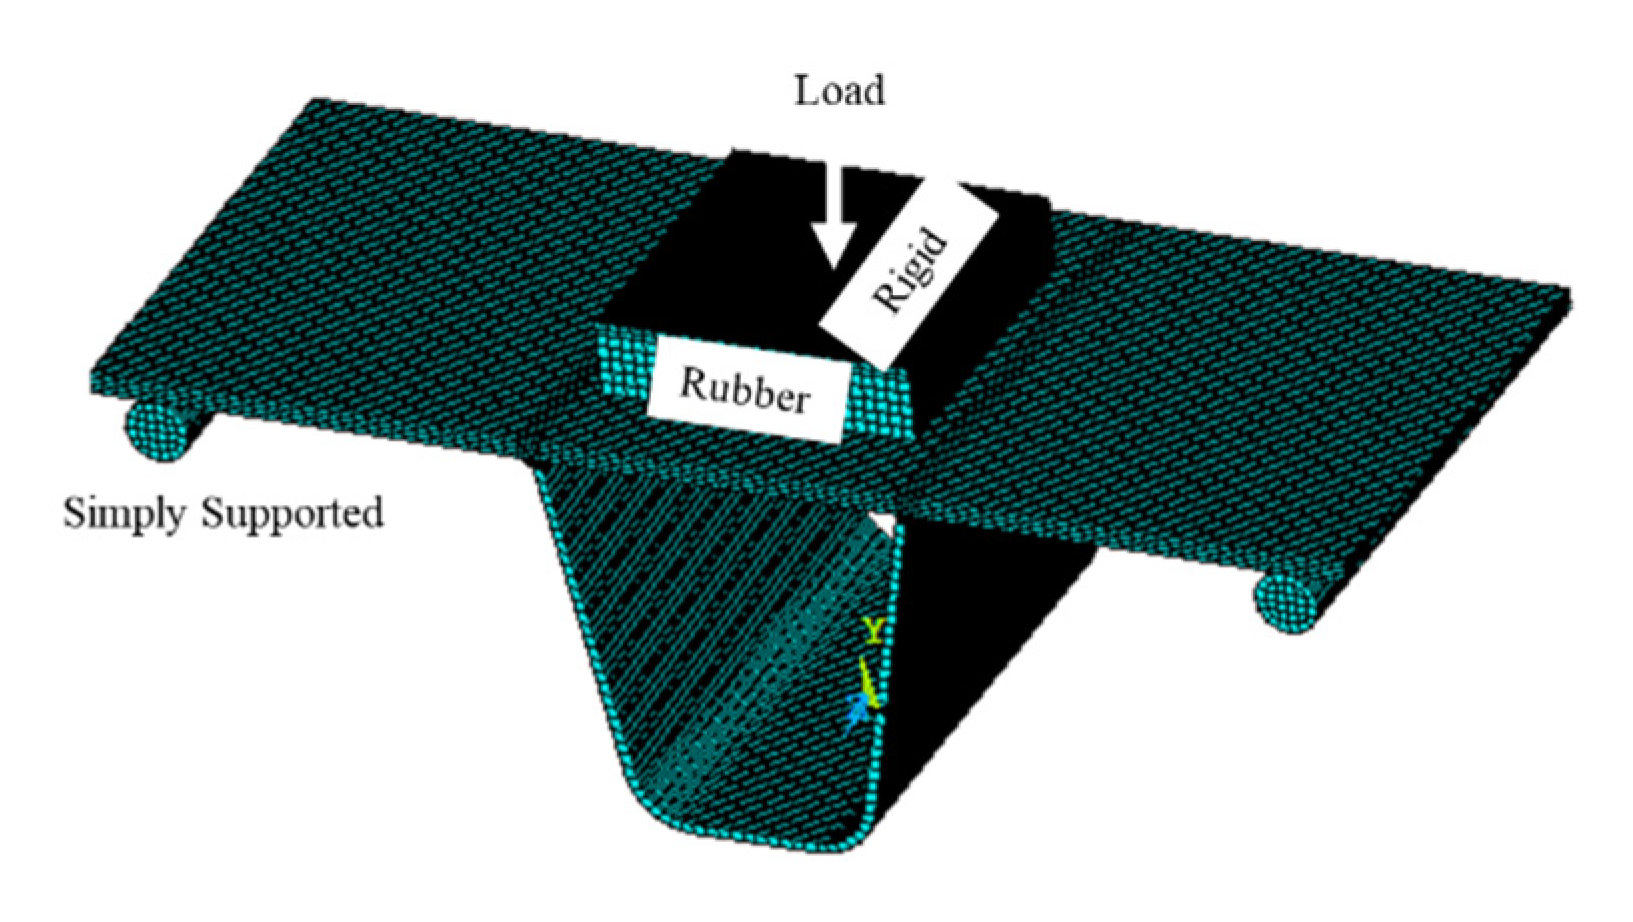
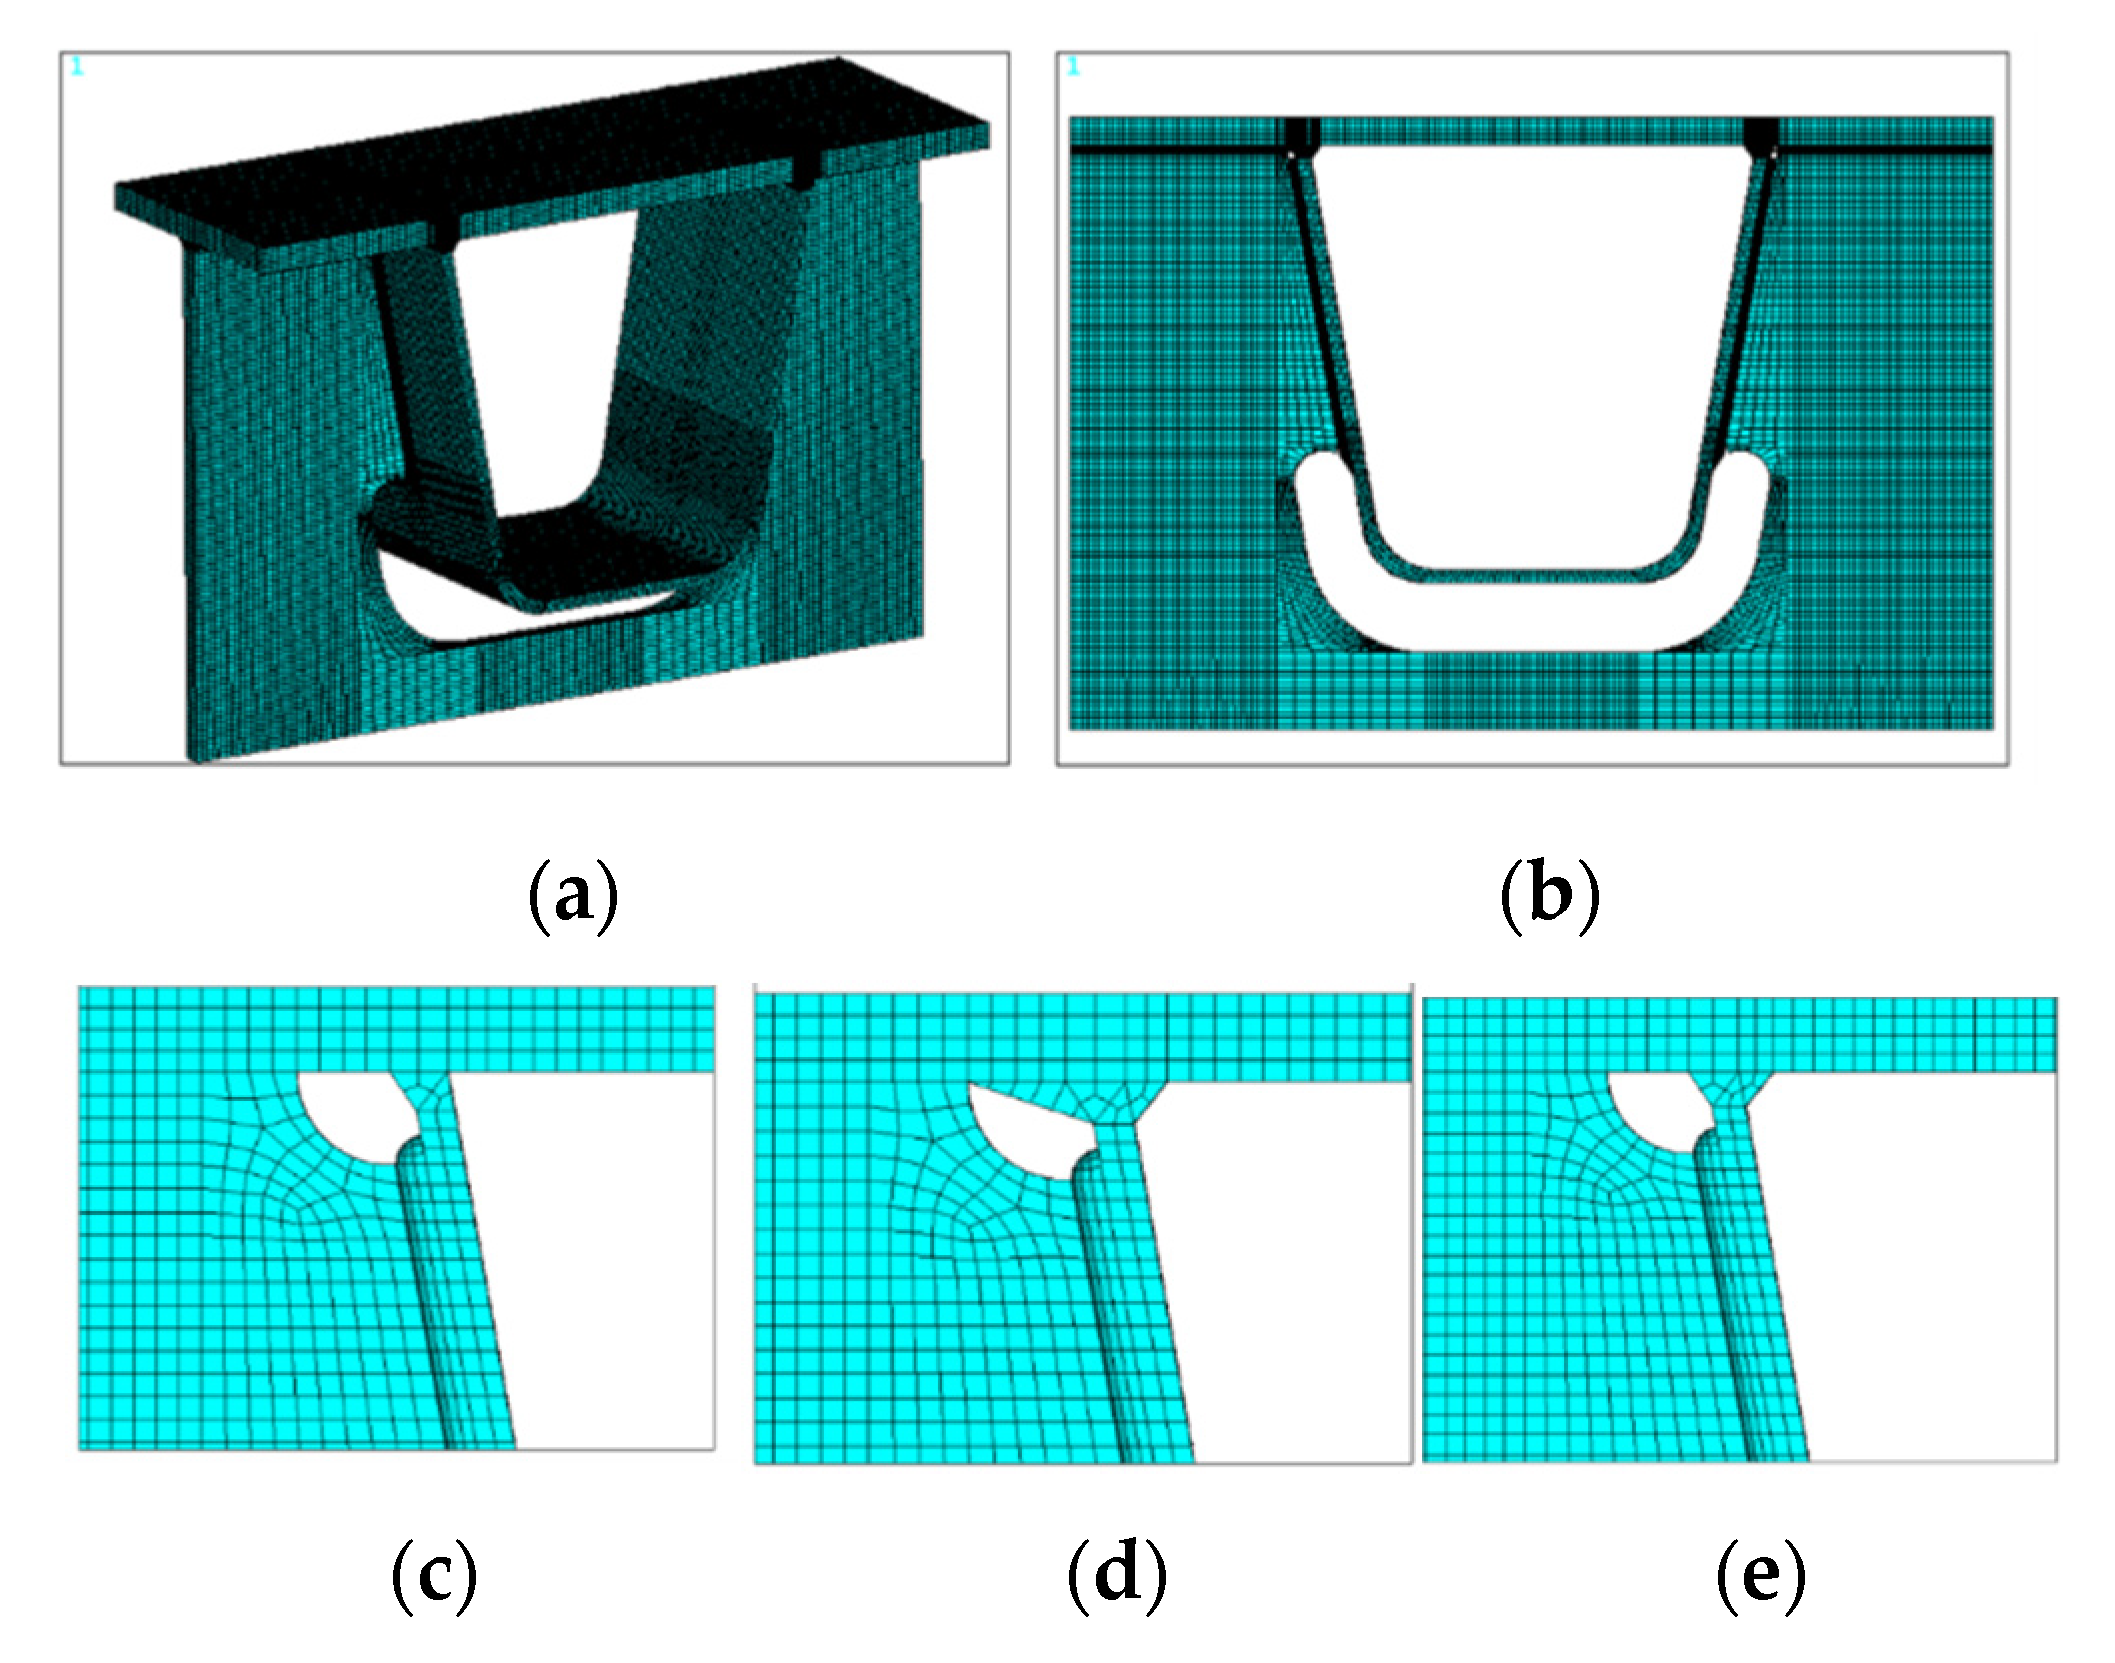
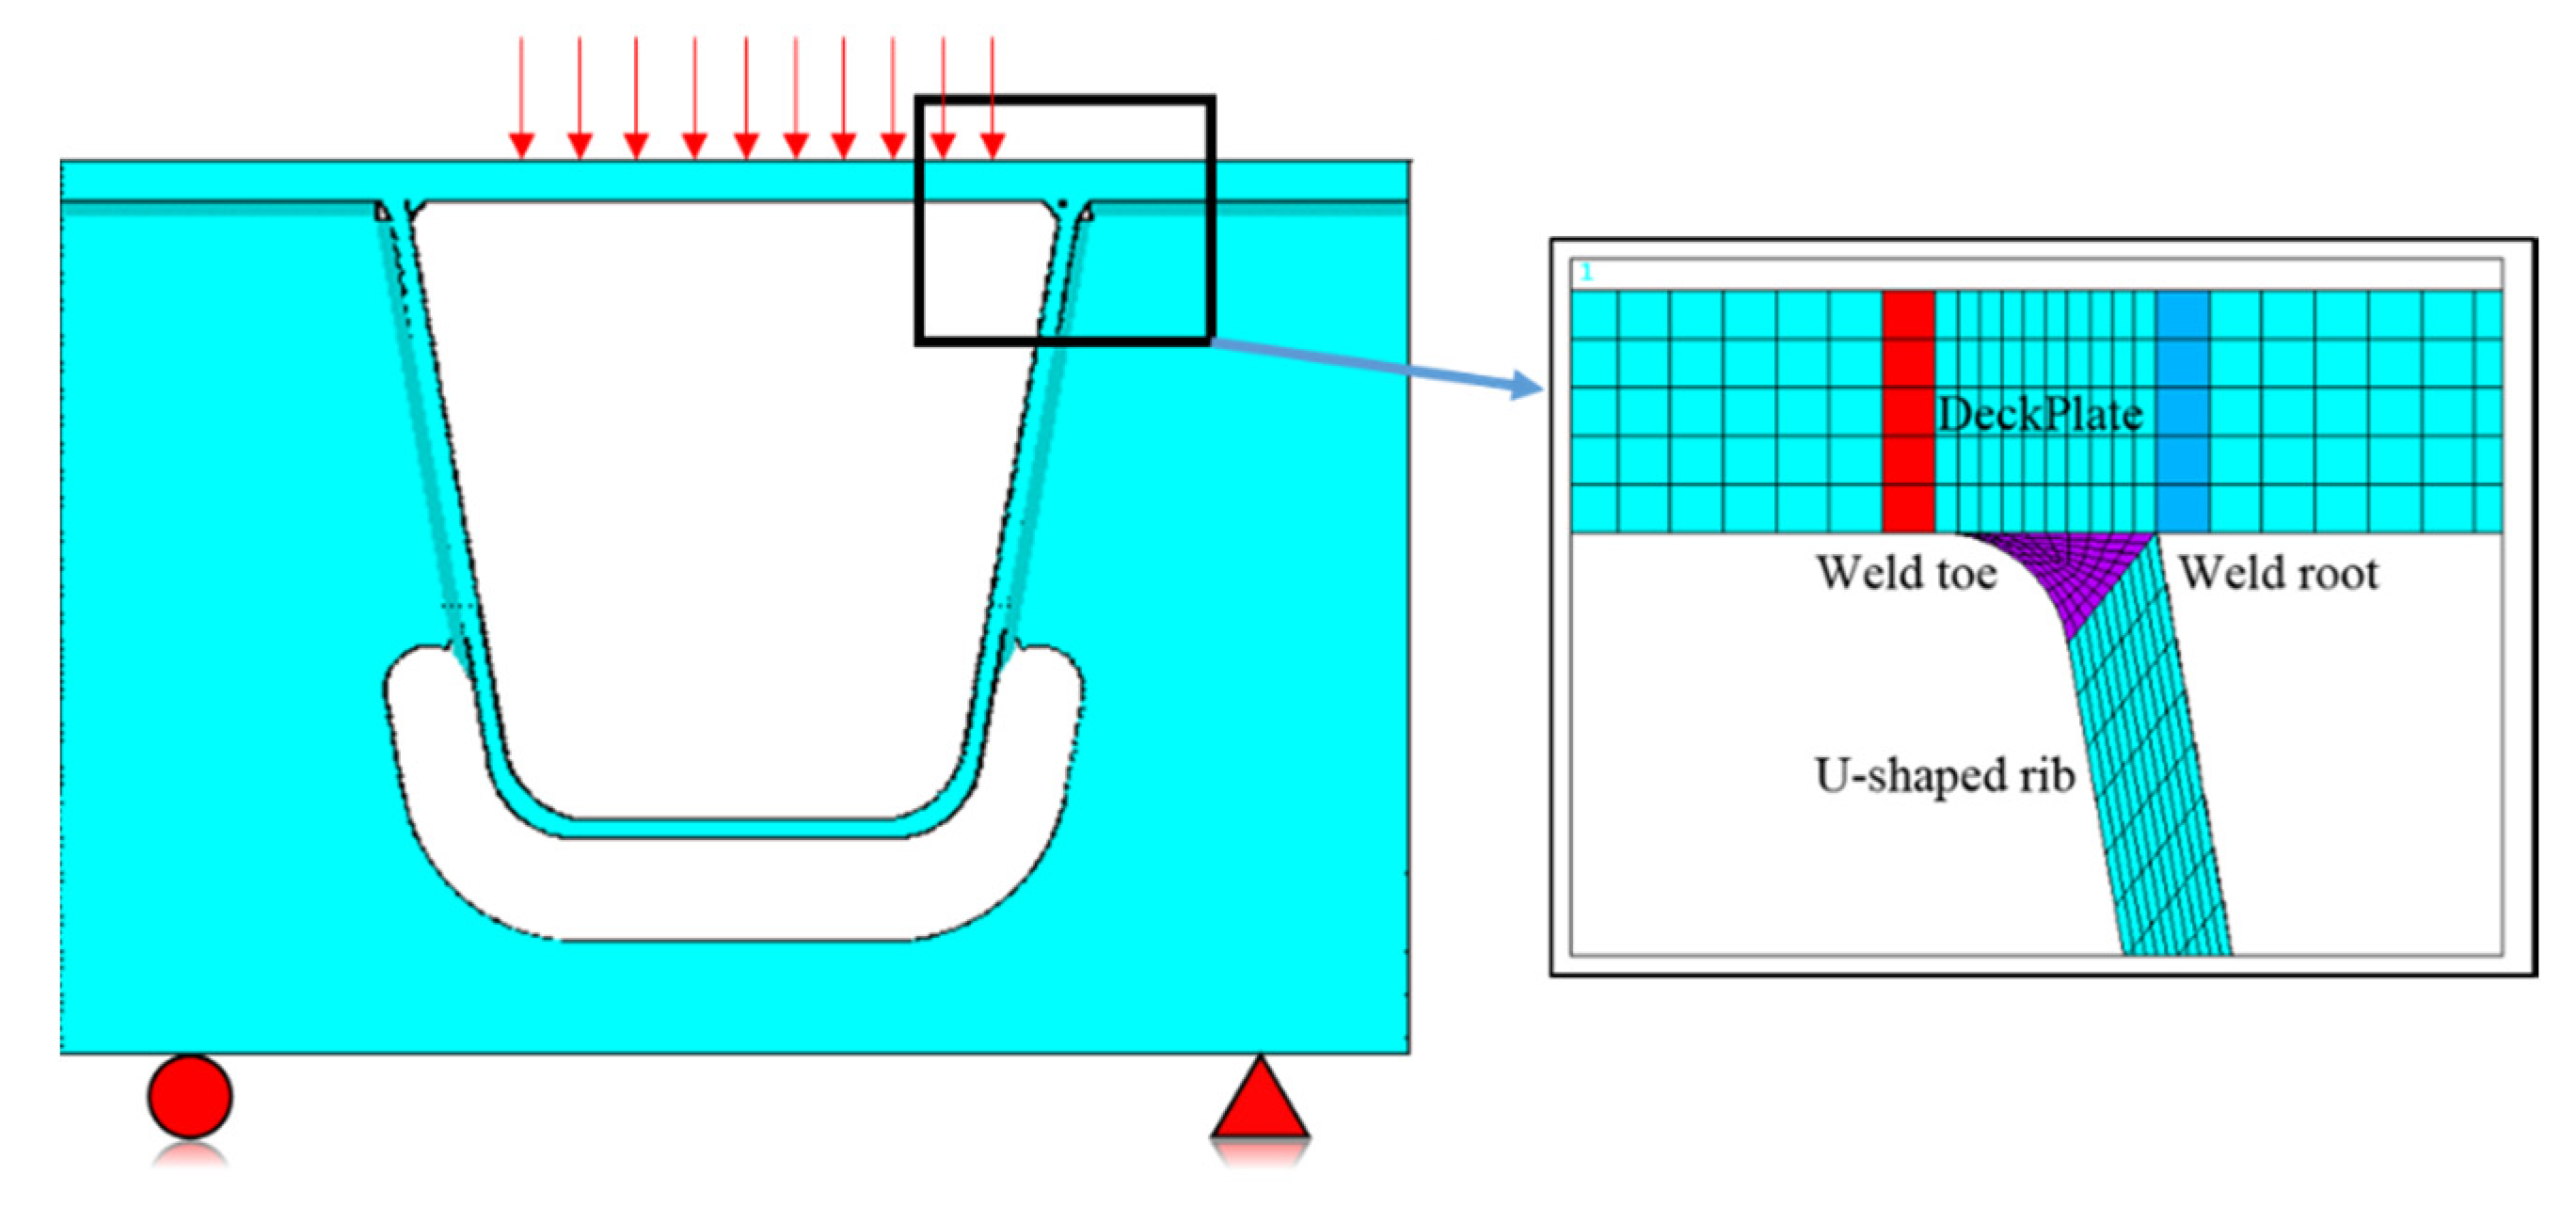
The finite element model of the local model was made of Q370qE steel, and the SOLID 185 element was used for higher accuracy, as shown in Figure 7. The stress ratio of the fatigue load was −1. The size of the hexahedron element was 6 mm and the groove seam of the connection between the U-rib and bridge deck was 2 mm. The element grid layer of the rib-to-deck along the direction of thickness was six and that of the rib-to-crossbeam along the thickness direction was three, which satisfy the recommendations of the traction structural stress method [17]. The view of the finite element model of the local connection between the bridge deck and U-rib are shown in Figure 7.
In order to simulate the actual loading condition and the vertical constraint from the box girder, the local finite model was simply supported at the bottom of both sides of the crossbeam. Based on the orthotropic steel bridge specification, Eurocode 3, the fatigue load was applied to the middle of the top side of the bridge deck.
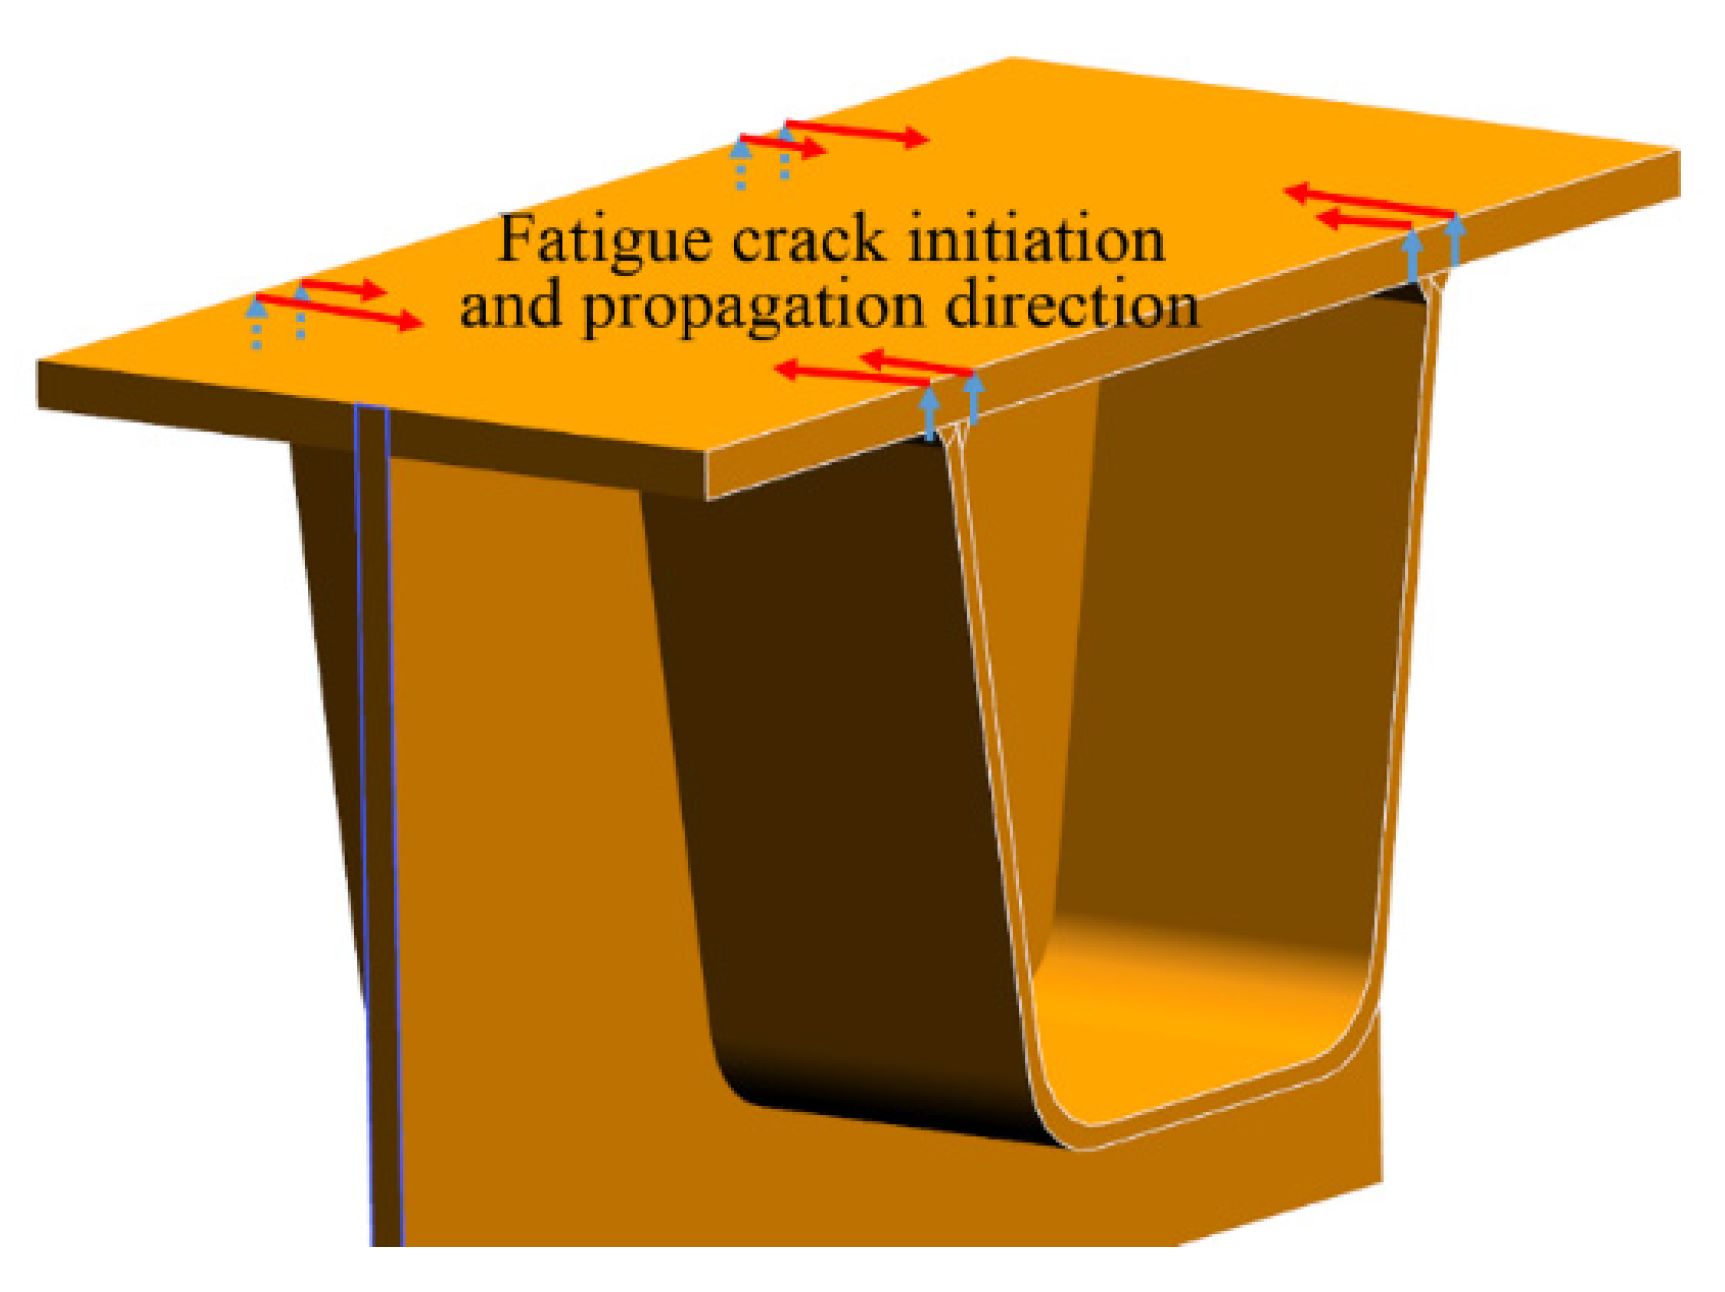
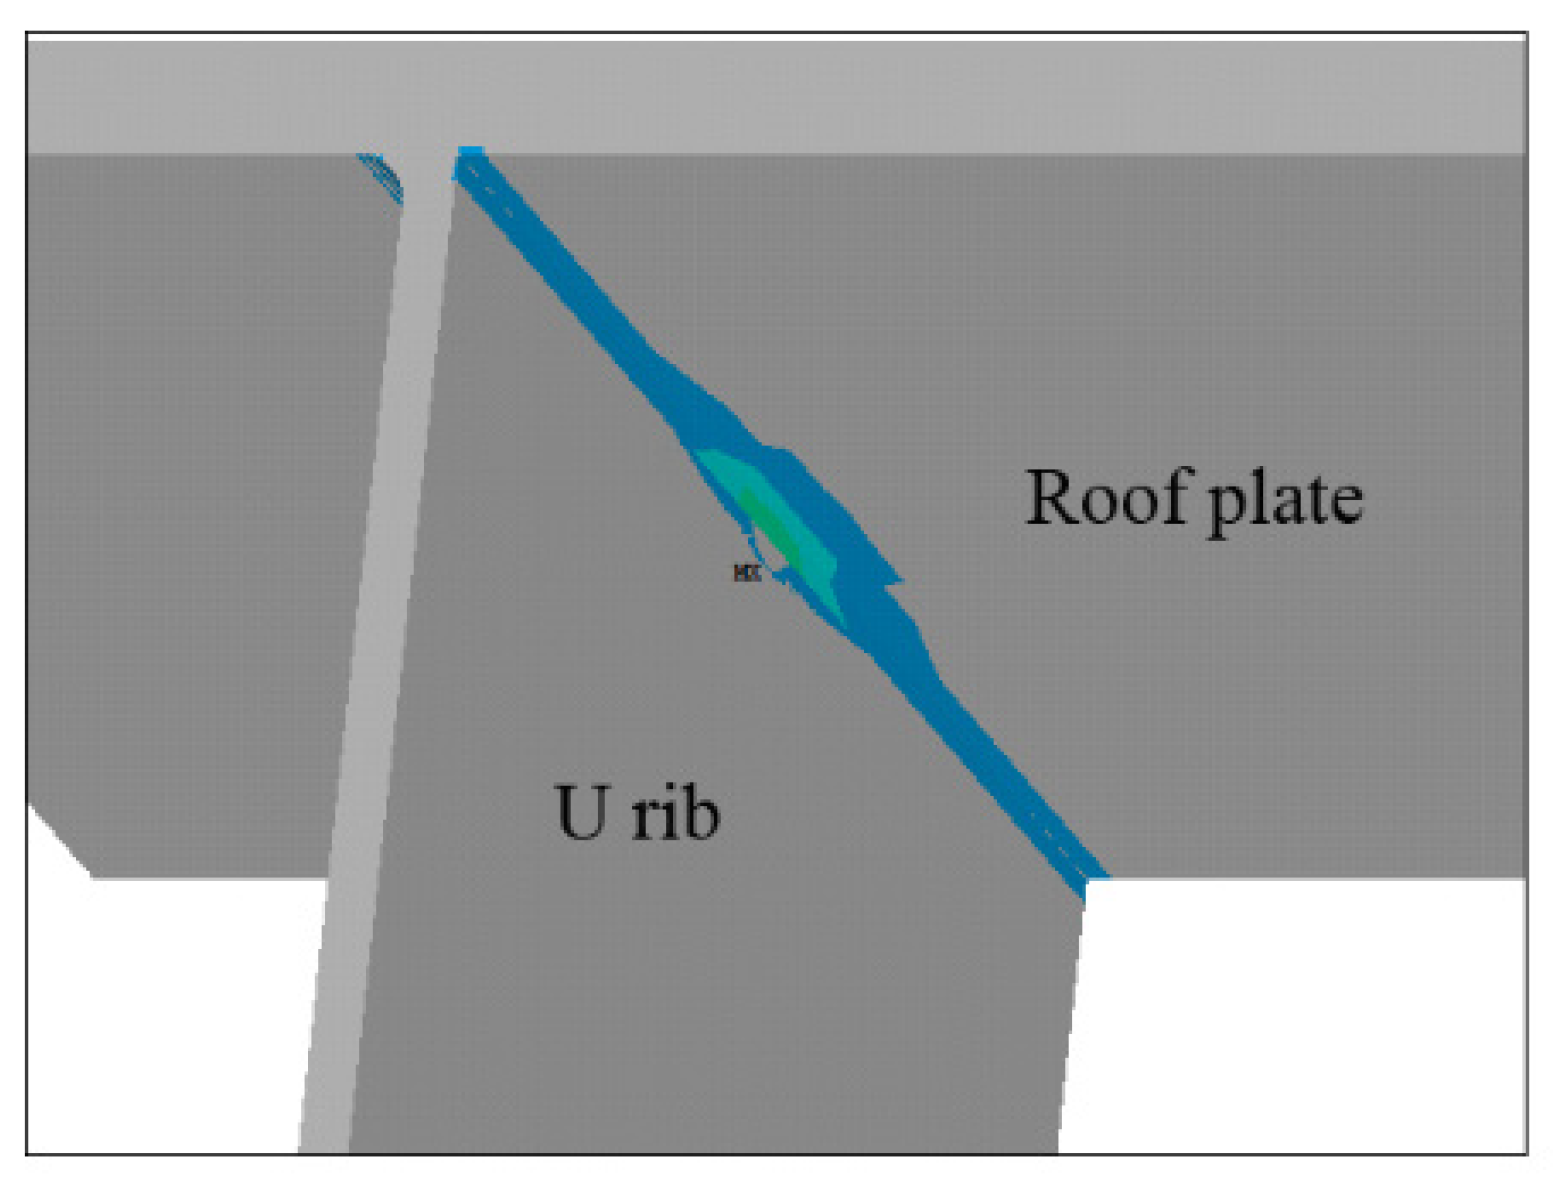
As mentioned above, fatigue cracks occurring at the connection of the bridge deck and U-rib account for 30.2% of all the observed cracks. In order to obtain the equivalent structural stress of the weld seam, the hypothetical fatigue crack initiation and propagation on the bridge deck were determined as shown in Figure 8. The fatigue crack was initiated in the weld toe or weld root and propagated to the base [20]. This crack continued to expand along the weld line until the specimen was failed. Figure 8 shows the hypothetical positions of fatigue crack initiation and the propagation direction on the bridge deck.

3.2. Comparative Results of Three Typical Connections and Discussions

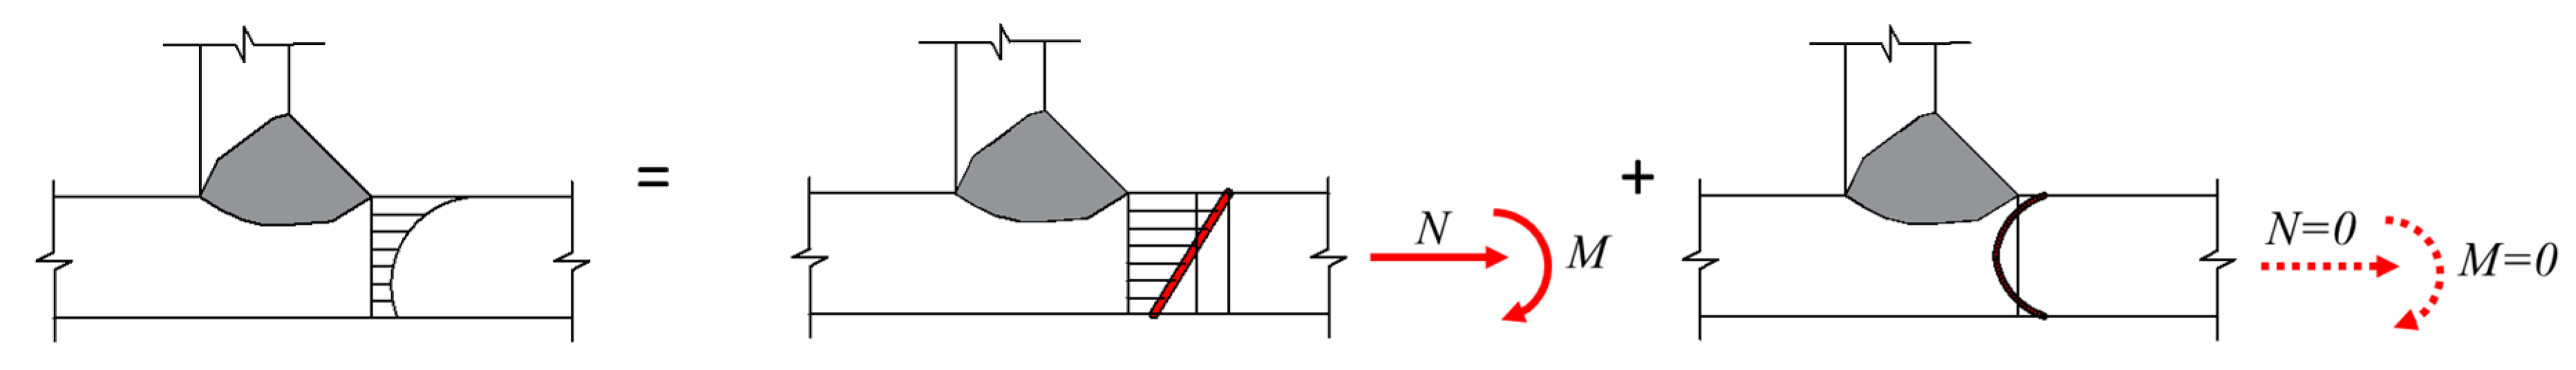
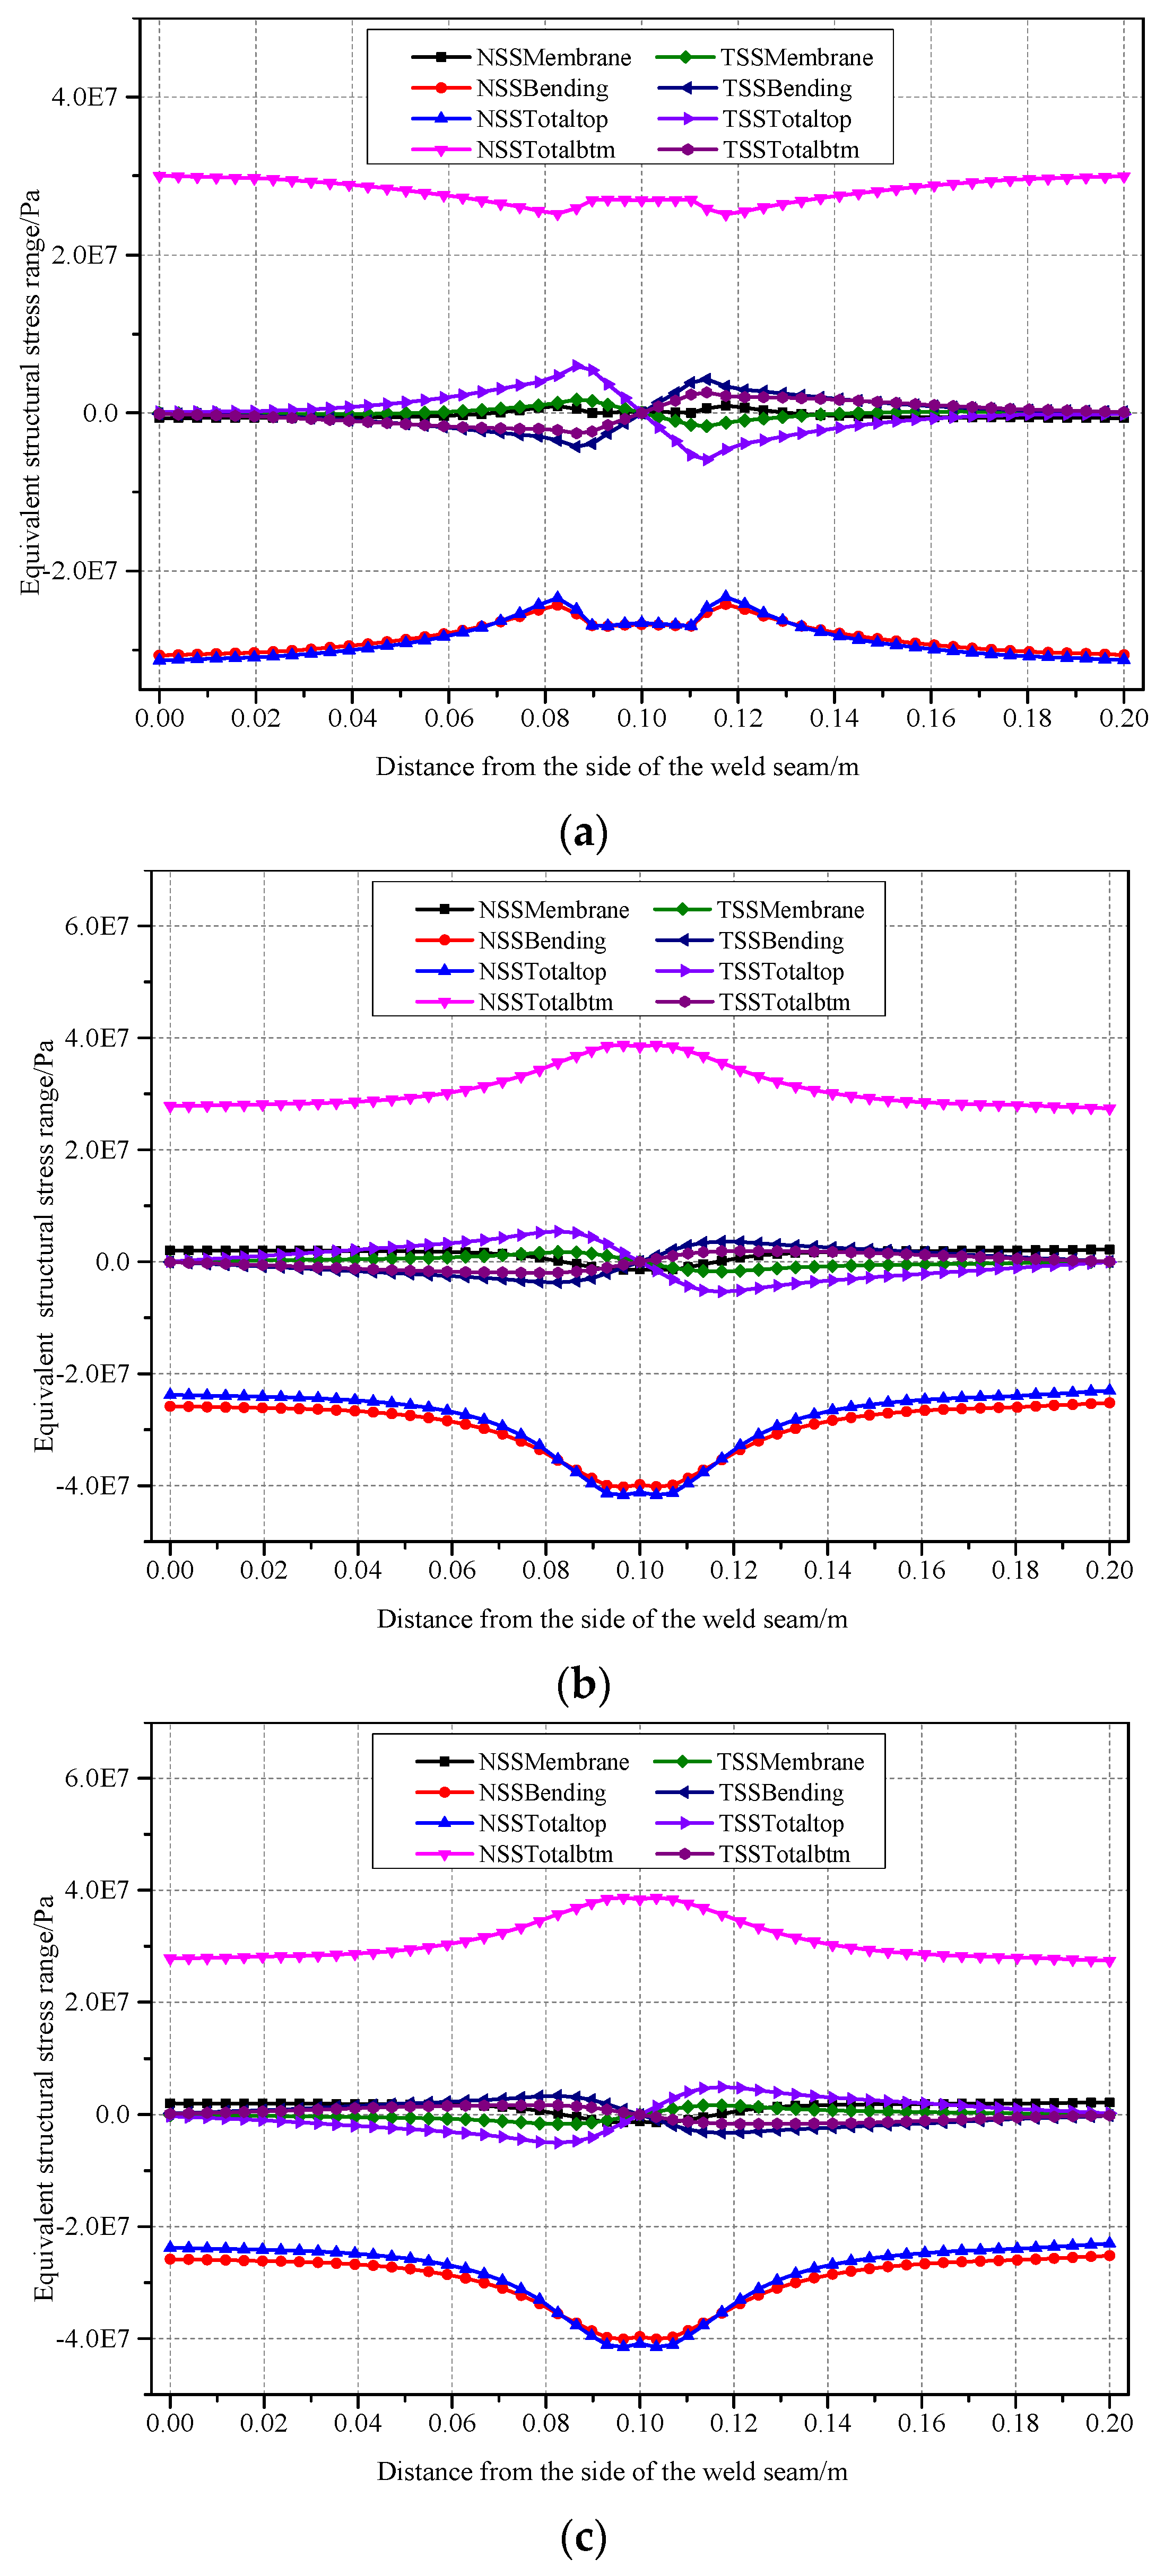
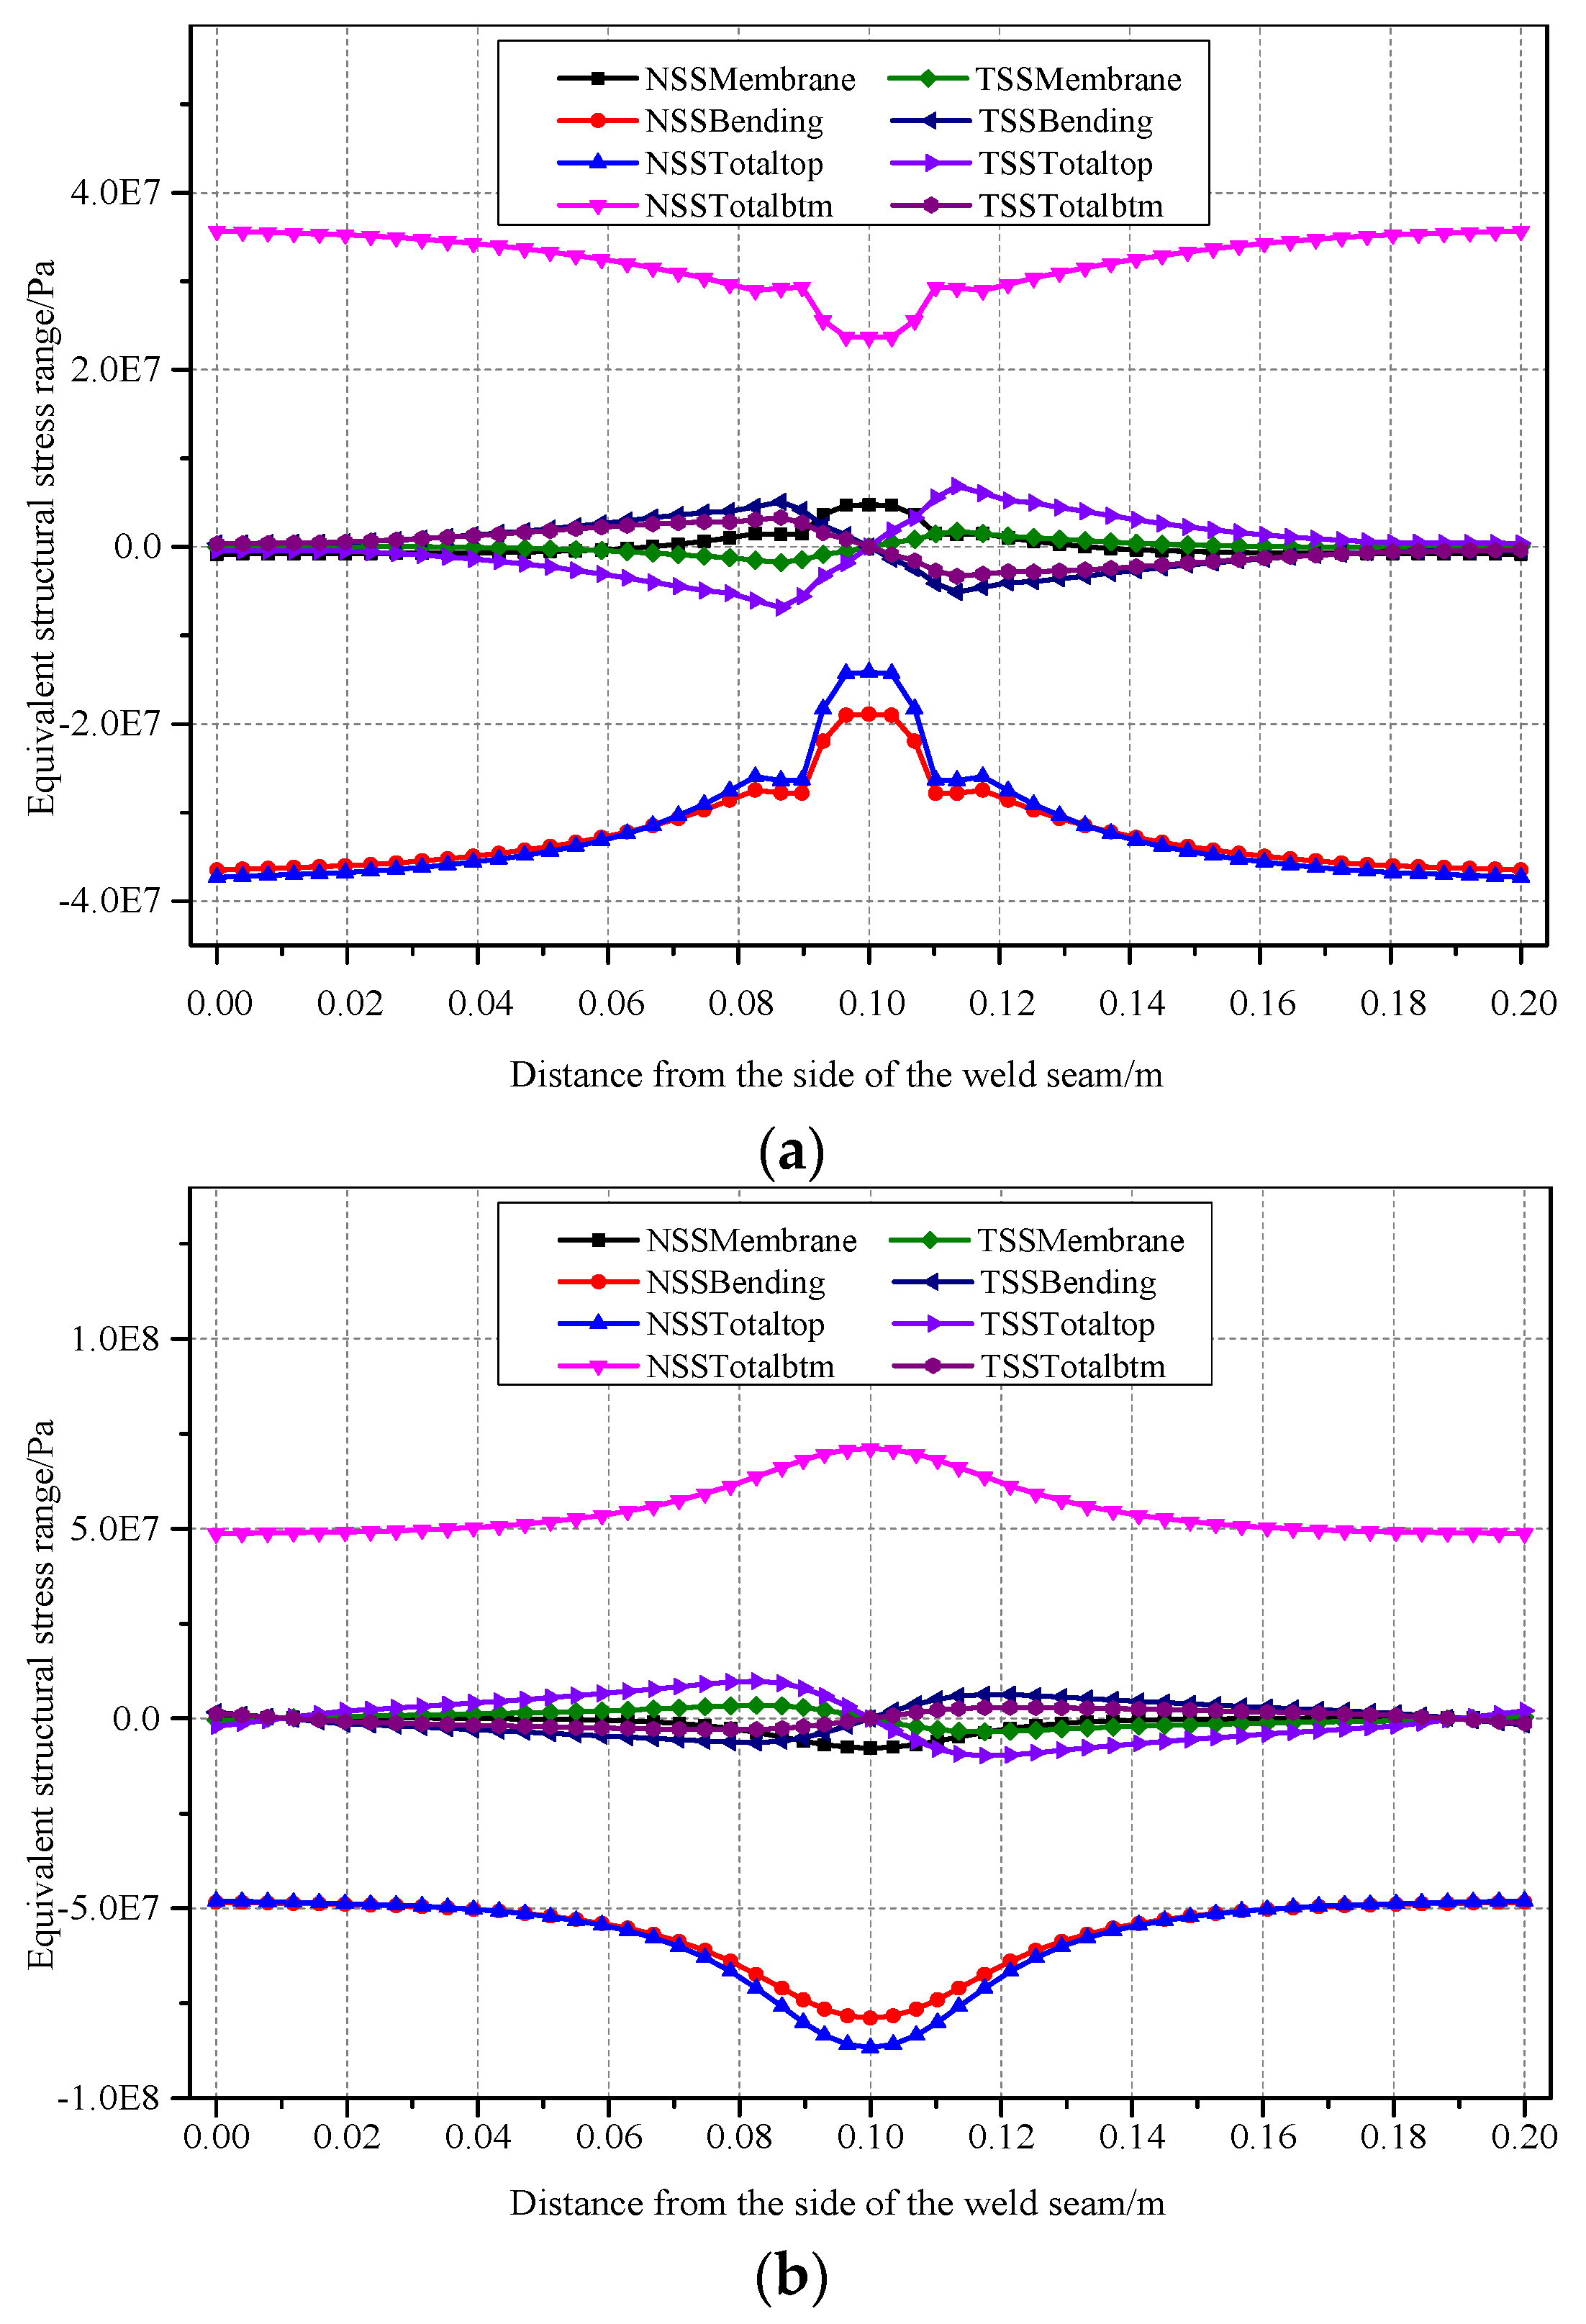
The Mises stress diagram of the connection of the bridge deck and U-rib under fatigue load was obtained with the finite element simulation method. The equivalent structural stress contained membrane stress and bending stress. The equivalent structural stress and the stress components of the bottom side of the bridge deck were obtained based on the traction structural stress method. The fatigue cyclic life was calculated using the master S-N curve and Equation (4). Furthermore, in the figure, the vertical axis represents the equivalent structural stress and the horizonal axis represents distance from the side of the weld toe or weld root. The NSS represents the normal structural stress and TSS represents the in-plane shear structural stress. “Membrane” stands for the membrane structural stress and “bending” represents the bending stress. “Total” means the sum of the membrane stress and bending stress. The equivalent structural stress of the bottom and the top side of the bridge deck were obtained similarly.
As shown in Figure 5, the left weld seam (Trad-Weldline1) is a traditional single-sided weld seam of the weld toe and bridge deck. The right weld seam (Trad-Weldline2) is a traditional single-sided weld seam of the weld root and bridge deck. 
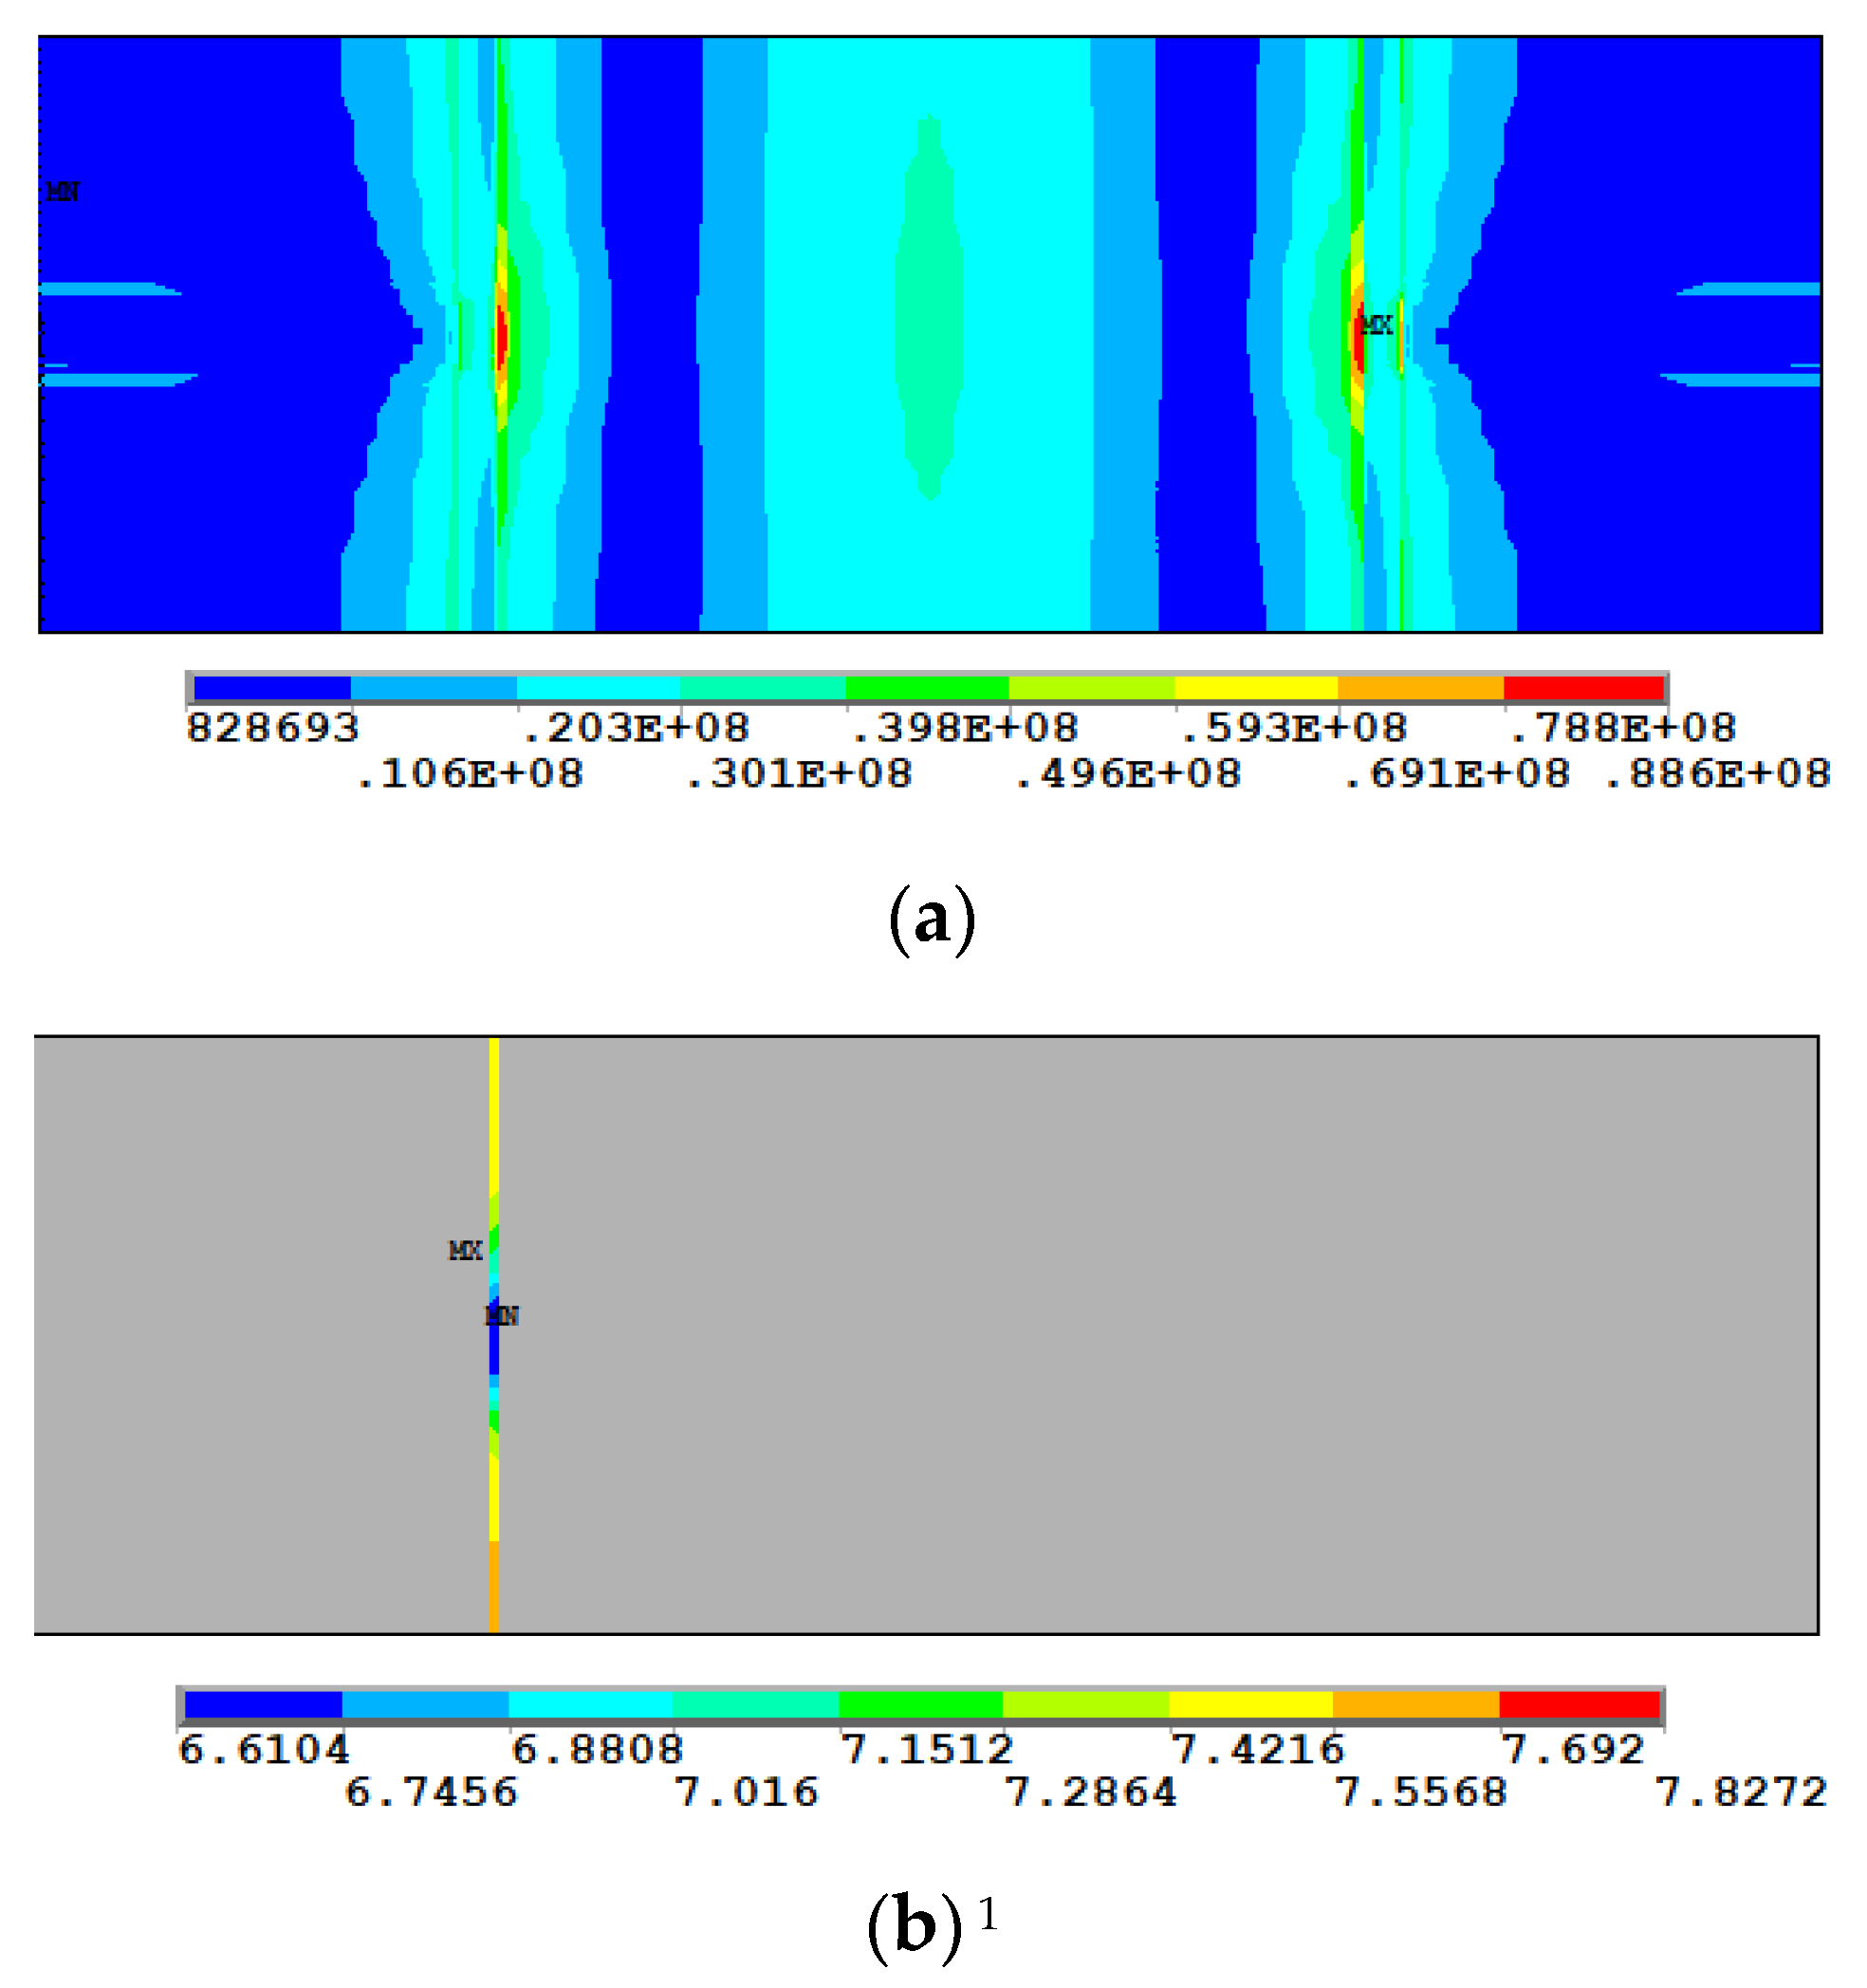
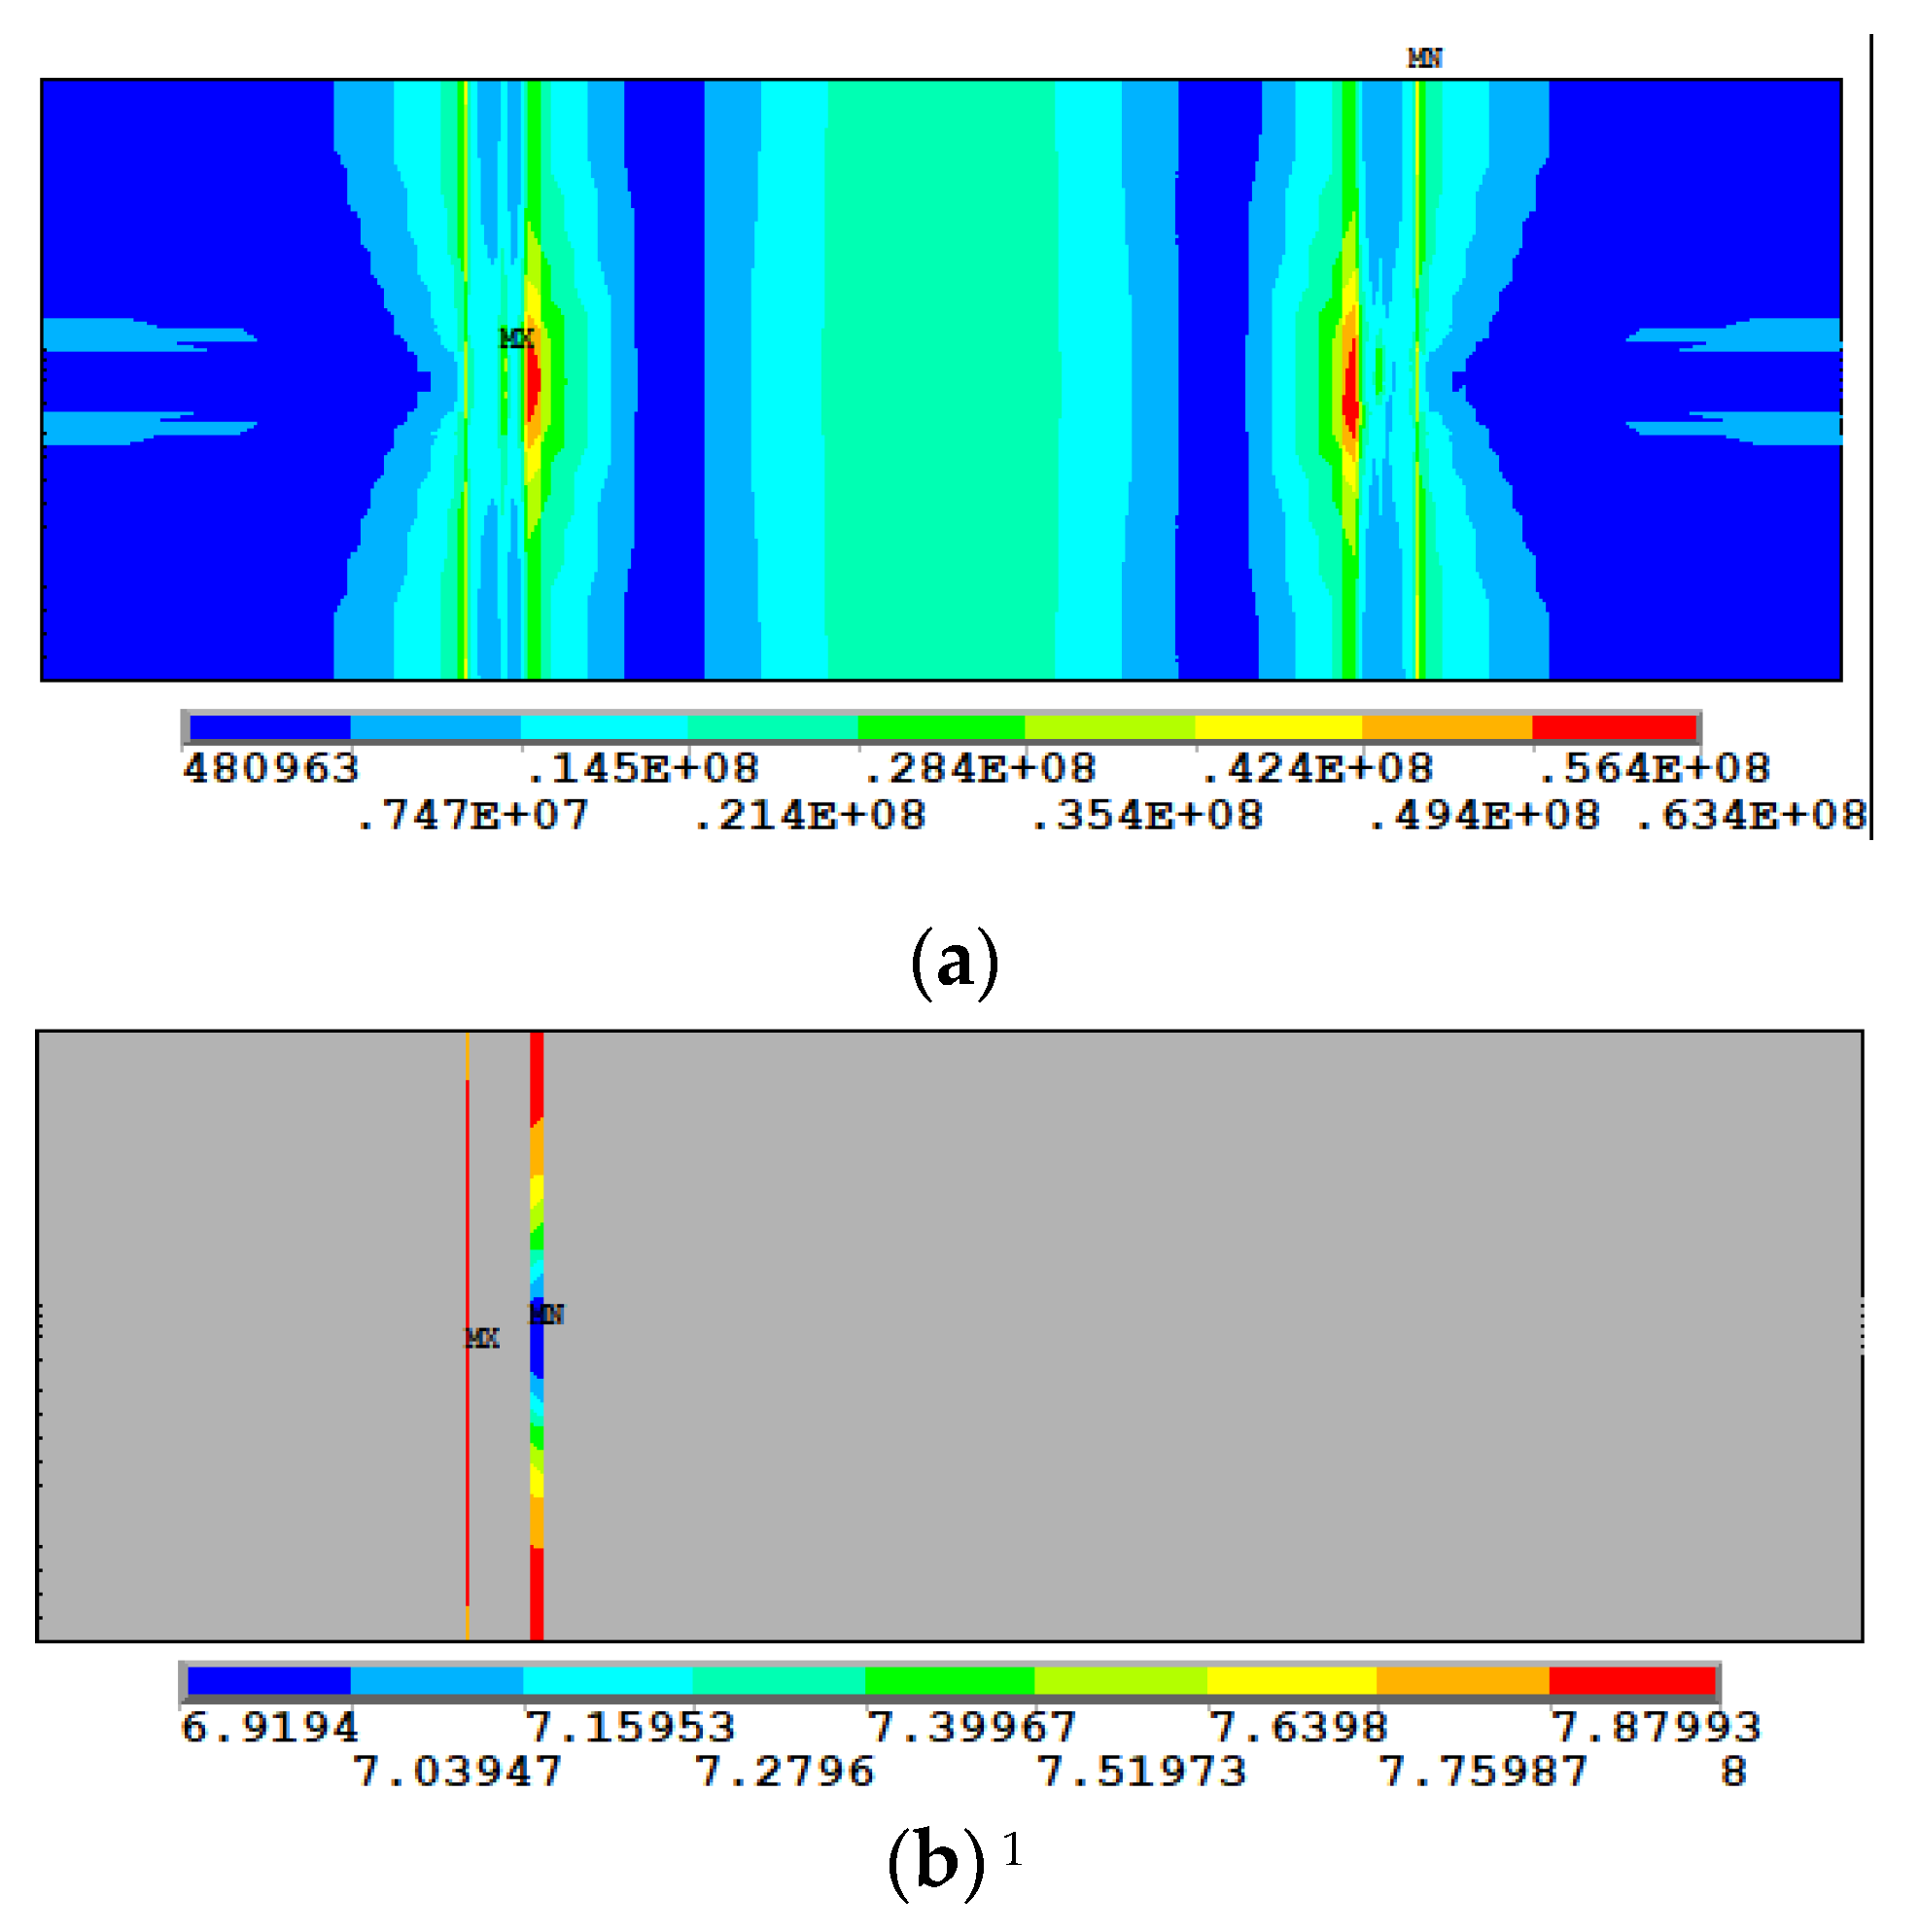
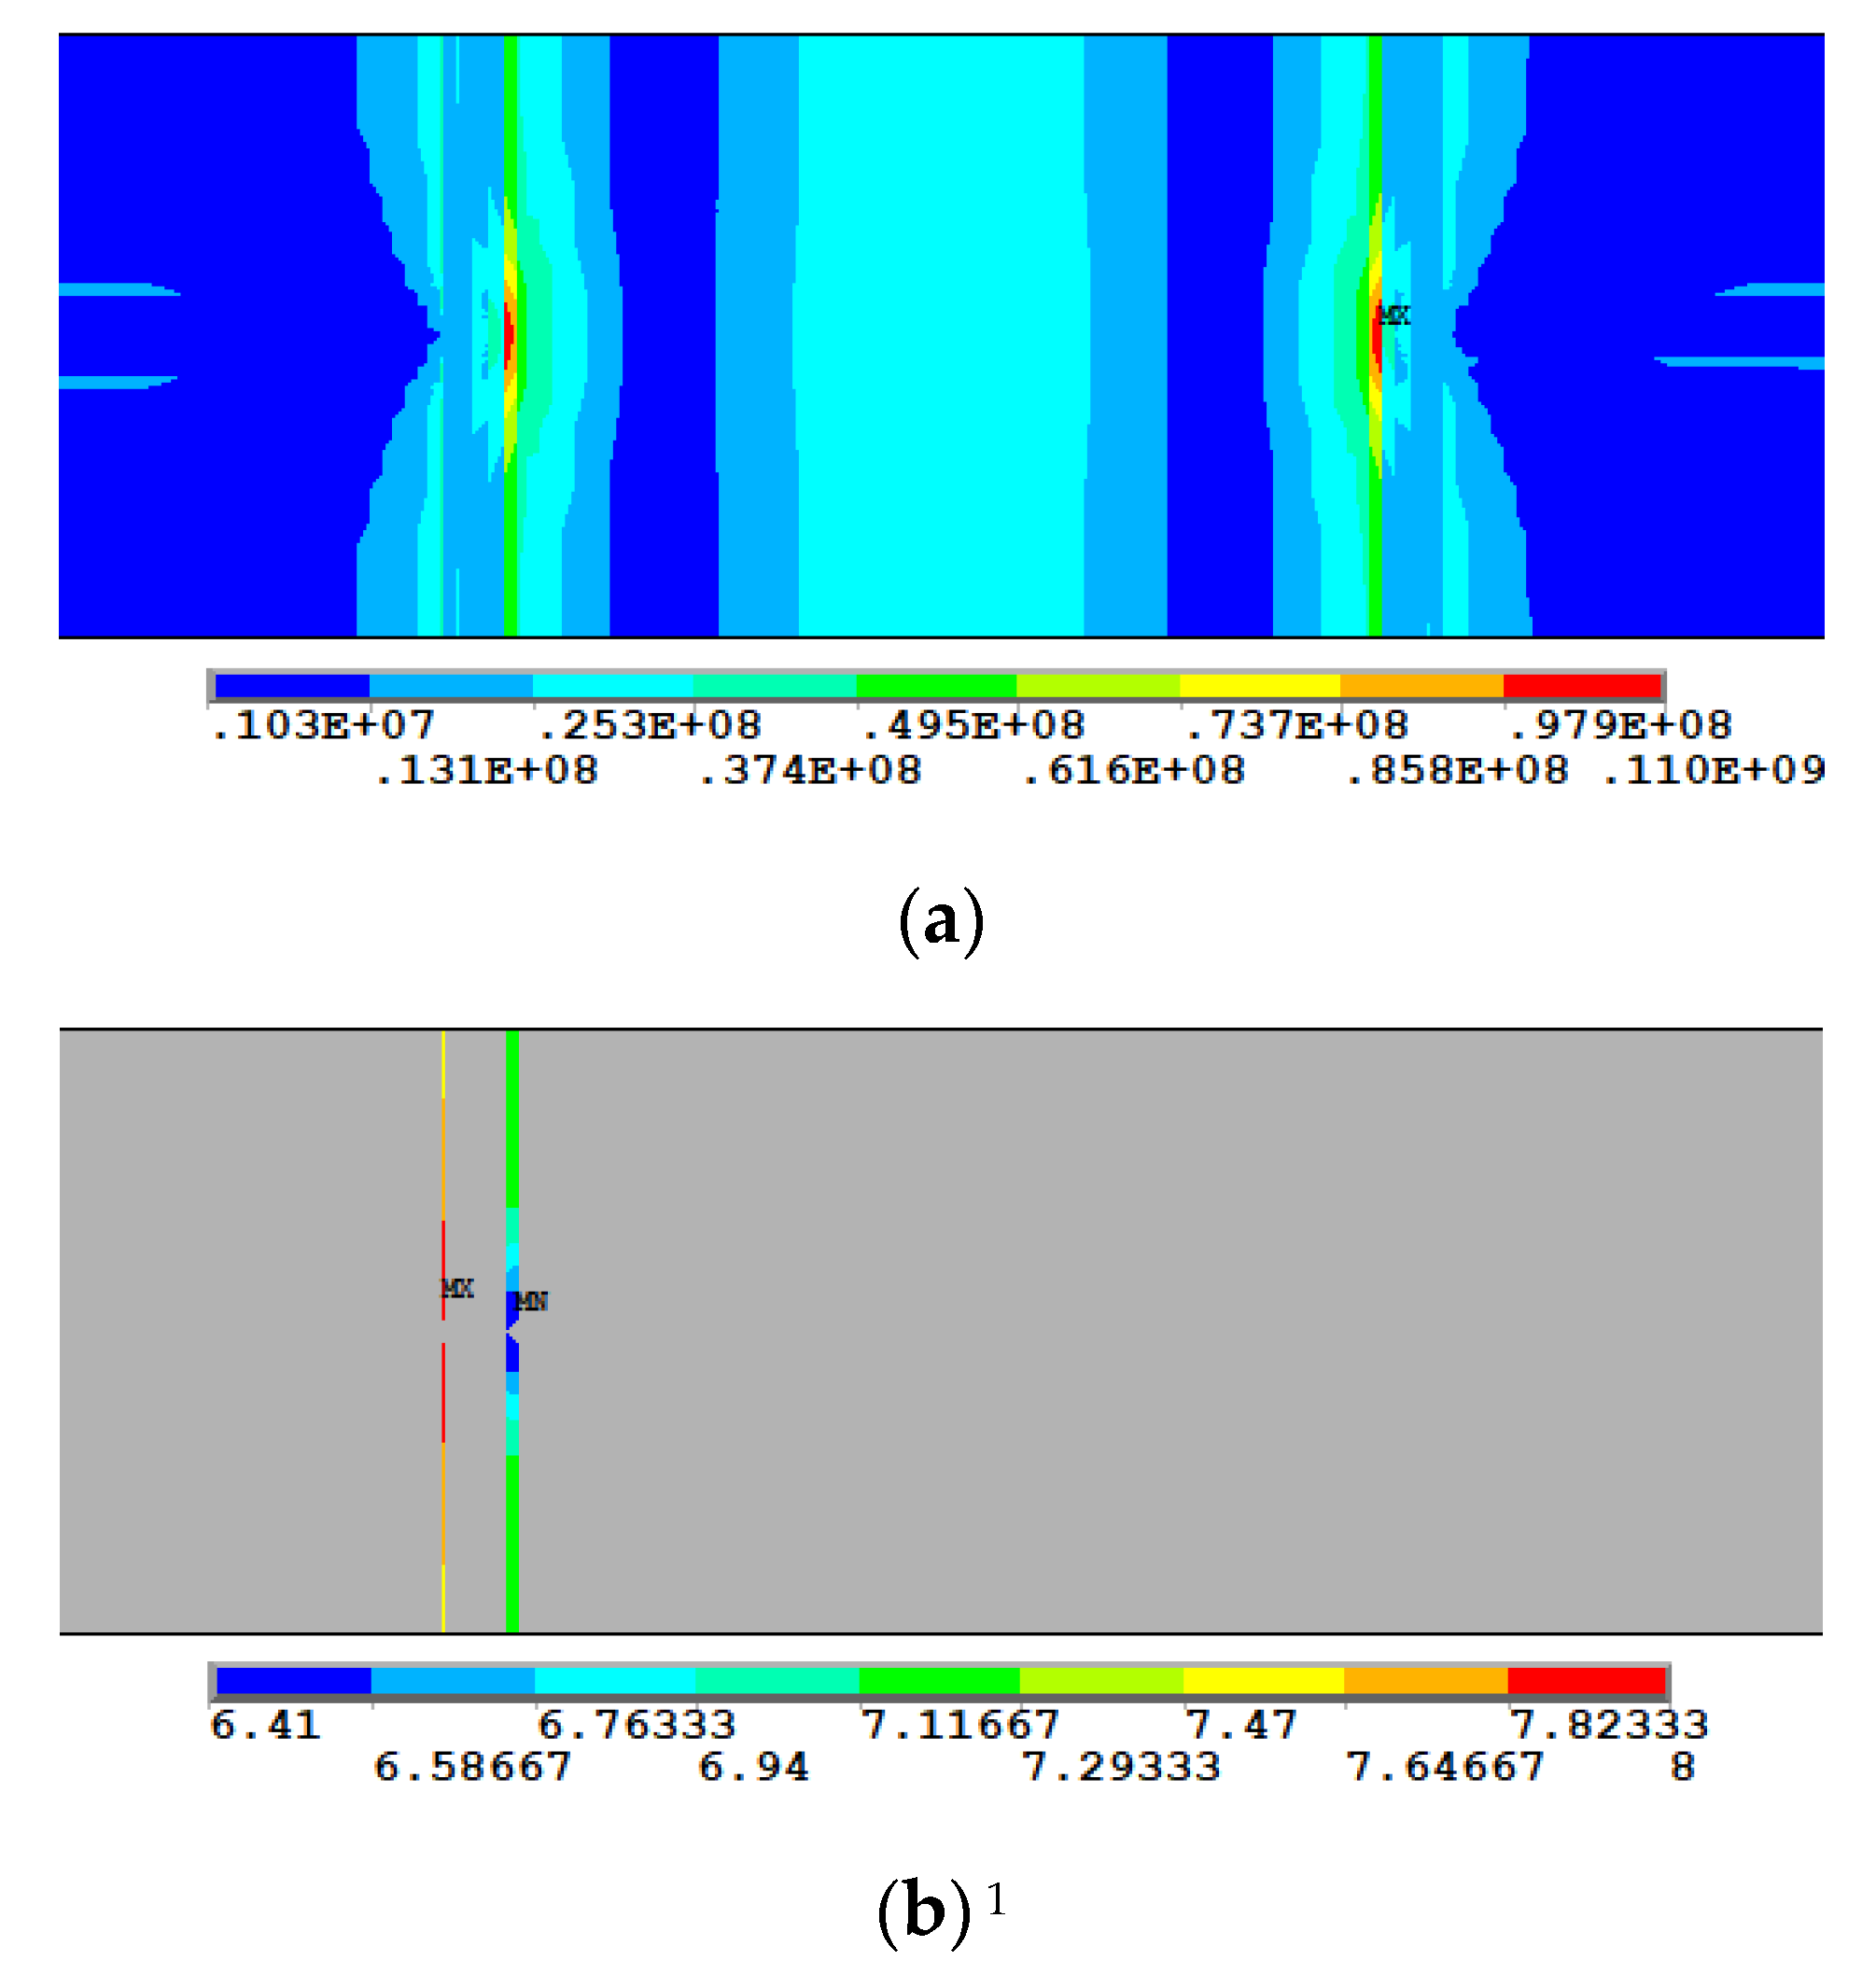
Figure 9 shows the Mises stress and fatigue cyclic life of the bottom side of the bridge deck of a traditional weld seam. It can be seen clearly that the maximum stress of the conventional single-sided weld seam occurred in the middle of the conventional weld seam between the bottom of the bridge deck and the groove weld seam.
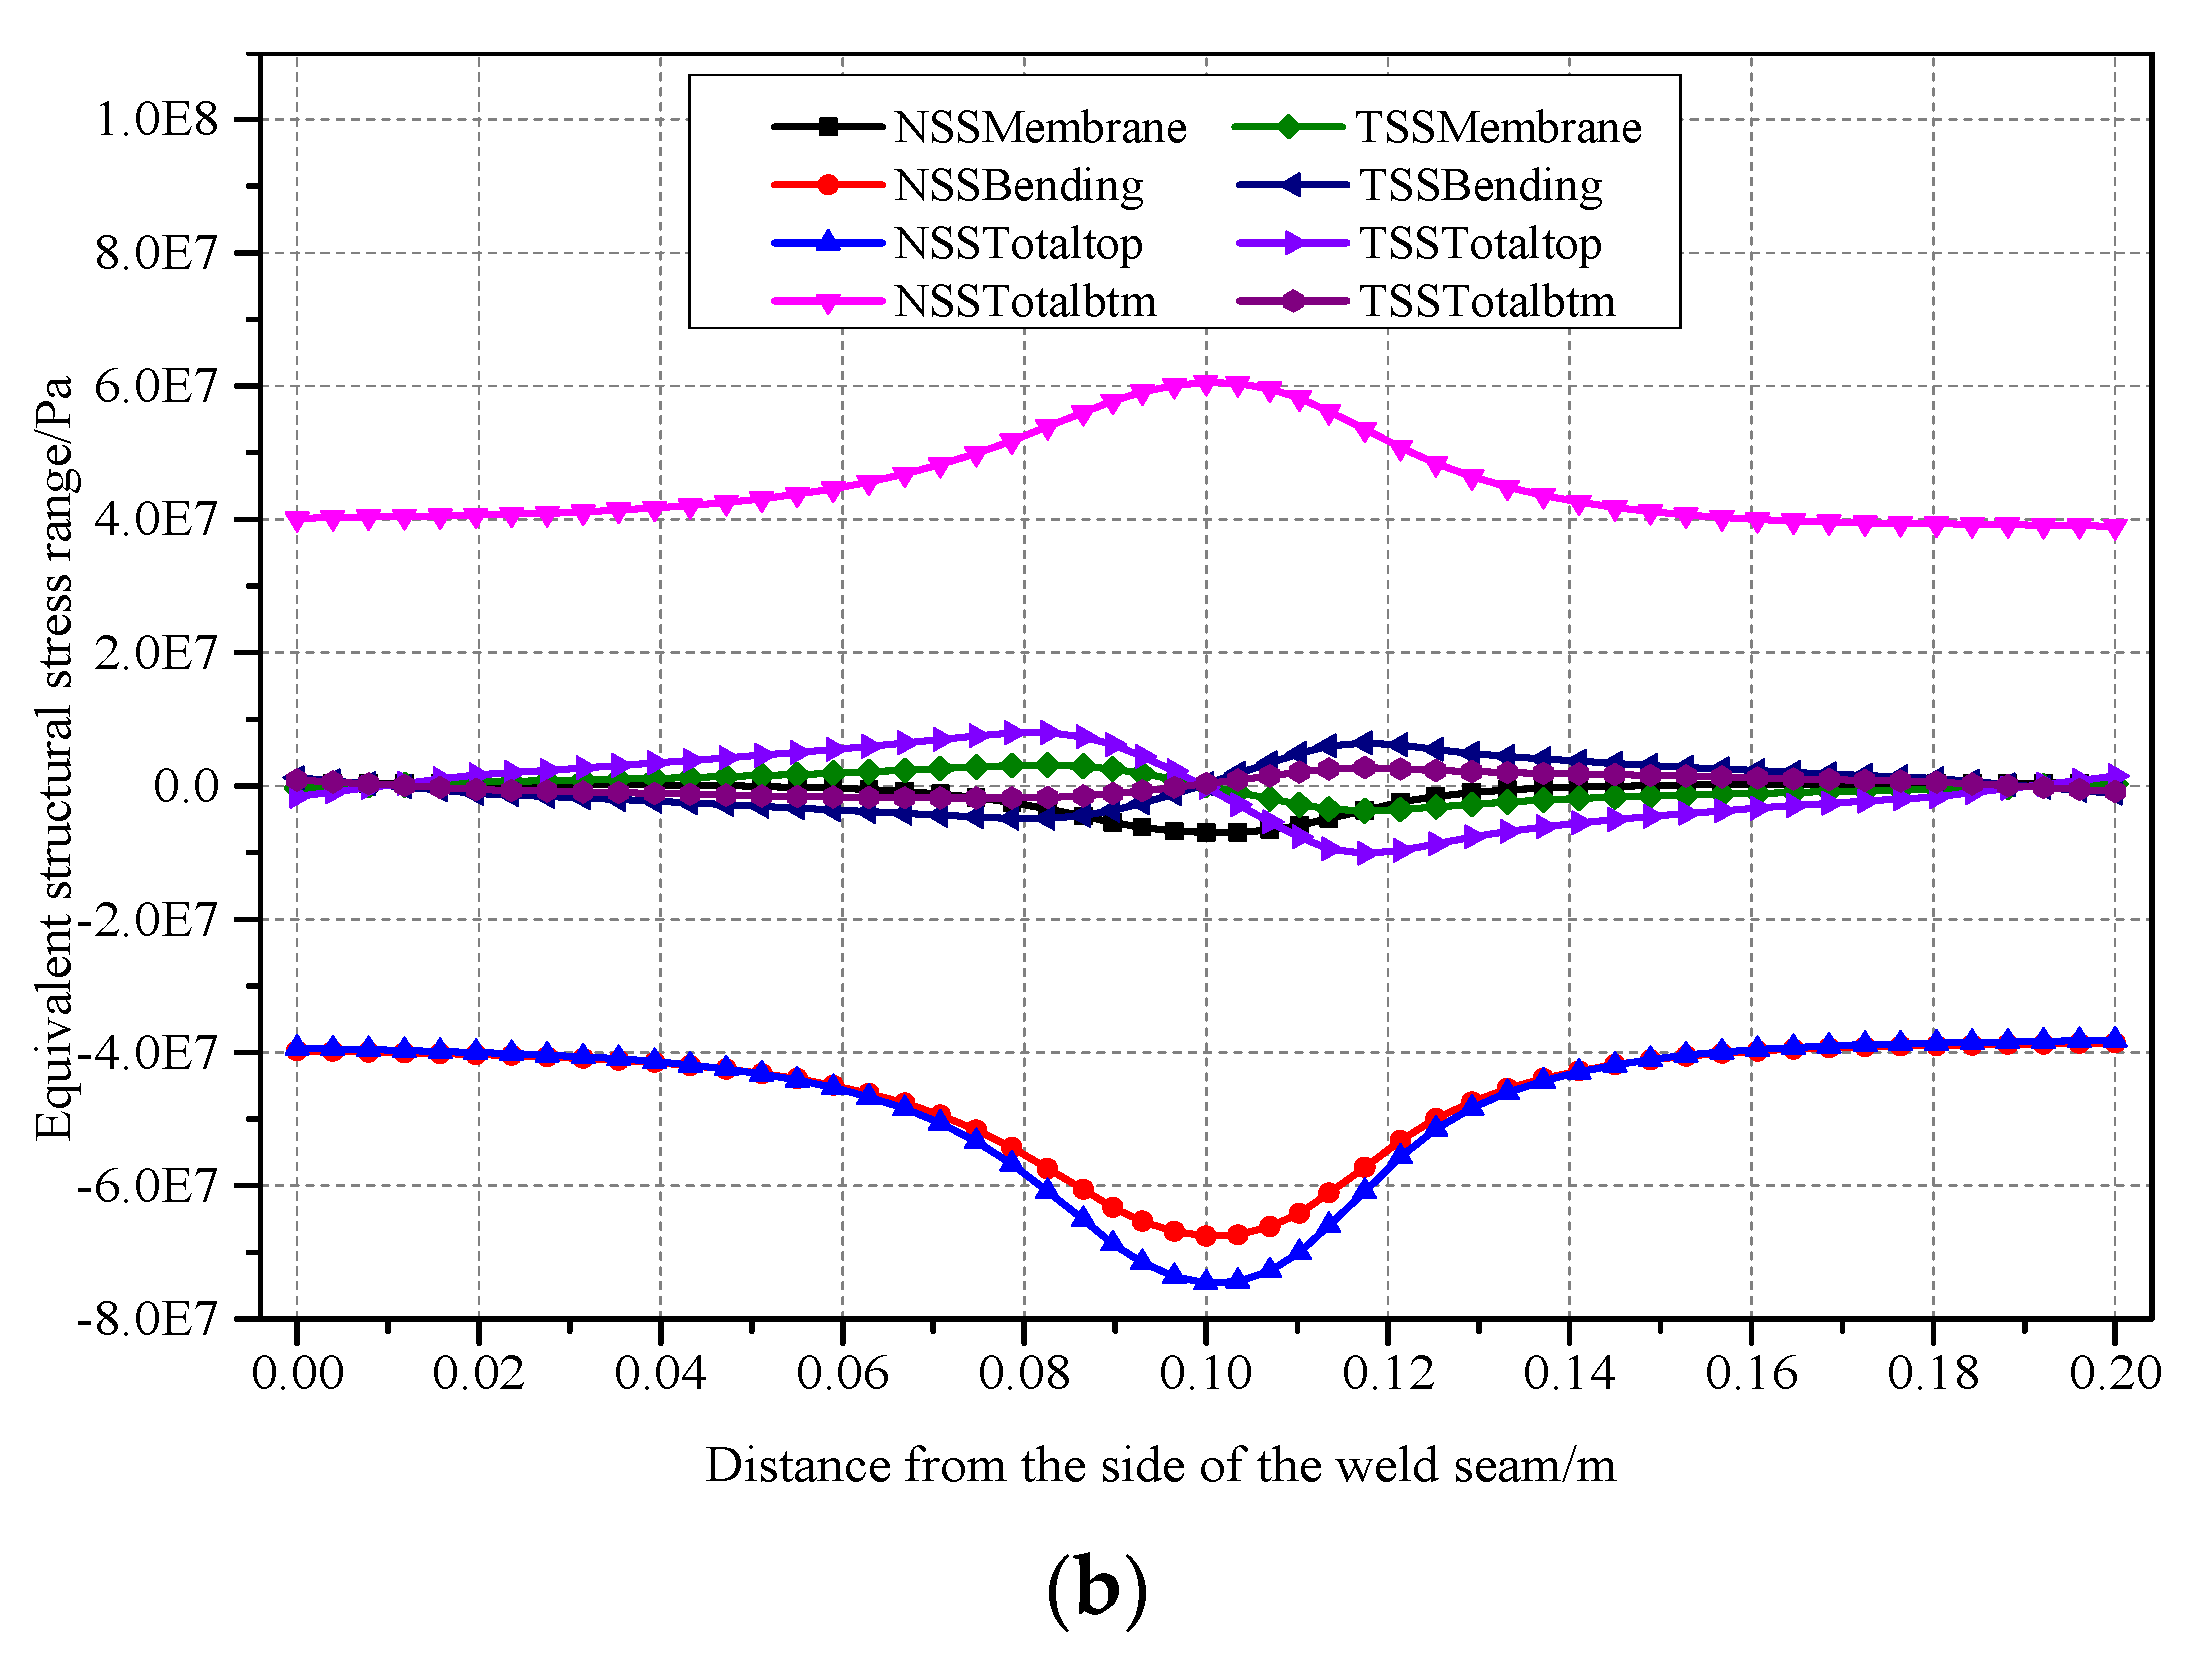
The equivalent structural stress and the stress components of the Trad-Weldline1 and Trad-Weldline2 are plotted in Figure 10. The comparative results indicate that the structural stress changed sharply at the location of the rib-to-deck connection and the crossbeam. The bottom of the two weld seams were subjected to the normal tensile stress and the top of weld seams were subjected to the normal compressive stress. The major component of the equivalent structural stress was bending stress with little in-plane shear stress. The maximum tensile stress of Trad-Weldline1 was 39 MPa and that of Trad-Weldline2 was 62 MPa. The equivalent structural stress increased slowly from the side of the weld seam to the middle of the seam. The total structural stress in the middle of the bottom surface of the bridge deck was the most significant with the lowest fatigue cyclic life. As can be seen from the figure, the location of the minimum fatigue life corresponded to the middle of the connection between the weld seam and the bridge deck. The location was regarded as the location of initiation of the fatigue crack and the crack propagated along the weld seam.
Figure 11 plots the Mises stress and fatigue cyclic life of the bottom side of the bridge deck of the weld seam of a large root. As shown in the figure, the left weld seam (Large-Weldline1) is the weld seam of the large root of the weld toe and bridge deck and the right weld seam (Large-Weldline2) is the weld seam of the large root of the weld root and bridge deck. Compared to the distribution contours of the traditional weld seam (Figure 5), the distribution trend of the Mises stress contours and fatigue cyclic life were similar. Moreover, the location of the maximum stress was the same as in the traditional weld seam.
Figure 12 shows the equivalent structural stress of the weld toe for Large-Weldline1 and Large-Weldline2. The equivalent structural stress of Large-Weldline1 and Large-Weldline2 indicate that the top side of the bridge deck was mainly subjected to the normal compressive stress and the bottom of the bridge deck was subjected to the normal tensile stress. The bending structural stress was more significant than the in-plane shear structural stress. The normal tensile stress and compressive stress of Large-Weldline1 decreased from the side of the weld seam and the stress of the side was more significant than the stress of the middle of the weld seam. The trend of structural stress of the Large-Weldline2 was similar to the trend of the Trad-Weldline2. Compared to the structural stress of Large-Weldline2, the maximum bending stress of the Trad-Weldline2 increased by 16.4%. The normal compressive stress increased by 14.9% and the normal tensile stress increased by 16.7%.
The comparative results showed that the equivalent structural stress of the bridge deck with the weld seam of a large root was much more significant than that of the bridge deck with a traditional weld seam. The fatigue performance of the bridge deck with a traditional weld seam was better than that of the bridge deck with the weld seam of a large root. Therefore, it is not recommended to apply the weld seam of a large root with relatively larger seam area. Furthermore, the weld seam size should be controlled crucially for better fatigue resistance.
Four types of the weld lines of the double-sided weld seams of the bridge deck were considered. The weld seam called Double-Weldline1 is the weld seam of the outer weld toe and bridge deck. The weld seam called Double-Weldline2 is the weld seam of the weld root and bridge deck. The weld seam called Double-Weldline3 is the weld seam of the inner weld root and bridge deck. The weld seam called Double-Weldline4 is the weld seam of the inner weld toe and the bridge deck.
Compared to the bridge deck with the traditional weld seam and the weld seam of the large root, the location of the maximum Mises stress (Figure 13) and the lowest fatigue cyclic life in the bottom of the bridge deck was shifted from the weld root of the outer weld seam to the weld toe of the inner weld seam. In addition, the location of the minimum cyclic life was shifted to the weld toe of the inner weld seam instead.
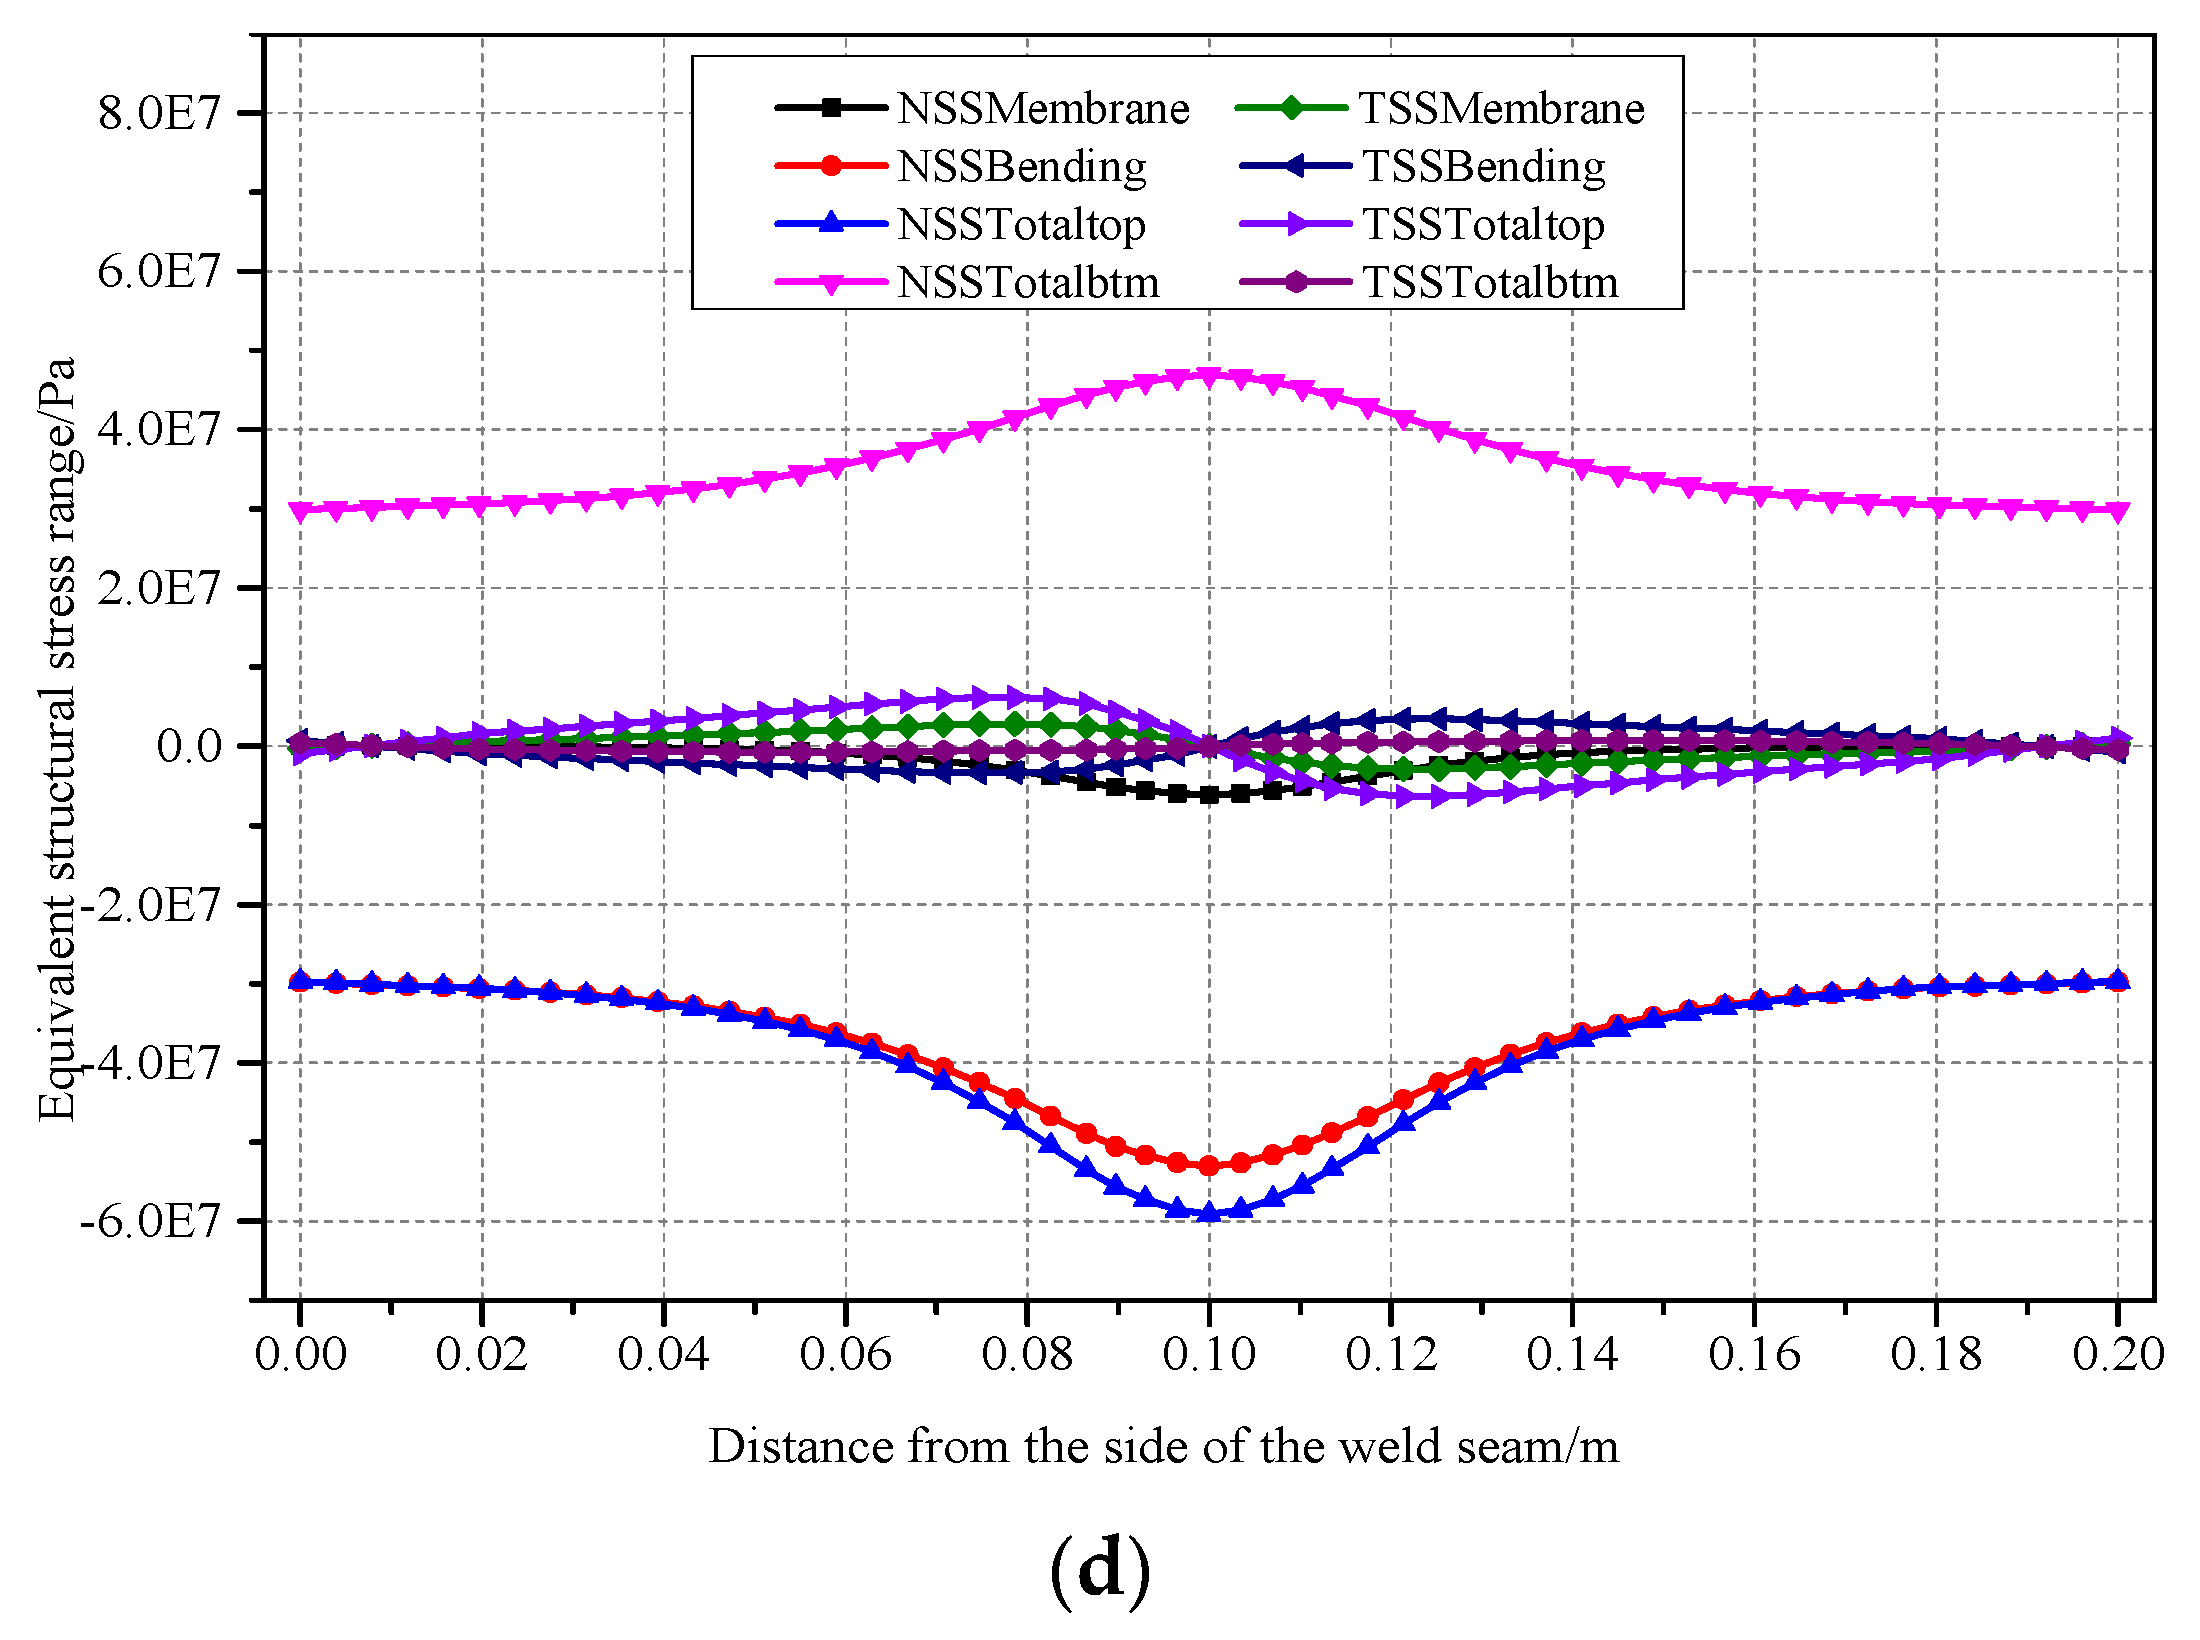
Figure 14 shows the equivalent structural stress for the four weld lines from Double-Weldline1 to Double-Weldline4. The stress trends of Double-Weldline1 to Double-Weldline4 were similar to the other weld seams. The bottom of the bridge deck was mainly subjected to normal tensile stress with little normal shear stress. The normal stress was mostly tensile stress with significant structural stress value.
Comparison of the in-plane shear structural stress showed that the effect of the shear structural stress could be ignored when considering the fatigue behavior of the connection of the rib-to-deck.
The maximum normal stress at both ends of the Double-Weldline1 was 30 MPa. The normal stress gradually decreased from the end to the middle of the weld seam and the minimum normal stress in the middle section was 25.21 MPa. However, the structural stress increased in the reverse direction in the connection between the weld toe and crossbeam when compared to the traditional seam. The stiffness of the bridge deck was changed due to the presence of the crossbeam. The stress distribution was non-uniform with the stress concentration at the connection of the rib-to-deck and crossbeam. The shear stress changed in the reverse direction at the middle position.
The minimum normal stress at both ends of the Double-Weldline2 was 27.8 MPa. The normal stress increased gradually from the side to the middle of the weld seam and the maximum stress in the middle section was 38.8 MPa. The direction of the shear stress of the weld seam was modified.
The trends of the equivalent structural stress and stress components of Double-Weldline3 and Double-Weldline4 were similar to that of Double-Weldline2. The maximum of the normal stress at the bottom side of the bridge deck decreased by 10.6% compared to the traditional weld seam. The normal stress at the top side of the bridge deck decreased by 29.0% and the normal stress at the bottom side of the bridge deck decreased by 17.5%.
The comparative results indicated that the equivalent structural stress of the bridge deck with traditional weld seam was more significant when compared to the bridge deck with double-sided weld seam. The fatigue performance of the bridge deck with double-sided seam was much better than that of the bridge deck with traditional weld seam.
It can be concluded that the bottom side of the bridge deck was mainly subjected to tensile stress with significant normal structural stress. The fatigue performance of the connection of the bridge deck and U-rib was influenced largely by the type of the weld seam.
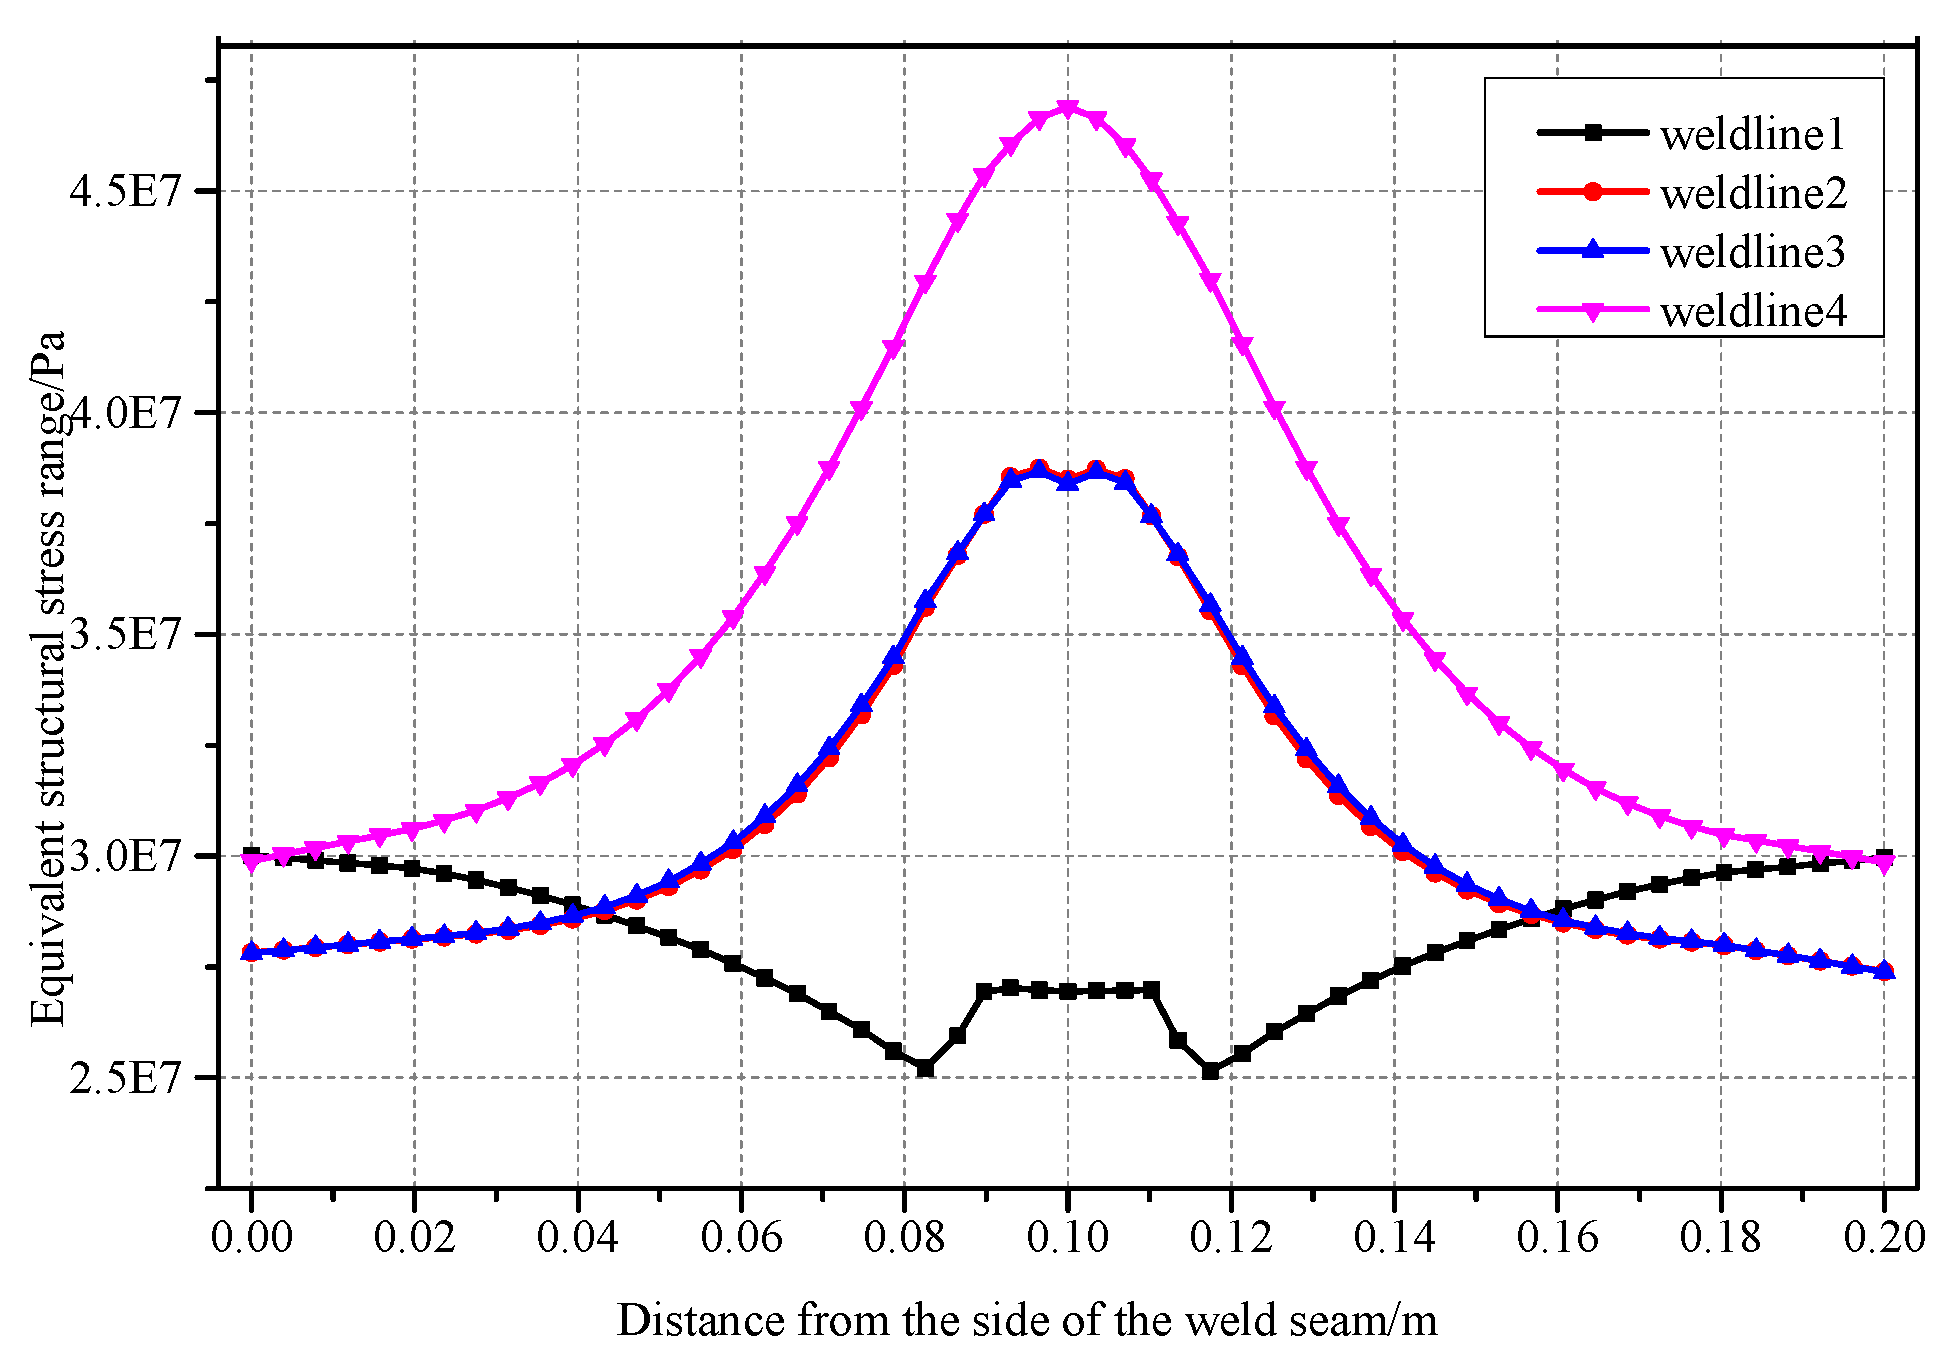
Figure 15 shows the equivalent structural stress of various weld seams of the bridge deck with double-sided weld seam. The trend of normal structural stress of Double-Weldline1 was opposite to that of the other three weld seams. The maximum normal stress at both sides of the Double-Weldline1 was 30 MPa and the stress gradually decreased to the middle of the weld seam. The minimum normal stress is 25.2 MPa. The normal stress increased reversely compared to the other three seams and remained uniform. The trends of the equivalent structural stress of Double-Weldline2 and Double-Weldline3 were similar and the normal stress values were close to each other. The normal stress increased gradually from the side of the weld seam to the middle section and the growth rate increased gradually. The maximum normal stress was 38.74 MPa and 38.68 MPa, respectively, for Double-Weldline2 and Double-Weldline3. The normal stress at the middle section decreased slightly.
Figure 16 shows the equivalent structural stress of various weld seams of the bridge deck with various weld seam. The increase of stress in the inner weld seam of the rib-to-deck connection optimizes the distribution of the equivalent structural stress. The fatigue failure location was shifted from the weld root of the outer weld seam to the weld toe of the inner weld seam demonstrating the effect of the crossbeam.

3.3. The Trends of Traction Structural Stress of Design Parameters of the Rib-To-Deck

The results showed that the fatigue performance of the rib-to-deck connection was significantly affected by the types of the weld seam. Furthermore, many other design parameters related to the effect of the crossbeam or their combination may influence the fatigue performance of OSB. In order to investigate the effect of geometric parameters of the weld seam on the fatigue performance of rib-to-deck connection, a partial model of the OSBD was developed as shown in Figure 17. As in the local model, the finite element used was SOLID 185 and the mesh at the connection of the rib-to-deck was refined. The model was simply supported and the fatigue load was applied to the middle of the top side of the bridge deck, as shown in Figure 18. The fatigue load was applied based on the orthotropic steel bridge specification, Eurocode3. Overall schemes of various detail parameters were established. The radius (γ) ranged from 5 to 25 mm, the groove angle (α) was within 20–65°, the thickness of the deck plate (h) varied within 12 to 24 mm, and the thickness of the U-rib (t) was 6–16 mm (Table 2).

3.4. The Law of Traction Structural Stress of Geometric Parameters of the Rib-To-Deck

Figure 19 shows the Mises stress distribution of the connection of rib-to-deck, and Figure 20 gives the von Mises stress distribution and fatigue cyclic lives distribution trend of the bottom side of the bridge deck. The Mises stress at the middle of the connection was more significant than that at other locations, and the stress decreased along the weld seam. The stress at the weld root was more significant than that at the weld toe, and the minimum cyclic life was obtained in the middle of weld root.
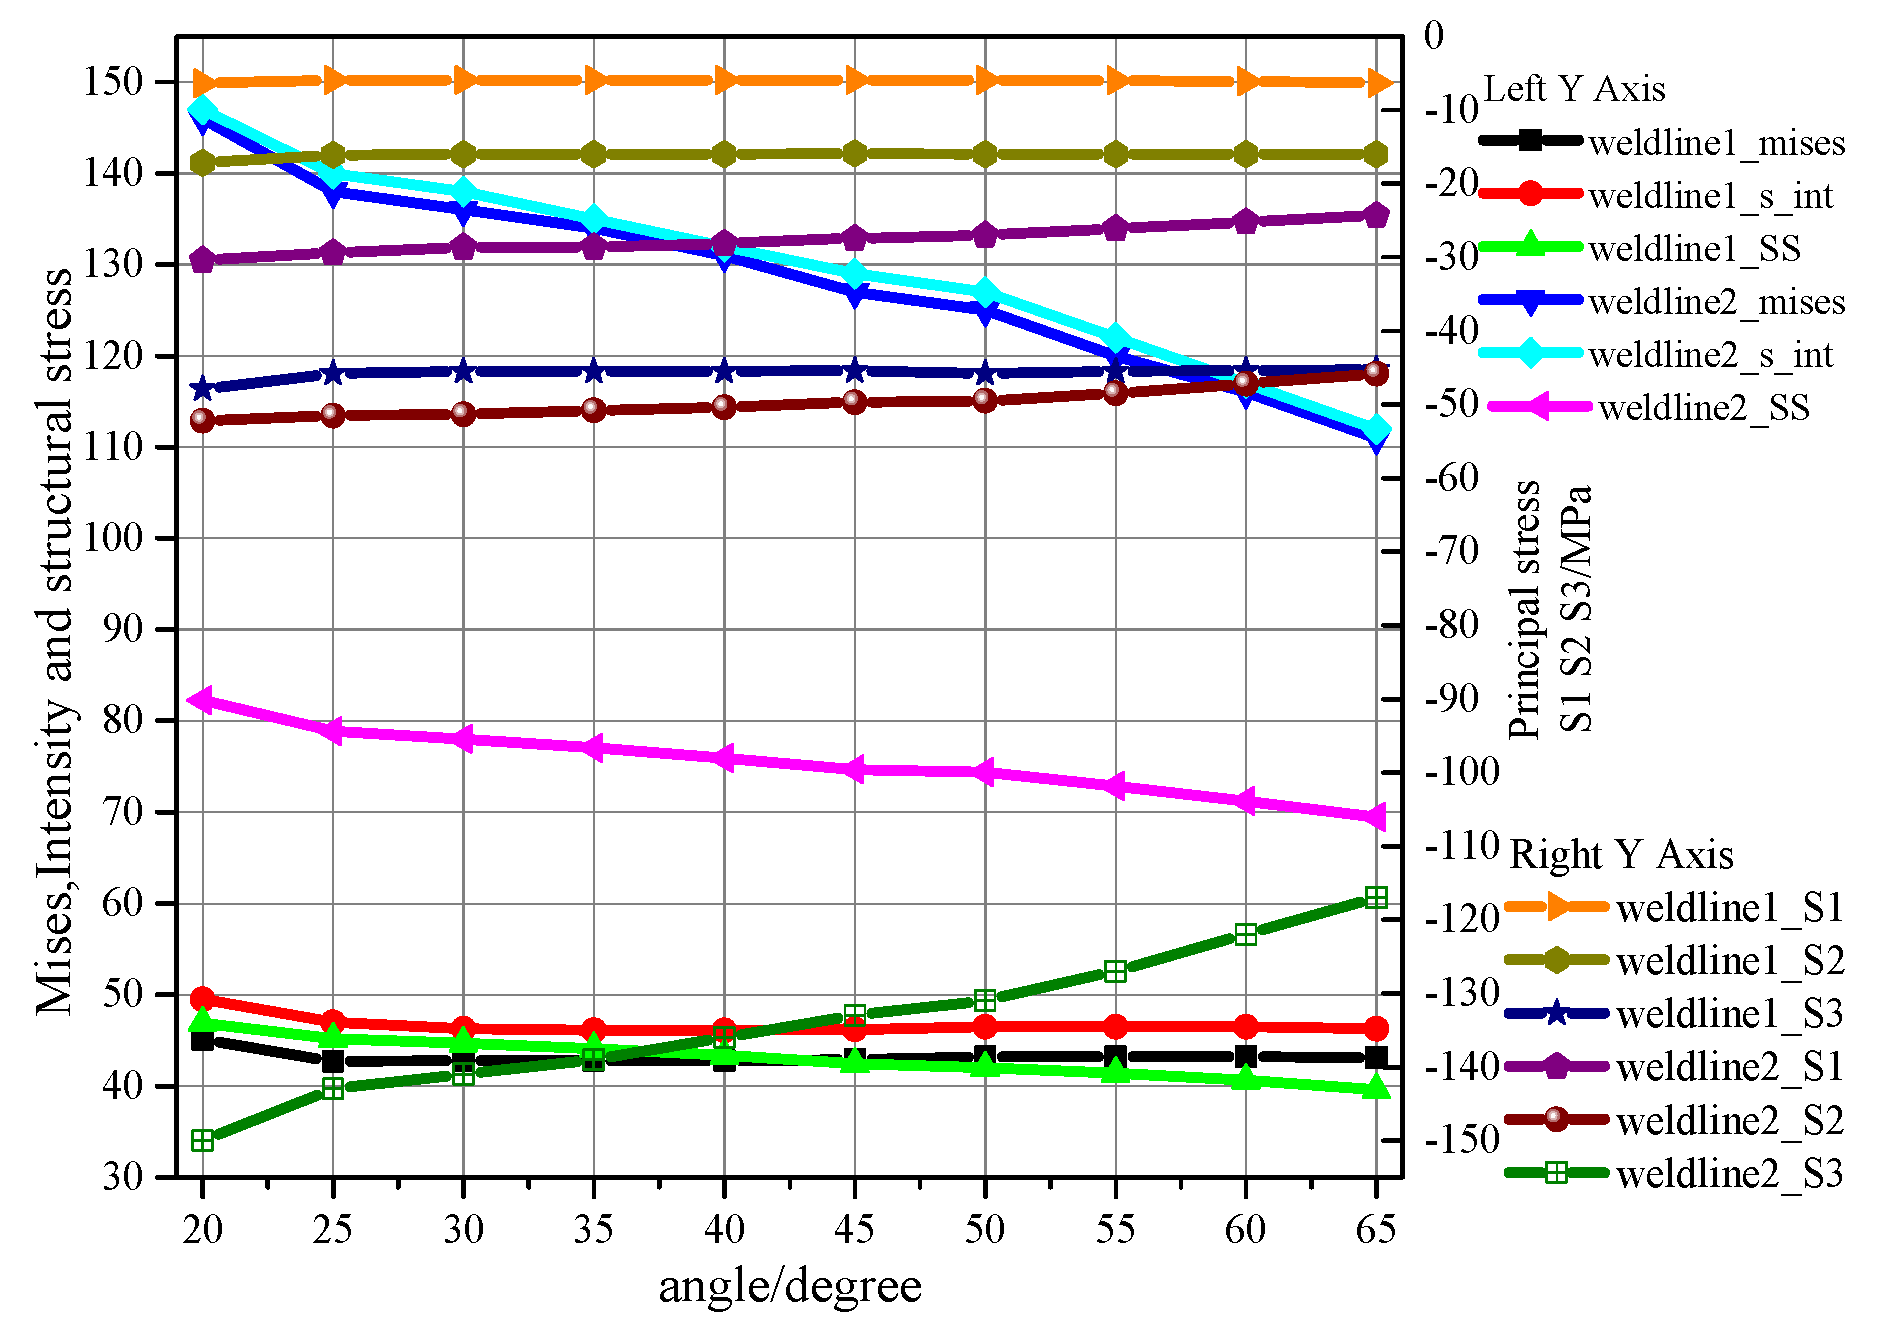
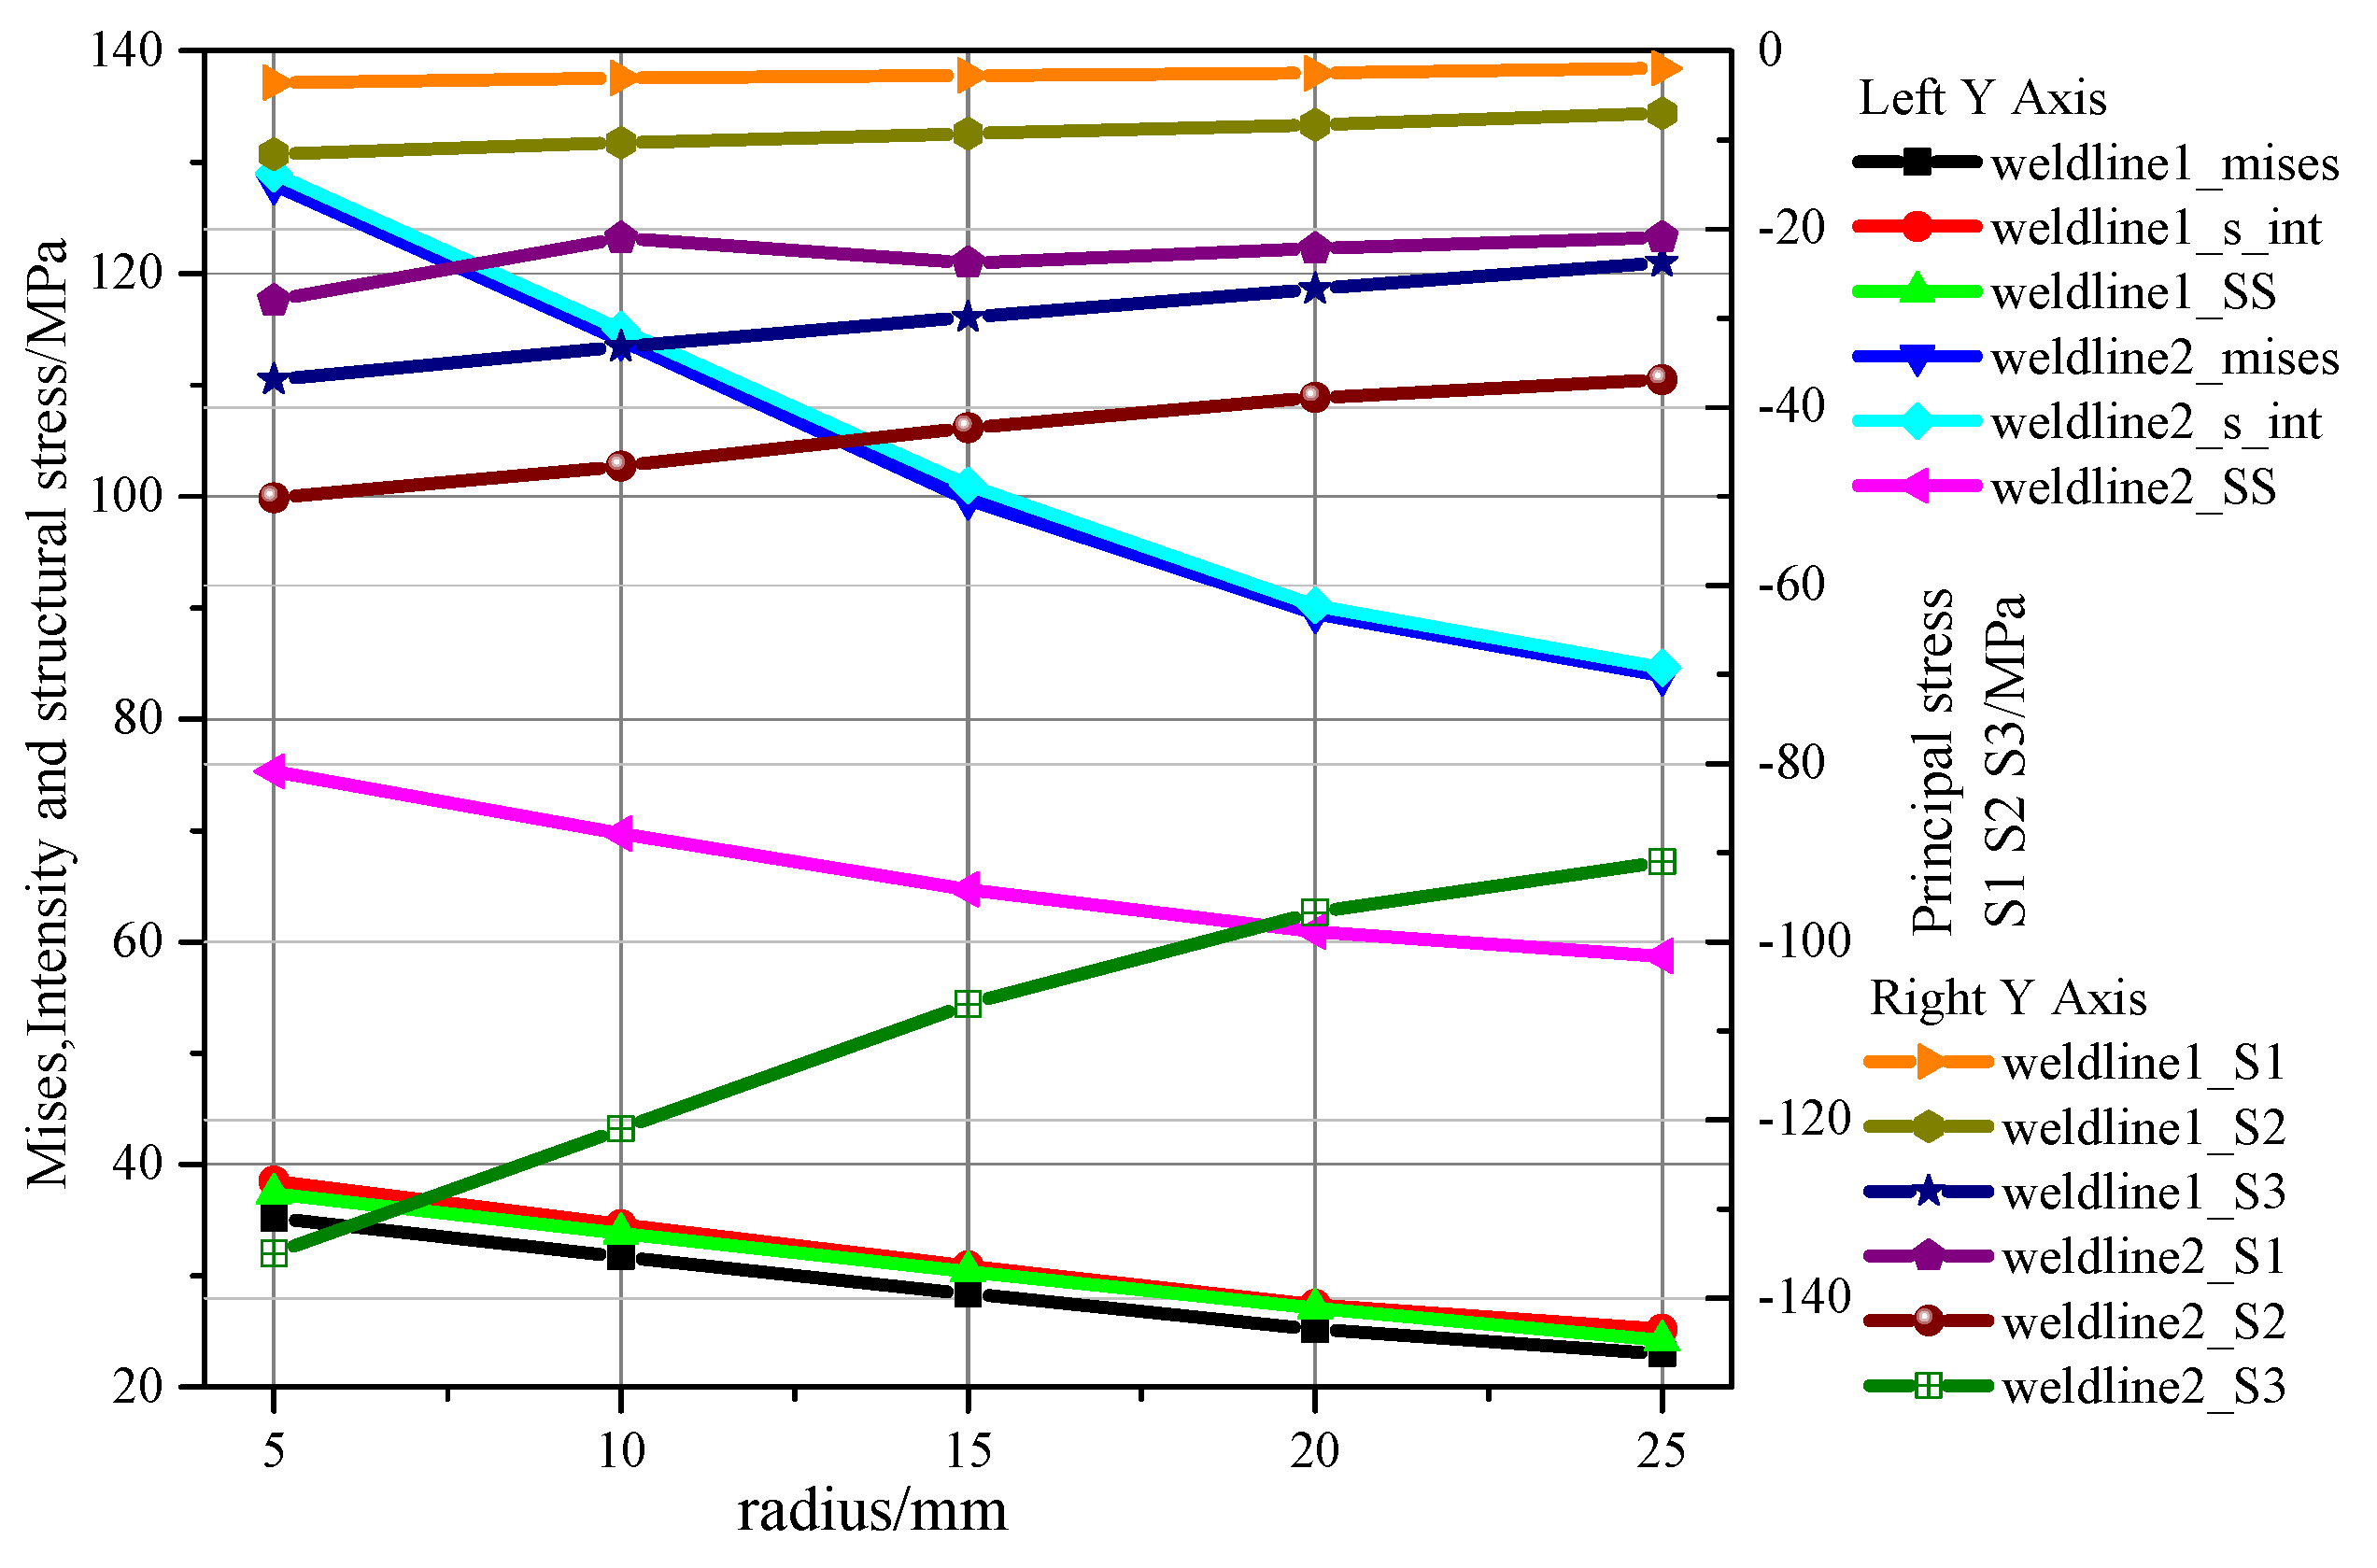
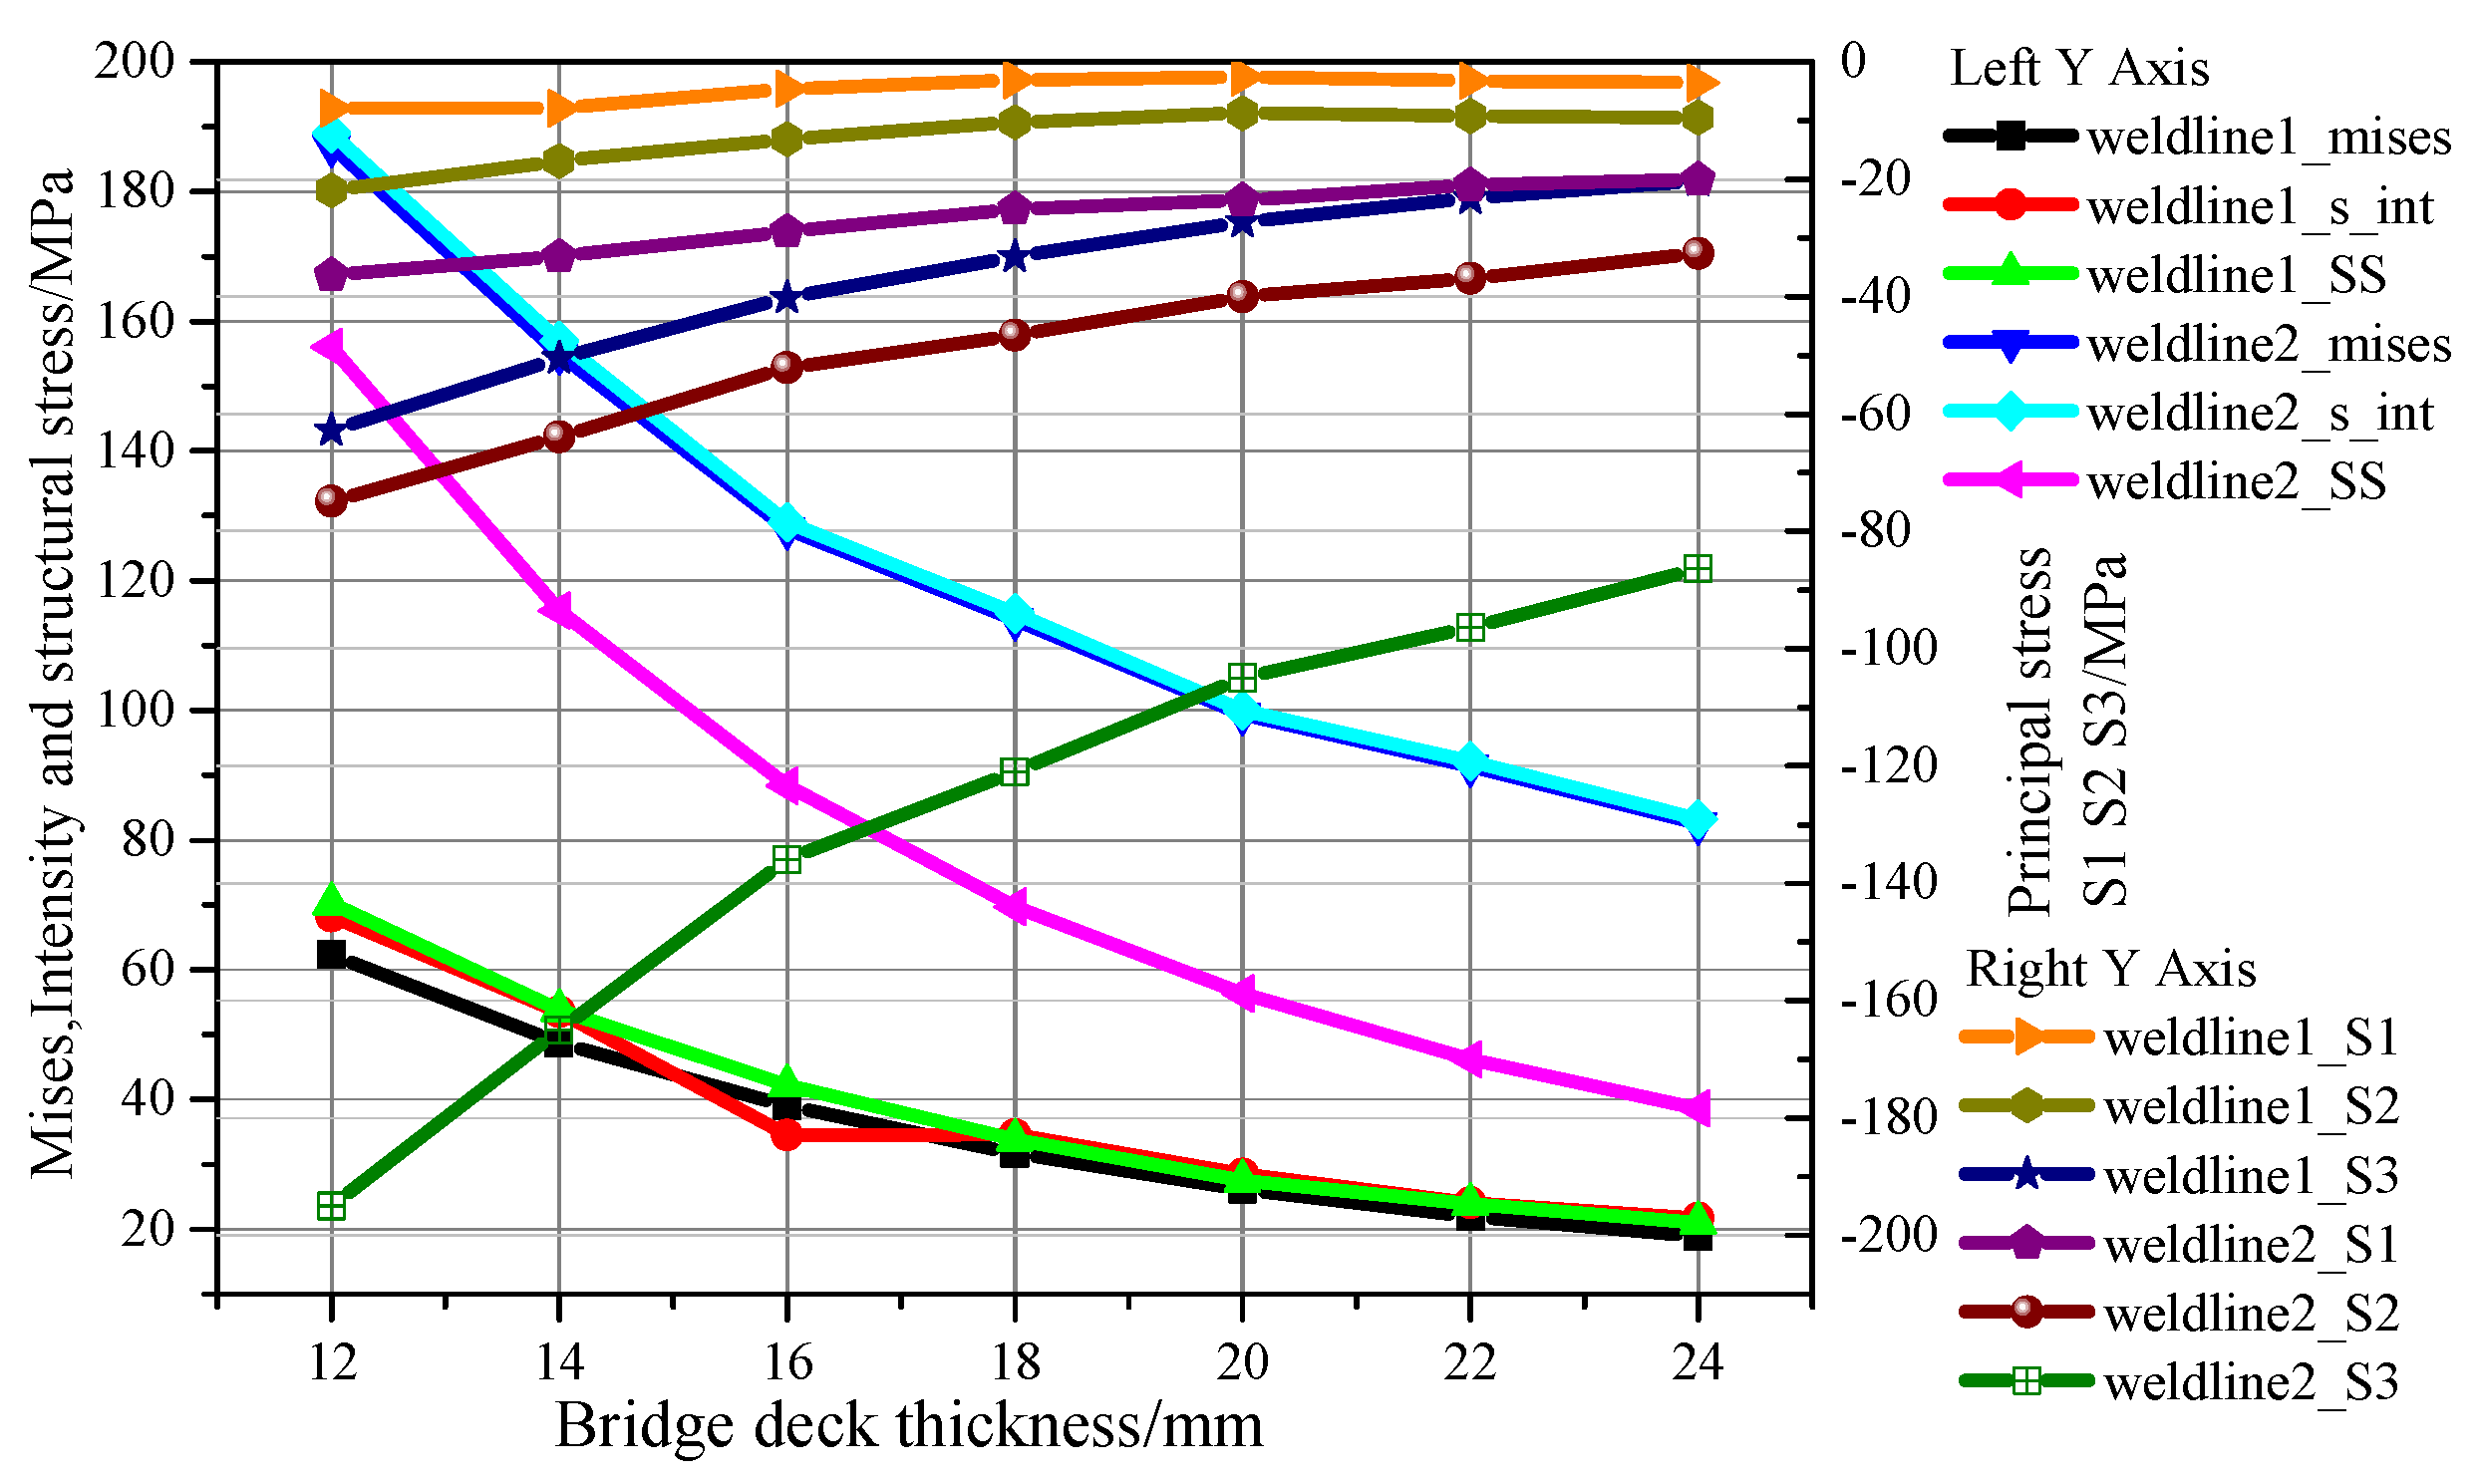
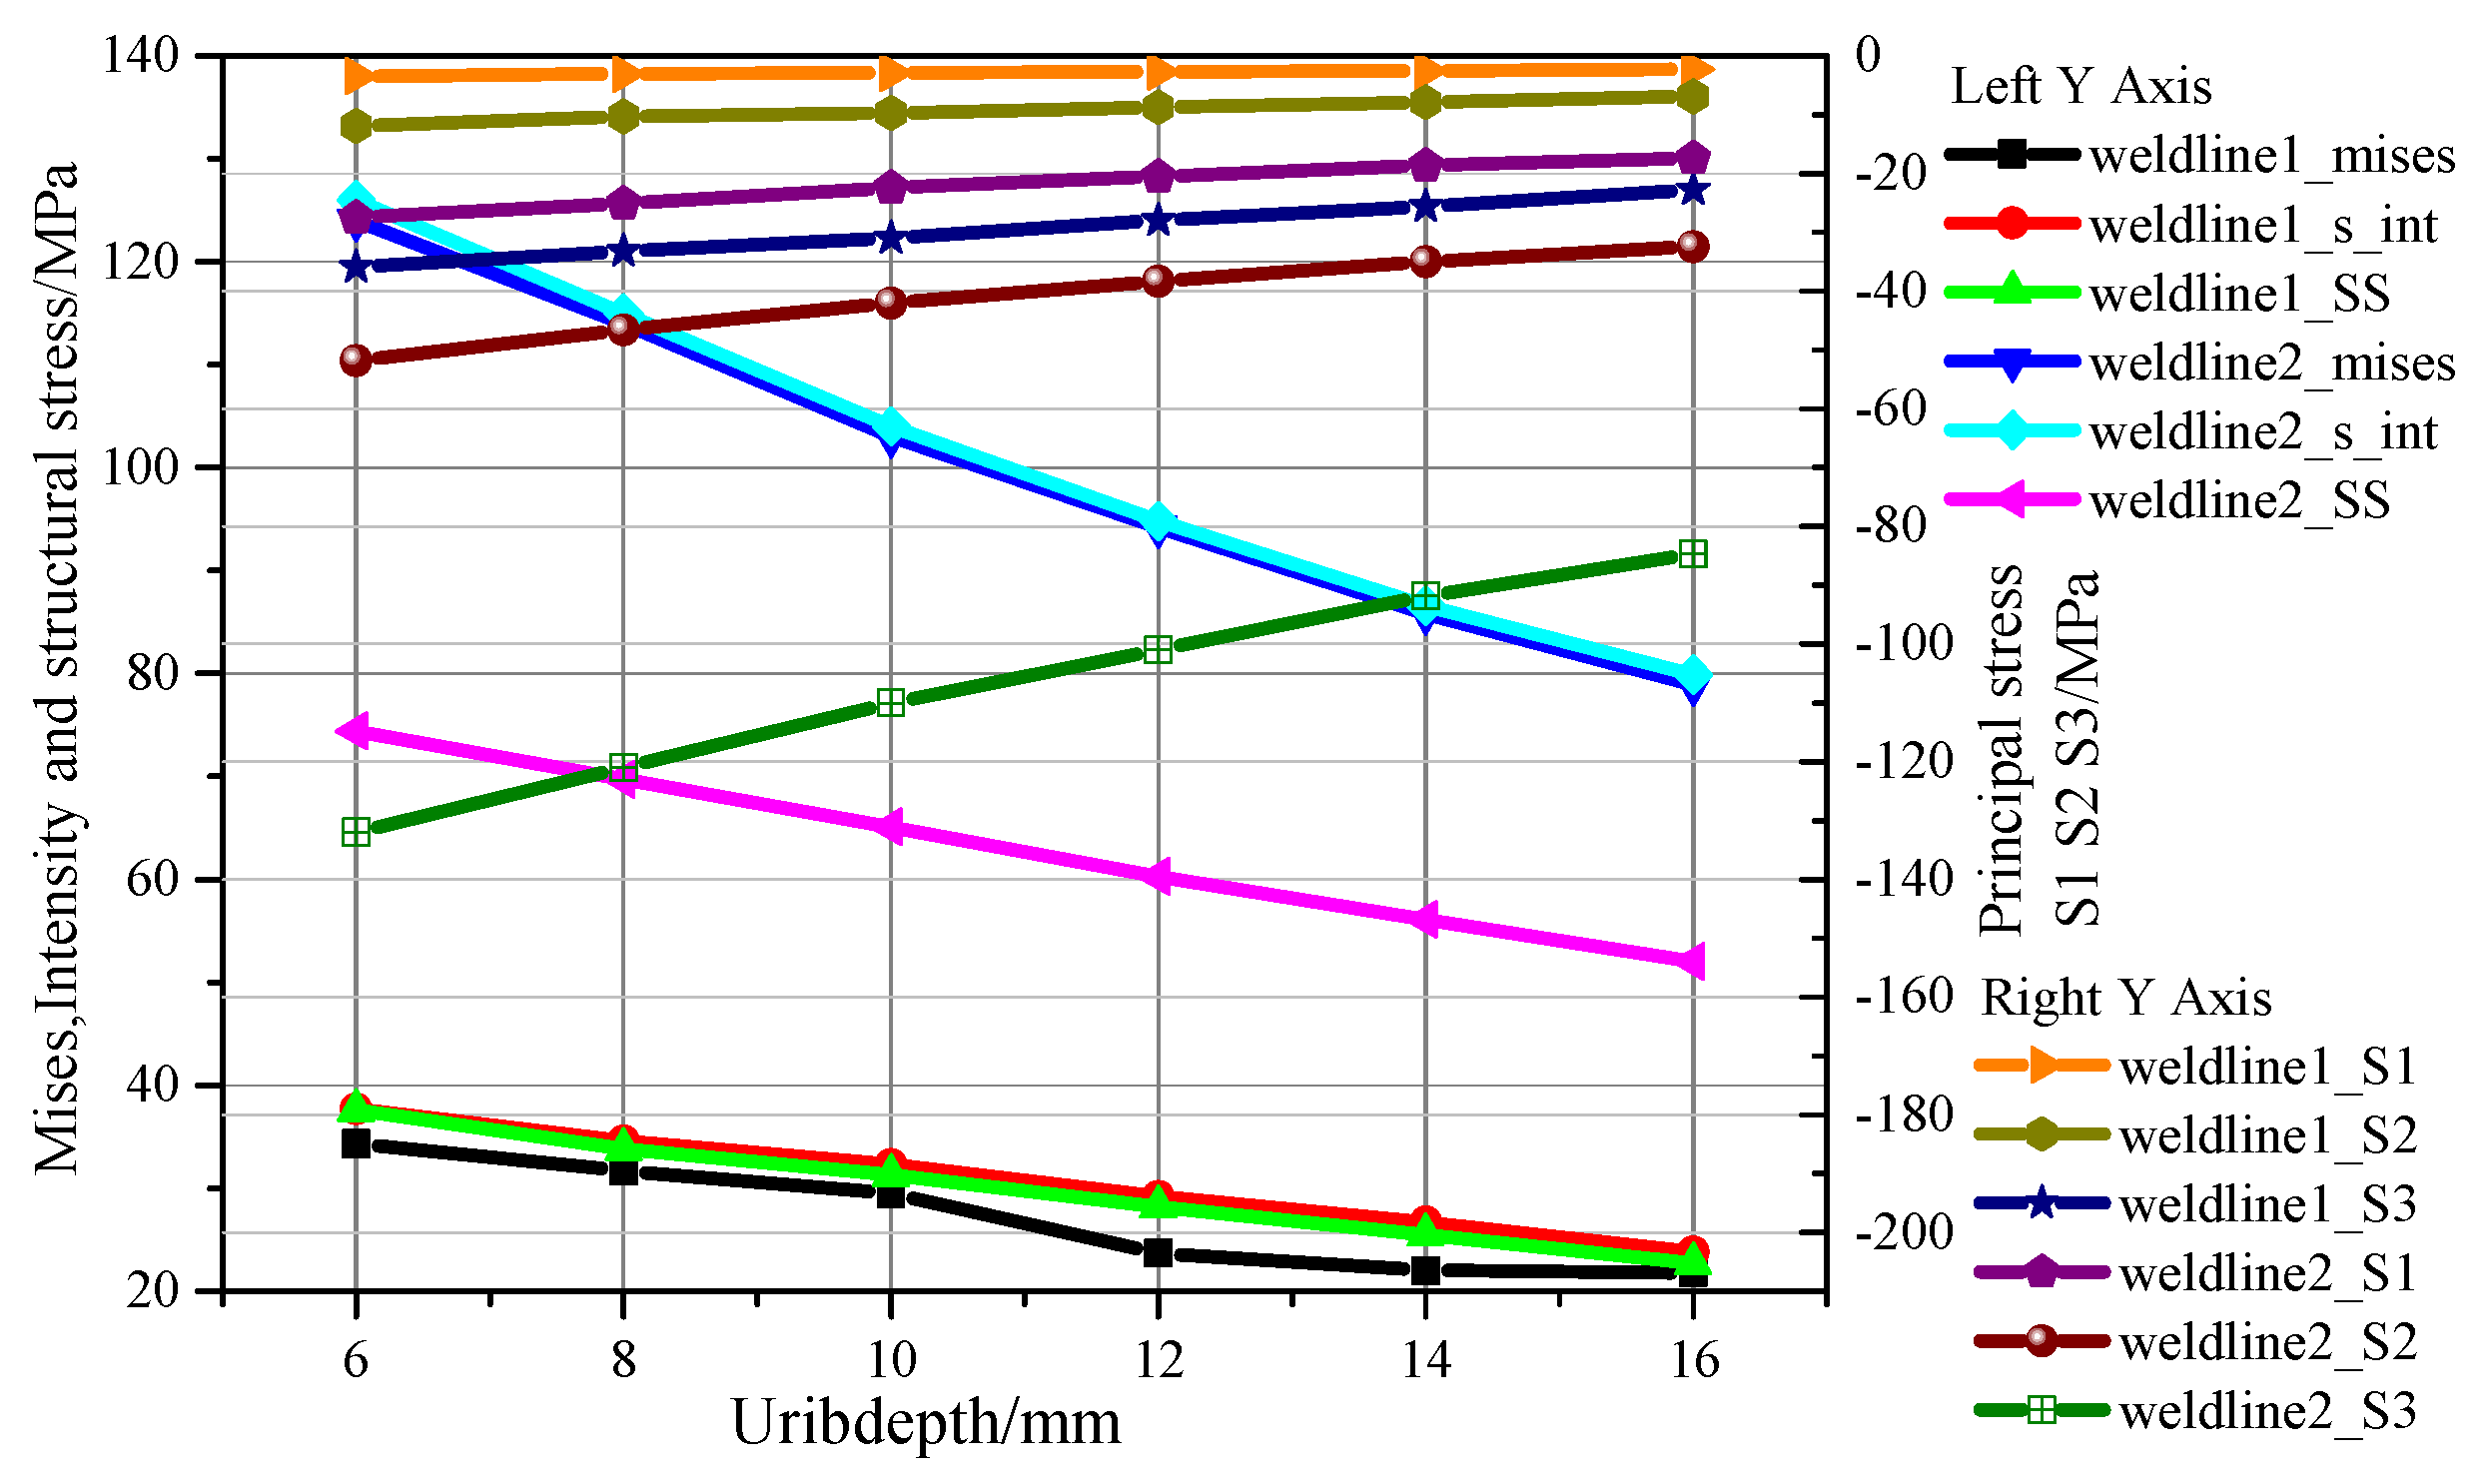
Various stresses, including the Mises stress (Mises), stress intensity (s_int), principal stresses (S1–3) and equivalent structural stress (SS), were determined as the evaluation indices. In the stress distribution contours shown in Figure 21, Figure 22, Figure 23, Figure 24, the left coordinate axis represents the value of the Mises stress (Mises), stress intensity (s_int) and equivalent structural stress (SS). The right coordinate axis stands for the value of the principal stresses (S1–3). Weldline1 represents the weld toe of the weld seam and Weldline2 stands for the weld root of the weld seam.
Figure 21 shows the trends of various stresses with the groove angle. The Mises stress, stress intensity, principle stress and the equivalent structural stress of Weldline1 and Weldline2 are calculated and plotted as the contours.
The comparative contours show that the Mises stress, stress intensity and equivalent structural stress of Weldline1 were small and decreased slightly with an increase in the groove angle. The trends of Mises stress and stress intensity of Weldline2 were similar. The Mises stress, equivalent structural stress and stress intensity of Weldline2 decreased with an increase in the angle. The principal stresses of Weldline2 remained constant with an increase in the groove angle.
Figure 22 shows the trends of various stresses with the radius of the weld seam. The results indicate that the Mises stress, stress intensity and equivalent structural stress of Weldline1 were relatively small and decreased sharply with an increase in the radius. The trends of Mises stress and stress intensity were similar. The Mises stress, equivalent structural stress and stress intensity decreased with an increase in the radius. The principal stresses decreased with an increase in the radius. In addition, the third principal stress (S3) of Weldline2 decreased sharply by 32.6% with an increase in the radius from 5 mm to 25 mm.
Figure 23 shows the trends of various stresses with the bridge deck thickness. The Mises stress, stress intensity and equivalent structural stress of Weldline1 decreased by up to 70% with an increase in the bridge deck thickness, respectively. The trends of Mises stress and stress intensity of Weldline2 were similar. The Mises stress, equivalent structural stress and stress intensity decreased by approximately 55% with an increase in the bridge deck thickness. The principal stresses of Weldline1 and Weldline2 decreased slightly with an increase in the bridge deck thickness.
The trends of various stresses with the U-rib thickness are shown in Figure 24. The comparative results demonstrate that the Mises stress, stress intensity and equivalent structural stress of Weldline1 decreased slightly with an increase in the U-rib thickness. The trends of Mises stress and stress intensity were similar. The Mises stress, equivalent structural stress and stress intensity of Weldline2 decreased by 44% with an increase in the U-rib thickness. The principal stresses of Weldline2 decreased slightly and the 3rd principal stress decreased by 34.5% with an increase in the U-rib thickness from 6 mm to 26 mm.
The comparative results indicated that the equivalent structural stress decreased by 13.4%, with the groove angle increasing from 20° to 60°. The connection of the rib-to-deck was strengthened with the increase in the angle. The equivalent structural stress reduced by 21.4%, with an increase in the radius from 5 mm to 25 mm. The equivalent structural stress at the middle of the bridge deck decreased by 24.6% with an increase in the U-rib from 8 mm to 16 mm. The equivalent structural stress at the middle of the bridge deck decreased significantly by 64.1% (from 156 MPa to 56 MPa), with an increase in the deck plate thickness from 12 mm to 24 mm. The bridge deck thickness influenced the equivalent structural stress and fatigue performance of the connection of the OSBD significantly and this observation substantiates why the equation of equivalent structural stress method includes the parameter of bridge deck thickness, t.
The comparative results from the analysis of geometric parameters of the rib-to-deck connection in OSBD will provide guidance for engineering fatigue design using the traction structural stress method. It is recommended that the variation in equivalent structural stress due to various geometric parameters should be added to the OSBD specification of Eurocode3.

4. Conclusions

Orthotropic steel bridge deck is constructed by employing groove seam welded connections at rib-to-deck and the crossbeam. This study numerically investigated the effect of the type of weld seam on the fatigue behavior of the rib-to-deck connection. Furthermore, the trends of various stresses with different geometric parameters of the weld seam were obtained for the fatigue design of the OSBD.
Based on the present investigation, the following conclusions are made:
(1)
The accuracy of the finite element method using traction structural stress method was validated and proven to be effective and accurate with the comparison to the fatigue test data.
(2)
The total structural stress in the middle of the bottom side of the bridge deck was the most significant with the lowest fatigue cyclic life. The location of the minimum fatigue life was in the middle of the connection between the weld seam and the bridge deck. The fatigue performance of the bridge deck with traditional weld seam was better than that of the bridge deck with weld seam of large root. Therefore, the weld seam size should be strictly controlled for better fatigue resistance.
(3)
The fatigue performance of the bridge deck with double-sided seam as proposed in this study was much better than that of the bridge deck with traditional weld seam. The increase in the thickness of the inner weld seam at the rib-to-deck connection optimizes the distribution of the equivalent structural stress and modifies the fatigue failure mode from the weld root of the outer weld seam to the weld toe of the inner weld seam by taking advantage of the crossbeam.
(4)
The trends of equivalent structural stress with the geometric parameters of the weld seam in the rib-to-deck connection were obtained. These trends can be useful for the engineering fatigue design of the OSBD. The fatigue behavior of the components and the equivalent structural stress were significantly influenced by the bridge deck thickness; other geometric parameters affected the fatigue performances of the OSBD slightly. It is recommended that the variation in equivalent traction structural stress due to the geometric parameters of weld seam should be added to the OSBD specification of Eurocode3.

Author Contributions

Conceptualization, H.Y. and H.Q.; methodology, P.W.; software, H.Y.; validation, P.W.; writing—original draft preparation, H.Y. and P.W.; writing—review and editing, H.Q. and P.D. All authors have read and agreed to the published version of the manuscript.

Funding

This research was funded by Natural Science Foundation of China (Grant No. 51678191 and No. 51605116).

Conflicts of Interest

The authors declare no conflicts of interest.

Abbreviations

S-NStress versus N
tBase metal thickness
σx(y)Normal structural stress
σxy(y)shear stress in plane
ΔσsTraction structural stress range
ΔσmMembrane structural stress range
ΔσbBending structural stress range
KStress intensity factor
ΔSsEquivalent structural stress range
I(r)Load mode parameter
mm = 3.6
Cd, hS-N curve parameters

References

  1. Shen, S. Recent advances on the fundamental research of spatial structures in China. J. Int. Assoc. Shell Spat. Struct. 2006, 47, 93–100. [Google Scholar]
  2. Liu, Y.M.; Zhang, Q.H.; Zhang, P.; Cui, C.; Bu, Y.Z. Study on fatigue life of U-rib butt weld in orthotropic steel bridge deck of Hong Kong-Zhuhai-Macao Bridge. China J. Highw. Transp. 2016, 29, 25–33. [Google Scholar]
  3. Huang, Y.; Zhang, Q.; Bao, Y.; Bu, Y. Fatigue assessment of longitudinal rib-to-crossbeam welded joints in orthotropic steel bridge decks. J. Constr. Steel Res. 2019, 159, 53–66. [Google Scholar] [CrossRef]
  4. Farreras-Alcover, I.; Chryssanthopoulos, M.K.; Andersen, J.E. Data-based Models for Fatigue Reliability of Orthotropic Steel Bridge Decks based on Temperature, Traffic and Strain Monitoring. Int. J. Fatigue 2016, 95, 104–119. [Google Scholar] [CrossRef]
  5. Maljaars, J.; Gration, D.; Vonk, E.; van Dooren, F. Crack Growth Prediction of Deck Plate-Stiffener Joints in Orthotropic Steel Bridge Decks. IABSE Symp. Rep. 2013, 99, 1571–1578. [Google Scholar] [CrossRef]
  6. Zhang, Q.H.; Li, J. Fatigue failure modes and resistance evaluation of orthotropic steel bridge deck structural system. China Civ. Eng. J. 2019, 52, 71–81. [Google Scholar]
  7. Eurocode Nr.3: Gemein Same Einheitliche Regeln fur Stahlbauten Kommission der Europ~Iischen Gemeinschaften, Bericht Nr; EUR 8849, DE, EN, FR, MBH, K61N; Stahlbau-Verlagsge-Sellschaft: Berlin, Germany, 1984.
  8. Cheng, B.; Ye, X.H.; Cao, X.; Mbako, D.D.; Cao, Y. Experimental study on fatigue failure of rib-to-deck welded connections in orthotropic steel bridge decks. Int. J. Fatigue 2017, 103, 157–167. [Google Scholar] [CrossRef]
  9. Li, M.; Suzuki, Y.; Hashimoto, K.; Sugiura, K. Experimental study on fatigue resistance of rib-to-deck joint in orthotropic steel bridge deck. J. Bridge Eng. 2017, 23, 157–167. [Google Scholar] [CrossRef]
  10. Fu, Z.; Ji, B.; Zhang, C. Fatigue Performance of Roof and U-Rib Weld of Orthotropic Steel Bridge Deck with Different Penetration Rates. J. Bridge Eng. 2017, 22, 040. [Google Scholar] [CrossRef]
  11. Zhang, Q.-H.; Luo, P.-J.; Xu, G.-Y. Experiment on Fatigue Performance of Rib-to-deck Welded Joint with New Rolled Rib. China J. Highw. Transp. 2018, 31, 42–52. [Google Scholar]
  12. Gong, D.J. Research on fatigue performance of new type of double-side rib-to-deck welded joint in orthotropic steel bridge deck. Southwest Jiao Tong Univ. 2018, 25–26. [Google Scholar]
  13. Zhang, Q.-H.; Guo, Y.-W.; Li, J. Fatigue Crack Propagation Characteristics of Double-sided Welded Joints between Steel Bridge Decks and Longitudinal Ribs. China J. Highw. Transp. 2019, 32, 49–56. [Google Scholar]
  14. You, R.; Liu, P.; Zhang, D. Fatigue behavior tests of the inside connection between U rib and deck in orthotropic steel bridge. J. China Foreign Highw. 2018, 38, 174–179. [Google Scholar]
  15. American Society of Mechanical Engineers. The Master S-N Curve Method: An Implementation for Fatigue Evaluation of Welded Components in the ASME B&PV Code, Section VIII, Division2 and API 579-1/ASME FFS-1; The Equity Engineering Group, Inc.: New York, NY, USA, 2007. [Google Scholar]
  16. Kyuba, H.; Dong, P. Equilibrium-equivalent structural stress approach to fatigue analysis of a rectangular hollow section joint. Int. J. Fatigue 2005, 27, 85–94. [Google Scholar] [CrossRef]
  17. Dong, P. A structural stress definition and numerical implementation for fatigue analysis of welded joints. Int. J. Fatigue 2001, 23, 865–876. [Google Scholar] [CrossRef]
  18. Dong, P. A robust structural stress method for fatigue analysis of offshore/marine structures. J. Offshore Mech. Arct. Eng. 2005, 127, 68. [Google Scholar] [CrossRef]
  19. Dong, P.; Prager, M.; Osage, D. The design master S-N curve in ASME div 2 rewrite and its validations. Weld World 2007, 51, 53–63. [Google Scholar] [CrossRef]
  20. Yang, H.; Qian, H.; Wang, P.; Dong, P. Analysis of Fatigue Behavior of Welded Joints in Orthotropic Bridge Deck Using Traction Structural Stress. Adv. Mech. Eng. 2019. [Google Scholar] [CrossRef]
  21. Wang, P.; Pei, X.; Dong, P.; Song, S. Traction structural stress analysis of fatigue behaviors of rib-to-deck joints in orthotropic bridge deck. Int. J. Fatigue 2019, 125, 11–22. [Google Scholar] [CrossRef]
  22. Zhang, Q.; Bu, Y.; Li, Q. Review on fatigue problems of orthotropic steel bridge deck. China J. Highw. Transp. 2017, 30, 14–30. [Google Scholar]
Figure 1. The decomposition of the inner force at the plane of weld toe.
Applsci 10 01239 g001
Figure 2. Nodal forces and moments of nodes of the weld seam and weld elements.
Applsci 10 01239 g002
Figure 3. Fatigue test rig [8].
Applsci 10 01239 g003
Figure 4. Finite simulation model.
Applsci 10 01239 g004
Figure 5. Master S-N curve based traction structural stress method.
Applsci 10 01239 g005
Figure 6. The detailed sizes (Unit: mm) of the orthotropic steel bridge deck (OSBD) and three typical connections. (a) Model of the OSBD; (b) traditional weld seam; (c) weld seam of large root; (d) double-sided weld. ① weld toe of outer seam ② weld root of outer seam ③ weld root of inner seam ④ weld toe of inner seam.
Applsci 10 01239 g006
Figure 7. The finite model of the OSBD and typical connections. (a) the overall model of OSB; (b) the finite element model of OSB; (c) conventional weld seam; (d) weld seam of large root; (e) double-sided weld.
Applsci 10 01239 g007
Figure 8. Hypothetical fatigue crack initiation and propagation on the bridge deck.
Applsci 10 01239 g008
Figure 9. Mises stress of the bottom side of the bridge deck of a traditional weld seam. (a) Mises stress diagram of the bottom side of the bridge deck (Pa). (b) Fatigue cyclic life of the connection of the rib-to-deck, 1 the number in the contours is the base 10 log of the contour line.
Applsci 10 01239 g009
Figure 10. Equivalent structural stress of the weld root and weld toe of a traditional weld seam. (a) Equivalent structural stress of Trad-Weldline1, (b) equivalent structural stress of Trad-Weldline2.
Applsci 10 01239 g010aApplsci 10 01239 g010b
Figure 11. Mises stress of the bottom side of the top flange of the weld seam of a large root. (a) Mises stress diagram of the bottom side of the bridge deck (Pa) (b) fatigue cyclic life of the connection of the rib-to-deck, 1 the number in the contours is the base 10 log of the contour line.
Applsci 10 01239 g011
Figure 12. Equivalent structural stress of the weld root and weld toe of the weld seam of a large root. (a) Equivalent structural stress of Large-Weldline1, (b) equivalent structural stress of Large-Weldline2.
Applsci 10 01239 g012
Figure 13. Mises stress of the bottom side of the top flange of the double-sided weld seam, (a) Mises stress diagram of the bottom side of the bridge deck (Pa). (b) Fatigue cyclic life of the connection of the rib-to-deck, 1 the number in the contours is the base 10 log of the contour line.
Applsci 10 01239 g013
Figure 14. Equivalent structural stress of the weld root and weld toe of double-sided weld seams. (a) Equivalent structural stress of Double-Weldline1, (b) equivalent structural stress of Double-Weldline2, (c) equivalent structural stress of Double-Weldline3, (d) equivalent structural stress of Double-Weldline4.
Applsci 10 01239 g014aApplsci 10 01239 g014b
Figure 15. Equivalent structural stress of weld seams of bridge deck with double-sided weld seam.
Applsci 10 01239 g015
Figure 16. Equivalent structural stress of weld seams of bridge deck with various weld seams.
Applsci 10 01239 g016
Figure 17. The diagram of the geometric parameters of the components in the OSBD (Unit mm).
Applsci 10 01239 g017
Figure 18. The constraint, fatigue load and component of the OSB in the partial model.
Applsci 10 01239 g018
Figure 19. Mises stress distribution of the rib-to-deck connection.
Applsci 10 01239 g019
Figure 20. Mises stress distribution and cyclic life distribution of the deck plate. (a) Distribution contour of the Mises stress at the bottom side of the bridge deck (Pa). (b) Distribution of the fatigue cyclic life of the rib-to-deck connection, 1 the number in the contours is the base 10 log of the contour line.
Applsci 10 01239 g020
Figure 21. Trends of various stresses with the groove angle.
Applsci 10 01239 g021
Figure 22. Trends of various stresses with the radius of the weld seam.
Applsci 10 01239 g022
Figure 23. Trends of various stresses with the bridge deck thickness.
Applsci 10 01239 g023
Figure 24. Trends of various stresses with the U-rib thickness.
Applsci 10 01239 g024
Table 1. Fatigue test results and numerical simulation results.
Loading ModeFatigue Test Cyclic LifeHot Spot Stress
(HSS/MPa)
Structural Stress
(SS/MPa)
Loading ModeFatigue Test Cyclic LifeHot Spot Stress
(HSS/MPa)
Structural Stress
(SS/MPa)
I782,325212.1252.02II;643,540236.2270.50
I354,321255.6314.42II;614,865225.5275.98
I797,970205.6251.90II;187,758315.1406.18
Table 2. Overall schemes and geometric parameters of OSBD.
ParameterSizeParameterParameter Range
Deck plate size600 × 400 × 18 Circle radius5–25 mm
U-shaped rib size300 × 200 × 180 × 8 × 400 Groove angle 20–65°
Crossbeam size600 × 340 × 10Deck thickness 12–24 mm
Weld type Groove weld U-shaped rib thickness 6–16 mm

