Article

Opto-Electronic Refractometric Sensor Based on Surface Plasmon Resonances and the Bolometric Effect

by
Mahmoud H. Elshorbagy
1,2,
Alexander Cuadrado
3,
José Antonio Gómez-Pedrero
1 and
Javier Alda
1,*
1
Applied Optics Complutense Group, University Complutense of Madrid, Faculty of Optics and Optometry, Av. Arcos de Jalón 118, 28037 Madrid, Spain
2
Physics Department, Faculty of Science, Minia University, University Campus, El-Minya 61519, Egypt
3
Escuela Superior de Ciencias Experimentales y Tecnología, Universidad Rey Juan Carlos, 28933 Madrid, Spain
*
Author to whom correspondence should be addressed.
Appl. Sci. 2020, 10(4), 1211; https://doi.org/10.3390/app10041211
Submission received: 30 December 2019 / Revised: 26 January 2020 / Accepted: 5 February 2020 / Published: 11 February 2020
(This article belongs to the Special Issue Optical Biosensors and Applications)

Abstract

:

Featured Application

The spectral selectivity of plasmonic resonances combined with the bolometric effect generates an alternative transduction strategy to measure changes in the refractive index of an analyte. Moreover, our proposed system provides an opto-electronic read-out to facilitate detection. It works under normal incidence conditions and may characterize tiny analyte’s volumes (e.g., human tears). Our device is tuned to sense variations in the index of refraction of aqueous media, and it can be tailored to measure at other ranges of the index of refraction.

Abstract

The bolometric effect allows us to electrically monitor spectral characteristics of plasmonic sensors; it provides a lower cost and simpler sample characterization compared with angular and spectral signal retrieval techniques. In our device, a monochromatic light source illuminates a spectrally selective plasmonic nanostructure. This arrangement is formed by a dielectric low-order diffraction grating that combines two materials with a high-contrast in the index of refraction. Light interacts with this structure and reaches a thin metallic layer, that is also exposed to the analyte. The narrow absorption generated by surface plasmon resonances hybridized with low-order grating modes, heats the metal layer where plasmons are excited. The temperature change caused by this absorption modifies the resistance of a metallic layer through the bolometric effect. Therefore, a refractometric change in the analyte varies the electric resistivity under resonant excitation. We monitor the change in resistance by an external electric circuit. This optoelectronic feature must be included in the definition of the sensitivity and figure of merit (FOM) parameters. Besides the competitive value of the FOM (around 400 RIU 1 , where RIU means refractive index unit), the proposed system is fully based on opto-electronic measurements. The device is modeled, simulated and analyzed considering fabrication and experimental constrains. The proposed refractometer behaves linearly within a range centered around the index of refraction of aqueous media, n 1.33 , and can be applied to the sensing for research in bio-physics, biology, and environmental sciences.

Graphical Abstract

1. Introduction

Nanophotonic structures can increase the performance of plasmonic sensors by controlling light propagation and interaction with the environment at subwavelength resolution [1,2]. More precisely, they can also promote the excitation of surface plasmon resonances (SPR), hybrid Fano responses, guiding modes, and grating coupling. These phenomena generate a wide variety of spectral responses that improve the sensitivity, S B , and figure of merit (FOM) of the sensors [3,4,5]. The spectral line shape and the spatial and spectral location of the resonances depend on: (i) the dimensions of the nanostructure as well as, (ii) the optical properties of the chosen materials. Therefore, depending on the application, we can adjust the geometry and material choice to optimize sensitivity and FOM. The design can be tailored to work as filters, perfect absorbers, or perfect mirrors [6,7,8,9,10,11].
Plasmonic resonances are widely employed to enhance the performance of refractometric sensors; they are usually revealed by monitoring the spectral response (spectral interrogation), or by modifying the angle of incidence (angular interrogation) [12,13]. Kretschmann and Otto configurations—well-known techniques—require reflectance to be measured angularly under oblique incidence conditions [14,15,16]. These configurations employ a dielectric prism to direct the radiation towards a metallic/dielectric interface to generate SPR, assuming that the wave vector matching condition is fulfilled [17,18]. A plasmonic sensor incorporating nanophotonic structures provides tuneability for applications in biosensing, gas and liquids refractometers, and so forth [19,20,21]. It is also possible to considers normal incidence excitation through the substrate, while maintaining the sensor’s performance competitive with some other previous strategies [3,4,12]. Furthermore, this could allow the integration of the sensor at the tip of an optical fiber. However, this convenient set-up still needs of spectral measurement techniques.
In this contribution, we model and simulate an alternative measurement technique that exploits the bolometer effect, which is triggered by the absorption of the electromagnetic radiation [22,23]. This way, we avoid costly spectral measurement systems because the output signal is electrical by definition [24]. In fact, the bolometric effect is responsible for the variation in resistivity caused by a change in temperature. This mechanism has been widely used in antenna-coupled detectors in the infrared [22,23,25,26]. In a nutshell, our device works under normal incidence conditions and a spectrometer is unnecessary because we measure an electrical signal directly related with the sensed property. A monochromatic laser source eases integration with off-the-shelf driving and signal acquisition electronics, both for illumination and signal retrieval. Our sensor is based on a dielectric grating that couples radiations into a dielectric/metal interface where the SPR are excited. The shape of the resonance is described best as a hybrid-Fano resonance between the pure SPR and a wider response generated by the grating [4]. The resonance strongly depends on the index of refraction of the analyte, which is in contact with the metal layer. At the resonant wavelength, the metal absorbs most of the incident radiation and works almost as a perfect absorber. This absorption increases the temperature in the metal layer, that consequently changes its electric resistance through the bolometric effect. This mechanism is parameterized by the Temperature Coefficient of Resistance (TCR) of the material. This optically induced variation in resistance can be measured as a voltage change by an external circuit biased with a voltage or current source (see Figure 1a).
To simulate the device we have used a multiphysics package, Comsol Multiphysics, that evaluates the interaction between electromagnetic and thermal domains.

2. Design and Optimization

The proposed device has a SiO 2 substrate with an extruded GaP grating of period P, and with a rectangular profile (GW is the width and GH is the height). This nanostructure is overfilled with MgF 2 for a total thickness of t b (being t b > GH ). From a fabrication point of view, the MgF 2 layer can be spin coated to generate a flat surface. On top of this layer, we find a gold coating of thickness t m to generate the surface plasmon resonances. As long as the metal is connected to an external circuit, a thin isolation layer of SiO 2 ( t up in thickness) must be placed between the metal and the analyte to maintain reliable electric connections. The arrangement of these layers and structures is shown in Figure 1b. The dimensions of the layers and the structure, along with the optical and thermal constants of the material used in the design are presented in Table 1. The analyte is considered as an aqueous medium having a purely real index of refraction, n a = 1.33 .
Physically, Fano resonances appear when a discrete and narrow spectral resonance interferes coherently with a broadband background. In our case, the narrow peak is caused by an SPR appearing at the metal/dielectric interface; and the broadband spectral background (compared with the very narrow SPR), is produced by the radiation scattered from the grating structure, that is illuminated by the same source [4]. The total aborption spectrum of the structure is linked with the SPR, which complies with the wave vector matching condition [27,28]:
2 π m P = ω c ε m ε eff ε m + ε eff ,
where P is the grating period, m represents the diffraction order, ω is the angular frequency, c the speed of light, ε m is the real part of the dielectric permittivity of the metal, and ε eff is the effective dielectric permittivity of the effective media where the plasmon propagates. This effective medium combines both the analyte and the SiO 2 layer, and it is related to the propagation distance of the SPR in the analyte.
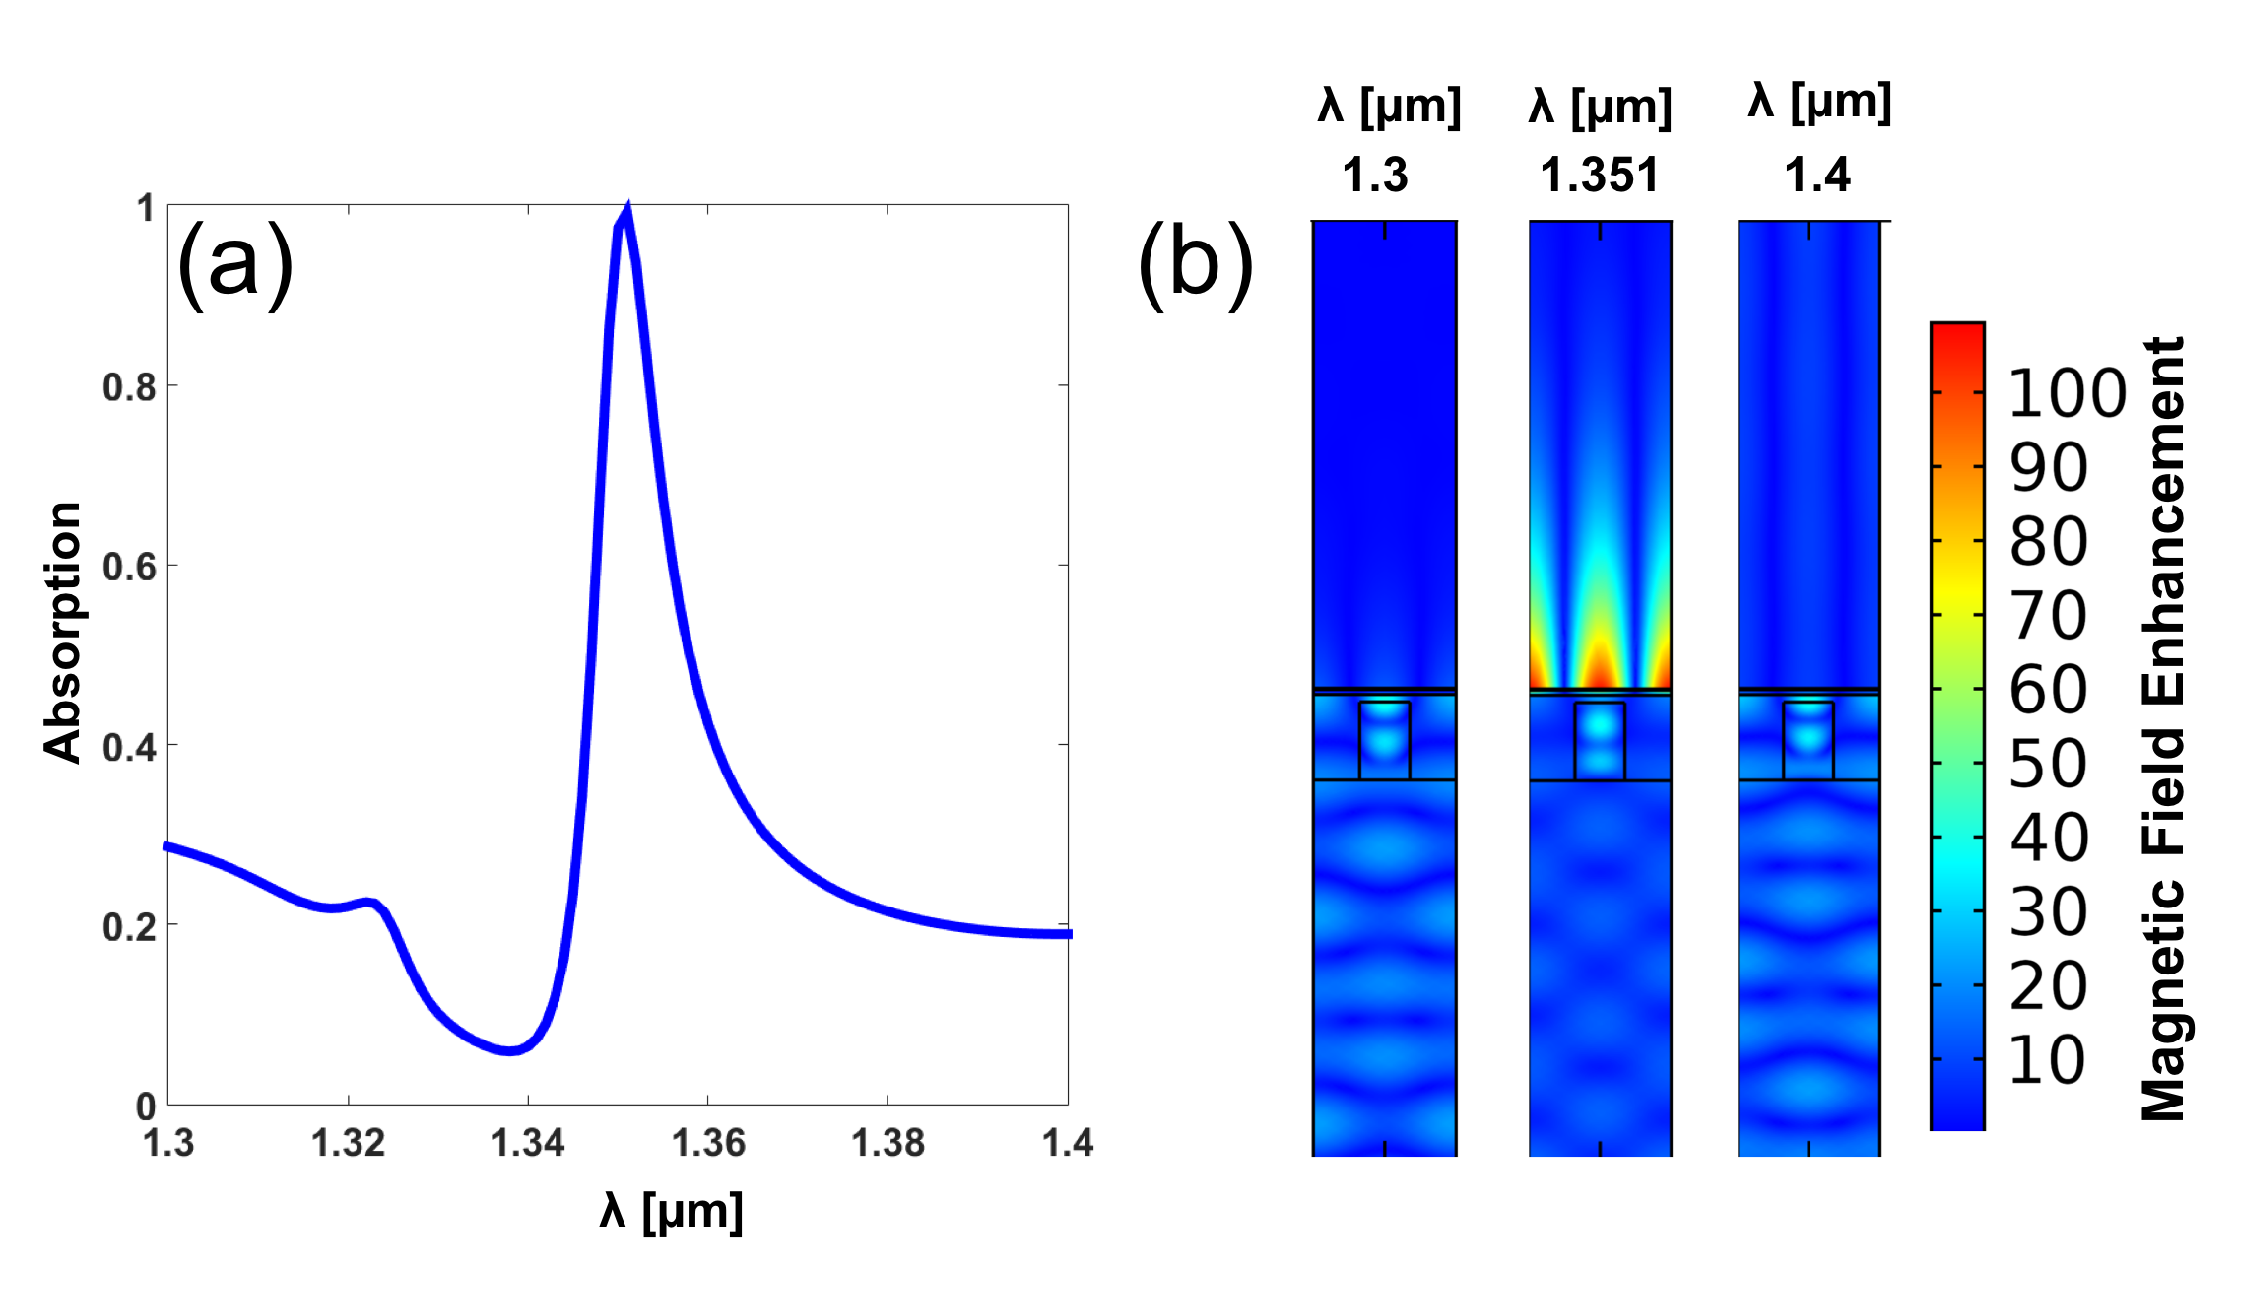
Our goal is to increase as much as possible the temperature of the gold layer. To do so, we must enhance absorption at the metal layer which, in combination with the nanostructure, we consider as an almost-perfect absorber. Figure 2a shows the spectral absorption of an optimized structure (see parameters in Table 1) with an absorption maximum of 0.999 at λ res = 1.351   μ m. The resonant wavelength can be tuned by adjusting the periodicity P in Equation (1). The magnetic field maps of the device for several wavelengths are shown in Figure 2b. As far as the amplitude of the incoming wavefront is H 0 = 1 A/m, these maps can be interpreted as Field Enhancement, FE maps ( FE ( x , y , z ) = | H ( x , y , z ) | / H 0 ). We have also represented the magnetic field enhancement when the system is detuned from the resonance at both sides of the resonance ( λ = 1.3   μ m and λ = 1.4   μ m) [4]. The results show how the magnetic field enhancement is significant in a large volume of the analyte near the nanostructure for the resonant wavelength. This also improves the sensitivity of the device for variations in the index of refraction of the analyte.
The physical linked mechanisms can be described as follows. The relative change in electric resistivity of materials is linearly proportional to the change in temperature through the bolometric constant (temperature coefficient of resistance (TCR) α ), as:
Δ R R = α Δ T .
The value of the TCR for gold is α = 0.0036 K 1 . The temperature variation, Δ T , is also proportional to the absorbed power, and this absorbed power can be calculated as:
· ( k T ) = Q ,
where k is thermal conductivity, and Q is the heat power density which is related to the spatial distribution of the electromagnetic power absorbed by the metal layer. Therefore, Equation (3) links the electromagnetic and thermal domains, and Equation (2) translates the thermal results into electric properties.

3. Results and Discussion

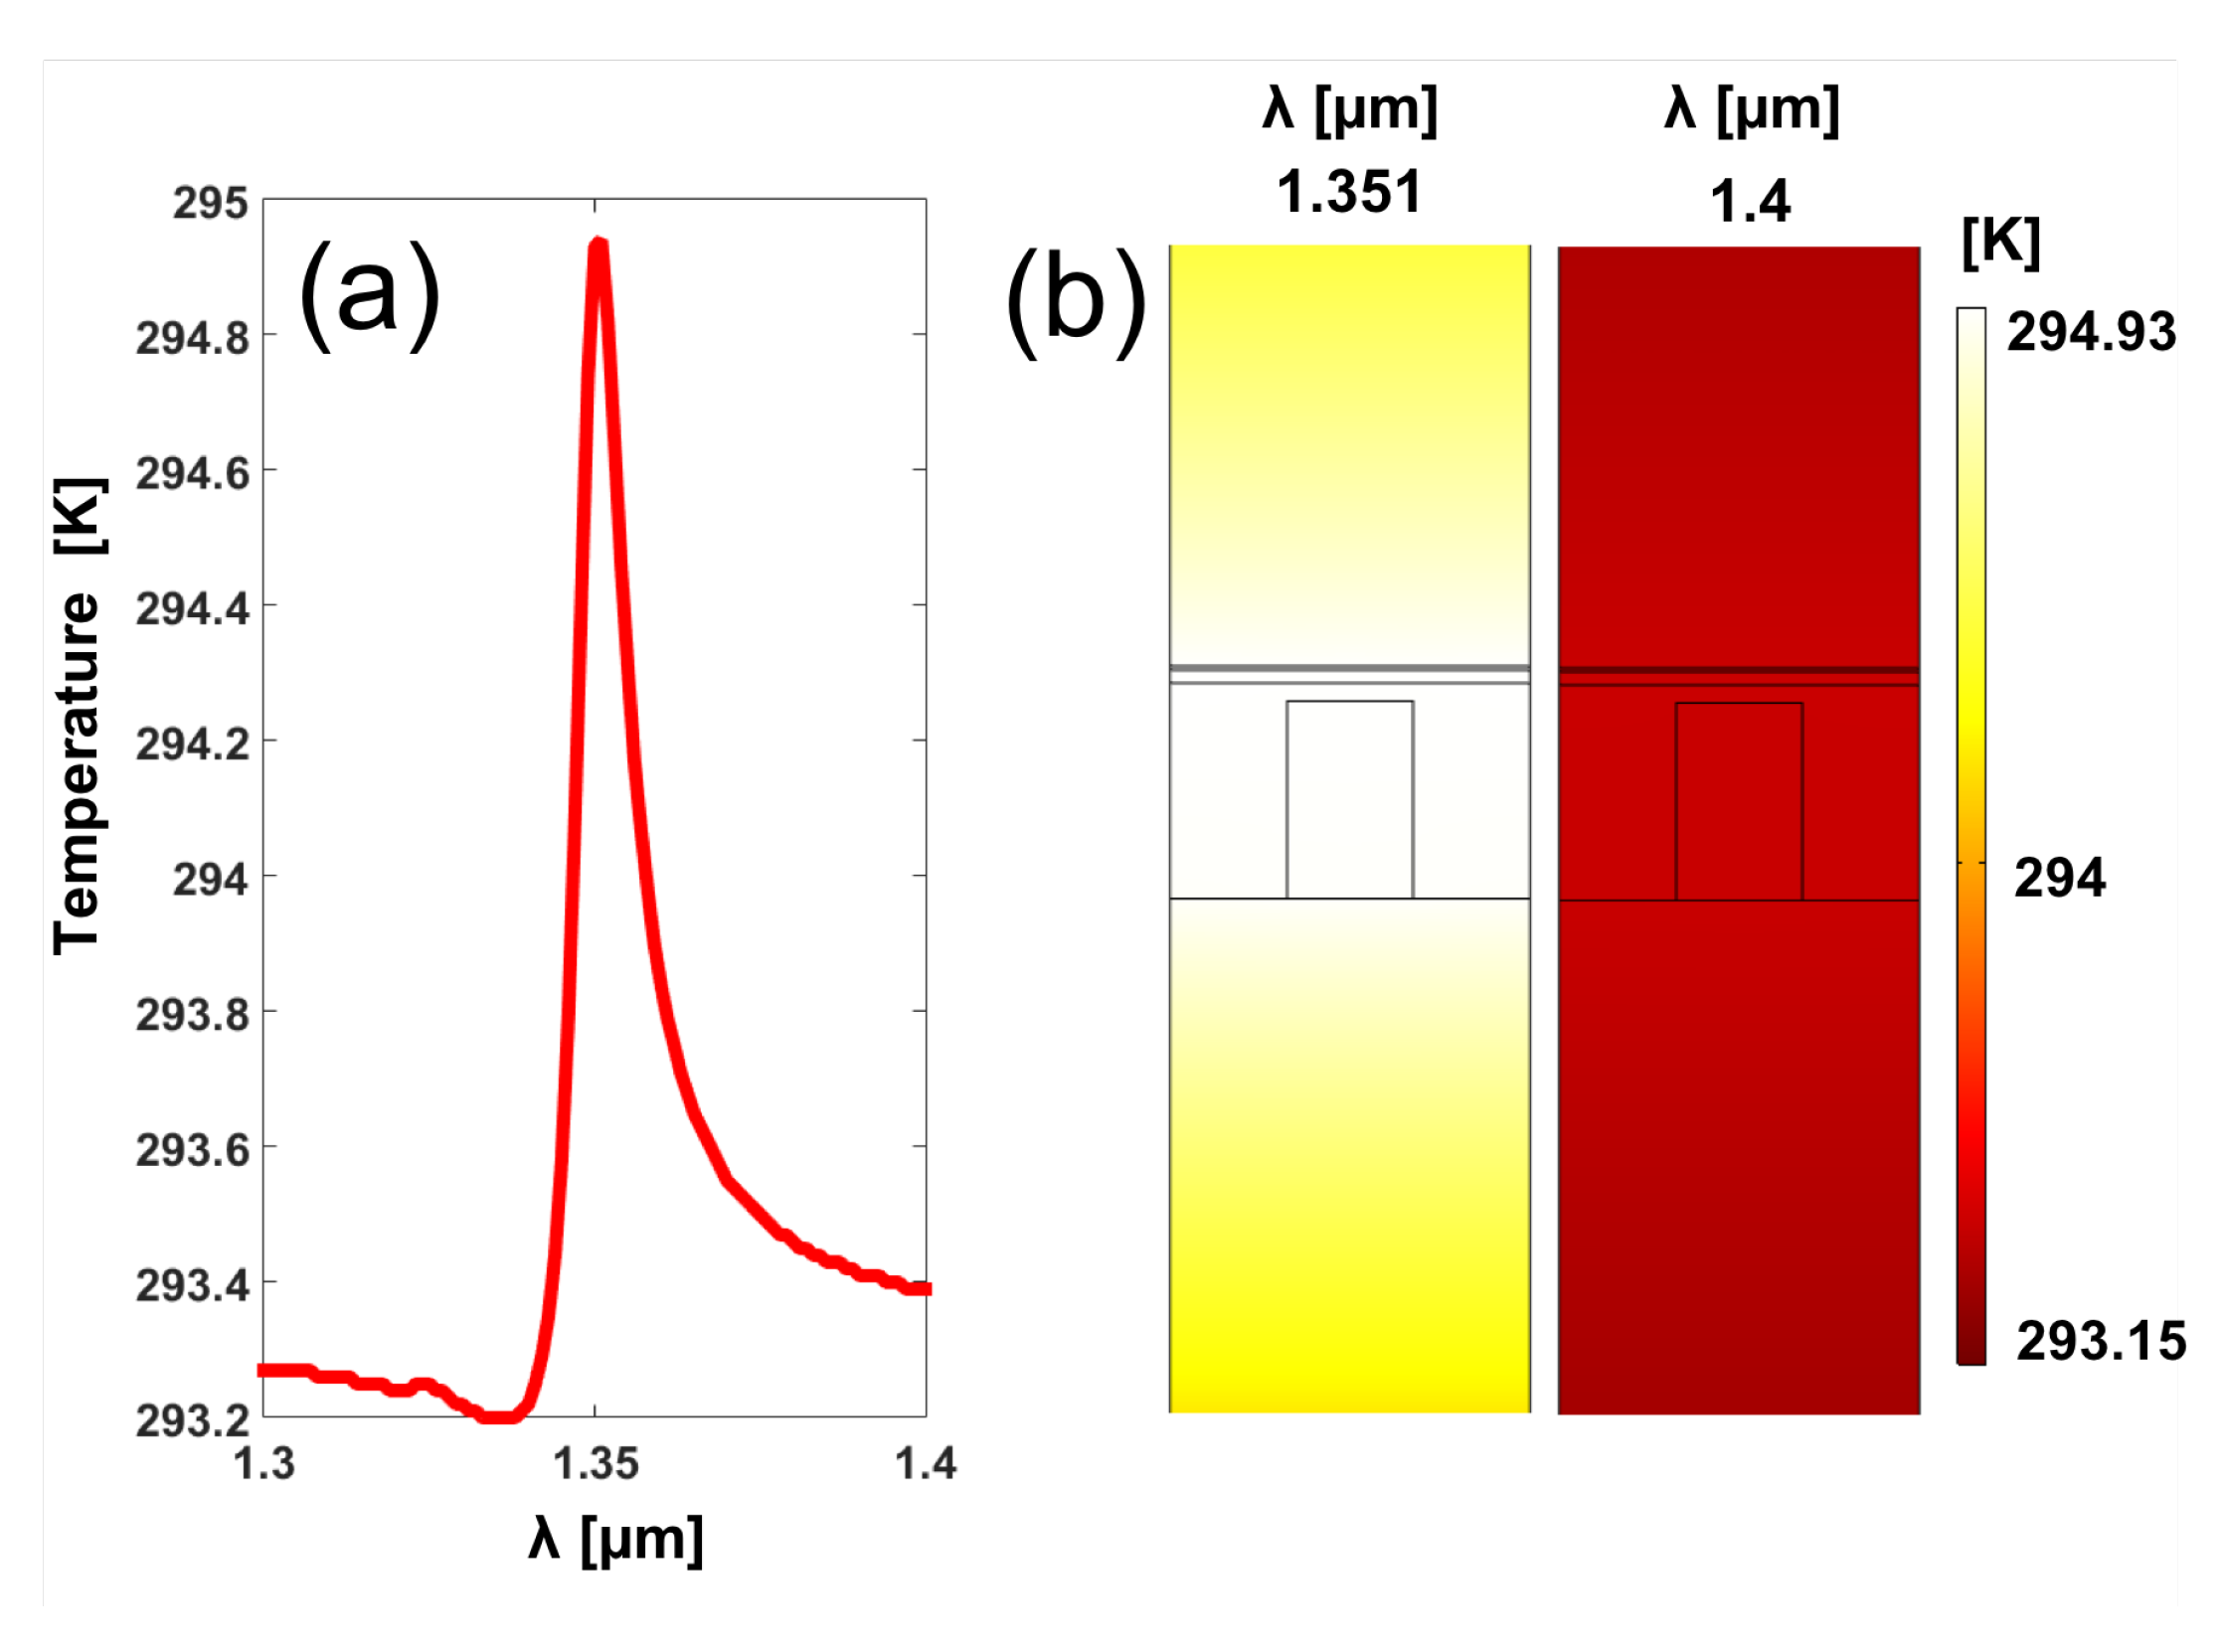
We consider an optical irradiance of 100 W/cm 2 and an initial temperature of 293.15 K. In this case Figure 3a shows the maximum temperature in terms of the wavelength of the illumination source. As expected from our design, the maximum response appears at λ res = 1.351   μ m. For this case, the temperature reaches a maximum of 294.9 K. Figure 3b represents the temperature maps at 1.351 μ m and 1.4 μ m wavelengths, resonant and non-resonant respectively. To isolate the environmental changes in temperature from those caused by a change in the refractive index, we can use a Wheatstone bridge where our sensor is combined with a dummy element that responds to the environmental temperature but it is not exposed to the analyte. This approach has been previously used with bolometric antenna-coupled detectors [29].
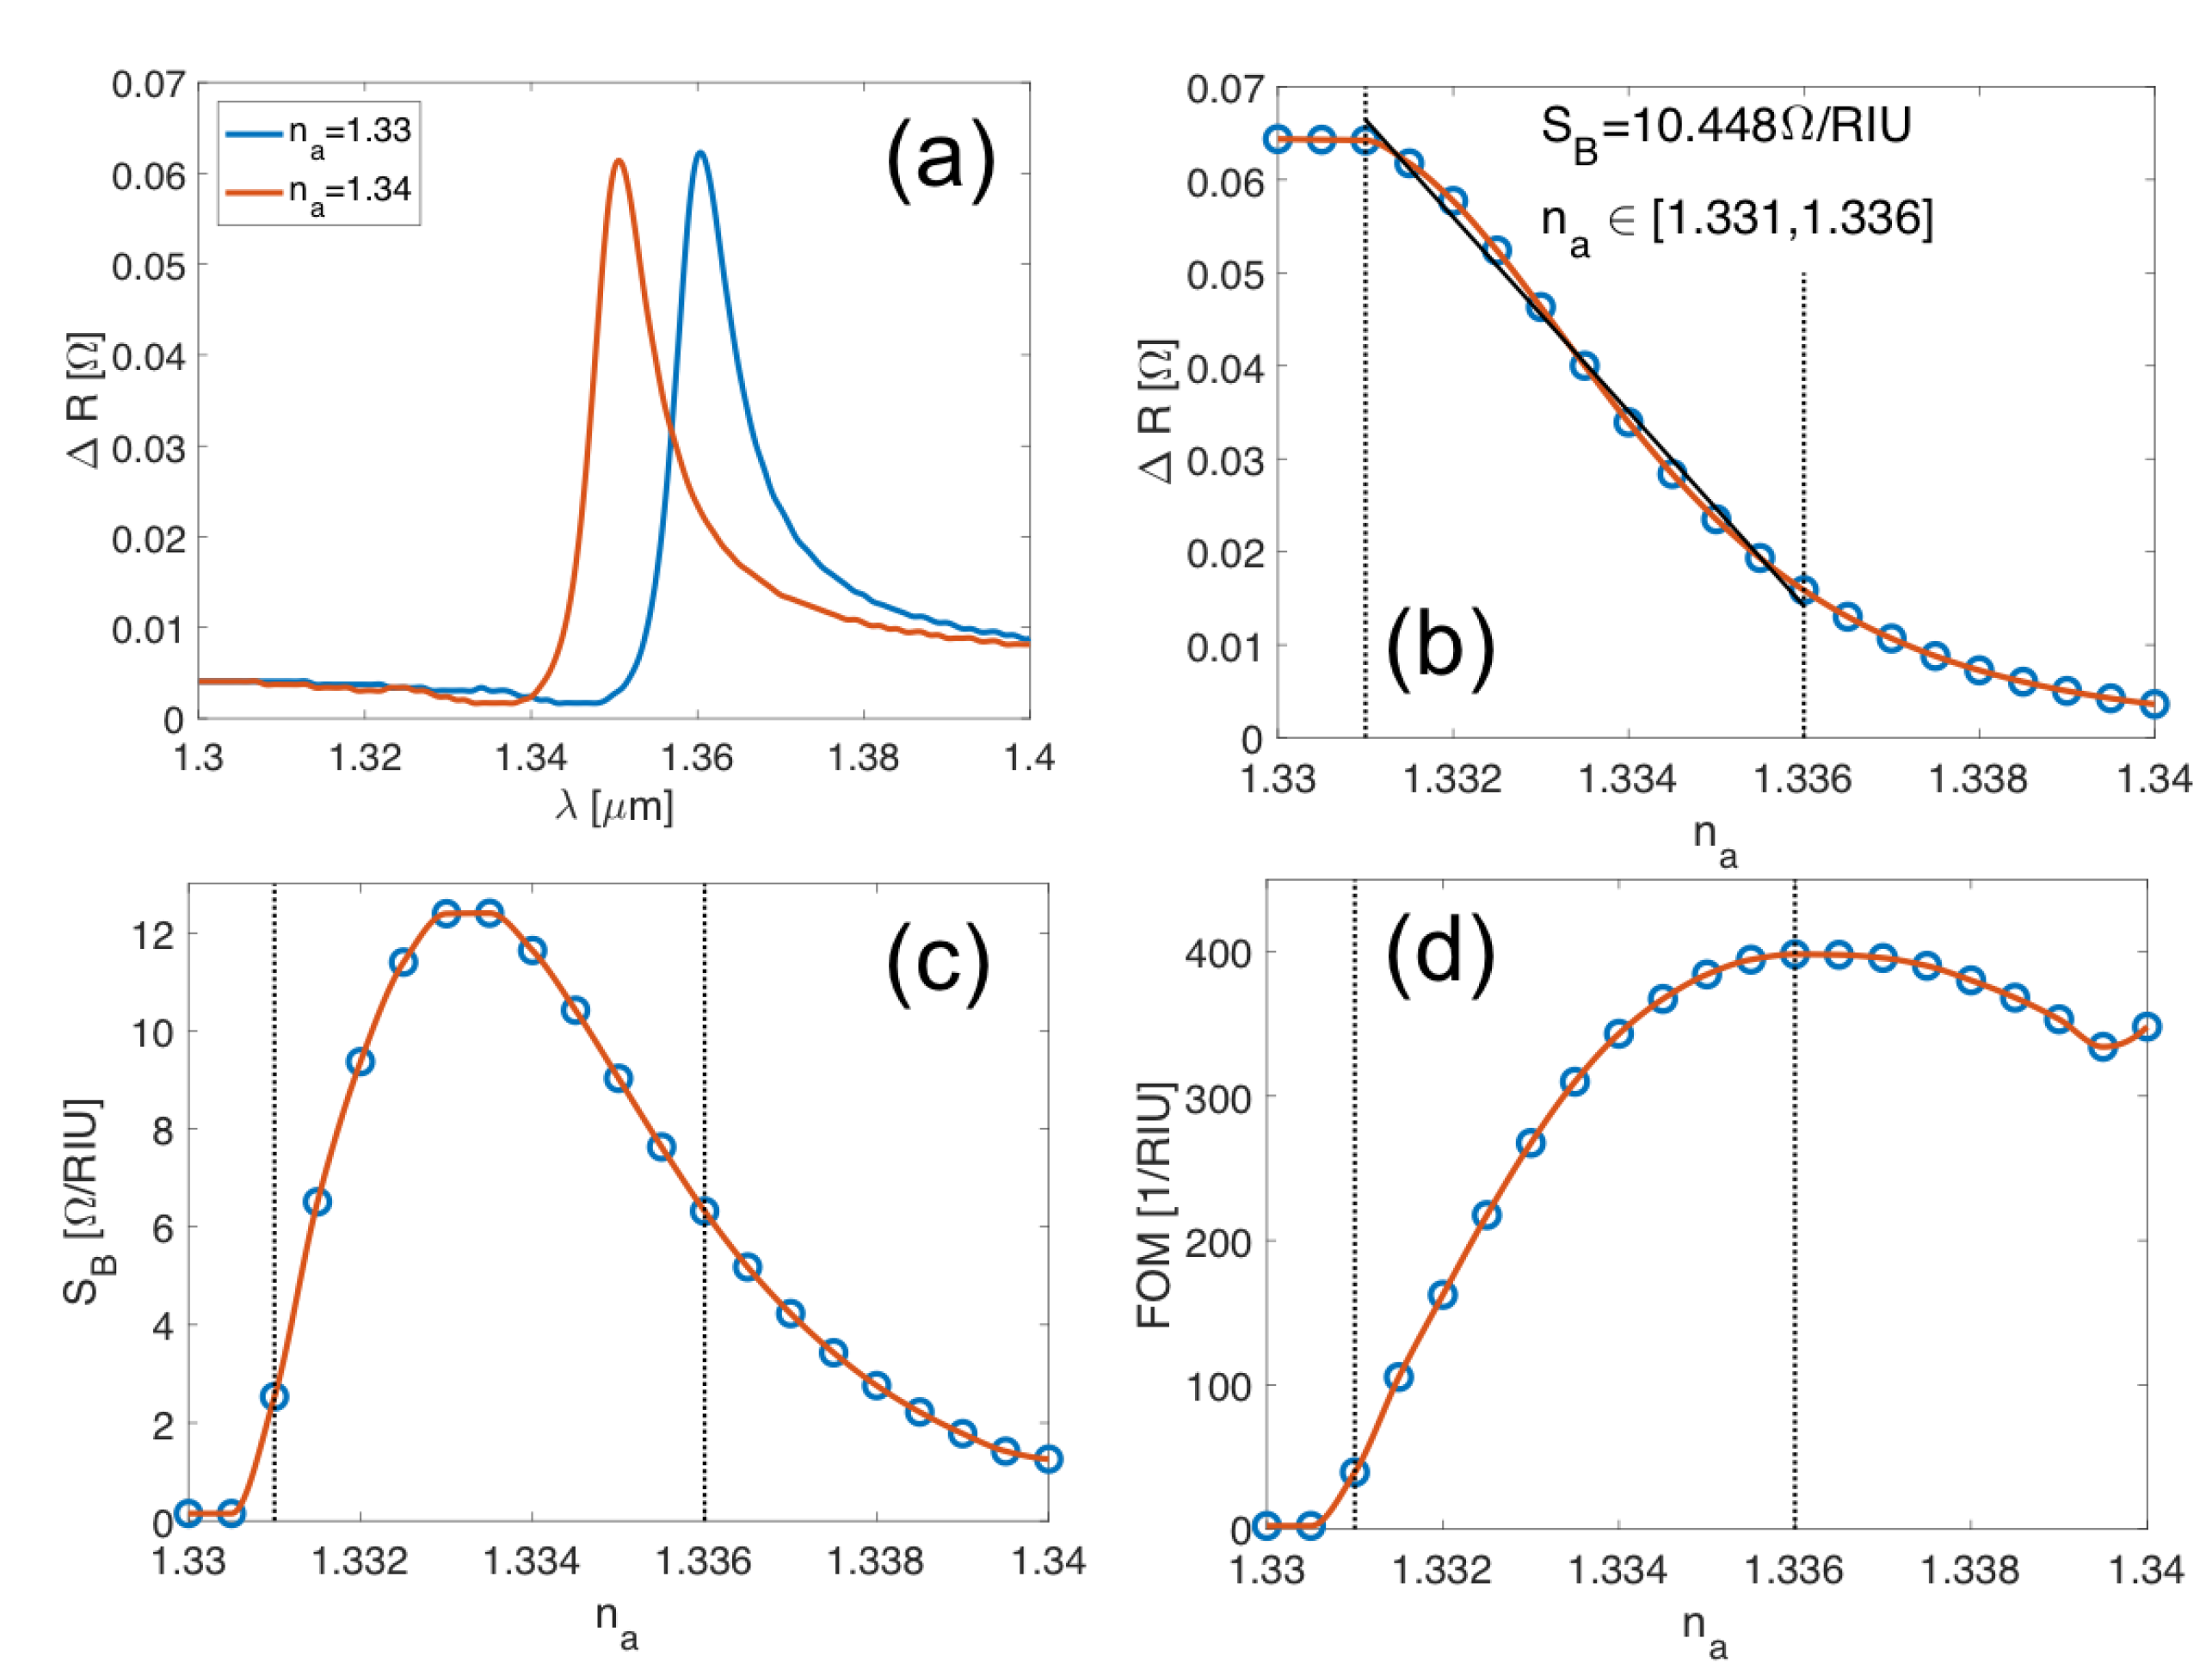
To read out the device’s response, the metal layer is connected to an external electric circuit (e.g., a voltage divider). The output from the bolometric element—the gold layer—also depends on the value of the resistance of the thin metal layer, R 0 . This value depends on the geometry as R 0 = ρ 0 L / ( t m × w ) , where ρ 0 is the resistivity of the metal at room temperature, L is the length, and the denominator contains the transversal section as the product of the thickness, t m , and the transversal width, w. For generality, we may approximate this value as R 0 = 10   Ω . The proposed device uses a 35 nm-thick layer of gold with resitivity ρ Au = 2.2 × 10 8 Ω . m [30]. As an example, an element with width w = 10   μ m, and length L = 160   μ m, generates a resistance of R 0 = 10.05   Ω . Therefore, we can see that the proposed element is small enough to allow a very compact design of the sensor, which is desiderable to measure tiny volumes of analyte, like human tear samples. In these conditions, the spectral variation of resistance also shows the peak at the resonant frequency (see Figure 4a). Therefore, by considering the physical mechanisms involved in the sensor, we obtain an electric signal related with the variation in the index of refraction of the analyte. As an example, we have calculated the spectral variation in resistance, Δ R ( λ ) , for two values of the index of refraction of the analyte, n a , 1 = 1.33 , and n a , 2 = 1.34 . We show how the resonant peaks move from λ 1 = 1.351   μ m to λ 2 = 1.361 μ m respectively. Figure 4b shows the change in resistance for a fixed value of the optical excitation at λ = 1.351   μ m; while the index of refraction of the analyte varies from 1.33 to 1.34. The response is symmetric when moving towards a lower index of refraction. For a practical operation of the device, as a bolometric system, its requires a connection to an external biasing source. Depending on the biasing strategy (voltage bias or current bias), the voltage change, Δ V out , due to a change in resistance, Δ R , is given as:
Δ V out , V bias = V bias R ext R 0 + R ext 2 Δ R ,
for a voltage bias, V bias , that sources a voltage divider with an external resistance R ext , and
Δ V out , I bias = I bias Δ R ,
for a current bias I bias . In both cases, the signal Δ V out is proportional to Δ R . The plots in Figure 4 represent the dependence of Δ V out with respect to the wavelength (see Figure 4a), and with respect to the index of refraction (Figure 4b). This dependence allows to define the sensitivity, S B , and the figure of merit (FOM) of this sensor [31,32]:
S B = n a ( Δ R ) ,
FOM = S B Δ R .
These expressions have been adapted from previously reported contributions where the change in the refractive index is caused by other parameters than wavelength (spectral interrogation) or angle (angular interrogation) [33,34,35,36]. For comparison, we model a Kretschmann’s design that uses a glass prism of refractive index 1.447 working at λ = 1.351 nm with a metallic gold layer 35 nm thick. This system provides an angular shift of 0.6 : when the refractive index of the analyte changes from 1.331 to 1.336. In reflectance, the full width at half maximum of the spectral line shape is 0.68 nm. This results in a sensitivity of S B = 120 deg/RIU and a FOM=176 RIU 1 (RIU means refractive index units). When necessary, full optimized results of angular interrogated devices are reported by Huang et al. [37]. Figure 4c,d show the sensitivity and FOM defined in Equations (6) and (7). We can see how S B reaches a maximum value of S B , max = 12.4 Ω / RIU at n a = 1.3335 , and FOM max = 398.2 at n a = 1.3360 . So, this would be best for aqueous samples. All these values are competitive with recently reported devices [24], plus it is based in a simpler physical mechanism [38]. Also, from Figure 4b we can make a linear fit of Δ R within a given range in the index of refraction. This fit reveals an almost linear dependence when n a [ 1.331 , 1.336 ] and sensitivity S B = 10.45   Ω / RIU . This range in the index of refraction of the analyte (marked between vertical dotted lines in Figure 4a–c) corresponds with a variation around n a = 1.333 , which is the index of refraction of water in the visible. Actually, this index slightly decrease when moving towards longer wavelengths. Therefore, this system seems appropriate to monitor parameters of substances in aqueous media. If necessary, the design can be tuned to perform at other ranges in the index of refraction by slightly modifying the geometry of the arrangement, for example, by changing the periodicity of the subwavelength grating, P [3]. In fact, a potential application of this design is the sensing of human tear with a refractive index n tear = 1.33698 ± 0.001 at λ = 589 nm [39,40], or the salinity of water with an index of refraction ranging from 1.33 till 1.35 [41,42].

4. Conclusions

We have shown a bolometric readout mechanism to extract the signal from a refractometric sensor based on SPR excitation caused by a nanostructured rectangular grating. Our approach exploits the metal, where the surface plasmon is originated, as part of an electric read-out circuit to measure a change in the index of refraction of the analyte. Its response is based on the narrow spectral absorption due to the excitation of plasmon resonances in the dielectric/metal interface. The absorbed power heats the metal and increases its temperature. This variation in temperature also modifies the resistance of the metal layer, and this change in resistance can be read-out by an external circuit. The main advantage of this structure compared to conventional refractometric sensors is its simplicity and signal acquisition robustness. The electric signal delivered by the sensor provides information about the index of refraction of the analyte. This allows for a compactness and integration, useful for applications where spectral or angular interrogation techniques are impossible. Also, the system can work as a refractometer for aqueous media. Both the sensitivity and the FOM can be adapted to the optoelectronic interrogation method, and the numerical results in the FOM are competitive with existing technologies. Although the values are not extremely high (FOM is in the few hundreds), the main advantage of this design is its capability to deliver the signal as an electric voltage, and that it works in normal incidence conditions, with a compact illumination source. Due to the micrometer size, it can measure tiny volumes of analyte, as happens in the analysis of human tears.

Author Contributions

All the authors contributed the same in conceptualization, for mal analysis, methodology, validation, visualization, and writing. M.H.E. and A.C. contributed to software analysis. J.A.G.-P. contributed in funding acquisition. J.A. contributed to supervision. All authors have read and agreed to the published version of the manuscript.

Funding

This contribution has been possible thanks to the Ministry of Higher Education of Egypt for funding the PhD stay of ME. The participation of AC and JAGP has been supported by the Ministerio de Economía y Competitividad of Spain through project DPI2016-75272-R.

Acknowledgments

The authors acknowledge Irene Alda for the edition of the English style and grammar of this manuscript, and for the fruitful discussions along the writing of this paper.

Conflicts of Interest

The authors declare no conflict of interest.

References

  1. Sukharev, M.; Seideman, T. Coherent control of light propagation via nanoparticle arrays. J. Phys. B At. Mol. Opt. Phys. 2007, 40, S283–S298. [Google Scholar] [CrossRef]
  2. Volpe, G.; Molina-Terriza, G.; Quidant, R. Deterministic Subwavelength Control of Light Confinement in Nanostructures. Phys. Rev. Lett. 2010, 105, 216802. [Google Scholar] [CrossRef] [PubMed]
  3. Elshorbagy, M.H.; Cuadrado, A.; Alda, J. High-sensitivity integrated devices based on surface plasmon resonance for sensing applications. Photonics Res. 2017, 5, 654–661. [Google Scholar] [CrossRef] [Green Version]
  4. Elshorbagy, M.H.; Cuadrado, A.; González, G.; González, F.J.; Alda, J. Performance Improvement of Refractometric Sensors Through Hybrid Plasmonic–Fano Resonances. J. Light. Technol. 2019, 37, 2905–2913. [Google Scholar] [CrossRef] [Green Version]
  5. Liu, N.; Mesch, M.; Weiss, T.; Hentschel, M.; Giessen, H. Infrared Perfect Absorber and Its Application As Plasmonic Sensor. Nano Lett. 2010, 10, 2342–2348. [Google Scholar] [CrossRef] [PubMed]
  6. Wang, H.; Kaur, S.; Elzouka, M.; Prasher, R. A nano-photonic filter for near infrared radiative heater. Appl. Therm. Eng. 2019, 153, 221–224. [Google Scholar] [CrossRef] [Green Version]
  7. Yilmaz, Y.A.; Alpkilic, A.M.; Tutgun, M.; Yilmaz, D.; Atalay, İ.A.; Yeltik, A.; Kurt, H. Inverse Design of Integrated Photonic Structures. In Proceedings of the 2019 21st International Conference on Transparent Optical Networks (ICTON), Angers, France, 9–13 July 2019; pp. 1–4. [Google Scholar] [CrossRef]
  8. Ghobadi, A.; Hajian, H.; Gokbayrak, M.; Butun, B.; Ozbay, E. Bismuth-based metamaterials: from narrowband reflective color filter to extremely broadband near perfect absorber. Nanophotonics 2019, 8, 823–832. [Google Scholar] [CrossRef]
  9. Zhang, L.; Wang, Y.; Zhou, L.; Chen, F. Tunable perfect absorber based on gold grating including phase-changing material in visible range. Appl. Phys. A 2019, 125, 368. [Google Scholar] [CrossRef]
  10. Makarov, S.; Furasova, A.; Tiguntseva, E.; Hemmetter, A.; Berestennikov, A.; Pushkarev, A.; Zakhidov, A.; Kivshar, Y. Halide-Perovskite Resonant Nanophotonics. Adv. Opt. Mater. 2019, 7, 1800784. [Google Scholar] [CrossRef]
  11. Das, A.; Heo, J.; Jankowski, M.; Guo, W.; Zhang, L.; Deng, H.; Bhattacharya, P. Room temperature ultralow threshold GaN nanowire polariton laser. Phys. Rev. Lett. 2011, 107, 066405. [Google Scholar] [CrossRef] [Green Version]
  12. Elshorbagy, M.H.; Cuadrado, A.; Alda, J. Plasmonic Sensor Based on Dielectric Nanoprisms. Nanoscale Res. Lett. 2017, 12, 580. [Google Scholar] [CrossRef] [PubMed] [Green Version]
  13. Herminjard, S.; Sirigu, L.; Herzig, H.P.; Studemann, E.; Crottini, A.; Pellaux, J.P.; Gresch, T.; Fischer, M.; Faist, J. Surface Plasmon Resonance sensor showing enhanced sensitivity for CO2 detection in the mid-infrared range. Opt. Express 2009, 17, 293–303. [Google Scholar] [CrossRef] [PubMed]
  14. Li, L.; Liang, Y.; Guang, J.; Cui, W.; Zhang, X.; Masson, J.F.; Peng, W. Dual Kretschmann and Otto configuration fiber surface plasmon resonance biosensor. Opt. Express 2017, 25, 26950–26957. [Google Scholar] [CrossRef] [PubMed]
  15. Guo, B.; Cheng, W.; Xu, Y.; Zhou, X.; Li, X.; Ding, X.; Ding, S. A simple surface plasmon resonance biosensor for detection of PML/RAR-α based on heterogeneous fusion gene-triggered nonlinear hybridization chain reaction. Sci. Rep. 2017, 7, 14037. [Google Scholar] [CrossRef] [Green Version]
  16. Fontana, E.; Kim, J.M.; Llamas-Garro, I.; Cavalcanti, G.O. Microfabricated Otto chip device for surface plasmon resonance-based optical sensing. Appl. Opt. 2015, 54, 9200–9204. [Google Scholar] [CrossRef]
  17. Kretschmann, E.; Raether, H. Notizen: Radiative Decay of Non Radiative Surface Plasmons Excited by Light. Z. Naturforschung A 2019, 23, 2135. [Google Scholar] [CrossRef]
  18. Otto, A. Theory of Plasmon Excitation in Thin Films by Electrons of Non-Normal Incidence. Phys. Status Solidi B 1967, 22, 401–406. [Google Scholar] [CrossRef]
  19. Jorgenson, R.; Yee, S. A fiber-optic chemical sensor based on surface plasmon resonance. Sens. Actuators B Chem. 1993, 12, 213–220. [Google Scholar] [CrossRef]
  20. Bingham, J.M.; Anker, J.N.; Kreno, L.E.; Van Duyne, R.P. Gas Sensing with High-Resolution Localized Surface Plasmon Resonance Spectroscopy. J. Am. Chem. Soc. 2010, 132, 17358–17359. [Google Scholar] [CrossRef] [Green Version]
  21. Kabashin, A.V.; Evans, P.; Pastkovsky, S.; Hendren, W.; Wurtz, G.A.; Atkinson, R.; Pollard, R.; Podolskiy, V.A.; Zayats, A.V. Plasmonic nanorod metamaterials for biosensing. Nat. Mater. 2009, 8, 867. [Google Scholar] [CrossRef]
  22. Cuadrado, A.; Alda, J.; Gonzalez, F.J. Distributed bolometric effect in optical antennas and resonant structures. J. Nanophotonics 2012, 6, 063512. [Google Scholar] [CrossRef]
  23. Cuadrado, A.; Alda, J.; González, F.J. Multiphysics simulation for the optimization of optical nanoantennas working as distributed bolometers in the infrared. J. Nanophotonics 2013, 7, 073093. [Google Scholar] [CrossRef] [Green Version]
  24. Tsukagoshi, T.; Kuroda, Y.; Noda, K.; Binh-Khiem, N.; Kan, T.; Shimoyama, I. Compact Surface Plasmon Resonance System with Au/Si Schottky Barrier. Sensors 2018, 18, 339. [Google Scholar] [CrossRef] [PubMed] [Green Version]
  25. Codreanu, I.; Gonzalez, F.J.; Boreman, G.D. Detection mecahnisms in microstrip dipole antenna-coupled infrared detectors. Infrared Phys. Technol. 2003, 44, 155–163. [Google Scholar] [CrossRef]
  26. Alda, J.; Boreman, G.D. Infrared Antennas and Resonant Structures; SPIE: Bellingham, WA, USA, 2017. [Google Scholar]
  27. Abutoama, M.; Abdulhalim, I. Self-referenced biosensor based on thin dielectric grating combined with thin metal film. Opt. Express 2015, 23, 28667–28682. [Google Scholar] [CrossRef]
  28. Bharadwaj, P.; Bouhelier, A.; Novotny, L. Electrical excitation of surface plasmons. Phys. Rev. Lett. 2011, 106, 226802. [Google Scholar] [CrossRef]
  29. Krenz, P.; Alda, J.; Boreman, G. Orthogonal infrared dipole antenna. Infrared Phys. Technol. 2008, 51, 340–343. [Google Scholar] [CrossRef]
  30. Lide, D.R. Handbook of Chemistry and Physics, 75th ed.; CRC Press: Boca Raton, FL, USA, 1997. [Google Scholar]
  31. Zheng, G.; Cong, J.; Xu, L.; Wang, J. High-resolution surface plasmon resonance sensor with Fano resonance in waveguide-coupled multilayer structures. Appl. Phys. Express 2017, 10, 042202. [Google Scholar] [CrossRef]
  32. Nesterenko, D.V.; Sekkat, Z. Resolution Estimation of the Au, Ag, Cu, and Al Single- and Double-Layer Surface Plasmon Sensors in the Ultraviolet, Visible, and Infrared Regions. Plasmonics 2013, 8, 1585–1595. [Google Scholar] [CrossRef]
  33. Wiki, M.; Kunz, R. Wavelength-interrogated optical sensor for biochemical applications. Opt. Lett. 2000, 25, 463–465. [Google Scholar] [CrossRef]
  34. Cottier, K.; Wiki, M.; Voirin, G.; Gao, H.; Kunz, R. Label-free highly sensitive detection of (small) molecules by wavelength interrogation of integrated optical chips. Sens. Actuators B Chem. 2003, 91, 241–251. [Google Scholar] [CrossRef]
  35. Guo, J.; Keathley, P.D.; Hastings, J. Dual-mode surface-plasmon-resonance sensors using angular interrogation. Opt. Lett. 2008, 33, 512–514. [Google Scholar] [CrossRef] [PubMed]
  36. Yih, J.N.; Chien, F.C.; Lin, C.Y.; Yau, H.F.; Chen, S.J. Angular-interrogation attenuated total reflection metrology system for plasmonic sensors. Appl. Opt. 2005, 44, 6155–6162. [Google Scholar] [CrossRef] [PubMed]
  37. Huang, D.W.; Ma, Y.F.; Sung, M.J.; Huang, C.P. Approach the angular sensitivity limit in surface plasmon resonance sensors with low index prism and large resonant angle. Opt. Eng. 2010, 49, 1–6. [Google Scholar] [CrossRef]
  38. Wen, L.; Liang, L.; Yang, X.; Liu, Z.; Li, B.; Chen, Q. Multiband and Ultrahigh Figure-of-Merit Nanoplasmonic Sensing with Direct Electrical Readout in Au-Silicon Nanojunction. ACS Nano 2019, 13, 6963–6972. [Google Scholar] [CrossRef]
  39. Craig, J.P.; Simmons, P.A.; Patel, S.; Tomlison, A. Refractive Index and Osmolality of Human Tears. Optom. Vis. Sci. 1995, 72, 718–724. [Google Scholar] [CrossRef]
  40. Dos Santos, V.A.; Schmetterer, L.; Gröschl, M.; Garhofer, G.; Schmidl, D.; Kucera, M.; Unterhuber, A.; Hermand, J.P.; Werkmeister, R.M. In vivo tear film thickness measurement and tear film dynamics visualization using spectral domain optical coherence tomography. Opt. Express 2015, 23, 21043–21063. [Google Scholar] [CrossRef]
  41. Austin, R.; Halikas, G. The Index of Refraction of Seawater; Technical report; University of California San Diego: La Jolla, CA, USA, 1976. [Google Scholar]
  42. Quan, X.; Fry, E.S. Empirical equation for the index of refraction of seawater. Appl. Opt. 1995, 34, 3477–3480. [Google Scholar] [CrossRef]
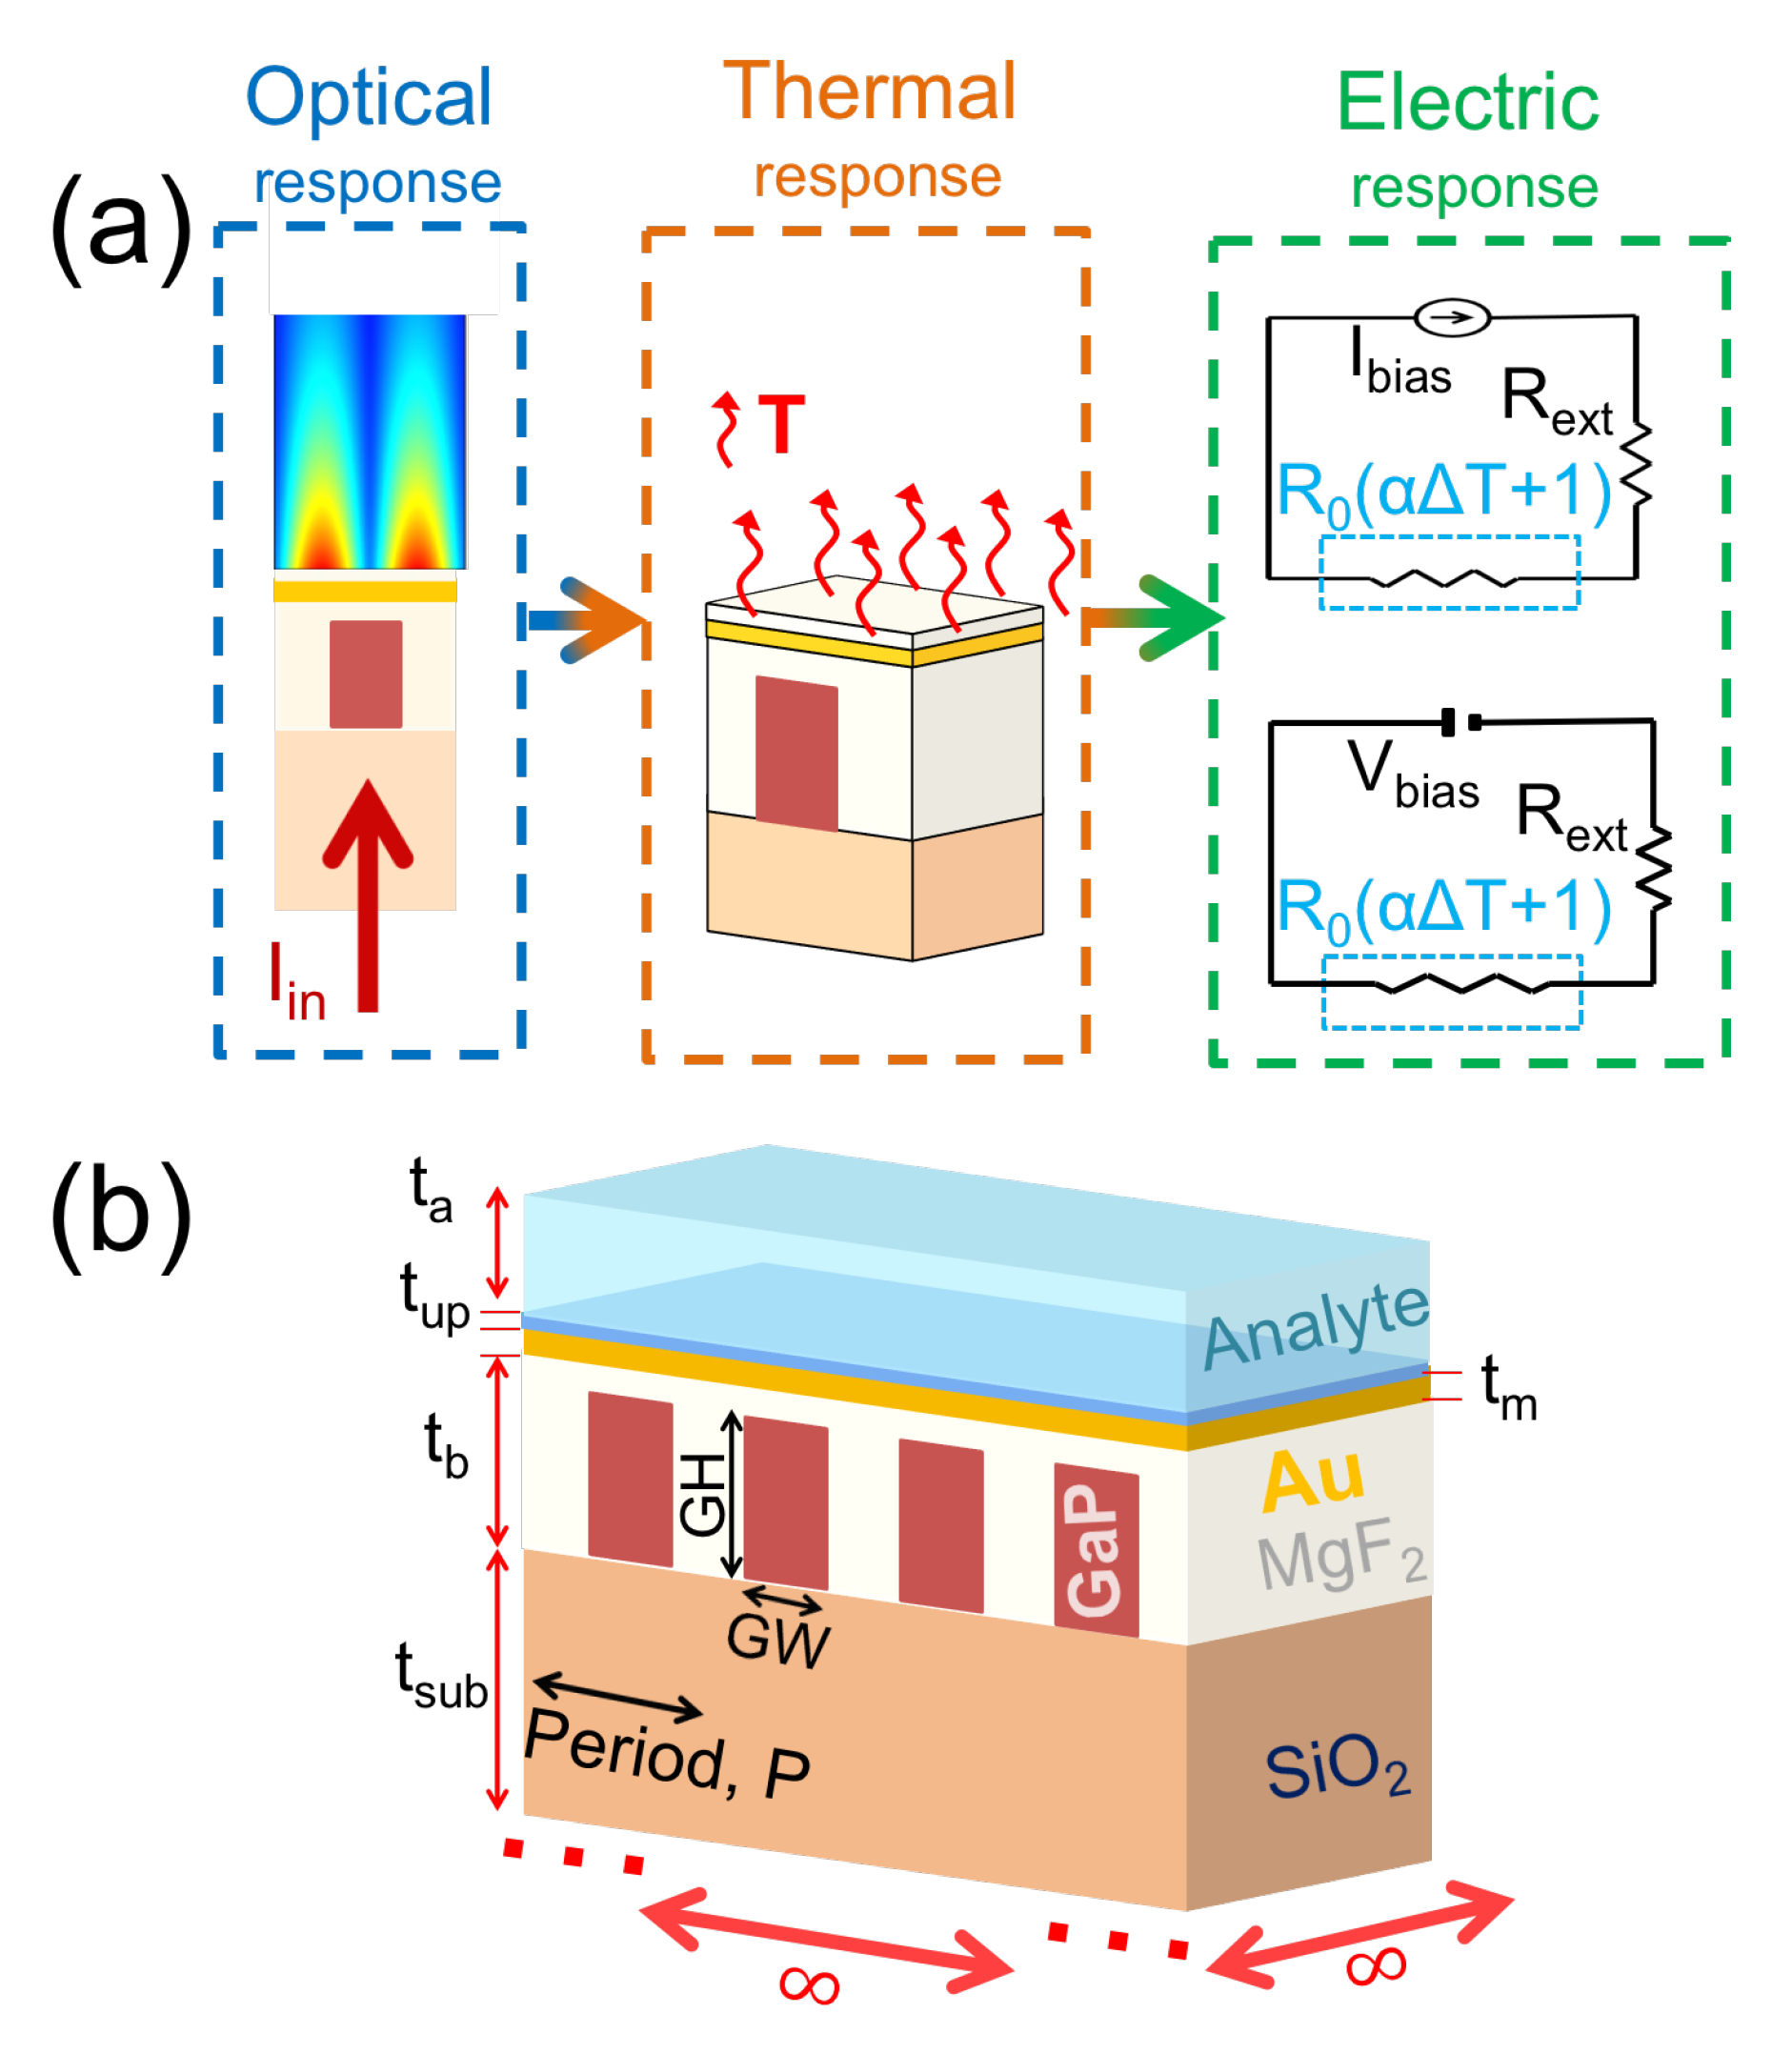
Figure 1. (a) Schematic representation of the physical phenomena (optical, thermal, and electronic responses) present in the proposed device. At the resonant wavelength, the excited plasmons (optical response) enhance absorption within the metal which increases its temperature (thermal response). This temperature increase also changes the electric resistivity of the metal layer, through the bolometric effect, which is read by an external circuit (electric response). (b) Geometric and material arrangement of our structure.
Applsci 10 01211 g001
Figure 2. (a) Spectral absorption of the structure showing the resonance peak at λ = 1.351 μ m. (b) Magnetic field enhancement maps for several wavelengths ( λ = [ 1.3 , 1.351 , 1.4 ]   μ m).
Applsci 10 01211 g002
Figure 3. (a) Maximum temperature reached at the structure in terms of the wavelength. (b) Temperature distribution within the structure for the resonant ( λ = 1.351   μ m) and non-resonant ( λ = 1.400   μ m) wavelengths.
Applsci 10 01211 g003
Figure 4. (a) Variation of the resistance of the structure as a function of wavelength. (b) Variation of the resistance with the index of refraction of the analyte when the structure is illuminated on resonance ( λ = 1.351   μ m). The linear fitting in the interval n a [ 1.331 , 1.336 ] defines a value of sensitivity, S B = 10.45 Ω / RIU (where RIU means refractive index units). (b) Variation of the sensitivity, S B , as a function of the index of refraction of the analyte, n a . (d) Dependence of the FOM in terms of n a . The open circles in (bd) denote the evaluated values, and the solid lines represent an interpolation of these dependences. The vertical dotted lines in (bd) show the range in the index of refraction, n a , where the system is linear.
Applsci 10 01211 g004
Table 1. Dimensional and material constants of the device. The optical constants are given at λ 0 = 1.35 μ m.
MaterialDimensions [nm]nk [W/mK]
SiO 2 (substrate) t sub = n SiO 2 = 1.447 1.3
GaP GW = 350 n GaP = 3.14 110
GH = 550
P = 1000
MgF 2 t b = GH + 50 = 600 n MgF 2 = 1.372 27
Au t m = 35 n Au = 0.411 + i 9.185 310
SiO 2 t up = 10 n SiO 2 = 1.447 1.3
Aqueous medium (analyte) t a = n a = 1.33