Article

A Holistic Approach to Guarantee the Reliability of Positioning Based on Carrier Phase for Indoor Pseudolite

1
School of Geodesy and Geomatics, Wuhan University, Wuhan 430079, China
2
Research Center for High Accuracy Location Awareness, Wuhan University, Wuhan 430079, China
3
Guangxi Key Laboratory of Spatial Information and Geomatics, Guilin 541004, China
4
College of Geology Engineering and Geomatics, Chang’an University, Xi’an 710054, Shannxi, China
5
State Key Laboratory of Information Engineering in Surveying, Mapping and Remote Sensing, Wuhan University, Wuhan 430079, China
*
Authors to whom correspondence should be addressed.
Appl. Sci. 2020, 10(4), 1199; https://doi.org/10.3390/app10041199
Submission received: 15 January 2020 / Revised: 6 February 2020 / Accepted: 6 February 2020 / Published: 11 February 2020
(This article belongs to the Special Issue Recent Advances in Indoor Localization Systems and Technologies)

Abstract

:

Featured Application

This work is potentially applied to indoor high-precision engineering/industrial measurement, such as parts installation, tunnel engineering, dynamic rail inspection, path planning, etc. Especially in case of pseudolite faulty, the reliability and availability of positioning can be guaranteed.

Abstract

The integrity monitoring algorithm based on pseudorange observations has been widely used outdoors and plays an important role in ensuring the reliability of positioning. However, pseudorange observations are greatly affected by the error sources such as multipath, clock drift, and noise in indoor pseudolite system, thus the pseudorange observations cannot be applied to high-precision indoor positioning. In general, double differenced (DD) carrier phase observations are used to obtain a high-precision indoor positioning result. What’s more, the carrier phase-based integrity monitoring (CRAIM) algorithm is applied to identify and exclude potential faults of the pseudolites. In this article, a holistic method is proposed to ensure the accuracy and reliability of positioning results. Firstly, if the reference pseudolite operates normally, extended Kalman filter is used for parameter estimation on the premise that the number of common pseudolites meets positioning requirements. Secondly, the innovation sequence in the Kalman filter is applied to construct test statistics and the corresponding threshold is determined from the Chi distribution with a given probability of false alert. The pseudolitehorizontal protection level (HPL) is calculated by the threshold and a prior probability of missed detection. Finally, compared the test statistics with the threshold to exclude the faultypseudolite for the reliability of positioning. The experiment results show that the proposed method improves the accuracy and stability of the results through faults detection and exclusion. This method ensures accuracies at the centimeter level for dynamic experiments and millimeter levels for static ones.

1. Introduction

The global navigation satellite system (GNSS) has been widely applied in outdoor positioning. Nevertheless, it is difficult to obtain reliable GNSS signals in sheltered environments or indoors [1], where a pseudolite system can make up for the shortage of GNSS [2,3].
Relative to the GNSS, indoor pseudolite observations have no tropospheric and ionospheric errors. The PL/receiver clock and antenna phase error can also be eliminated by DD observations which greatly reduce the difficulty in processing error sources in indoor PL positioning [4]. However, the multipath effect, noise, and fixed satellite constellations are still the problems indoors. What is worse, the indoor pseudolite system has a great nonlinear effect due to the close distance between the receivers and pseudolites. If initial position estimation has poor accuracy, the nonlinear error caused by linearization will be severe. Therefore, large code measurement errors caused bythe above factors may result in low accuracy and reliability of positioning results.
At present, the research on the indoor pseudolite system mainly focuses on the design of pseudolite constellation or high-precision positioning based on the carrier phase, but few on the reliability of positioning. According to quality control methods of GNSS carrier phase positioning, they can be divided into two categories: priori and posteriori quality control methods. As to priori methods, there are some classical methods, such as cycle slip detection, DD method. Cycle slip detection can effectively eliminate such faults as cycle slip or signal interruption. The double differenced method will eliminate clock difference and weaken troposphere and ionosphere delays. In general, the posteriori quality control method does not distinguish which kind of error sources, such as RAIM, IGG III, and variance component estimation. These methods can effectively improve the positioning accuracy. However, the existing legacy approaches cannot eliminate all faults, such as multipath effect, noise and so on, which is also the current problem. In an indoor environment, the influence of multipath and noise is greater than outdoors. A holistic approach to guarantee the reliability of positioning for indoor pseudolite based on carrier phase is proposed and the feasibility of the method is verified by some experiments. The proposed method creatively considers the fault of indoor positioning source (pseudolite) and other error sources, including complete fault detection, exclusion procedure, andformula derivation of pseudolite protection level. Faults on reference pseudolite are also considered. Although we cannot deal with any specific error source, the data with poor quality can be effectively identified no matter which error source. By excluding the corresponding epochs, the positioning accuracy and reliability will be guaranteed.
The research on indoor pseudolite high-precision positioning algorithms has become a hotspot in recent years and the key is to use carrier phase observations and ambiguity resolution [4,5,6].Reference [4] has successfully introduced AFM (Ambiguity Function Method) into PL-AR (Pseudolite-Ambiguity Resolution). However, due to the multi-peak characteristic of AFM, the reliability of the solutions is sometimes difficult to be guaranteed compared with the LAMBDA method. In addition, the way to ensure the reliability of positioning has not been discussed. References [5,6] proposed a new OTF-AR method for ground-based positioning systems which solely relies on carrier phase measurements and applies to cases where no sufficiently accurate measurements were provided in advance; however, the gross error must be given careful consideration in practical applications and the experiments in the references were conducted under relatively good conditions. Actually, it is the poor conditions that lead to unreliable positioning results. Some research institutes used KPI when LAMBDA and ratio tests are applied to obtain the integer ambiguity resolution [7]. The most mature indoor pseudolite system is produced by LOCATA [8]. ProprietaryTimeLoc technology is utilized for tight time synchronization, allowing the clock difference in the carrier phase measurement equation to be ignored. The horizontal error of the non-differential positioning is less than 6 cm, and the precision of the altitude direction is about 15 cm [9]. The frequency stability and accuracy of the PL clock are much inferior to the GPS, and PL clock errors are difficult to obtain accurately [2]. Although LOCATA can ensure PL clock synchronization, many pseudolite systems lack this costly technology at present. Reference [10] achieved centimeter-level PPP (Precise point positioning) results with a new prototype pseudolite system without relying on accurate time synchronization. It is believed that PL would be more extensively applicable for integration with GNSS and INS (Inertial Navigation System). Reference [11] proposed a new concept of pseudolite-based navigation to overcome the receiver modification problem of systems. However, only meter-level positioning precision could be achieved in poor geometry tests. References [10,11] did not consider quality control under severe conditions as well. In reference [12], Xu et al. built a new pseudolite-based indoor positioning system and the clock could be synchronized with each other. Nevertheless, only simulated data wereused to obtain high-precision positioning results. References [13,14] believed that the convergence precision of initial coordinate values was important for positioning, but how to ensure centimeter-level positioning precision has not been considered with bad initial coordinate value. Reference [15] used carrier interferometry to conduct analyses on indoor pseudolite positioning. However, this method has great limitations in applications. Reference [16] proposed a new method for indoor pseudolite positioning based on AFM and DD pseudorange observations with good data. However, it is generally known that data quality has a great influence on the AFM.
Current high-precision PL positioning algorithms mainly are applied based on carrier phase observations. However, the indoor environment is more severe than outdoors. Whether the carrier phase observations or the positioning results are reliable remains to be discussed. To the authors’ knowledge, there are few methods to guarantee the reliability of the results for indoor pseudolite positioning and no effective strategy to ensure the positioning accuracy whena fault happens. Therefore, the application of receiver autonomous integrity monitoring (RAIM) for pseudolite system is of great significance in practical positioning.
There are two types of RAIM algorithm, snapshot RAIM, and sequential RAIM. The snapshot RAIM includes the parity vector method, the least-square residual method [17,18,19], weighted RAIM algorithm, etc. Sequential RAIM is almost based on the Kalman filter which is an indispensable component of many navigation systems [20]. In view of the above, the carrier phase-based RAIM (CRAIM) algorithm [21] proposed by Feng.was applied tothe high-precision positioning of the indoor pseudolite system. Reference [22] proposed an INS-assisted RAIM algorithm to increase the level of reliability and integrity for an integrated navigation system. Reference [23] explored the application of the snapshot RAIM method for GNSS vessel receivers when space segment geometry was poor. However, the proposed algorithm did not discuss how to determine the protection level with a given probability of missed detection (MD) and false alarm (FA). Reference [24] showed a correlation between traditional Shapiro-Wilk test statistics when multiple faults occur. The paper proposed a criterion to overcome the correlation based on the reliability principle and designed a multi-fault processing method based on an extended Shapiro-Wilk test. Li et al. proposed a complete algorithm to ensure reliability in attitude measurement [25]. In this article, a new integrity monitoring method was proposed for the GNSS-based attitude determination and they constructed the test statistic by using the measurement residuals to detect the potential failure. Furthermore, they derived the attitude protection level based on the worst-case protection concept under the multiple faults hypothesis. Reference [26] indicated that carrier phase observations error does not subject to the standard normal distribution and a carrier phase-based RAIM algorithm using a Gaussian sum filter was proposed. Since pseudorange-based RAIM (PRAIM) cannot meet the requirement of PPP, References [27,28,29] applied CRAIM to GNSS PPP and RTK algorithm for airport surface movement. Similar to GNSS PPP and RTK, carrier phase observations must also be used in high-precision indoor pseudolite positioning. In references [30,31], a specific algorithm for multiple constellations was studied and a method of integrity monitoring-based ambiguity validation for triple-carrier ambiguity resolution was proposed. They considered that ambiguity validation methods include the ratio test, the quantitative evaluation based on the success rate and the equivalent failure rate of ambiguity resolution. However, the ambiguity correctness validation cannot necessarily guarantee the reliability of indoor pseudolite positioning. Sometimes, an incorrectly fixed ambiguity will be obtained because of the severe environment and the poor satellite geometry. Therefore, it is necessary to carry out the integrity monitoring for indoor pseudolite rather than solely using the ambiguity validation method.
The RAIM algorithm is mainly used in safety-critical fields such as aircraft navigation at present and is almost unmanned in indoor pseudolite. In fact, indoor pseudolite positioningis seriously influenced by many environmental factors, such as people’s walking, multipath effects from wallsand so on. Sometimes it is difficult to obtain a high-precision position result. In addition, even if a specific positioning result can be obtained, the reliability may not be guaranteed. This paper focuses on the RAIM algorithm of indoor pseudolite system based on EKF, including PRAIM and CRAIM algorithm. Some experiments are operated to verify the feasibility of the indoor pseudolite RAIM algorithm and the reliability of the positioning results, which can expand the availability of pseudolite positioning. According to the actual characteristics of pseudolite, an algorithm to guarantee the accuracy and reliability of indoor positioning for pseudolite based on CRAIM is proposed, which is named PLRAIM (Pseudolite based RAIM). It is especially important to use this method in harsh indoor environments.

2. Algorithm

The algorithm includes two aspects, the calculation of the protection level and fault detection. All algorithms in this paper are implemented in horizontal positioning.

2.1. Double Differenced Positioning Algorithm in Pseudolite System

2.1.1. Observation Model in Pseudolite System

Due to the complex indoor environment and the poor stability of commercial pseudolite clocks, the pseudolite high-precision positioning algorithms are generally realized based on DD carrier-phase positioning mode. The error of clock synchronization and antenna phase can be eliminated or weakened by theDD model [32]. The DD observations do not include tropospheric and ionospheric delay because the signal from the pseudolite itself does not pass through the troposphere and ionosphere. Furthermore, since the pseudolite constellation is fixed, there are no ephemeris errors and relativistic effects. Therefore, the indoor single-frequency pseudolite DD observation equations can be formulated as [33,34,35],
Δ P b r k s = Δ ρ b r k s + Δ e P + Δ M P Δ L b r k s = λ 1 Δ φ b r k s = Δ ρ b r k s + Δ ε L + Δ m L + λ 1 Δ N b r k s
where Δ is a DD operator; r and b represent the rover and base stations, respectively. k and s represent pseudolites. The pseudorange and carrier phase observations are represented by P and φ. ρ represents the geometric distance between pseudolites and the receivers. e and ε denote the noise of the pseudorange and carrier phase observations, respectively. M and m represent the multipath effects of pseudorange and carrier phase observations. N indicates the integer ambiguities of carrier phase observations. λ indicates the wavelength.

2.1.2. Parameter Estimation

Extended Kalman filter (EKF) is applied to estimate the parameters ina high-precision positioning solution. EKF is mainly to solve the linearization problem in KF. It can be considered that the coordinates remain the same because the rover station is a state of low dynamic or static in indoor positioning. The transition matrix is I and the covariance matrix of the system process noise is O. The measurement noise should be considered. The observation and the state model are as follows,
X k = Φ k 1 X k 1 + ω k 1 Z k = H k X k + v k
where k is the current epoch. X represents the state vector. Φ is the transition matrix I. ω is the dynamic process noise of the system. Z is a measurement vector after linearization. H is a design matrix [Ir λ] and v indicates the measurement noise. If the dynamic process noise and the measurement noise of the system are Gaussian white noise, then the parameters have the following statistical characteristics,
E ( ω k ) = 0 , C o v ( ω k , ω k ) = Q k E ( v k ) = 0 , C o v ( v k , v k ) = R k C o v ( ω k , v k ) = 0
After the initial coordinate being obtained, the corresponding initial state parameter X0 and its variance-covariance matrix P0 can be given. The basic formula of EKF follows,
K k = P k ( ) H k T W k W k = ( H k P k ( ) H k T + R k ) 1 P k ( ) = Φ k 1 | k P k 1 ( + ) Φ k 1 | k T + Q k 1 , P k ( + ) = ( I K k H k ) P k ( ) X k ( ) = Φ k 1 X k 1 ( + ) , X k ( + ) = X k ( ) + K k V k V k = Z k H k X k ( )
where subscript k denotes the current epoch. X is state vector; P is covariance matrix. K is Kalman gain matrix and V is innovation vector. W is weight matrix. R is measurement noise matrix. (+) and (−) denote predicted and updated values. When positioning, the iterative EKF is usually used to weaken the linearization error. In order to avoid the problem of divergence caused by the imprecise of a given dynamic model during filtering, the weight can be adjusted according to the residual matrix to achieve the robust Kalman filter [36].

2.2. The Procedure of PLRAIM

The reliability of the positioning algorithm to obtain the rover coordinates is greatly affected by multipath and ambiguity resolution. Therefore, this paper focuses on studying the reliability of positioning results. Integrity monitoring mainly includes two aspects: fault detection and alert and availability of the RAIM algorithm. The main idea is to detect and excludefaultsbased on the consistency between redundant observations [37,38]. The construction of test statistics is one of the key factors, consequently. Considering the actual situation of our indoor pseudolite positioning system, the steps of PLRAIM are as follows:
(a) Obtain data of rover and base station and ensure there are more than three common visible pseudolites in order for the horizontal positioning to be performed;
(b) Judge fault on reference pseudolite (rpl). After the reference pseudolite is determined by the elevation angle, the priori residuals of DD pseudorange observations can be calculated. If the residuals of all DD observations perform largely, it can be considered that the reference pseudolite is faulty and it should be replaced by another one;
(c) When the number of common pseudolites meets requirements and reference pseudolite is normal, parameter estimation and ambiguity resolution will be performed. The classical LAMBDA method is used for ambiguity resolution (AR) [39,40];
(d) Judge the availability of RAIM. Compare HPL calculated by the probability of missed detection (Pmd) with HAL. We set Pmd = 1 × 10⁻³ [21]. As to HAL, it is only used to set a maximum error range for comparison with HPL. Referring to GNSS positioning, the accuracy of high-precision positioning needs at least a centimeter-level. Therefore, in high-precision indoor pseudolite positioning, the positioning accuracy withcentimeter-level would be reliable and available. The HAL of indoor pseudolite high-precision positioning is set to 0.1m;
(e) Fault detection of pseudolite positioning system. Construct the test statistic T and compare it with threshold Th determined from the probability of false alert (Pfa). We set Pfa = 3.33 × 10⁻⁹ [21]. If T is larger than the threshold, the pseudolite may be faulty;
(f) Fault exclusion. The most intuitive method is to remove pseudolites in turn and compare the test statistic. Then exclude this pseudolite or delete corresponding epochs when a fault occurs;
(g) Positioning. After the above steps, the reliability of results is effectively improved. The flow chart follows,
In Figure 1, HPL is calculated before fault detection. If HPL is greater than HAL, the current observation condition (pseudolite constellation) would not be good enough and the unavailable situation of the system shown in Figure 2 may appear. In Figure 2b, HMI means hazardously misleading information and MI means misleading information. There are two important concepts in fault detection, false alert (FA) and missed detection (MD). Pfa refers to the probability of the fault detected by the system and alerts on the condition that the pseudolite is not faulty or HPE is less than HPL. FA occurs when the navigation is normal in Figure 2. Pmd is the probability that the system fails to detect it while in fact, the fault happens and HPE is greater than HPL. The MD shown as MI and HMI in Figure 2 mainly occurs when the navigation is not normal. HPL guarantees that Pmd will not exceed demand under the current pseudolite constellation and the threshold ensures that there is no FA in fault detection.
The determination of HPL and test statistic threshold will be presented in the next section in conjunction with the pseudolite system. In summary, under the premise that RAIM availability is guaranteed (HPL<HAL), the following four situations in Figure 3 may occur during fault detection.

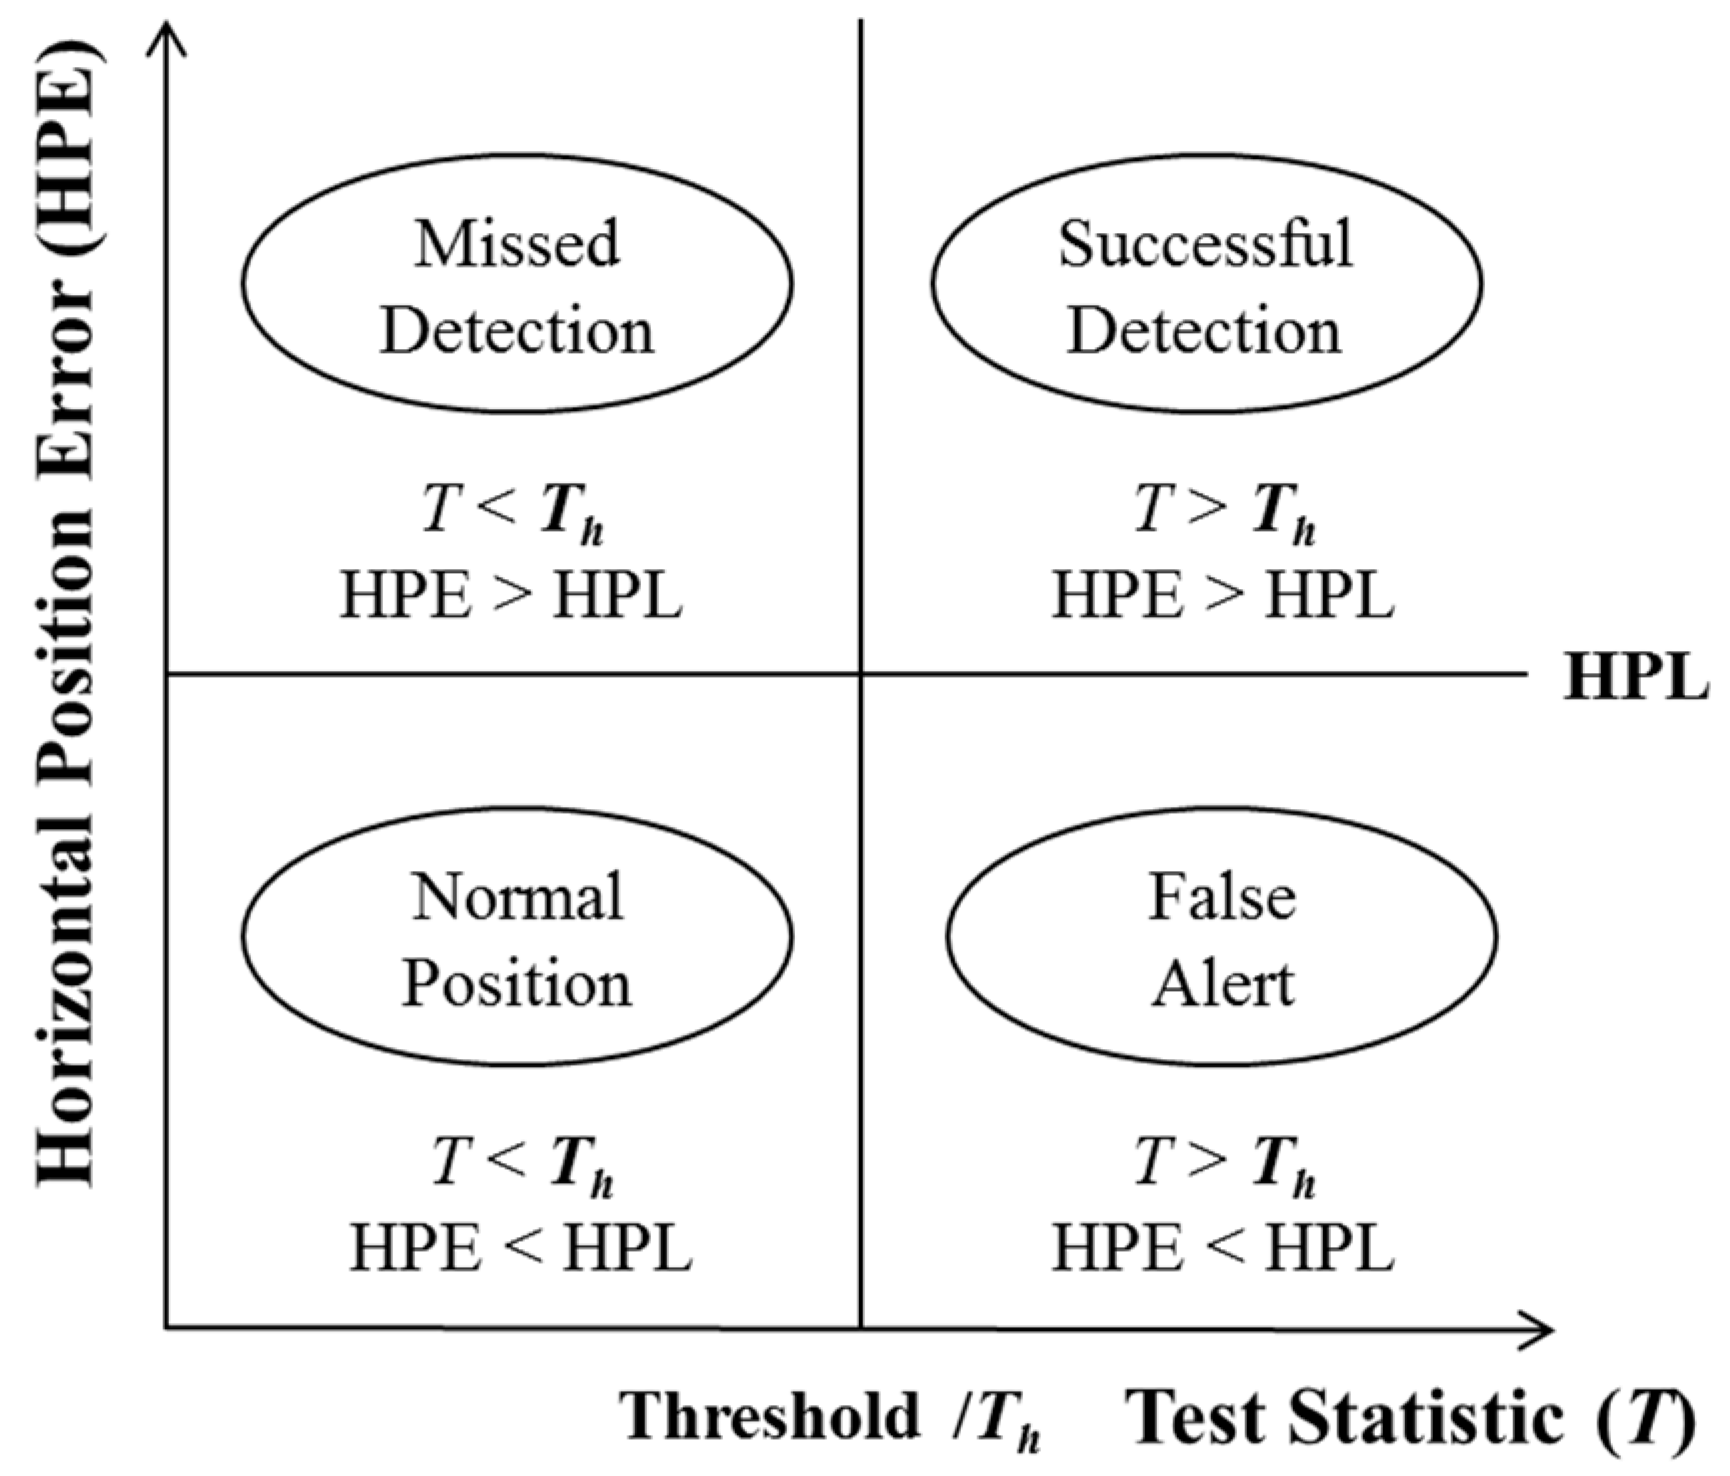
2.2.1. Fault Detection

In fault detection, the most critical step is the construction of test statistic T and the calculation of threshold Th. The test statistic is a value calculated from a set of sample data used to determine whether the null hypothesis should be rejected in the hypothesis test. The construction of T depends on the probability model (distribution) and the assumptions of the problem. As long as T is constructed, Th can be determined from a probability model with a given confidence level.
According to (2), the residual vector of the DD observations is obtained as,
r k = Z k H k X k ( + ) = Z k H k ( X k ( ) + K k V k )
r k = Z k H k X k ( ) H k K k V k
V k = Z k H k X k ( )
The simultaneous (6) and (7) can be written as,
r k = V k H k K k V k = ( I H k K k ) V k
The residual squared SSE is a scalar,
S S E = r k T r k = V k T ( I H k K k ) T ( I H k K k ) V k
The posterior unit weight mean error and test statistic can be constructed as,
T = V k T ( I H k K k ) T ( I H k K k ) V k σ ^ = S S E / ( n t )
where t represents the necessary number of observations. In experiments, parameters to be estimated are the horizontal coordinates x, y, and ambiguity, thereby t = 3. The innovation sequence V provides the corresponding source of information for PLRAIM. Nevertheless, when DD observations are applied, the noise is no longer independent. The dependence is a mathematical correlation rather than a physical correlation. To de-correlate the dependence, T can be constructed as [21],
T = r k T W k r k
where residual vector r = [rL1rP1]T, thus, the statistic of each observation can be expressed as,
T L 1 = r L 1 T W L 1 r L 1 T P 1 = r P 1 T W P 1 r P 1
In (12), TL1 is a test statistic based on carrier phase L1 observations and TP1 is constructed based on pseudorange observations P1. These two statistics form the core of the CRAIM and PRAIM algorithm respectively. Some faults can be detected when using PRAIM, for example, indoor multipath. However, there are also some faults that cannot be reflected from the test statistic based on pseudorange (e.g., cycle slips) and such faults cannot be ignored in high-precision indoor pseudolite positioning. Consequently, the proposed indoor PLRAIM can also achieve the goal of data pre-processing such as cycle slip detection and gross error detection. Moreover, since the results of indoor pseudolite positioning are greatly affected by data quality, the PLRAIM algorithm is also a guarantee for the availability and reliability of positioning.
The innovation sequence in a Kalman filter is assumed to subject to Gaussian distribution (Mehra 1970), N(0, σ2). According to the statistical distribution theory, test statistic T2/σ2 subjects the chi-square distribution with a degree of freedom of m. When there is no deviation in the observations, the system is under a normal state. If an alert is performed, it would be a false alert. The following probability equation can be established from a given Pfa,
P r ( T 2 / σ 2 < T h 2 ) = 0 T h 2 f χ 2 ( m ) ( x ) d x = 1 P f a
The threshold Th can be determined by (13) and T/σ is used to compare with Th. If T/σ is greater than Th, it can be considered that the fault exists in observations that should be excluded. If T/σ is less than the threshold, the positioning result is reliable and the observations can be applied for positioning.
In addition, the selection principle of reference pseudolite is also based on the elevation angle in indoor pseudolite positioning. However, elevation angles of all pseudolites are relatively close owing to the small scene indoors. Currently, it seems not reliable to select a reference pseudolite according to the highest elevation angle. Therefore, the possibility of reference pseudolite fault is also considered in PLRAIM. The fault of reference pseudolite is easier to detect. Once the fault in reference pseudolite occurs, the prior residuals of DD pseudorange observations of all pseudolites will be large and the reference pseudolite should be replaced in time.

2.2.2. HPL and the Availability of PLRAIM

This article focuses on horizontal positioning, so only the horizontal protection level (HPL) is analyzed. HPL refers to the horizontal positioning error that can be guaranteed when a fault occurs in current pseudolite constellation before fault detection. If HPL exceeds a given HAL, the current pseudolite constellation is not available. In other words, HPL is to ensure that the maximum Pmd under the current pseudolite constellation does not exceed the demand. There are usually two methods to calculate:
The first way is to use the geometric factor SLOPE between horizontal position error (HPE) and test statistic [41]. SLOPE represents the mapping of the test statistic to HPE, reflecting the relationship between them. If there is a deviation in the test statistic, it will be reflected in the SLOPE.
The horizontal position errors are the first two elements of KkVk inan extended Kalman filter. Let S = (I – HkKk)T(I – HkKk), assuming that the deviation occurs only in the ith pseudolite and the other pseudolites are normal. HSLOPE(i) can be used to indicate the sensitivity of horizontal position error to the deviation of the ith observations,
H S L O P E ( i ) = ( K 1 i 2 + K 2 i 2 ) / S i i
where Sii represents the ith element in diagonal matrix S. SLOPE is purely a geometric factor. Corresponding to the same test statistic, Pmd is the highest one when a fault occurs on apseudolite with the largest SLOPE. Therefore, the larger the HSLOPE, the more difficult it is to detect. In other words, when SLOPE is the largest, its statistic is the smallest in the case of the same HPE, which means that its residuals are the smallest, too. At this time, the minimum detectable deviation bias (MDB) is set to pbias and it can be calculated according to the threshold and a given Pmd.
If a fault occurs, T/σ should theoretically be greater than Th. If T/σ is smaller than Th, it indicates that a missed detection happens. The following probability equation can be established for a given Pmd,
P r ( T 2 / σ 2 < T h 2 ) = 0 T h 2 f χ 2 ( m ,   λ ) ( x ) d x = P m d
where λ is the noncentral parameter, pbias2 = σ2 λ/(n − t). σ represents the standard deviation of carrier phase measurements. The horizontal protection level HPL can be calculated as,
H P L 1 = H S L O P E max × p b i a s = H S L O P E max × σ λ / ( n t )
The other way is to use the position estimate uncertainty, in which the first three elements of covariance matrix (P) is applied,
H P L 2 = k H σ H
The positioning error can be regarded as Gaussian noise and kH(Pr) can be obtained based on a given confidence probability Pr (usually 1 –Pmd). In (17), σH represents the horizontal position uncertainty,
σ H = P 11 + P 22
where P represents covariance matrix in expression (4). According to (16) and (17), HPL can be expressed as,
H P L = max ( H P L 1 ,   H P L 2 )

3. Experiment and Analyses

Five pseudolites have been set up in the laboratory. The ranging signals with C/A codes are transmitted on the GPS L1 frequency. The RF front end of the receiver is a USRP and a full series of GNSS signals can be captured with a suitable daughter board. Taking a certain mark as the origin point, the two horizontal directions of the floor are X and Y axis, respectively. The Z-axis is perpendicular to the floor and a right hand indoor independent coordinate system is established. All the experiments are carried out on the floor. In addition, the scope of the laboratory is about 10m×7m×4m. The pseudolites constellation is as shown in Figure 4a,b. The HDOP (Horizontal Dilution of Precision) on the floor under this condition of pseudolite layout is shown in Figure 4c. HDOP is less than 6 in 92.8% of the laboratory area, and the mean value of HDOP is 3.1055.
Two sets of experiments were performed. It should be noted that this pseudolite system is in good condition in most cases. In most of the other experiments, high precision positioning results can be obtained in our laboratory. The faults in the following two groups of experiments are accidental. However, these kinds of accidental faults should also be considered in high-precision positioning.The first group of experiments with a zero baseline is named Experiment 1. The purpose is to verify the availability of an indoor positioning system by eliminating all the spatial correlation errors (for example, multipath).Through conducting a zero-baseline experiment, the receiver bias is estimated.A total of 20 epochs are sampled with a sampling interval of 1s. The second group is a short baseline dynamic experiment, including the static stage before moving, named Experiment 2.The sampling interval is set to 1 s, and a total of 123epochs are sampled. Firstly, the static measurement of the rover station at an initial position is maintained and then the rover station is controlled to move back and forth on the fixed rail for two periods. One period is divided into two datasets and a total of four datasets are obtained.

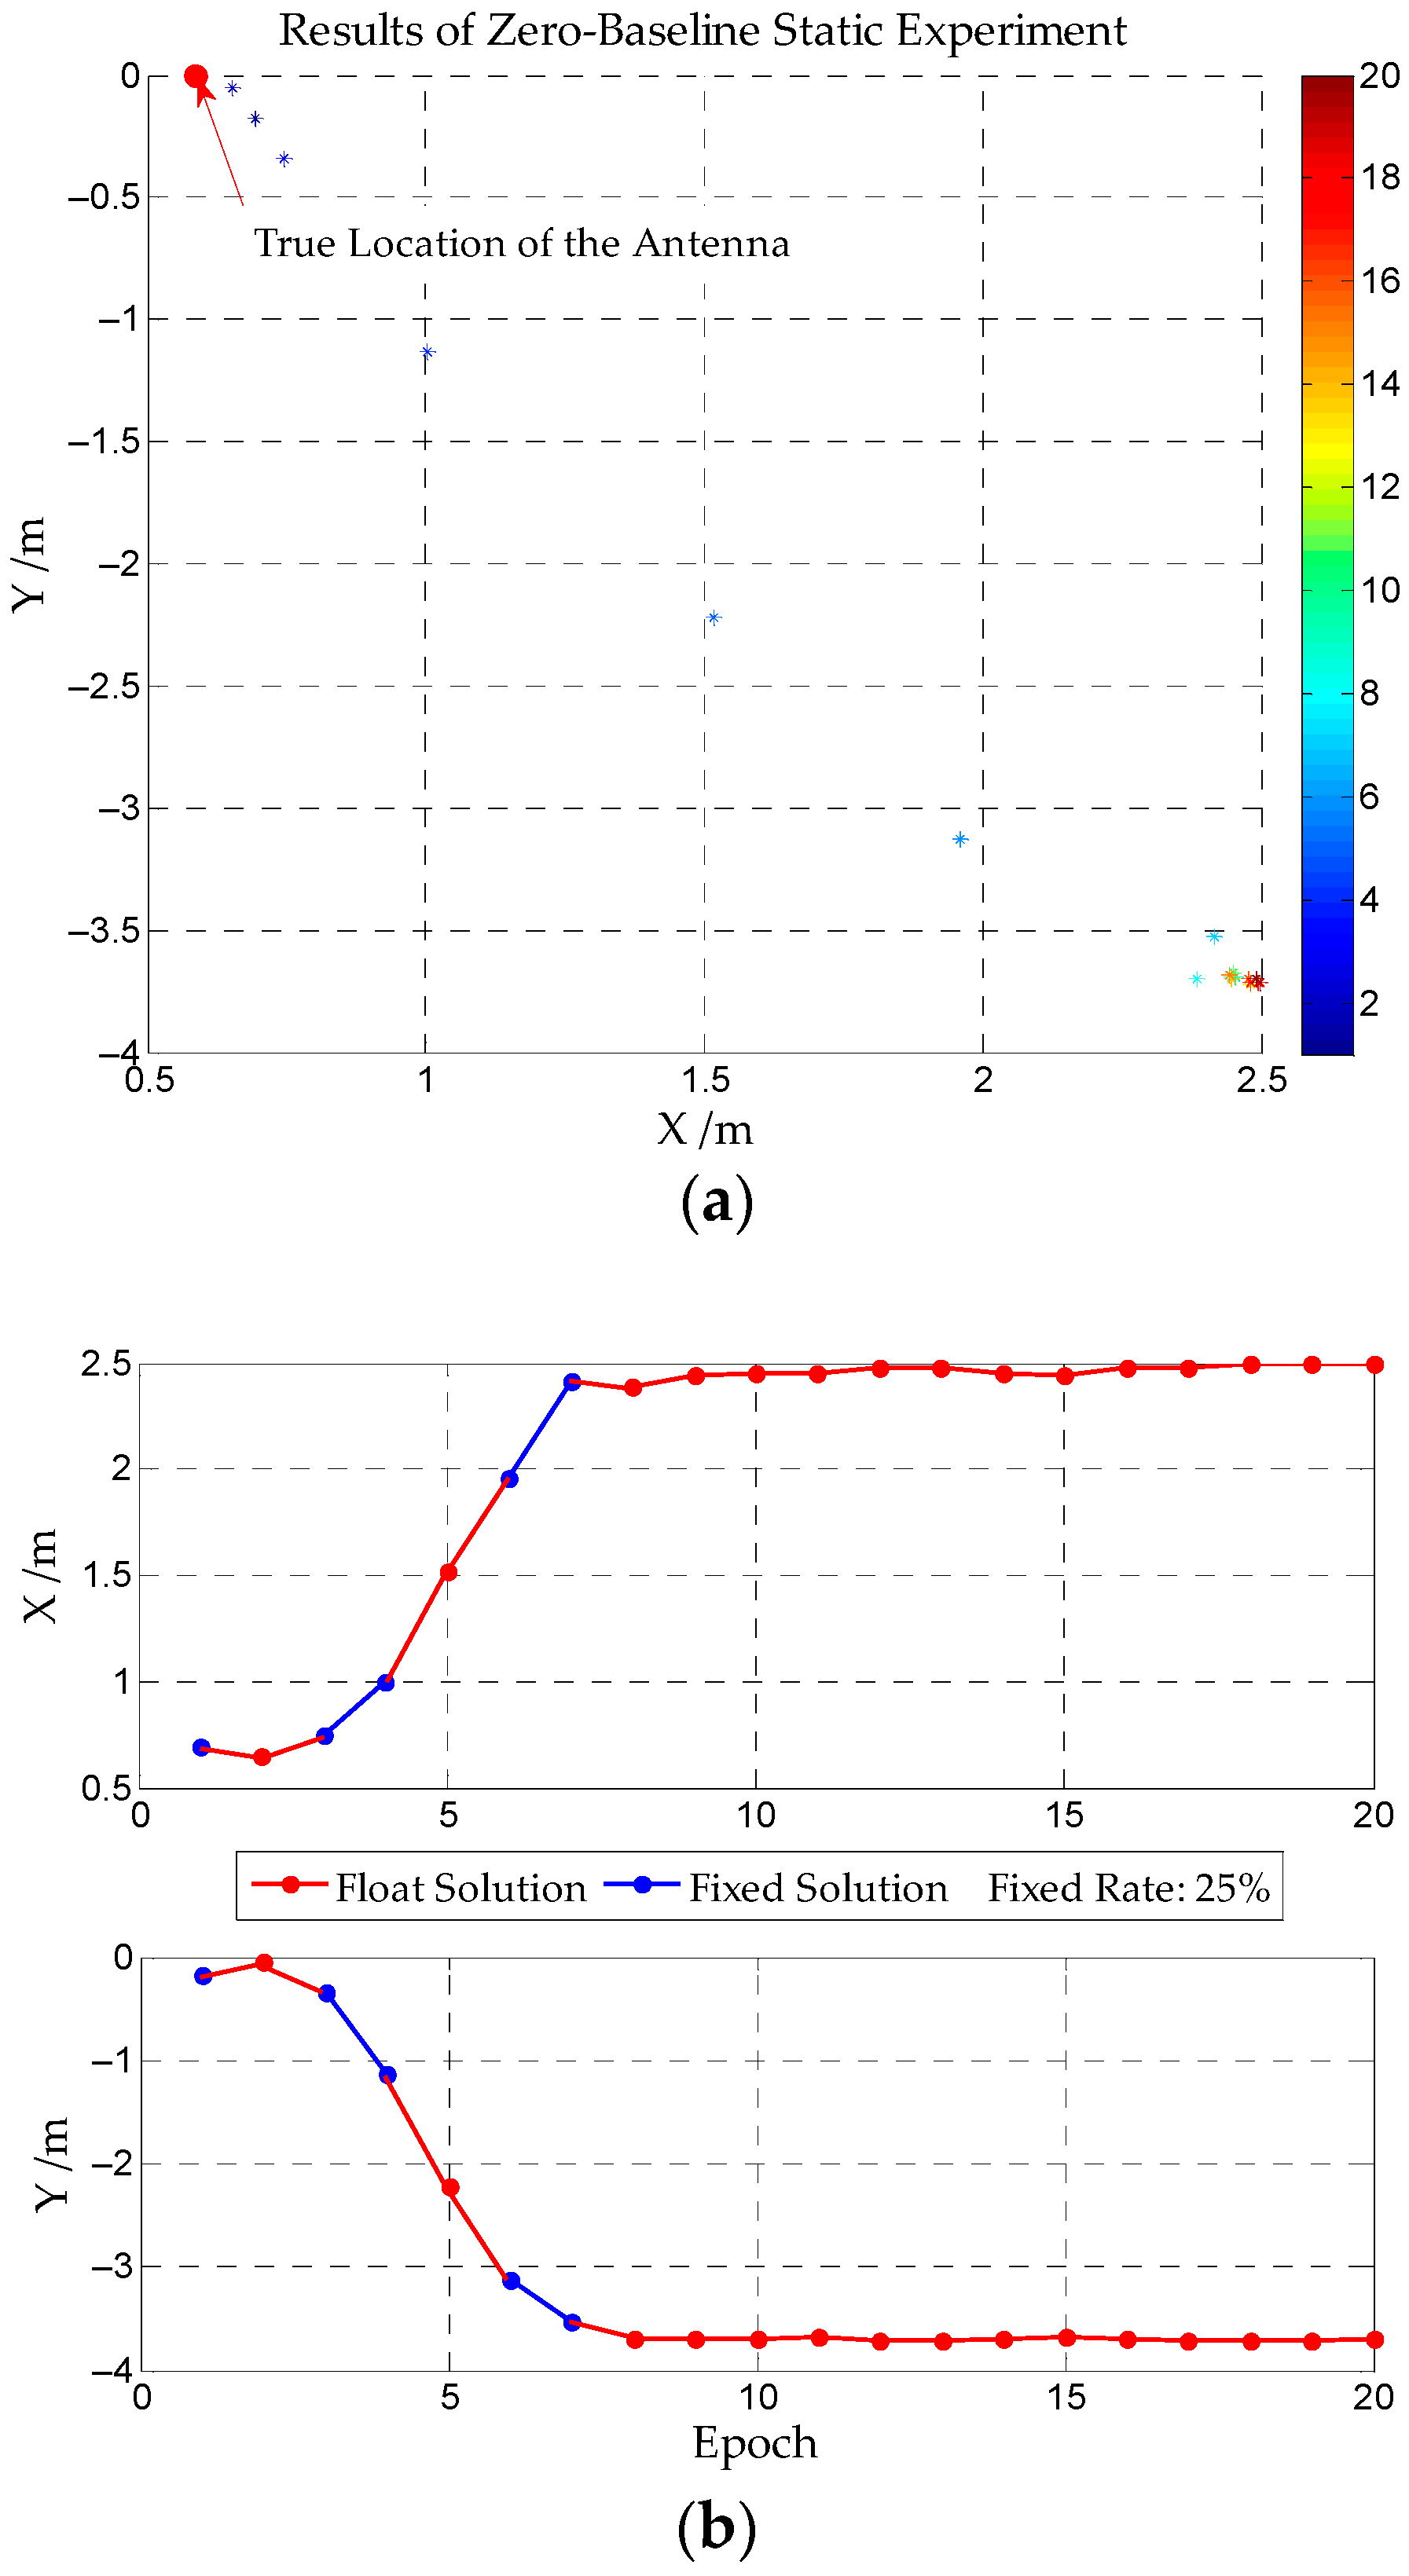
3.1. Static Experiment with Zero-Baseline

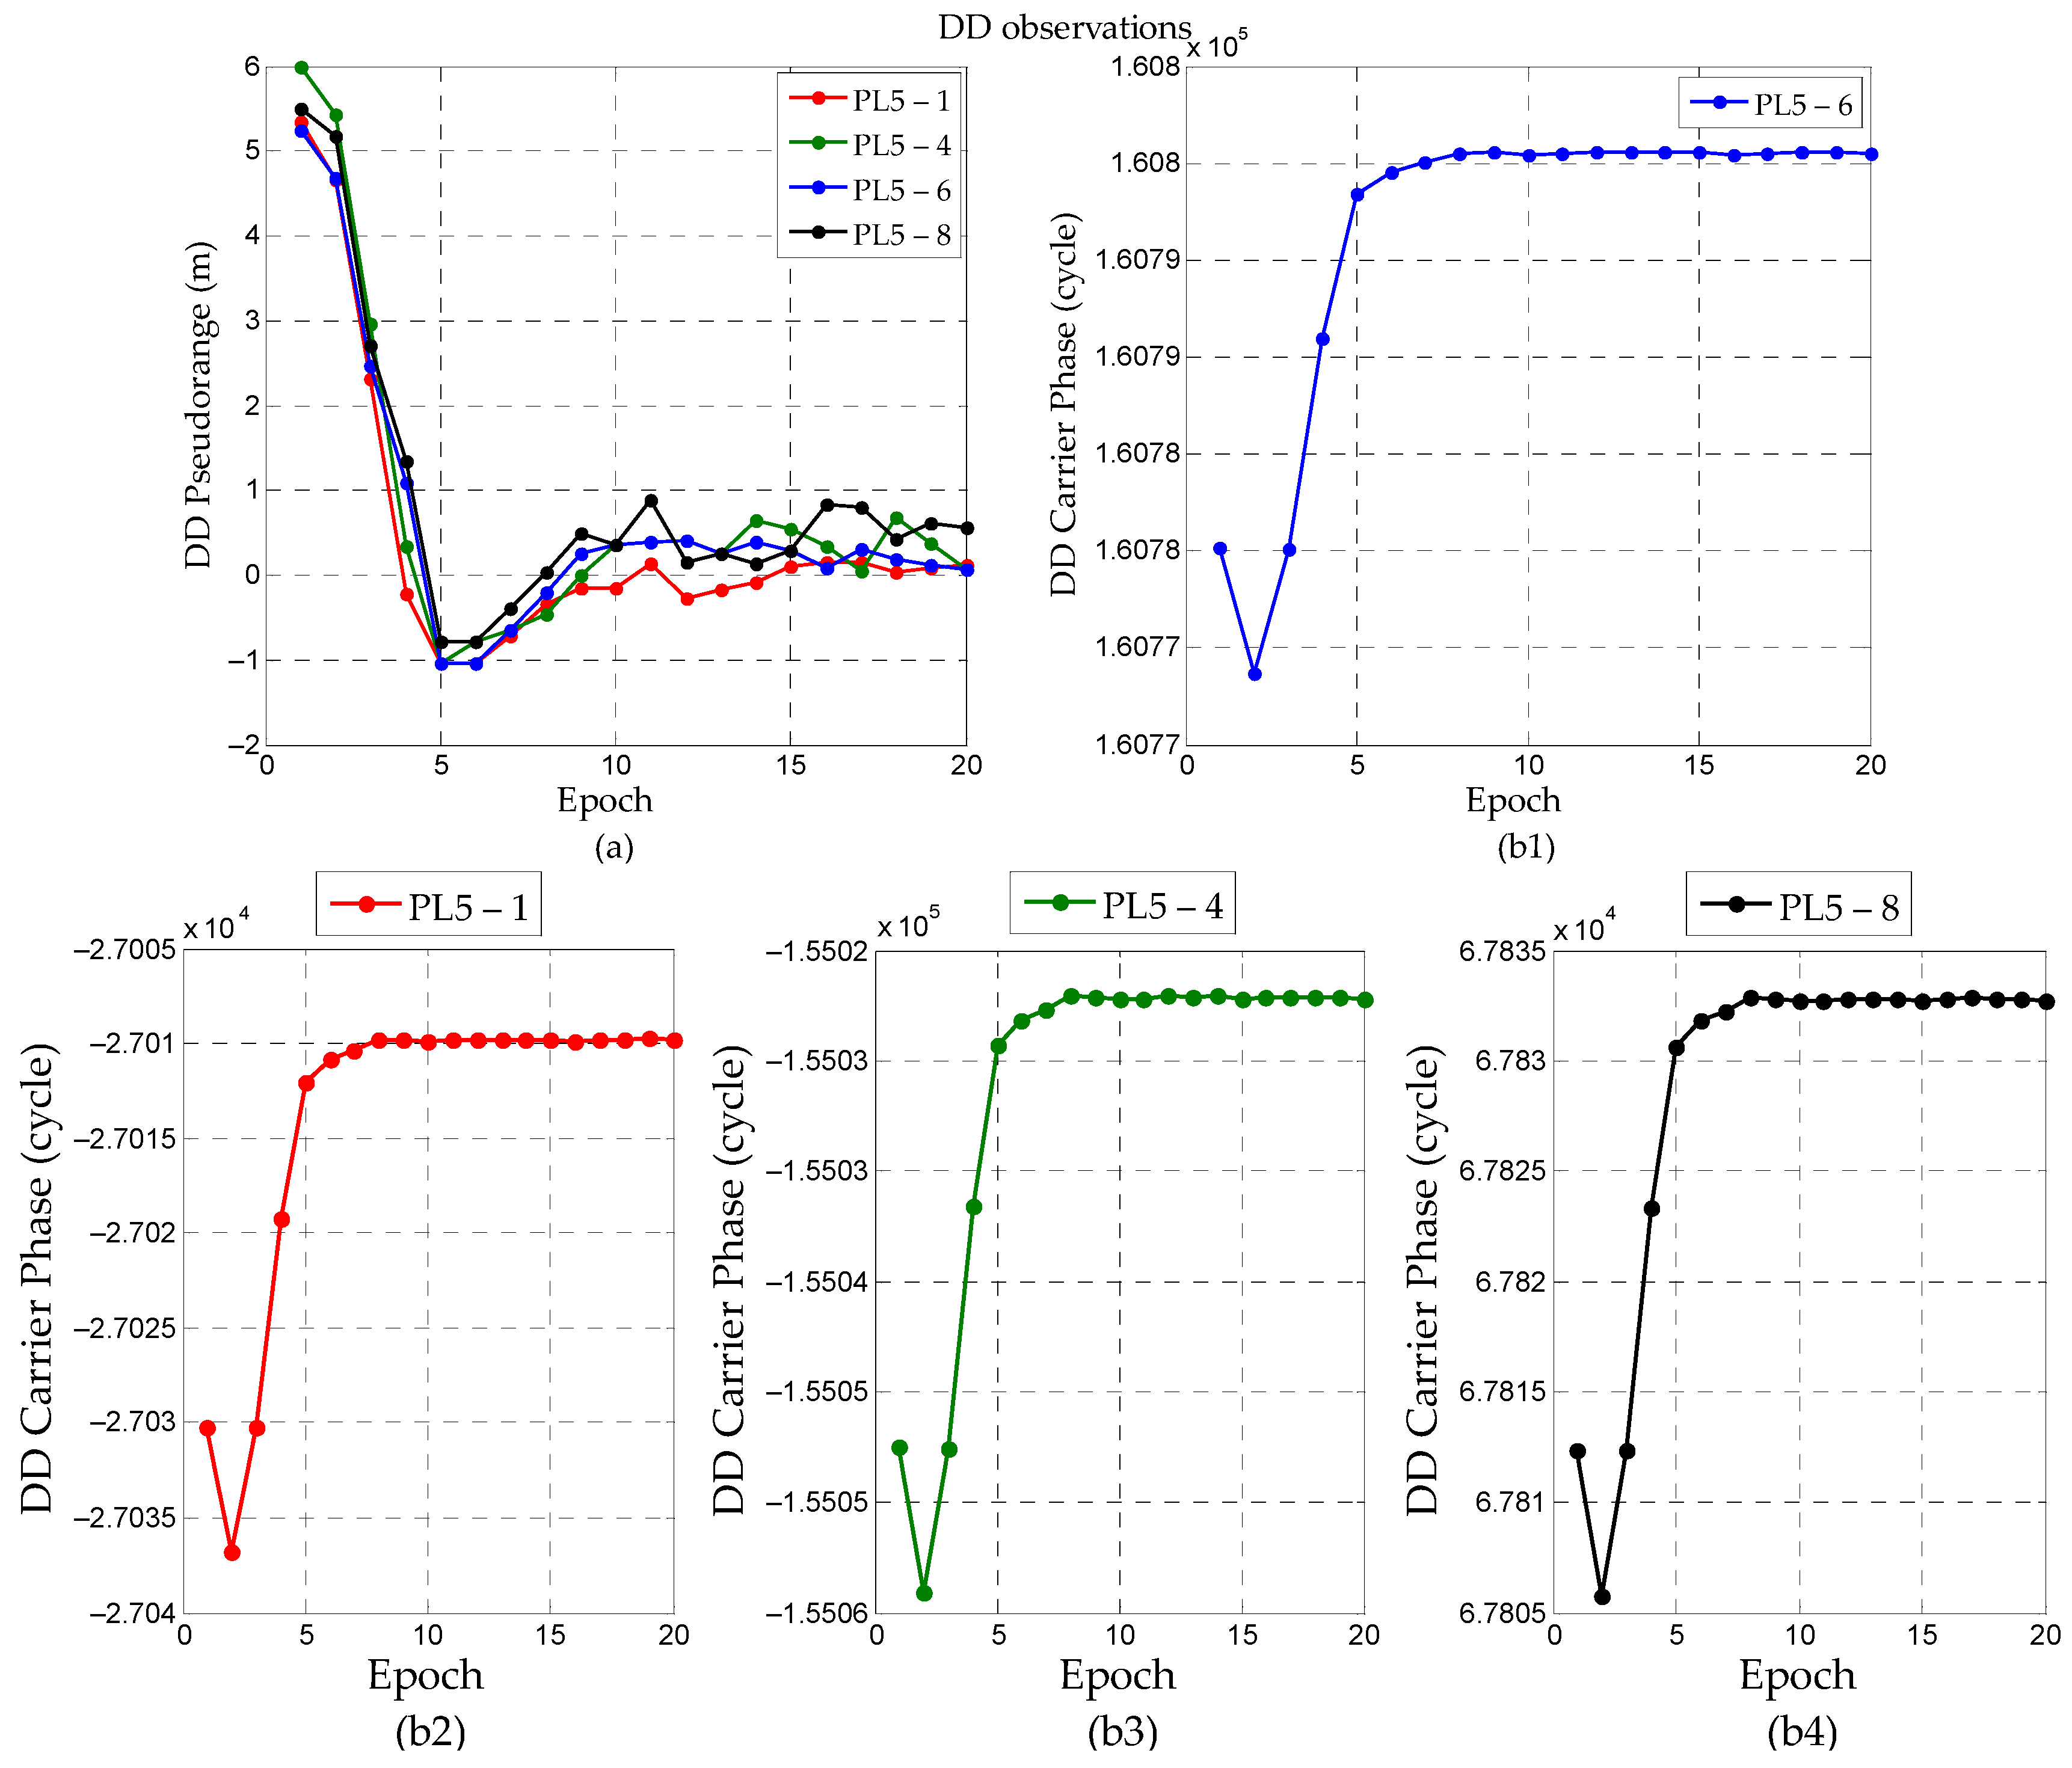
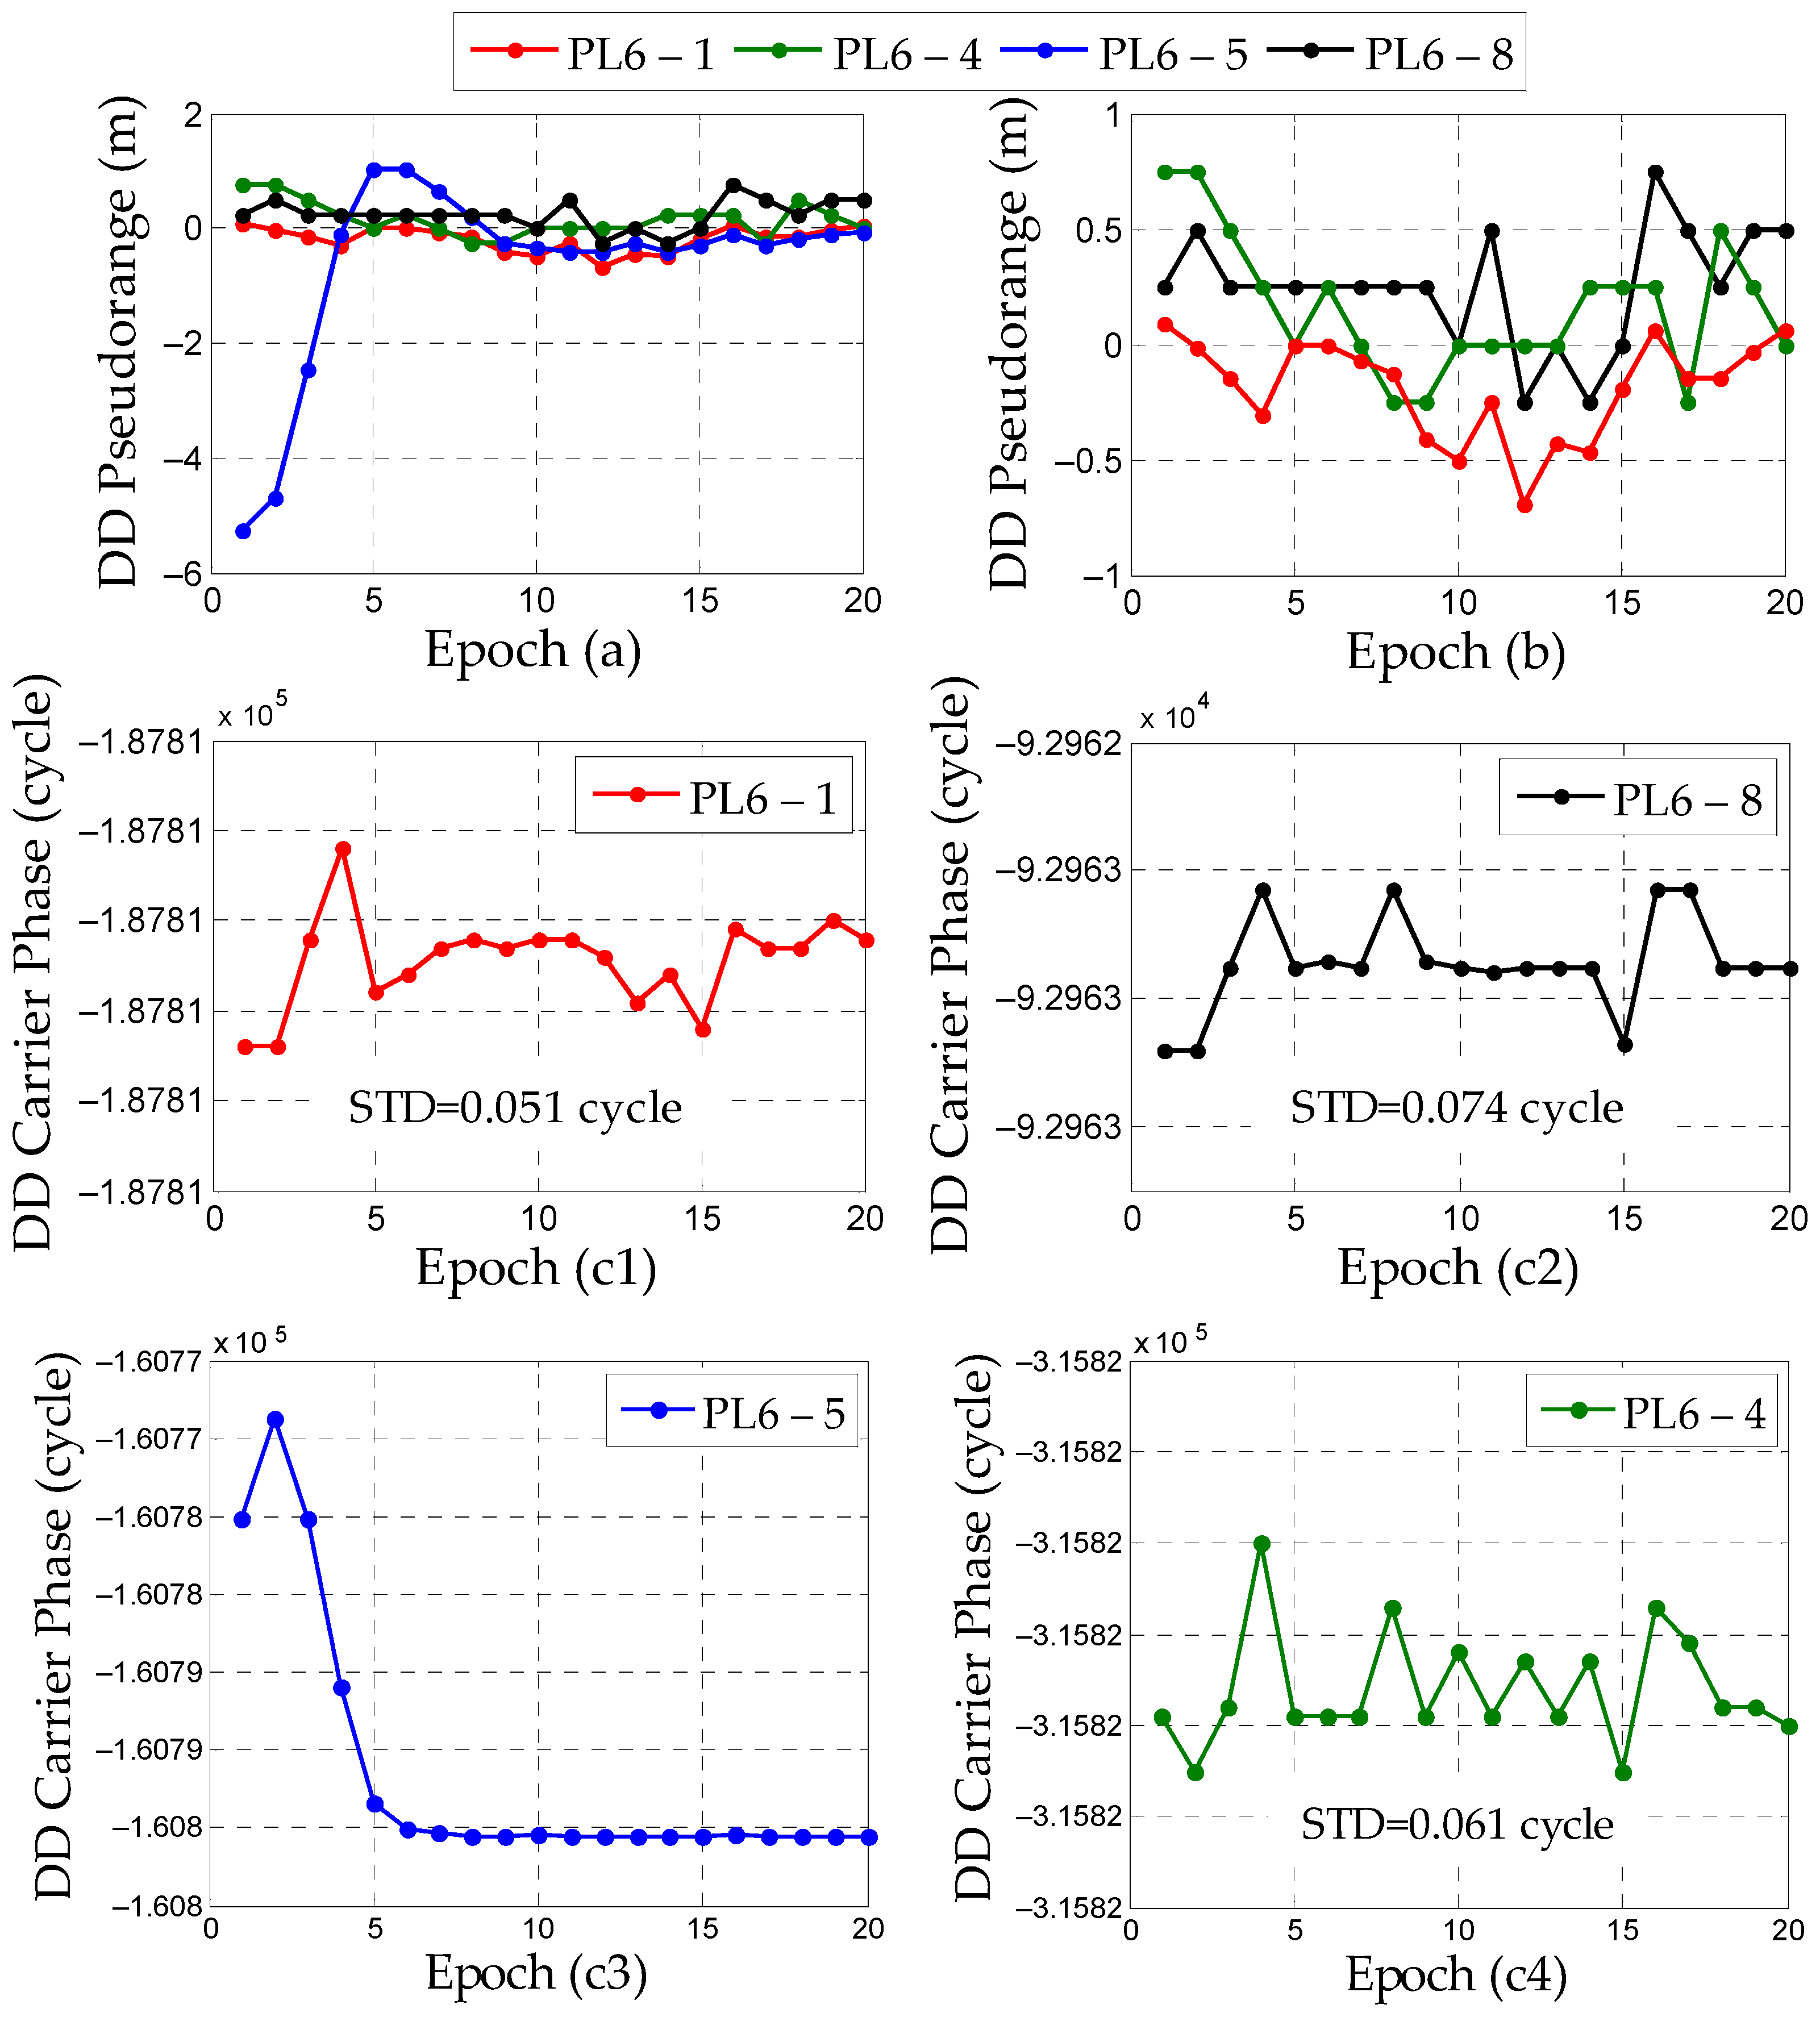
3.1.1. Fault Identification

Since the antenna is shared between the rover and the base stations, the error source such as multipath has been eliminated by DD and the factor affecting positioning only remains noise. Therefore, the DD pseudorange residuals should be close to zero in theory. In Experiment 1, the receiver antenna is placed near (0.64, 0.08) and the positioning results based on carrier phase observations are shown in Figure 5. The color bar represents epochs.
According to Figure 5, the ambiguity fixed rate is 25%. However, even if the ambiguities can be fixed in some epochs, it is fixed incorrectly. There is a large deviation in positioning results, and they are not reliable. In Experiments 1, the reference pseudolite is PL5 and DD pseudorange observations are shown in Figure 6.
In theory, DD pseudorange residuals in Figure 6 are close to 0, but it is obvious that there are abnormalities in DD observations of all pseudolites. The same circumstance is also found in DD carrier phase observations. It returned to normal around the 10th epoch. Therefore, it can be judged that the reference pseudolite PL5 is faulty. The reason for the bad pseudorange quality of PL5 may be an accidental fault from pseudolite hardware itself.

3.1.2. Fault Exclusion

Two strategies are considered for fault exclusion to ensure the reliability of positioning. The first one called Strategy 1 is to replace the reference pseudolite from PL5 to PL6 and retain the observations of original reference pseudolite. The other one named Strategy 2 is eliminating PL5 directly. In theory, Strategy 1 is more rigorous because subsequent observations return to normal. After the 10th epoch, the STD of PL6–5 for DD pseudorange observations is 0.27 m and 0.04 cycles forthe DD carrier phase. Therefore, after observations return to normal, the signals of PL5 should continue to be received. Figure 7 shows the DD pseudorange and carrier phase observations after using both two strategies. Figure 8 shows the test statistics after applying two strategies. The construction of test statistics and the determination of thresholdare shown in expression (12) and (13).
According to Figure 7, the DD observations of all pseudolites return to normal after the reference pseudolite is replaced. When using Strategy 1, the test statistics exceed threshold during the previous 10 epochs because the data quality of PL5 is poor, but test statistics remain normal in the last 10 epochs. When using Strategy 2, test statistics are below the threshold since PL5 is removed. It can be considered that the fault has been excluded and high-precision positioning can be performed.
In theory, as long as PL5 returns to normal, the test statistics are less than the set threshold due to a large reduction in residuals of DD observations. In Experiment 1, the faulty pseudolite PL5 is the reference pseudolite, so the method of replacing reference PL is used in Strategy 1. However, even if the reference PL is replaced, PL5 is still in a faulty state in the first 10 epochs and test statistics are higher than the threshold. However, PL5 is eliminated in Strategy 2 and test statistics are less than the threshold, which can ensure that there is no obvious deviation in the whole positioning process. After PL5 returns to normal, more redundant observations will be received in Strategy 1 and the theoretical positioning precision will be higher than Strategy 2. Figure 9 shows the results of horizontal positioning with two strategies and the color bar represents epochs.
According to Figure 9, it can be found that the fixed rate has been increased to 50% and the results of the fixed solution are close to true value when using Strategy 1. The STD of horizontal results is 5.4 mm (X direction is 2.7 mm and Y direction 4.7mm). When applying Strategy 2, the fixed rate has been increased to 100% and the STD of horizontal results is 9.8 mm (X direction is 3.7 mm and Y direction 9.1mm).
This phenomenon is also mutually confirmed with the previous analysis. In Strategy 1, when PL5 is faulty, the positioning result shows a large deviation and correct ambiguity fixed solutions cannot be obtained. At present, the positioning results of Strategy 2 are stabilized near true value. After PL5 returns to normal, the positioning result of Strategy 1 is also close to a true value and STD is better than Strategy 2. Nevertheless, we cannot decide which strategy is better without in combination with specific scenarios. The applicable scenarios of the two strategies and the best methods in the dynamic scenario will be discussed in this article.
Combined with Figure 6, the following conclusions can be obtained: if observations return to normal, PL5 can be resumed for positioning. Considering Strategies 1 and 2 comprehensively, Strategy 2 is better from the perspective of a fixed rate. However, considering the precision of the positioning results, Strategy 1 is better. No matter which strategy is adopted, it will be more accurate and reliable than before.
In practical applications, both strategies are acceptable for users according to the results (the precision can reach less than 1cm) and the positioning results are more reliable than before. The availability can be also improved. However, for dynamic positioning (or real-time navigation), Strategy 2 is more suitable than Strategy 1, because Strategy 2 can ensure that a correct positioning result is obtained in each epoch. The continuity and integrity of dynamic positioning will be guaranteed. From the perspective of redundant observations and final positioning precision, the operating state of PL5 (or faulty pseudolite) should be monitored in real-time. Once it returns to normal, the stations should continue to receive its signal, which will make the constellation configuration better. The number of redundant observations can also be added.
The following experiment is a dynamic one and the most reasonable strategy will be determined according to the real-time state of faulty pseudolite.

3.2. Dynamic Experiment

3.2.1. Fault Identification

A dynamic experiment is carried out in this chapter (named Experiment 2). Firstly, the static measurement of the rover station at the initial position is maintained and then the rover station is controlled to move back and forth on the fixed rail for two periods. Each period possesses two datasets. The horizontal coordinate of the start point is about (1.2, 0.3) and the endpoint coincides with the start point. The positioning results are shown in Figure 10 and Figure 11. The color bar represents the epochs. The red line represents the reference trajectory.
According to Figure 10, it can be found that the positioning results are basically inconsistent with the reference line, which indicates a large deviation comparing with the actual situation. This conclusion can also be drawn from Figure 11. Although the ambiguity fixed rate is 31.7%, it is fixed incorrectly. High-precision positioning cannot be guaranteed, and the results are not reliable.
Similar to Experiment 1, judging whether reference pseudolite performs normally is the first step and reference pseudolite in Experiment 2 is PL6. Figure 12 presents the DD carrier-phase observations of four pseudolites groups. Since Experiment 2 takes “stationary—motion—stationary—motion—stationary” as a period, the observations are periodic and contain two cycles in theory.
Figure 12 shows that DD carrier-phase observations of PL6–1, PL6–4, and PL6–5 remain normal, which confirms the regular pattern of two motion periods and observations are stable. The reason for such regular observations is that the pseudolite constellation is fixed. The observations will maintain this periodicity as long as the rover station moves back and forth along the fixed rail. Frequent cycle slips and data interruptions only occur in DD carrier-phase observations of PL6–8, indicating that the reference pseudolite PL6 is normal in Experiment 2 and the signals of PL8 may be faulty. It is possible that some environmental factors (such as multipath, shelters) lead to frequent signals interruption and cycle slips of PL8. However, further fault identification is required to determine faulty pseudolite or epochs theoretically. The test statistics and threshold for fault identification in Experiment 2 are shown in Figure 13. The construction of test statistics and the determination of thresholdare shown in (12) and (13).
The CRAIM test statistics in Figure 13a obviously exceeds the threshold. It is less than or close to the threshold in some epochs, where the signal of PL8 is interrupted instead of returning to normal. The number of visible pseudolites (# npl) has also changed from five to four. When the number of visible pseudolites is four, the test statistics wereless than the threshold. At this moment, the receivers lose lock to PL8 signals.It indicates that other pseudolites’ observations are normal except PL8. Besides, the incorrect ambiguity fixed solutions in Figure 10 and Figure 11 are also verified, because a wrong ambiguity value can cause slow growth effects in both test statistics and position error. The PRAIM test statistics in Figure 11b also exceed the threshold in very few epochs and it is not as significant as test statistics of CRAIM. According to the introduction, pseudorange is greatly affected by indoor environments, such as multipath, clock, noise and so on. Sometimes the pseudorange-based test statistics cannot truly reflect the fault because test statistics may become very large due to other factors even if there is no fault. More importantly, the PRAIM test statistics can only reflect noise and multipath but cannot recognize cycle slips. Therefore, pseudorange-based RAIM is not applicable in high-precision indoor PL positioning, which illustrates the significance and purpose of this study again.
Since the cycle slip is the most threatening fault for the carrier phase-based positioning system and it can frequently occur in reality, the analysis under cycle slip fault cases is also included. The simulated cycle slips (3 cycles) on PL1-L1, PL4-L1, PL5-L1 and PL6-L1 during the last 20 epochs are added in the dynamic data collection for further analysis. In order to avoid the influence of PL8, PL8 is excluded first, and the simulated cycle slips are added respectively. The corresponding test statistics are shown in Figure 14.
In this case, the error source is only simulated cycle slips. According to Figure 14, the data quality of the other four pseudolites except PL8 is good. What’s more, the test statistics based on carrier phase observations are sensitive to cycle slips and this kind of fault can be also effectively detected.

3.2.2. Fault Exclusion

In combination with Figure 12 and Figure 13, in order to ensure the accuracy and reliability of positioning, the best way to exclude the fault is to eliminate PL8. Figure 15 shows the test statistics based on pseudorange and carrier phase after PL8 is eliminated.
According to Figure 15, it can be found that the test statistics based on pseudorange and carrier phase return to normal after PL8 areexcluded and the carrier phase-based statistics are much smaller than the threshold. Since the normal DD observations can be received after fault exclusion (PL8 is eliminated). The observations are only affected by general factors such as noise and the test statistics based on posterior residuals are less than the threshold. At the same time, the correctness of AR is verified. Although the pseudorange-based test statistics are below the threshold, they are relatively large, which further confirms the unavailability of pseudorange observations in high-precision positioning for indoor pseudolites.
In theory, the best way is to continue to receive the signals of PL8 when it returns to normal. However, it is revealed that PL8 has been in a faulty state during the dynamic process according to Figure 13. Therefore, the signals of PL8 are not received during the whole experiment. In addition, PL8 is normal in the first 18 epochs, but the rover station is in a static state, so whether the PL8 is used at this stage does not affect the positioning results. The result without PL8 is shown in Figure 16. The red line represents the reference trajectory.
According to Figure 16 a,b, the motion trajectory conforms to the actual situation basically that the carrier is controlled to move back and forth along a straight rail. The positioning precision is at centimeter-level in ambiguity fixed solution and the fixed-rate reaches 99.2%. Therefore, it can be judged that PL8 is faulty and the normal observations cannot be obtained during the whole experiment according to the test statistics and threshold. The signals of PL8 should not be received in the whole process. After fault exclusion, all DD observations with good quality can be obtained and indoor positioning results with high-precision can be achieved, which ensures the reliability and availability of indoor pseudolite positioning.

3.2.3. The Horizontal Protection Level

In Experiment 2, HPL is calculated according to position estimate uncertainty, which is obtained by the first two elements of the covariance matrix P. In practical applications, HPL being less than HAL is a prerequisite for RAIM. When the system is operating, the circle centered on the motion position with the HPL as the radius will contain the true position in this epoch. Figure 17 shows the HPL calculated in Experiment 2. The calculation of HPL is obtained by (19). The color bar represents the epochs.
Figure 17a shows the motion trajectory of the first dataset in the second period and the corresponding HPL. In this dataset, all ambiguities are fixed, and the constellation is stable without the replacement of the reference pseudolite. Figure 17b shows the HPL of the full dataset in Experiment 2. The HPL changes within 5 cm and is relatively stable throughout the movement except for the first epoch. The reason is that the ambiguity has not been fixed and the variance is relatively large, which is why the peak appears in Figure 17b. In addition, according to the definition of HPL and the theory of RAIM, it can be considered that HPE is smaller than HPL, that is, the positioning precision of the dynamic experiment is below 5cm. Since there is no true value in positioning, this method also provides a reference index for the accuracy assessment of positioning. Therefore, according to Experiments 1 and 2, it can be considered that the proposed indoor PLRAIM algorithm has the abilitytoensuring the accuracy and integrity of pseudolite system. All test statistics and HPL in Figure 15 and Figure 17 are relatively stable, which also proves the reliability of AR.

4. Conclusions and Discussion

Due to the influence of various error factors, pseudorange observations are not reliable and the accuracy and reliability of positioning cannot be guaranteed in indoor high-precision pseudolite positioning. Considering these problems, a holistic indoor pseudolite integrity monitoring algorithm PLRAIM is proposed and the specific steps are shown in Section 2.2. The feasibility of the whole algorithm is analyzed by static and dynamic experiments. The ambiguity fixed rate of both experiments is greatly improved when using PLRAIM and the reliability of AR is also guaranteed due to the stability of test statistics and HPL. In terms of positioning precision, the RMS of the zero-baseline static experiment reaches mm level when PLRAIM is applied and the maximum deviation in the dynamic experiment is within 5 cm, which ensures the positioning precision well.
The proposed method can be further improved. In fact, it is not reliable to choose the reference pseudolite of an indoor pseudolite system based on the elevation angle because of the fixed pseudolite constellation and the small scope of the indoor environment. Therefore, the elevation angles of all pseudolites are basically very close. Besides, whether the reference pseudolite is faulty is analyzed based on the stability of DD observations.A more suitable fault identification method for reference pseudolite is the next research focus. In addition, the threshold of test statistics is determined by a given Pfa, but it may not be the best way for an indoor pseudolite system. How to adjust the threshold dynamically according to the actual situation is also the next important issue.
Furthermore, this set of pseudolite hardware and software devices will be applied to some actual engineering situations or more complex indoor environments in the future. More actual data will be collected for a longer period. The available state of pseudolites will be monitored in real-time to verify the robustness of our method.

Author Contributions

P.Z. performed all data acquisition. Y.Z. and P.Z conceived the experiments and analyzed the data. Y.Z. and X.L. performed data processing and contributed to the manuscript. J.G. and J.Z. provided critical comments and contributed to the final revision of the paper. D.Z., F.Y. and G.H. contributed to the expression and the design of programs. All authors contributed to the manuscript and discussed the results. All authors together developed the idea that led to this paper. All authors have read and agreed to the published version of the manuscript.

Funding

This work was supported by “National Nature Science Foundation of China” (Grant Nos. 41604019, 41474004, 41871373) and Guangxi Key Laboratory of Spatial Information and Geomatics (Grant Nos. 19-050-11-10, 19-050-11-01).

Conflicts of Interest

The authors declare no conflict of interest.

Abbreviations

DDDouble differenced
GNSSGlobal navigation satellite system
INSInertial Navigation System
PLPseudolite
ARAmbiguity resolution
CRAIMCarrier phase-based RAIM
PRAIMPseudorange-based RAIM
PLRAIM Pseudolite based RAIM
HPLHorizontal protection level
HALHorizontal alert limit
HPEHorizontal positioning error
MIMisleading information
HMIHazardously MI
MDBDetectable deviation bias
RFRadio frequency
FAFalse alert
MDMissed detection
KPIKnown point initialization
PPPPrecise point positioning
RTKReal-time kinematic positioning
EKFExtended Kalman filter
SSEThe sum of squares due to error
USRPUniversal software radio peripheral
rplReference pseudolite
nplNumber of visible pseudolites
AFMAmbiguity function method
STDStandard deviation
RMSRoot mean square

References

  1. Su, J.; Yao, Z.; Lu, M. An improved position determination algorithm based on nonlinear compensation for ground-based positioning systems. IEEE Access 2019, 7, 23675–23689. [Google Scholar] [CrossRef]
  2. Wang, J. Pseudolite applications in positioning and navigation progress and problems. J. Glob. Position. Syst. 2002, 1, 48–56. [Google Scholar] [CrossRef] [Green Version]
  3. Dai, L.; Wang, J.; Rizos, C.; Han, S. Pseudo-satellite applications in deformation monitoring. GPS Solut. 2002, 5, 80–87. [Google Scholar] [CrossRef]
  4. Li, X.; Zhang, P.; Guo, J.; Wang, J.; Qiu, W. A new method for single-epoch ambiguity resolution with indoor pseudolite positioning. Sensors 2017, 17, 921. [Google Scholar] [CrossRef] [Green Version]
  5. Wang, T.; Yao, Z.; Lu, M. On-the-fly ambiguity resolution based on double-differential square observation. Sensors 2018, 18, 2495. [Google Scholar] [CrossRef] [Green Version]
  6. Wang, T.; Yao, Z.; Lu, M. On-the-fly ambiguity resolution involving only carrier phase measurements for stand-alone ground-based positioning systems. GPS Solut. 2019, 23, 36. [Google Scholar] [CrossRef]
  7. Counselman, C.C.; Gourevitch, S.A. Miniature interferometer terminals for earth surveying: Ambiguity and multipath with Global Positioning System. IEEE Trans. Geosci. Remote Sens. 1981, GE-19, 244–252. [Google Scholar] [CrossRef]
  8. Bonenberg, L.K. Closely-Coupled Integration of Locata and GPS for Engineering Applications. Ph.D. Thesis, University of Nottingham, Nottingham, UK, 2014. [Google Scholar]
  9. Rizos, C.; Roberts, G.; Barnes, J.; Gambale, N. Experimental results of Locata: A high accuracy indoor positioning system. In Proceedings of the 2010 International Conference on Indoor Positioning and Indoor Navigation, Zurich, Switzerland, 15–17 September 2010. [Google Scholar]
  10. Guo, X.; Zhou, Y.; Wang, J.; Liu, K.; Liu, C. Precise point positioning for ground-based navigation systems without accurate time synchronization. GPS Solut. 2018, 22, 34. [Google Scholar] [CrossRef]
  11. Kim, C.; So, H.; Lee, T.; Kee, C. A pseudolite-based positioning system for legacy GNSS receivers. Sensors 2014, 14, 6104–6123. [Google Scholar] [CrossRef] [PubMed] [Green Version]
  12. Xu, R.; Chen, W.; Xu, Y.; Ji, S. A new indoor positioning system architecture using GPS signals. Sensors 2015, 15, 10074–10087. [Google Scholar] [CrossRef] [PubMed] [Green Version]
  13. Fujii, K.; Sakamoto, Y.; Wang, W.; Arie, H.; Schmitz, A.; Sugano, S. Hyperbolic positioning with antenna arrays and multi-channel pseudolite for indoor localization. Sensors 2015, 15, 25157–25175. [Google Scholar] [CrossRef] [PubMed] [Green Version]
  14. Wan, X.G.; Zhan, X.Q.; Du, G. Carrier phase method for indoor pseudolite positioning system. Appl. Mech. Mater. 2011, 130–134, 2064–2067. [Google Scholar] [CrossRef]
  15. Zhang, P.; Sun, F.; Xu, Y.; Wang, J. Indoor pseudolite positioning based on interferometric measurement of carrier phase. In Proceedings of the China Satellite Navigation Conference (CSNC), Changsha, China, 18–20 May 2016; Sun, J., Liu, J., Fan, S., Wang, F., Eds.; Springer: Singapore, 2016. [Google Scholar]
  16. Zhao, Y.; Zhang, P.; Guo, J.; Li, X.; Wang, J.; Yang, F.; Wang, X. A new method of high-precision positioning for an indoor pseudolite without using the known point initialization. Sensors 2018, 18, 1977. [Google Scholar] [CrossRef] [PubMed] [Green Version]
  17. Bhattacharyya, S.; Gebre-Egziabher, D. Kalman filter–based RAIM for GNSS receivers. IEEE Trans. Aerosp. Electron. Syst. 2015, 51, 2444–2459. [Google Scholar] [CrossRef]
  18. Sturza, M.A. Navigation system integrity monitoring using redundant measurements. Navigation 1988, 35, 483–501. [Google Scholar] [CrossRef]
  19. Parkinson, B.W.; Axelrad, P. Autonomous GPS integrity monitoring using the pseudorange residual. Navigation 1988, 35, 255–274. [Google Scholar] [CrossRef]
  20. Joerger, M.; Pervan, B. Kalman filter–based integrity monitoring against sensor faults. J. Guid. Control Dyn. 2013, 36, 349–361. [Google Scholar] [CrossRef] [Green Version]
  21. Feng, S.; Ochieng, W.; Moore, T.; Hill, C.; Hide, C. Carrier phase-based integrity monitoring for high-accuracy positioning. GPS Solut. 2009, 13, 13–22. [Google Scholar] [CrossRef]
  22. Abuhashim, T.S.; Abdel-Hafez, M.F.; Al-Jarrah, M.A. Building a robust integrity monitoring algorithm for a low cost GPS-aided-INS system. Int. J. Control Autom. Syst. 2010, 8, 1108–1122. [Google Scholar] [CrossRef]
  23. Nowak, A. The proposal to snapshot raim method for GNSS vessel receivers working in poor space segment geometry. Pol. Marit. Res. 2015, 22, 3–8. [Google Scholar] [CrossRef] [Green Version]
  24. Hewitson, S.; Wang, J. GNSS receiver autonomous integrity monitoring for multiple outlines. J. Navig. 2006, 4, 47–54. [Google Scholar]
  25. Na, L.; Lin, Z.; Liang, L.; Jia, C. Integrity monitoring of high-accuracy GNSS-based attitude determination. GPS Solut. 2018, 22, 120. [Google Scholar]
  26. Yun, H.; Yun, Y.; Kee, C. Carrier phase-based RAIM algorithm using a gaussian sum filter. J. Navig. 2011, 64, 75–90. [Google Scholar] [CrossRef]
  27. Shi, X. Carrier-Phase Based Real-time Static and Kinematic Precise Point Positioning Using GPS and GALILEO. Ph.D. Thesis, Imperial College, London, London, UK, 2010. [Google Scholar]
  28. Jokinen, A.; Feng, S.; Schuster, W.; Ochieng, W.; Hideb, C.; Mooreb, T.; Hill, C. Integrity monitoring of fixed ambiguity Precise Point Positioning (PPP) solutions. Geo-Spat. Inf. Sci. 2013, 16, 141–148. [Google Scholar] [CrossRef] [Green Version]
  29. Schuster, W.; Bai, J.; Feng, S.J.; Ochieng, W. Integrity monitoring algorithms for airport surface movement. GPS Solut. 2012, 16, 65–75. [Google Scholar] [CrossRef]
  30. Li, L.; Wang, H.; Jia, C.; Zhao, L.; Zhao, Y. Integrity and continuity allocation for the RAIM with multiple constellations. GPS Solut. 2017, 21, 1503–1513. [Google Scholar] [CrossRef]
  31. Li, L.; Jia, C.; Zhao, L.; Yang, F.; Li, Z. Integrity monitoring-based ambiguity validation for triple-carrier ambiguity resolution. GPS Solut. 2017, 21, 797–810. [Google Scholar] [CrossRef]
  32. Liu, Y.; Lian, B. Indoor pseudolite relative localization algorithm with kalman filter. Acta Phys. Sin. 2014, 63, 1–7. [Google Scholar]
  33. Cellmer, S.; Wielgosz, P.; Rzepecka, Z. Modified ambiguity function approach for GPS carrier phase positioning. J. Geod. 2010, 84, 267–275. [Google Scholar] [CrossRef]
  34. Alfred, L. GPS Satellite Surveying, 3rd ed.; Wiley: New York, NY, USA, 2004. [Google Scholar]
  35. Teunissen, P.J.G.; Kleusberg, A. GPS for Geodesy; Springer: Berlin, Germany, 1998. [Google Scholar]
  36. Koch, K.R.; Yang, Y. Robust Kalman filter for rank deficient observation models. J. Geod. 1998, 72, 436–444. [Google Scholar] [CrossRef]
  37. Ochieng, W.; Sauer, K.; Walsh, D.; Brodin, G.; Griffin, S.; Denney, M. GPS integrity and potential impact on aviation safety. J. Navig. 2003, 56, 51–65. [Google Scholar] [CrossRef]
  38. Weng, D.; Chen, W. SBAS enhancement using an independent monitor station in a local area. GPS Solut. 2019, 23, 12. [Google Scholar] [CrossRef]
  39. Teunissen, P.J.G. The least-squares ambiguity decorrelation adjustment: A method for fast GPS integer ambiguity estimation. J. Geod. 1995, 70, 65–82. [Google Scholar] [CrossRef]
  40. Li, X.; Zhang, P.; Huang, G.; Zhang, Q.; Guo, J.; Zhao, Y.; Zhao, Q. Performance analysis of indoor pseudolite positioning based on the unscented Kalman filter. GPS Solut. 2019, 23, 79. [Google Scholar] [CrossRef]
  41. Song, J.; Hou, C.; Xue, G. GNSS receiver autonomous integrity monitoring based on EKF. J. Tianjin Univ. Sci. Technol. 2017, 50, 405–410. [Google Scholar]
Figure 1. The Procedure of PLRAIM.
Applsci 10 01199 g001
Figure 2. (a) Events according to the Stanford Diagram, (b) Sketch Map of MI and HMI.
Applsci 10 01199 g002
Figure 3. Conditions in FaultDetection.
Applsci 10 01199 g003
Figure 4. (a) Pseudolite Constellation in the Laboratory, (b) The Horizontal Locations of Pseudolite and Initial Position of Rover Stations, (c) HDOP of Pseudolite System(On the Floor).
Applsci 10 01199 g004
Figure 5. (a) Horizontal Positioning Results of Experiments 1, (b) Positioning Results on X, Y.
Applsci 10 01199 g005
Figure 6. (a) Double Differenced (DD) Observations of Pseudorange, (b1b4) DD Observations of the Carrier Phase.
Applsci 10 01199 g006
Figure 7. (a) DD Pseudorange Observations after Using Strategy 1, (b) DD Pseudorange Observations after Using Strategy 2, (c1c4) DD Carrier Phase Observations after Using Strategy 1.
Applsci 10 01199 g007
Figure 8. (a) CRAIM Test Statistic after Using Strategy 1, (b) CRAIM TestStatistic after Using Strategy 2.
Applsci 10 01199 g008
Figure 9. (a1,a2) Results of Experiment 1 when Using Strategy 1, (b1,b2) Results of Experiment 1 when Using Strategy 2.
Applsci 10 01199 g009
Figure 10. (a) The trajectory of Experiment 2, (b) The Equipment of Experiment 2.
Applsci 10 01199 g010
Figure 11. Results in X, Y Components of Experiment 2.
Applsci 10 01199 g011
Figure 12. DD Carrier Phase Observations of Experiment 2.
Applsci 10 01199 g012
Figure 13. (a) The Test Statistics Based on Carrier Phase Observations, (b) The Test Statistics Based on Pseudorange Observations.
Applsci 10 01199 g013
Figure 14. Test Statistics when simulated cycle slips are added.
Applsci 10 01199 g014
Figure 15. (a) The Test Statistics of CRAIM after PL8 is excluded, (b) The Test Statistics of PRAIM after PL8 is excluded.
Applsci 10 01199 g015
Figure 16. (a) The trajectory of Experiment2 after FaultExclusion, (b) Results in the X, Y Direction of Experiment 2 after Fault Exclusion.
Applsci 10 01199 g016
Figure 17. (a) The First Dataset in the Second Period of Experiment 2, (b) Horizontal protection level (HPL) of Experiment 2.
Applsci 10 01199 g017

