Article

Computational Simulation of Cardiac Function and Blood Flow in the Circulatory System under Continuous Flow Left Ventricular Assist Device Support during Atrial Fibrillation

Institute of Cardiovascular Science, University College London, London WC1E 6BT, UK
Appl. Sci. 2020, 10(3), 876; https://doi.org/10.3390/app10030876
Submission received: 22 December 2019 / Revised: 13 January 2020 / Accepted: 27 January 2020 / Published: 27 January 2020
(This article belongs to the Special Issue Dynamic Models of Biology and Medicine, Volume II)

Abstract

:
Prevalence of atrial fibrillation (AF) is high in heart failure patients supported by a continuous flow left ventricular assist device (CF-LVAD); however, the long term effects remain unclear. In this study, a computational model simulating effects of AF on cardiac function and blood flow for heart failure and CF-LVAD support is presented. The computational model describes left and right heart, systemic and pulmonary circulations and cerebral circulation, and utilises patient-derived RR interval series for normal sinus rhythm (SR). Moreover, AF was simulated using patient-derived unimodal and bimodal distributed RR interval series and patient specific left ventricular systolic functions. The cardiovascular system model simulated clinically-observed haemodynamic outcomes under CF-LVAD support during AF, such as reduced right ventricular ejection fraction and elevated systolic pulmonary arterial pressure. Moreover, relatively high aortic peak pressures and middle arterial peak flow rates during AF with bimodal RR interval distribution, reduced to similar levels as during normal SR and AF with unimodal RR interval distribution under CF-LVAD support. The simulation results suggest that factors such as distribution of RR intervals and systolic left ventricular function may influence haemodynamic outcome of CF-LVAD support during AF.

1. Introduction

Atrial fibrillation (AF) is associated with an increased risk of stroke, heart failure and cognitive impairment, and it also increases the risk of death in heart failure patients [1,2,3,4]. The distribution of RR interval frequencies in AF patients is mainly unimodal or bimodal [5]. Bimodal RR interval distribution can be a sign of dual atrioventricular nodal pathway physiology [6]. AF and heart failure may coexist and show bidirectional interactions, with heart failure promoting AF and AF with an uncontrolled ventricular rate leading to ventricular tachycardiomyopathy [7,8]. Moreover, preceding and pre-preceding RR interval durations seem to play a role in the left ventricular systolic function in patients with chronic AF and dilated cardiomyopathy [9].
The prevalence of AF is high in heart failure patients supported by a continuous flow left ventricular assist device (CF-LVAD) and it reaches up to 46% [10]. However, the effects of AF remain unclear in heart failure patients implanted with a CF-LVAD for long-term support, and there is no consensus on the risks associated with AF during heart pump support [11]. There are studies reporting that AF is not associated with risk of death, stroke or thromboembolism during CF-LVAD support [12,13,14,15]. LVADs may even induce favourable atrial structural and electrical remodelling in the patients with AF; however, they may also be associated with increased mortality rates and risk of thromboembolic events after CF-LVAD implantation [10,16,17], contradictory to the previous studies. Mortality rates in heart failure patients implanted with CF-LVAD may also depend on the type of AF [18].
Decreased left ventricular ejection fraction under CF-LVAD support during AF is reported in [19], whereas another study reported no significant difference in left ventricular ejection fraction in heart failure patients with LVAD suffering from AF compared to those who did not have AF [20]. As the impact of AF on CF-LVAD therapy remains unclear, more questions such as the effects of concomitant procedures, the implanted device type, the treatment techniques for the arrhythmias and alternative strategies for anticoagulation need to be addressed in heart failure patients with a CF-LVAD [21]. Therefore, a better understanding of the AF in patients with CF-LVADs may help to improve the outcomes related to mechanical circulatory support.
Computational techniques have already been widely used to simulate different clinical scenarios and healthy and diseased physiology, in addition to CF-LVAD therapies for different conditions, as well as to understand the effects of AF on the ventricular rate and cerebral flow [22,23,24]. Computational simulations may also help to understand the effects of AF on the cardiovascular system for heart failure and CF-LVAD support. The aim of the study is developing a numerical model which can simulate atrial fibrillation in heart failure patients and evaluating conditions observed during CF-LVAD support.

2. Materials and Methods

The numerical model presented in this study utilised a patient-derived RR interval series and simulated atrial and ventricular functions, blood flow in the systemic, pulmonary, cerebral circulations and CF-LVAD support during AF.

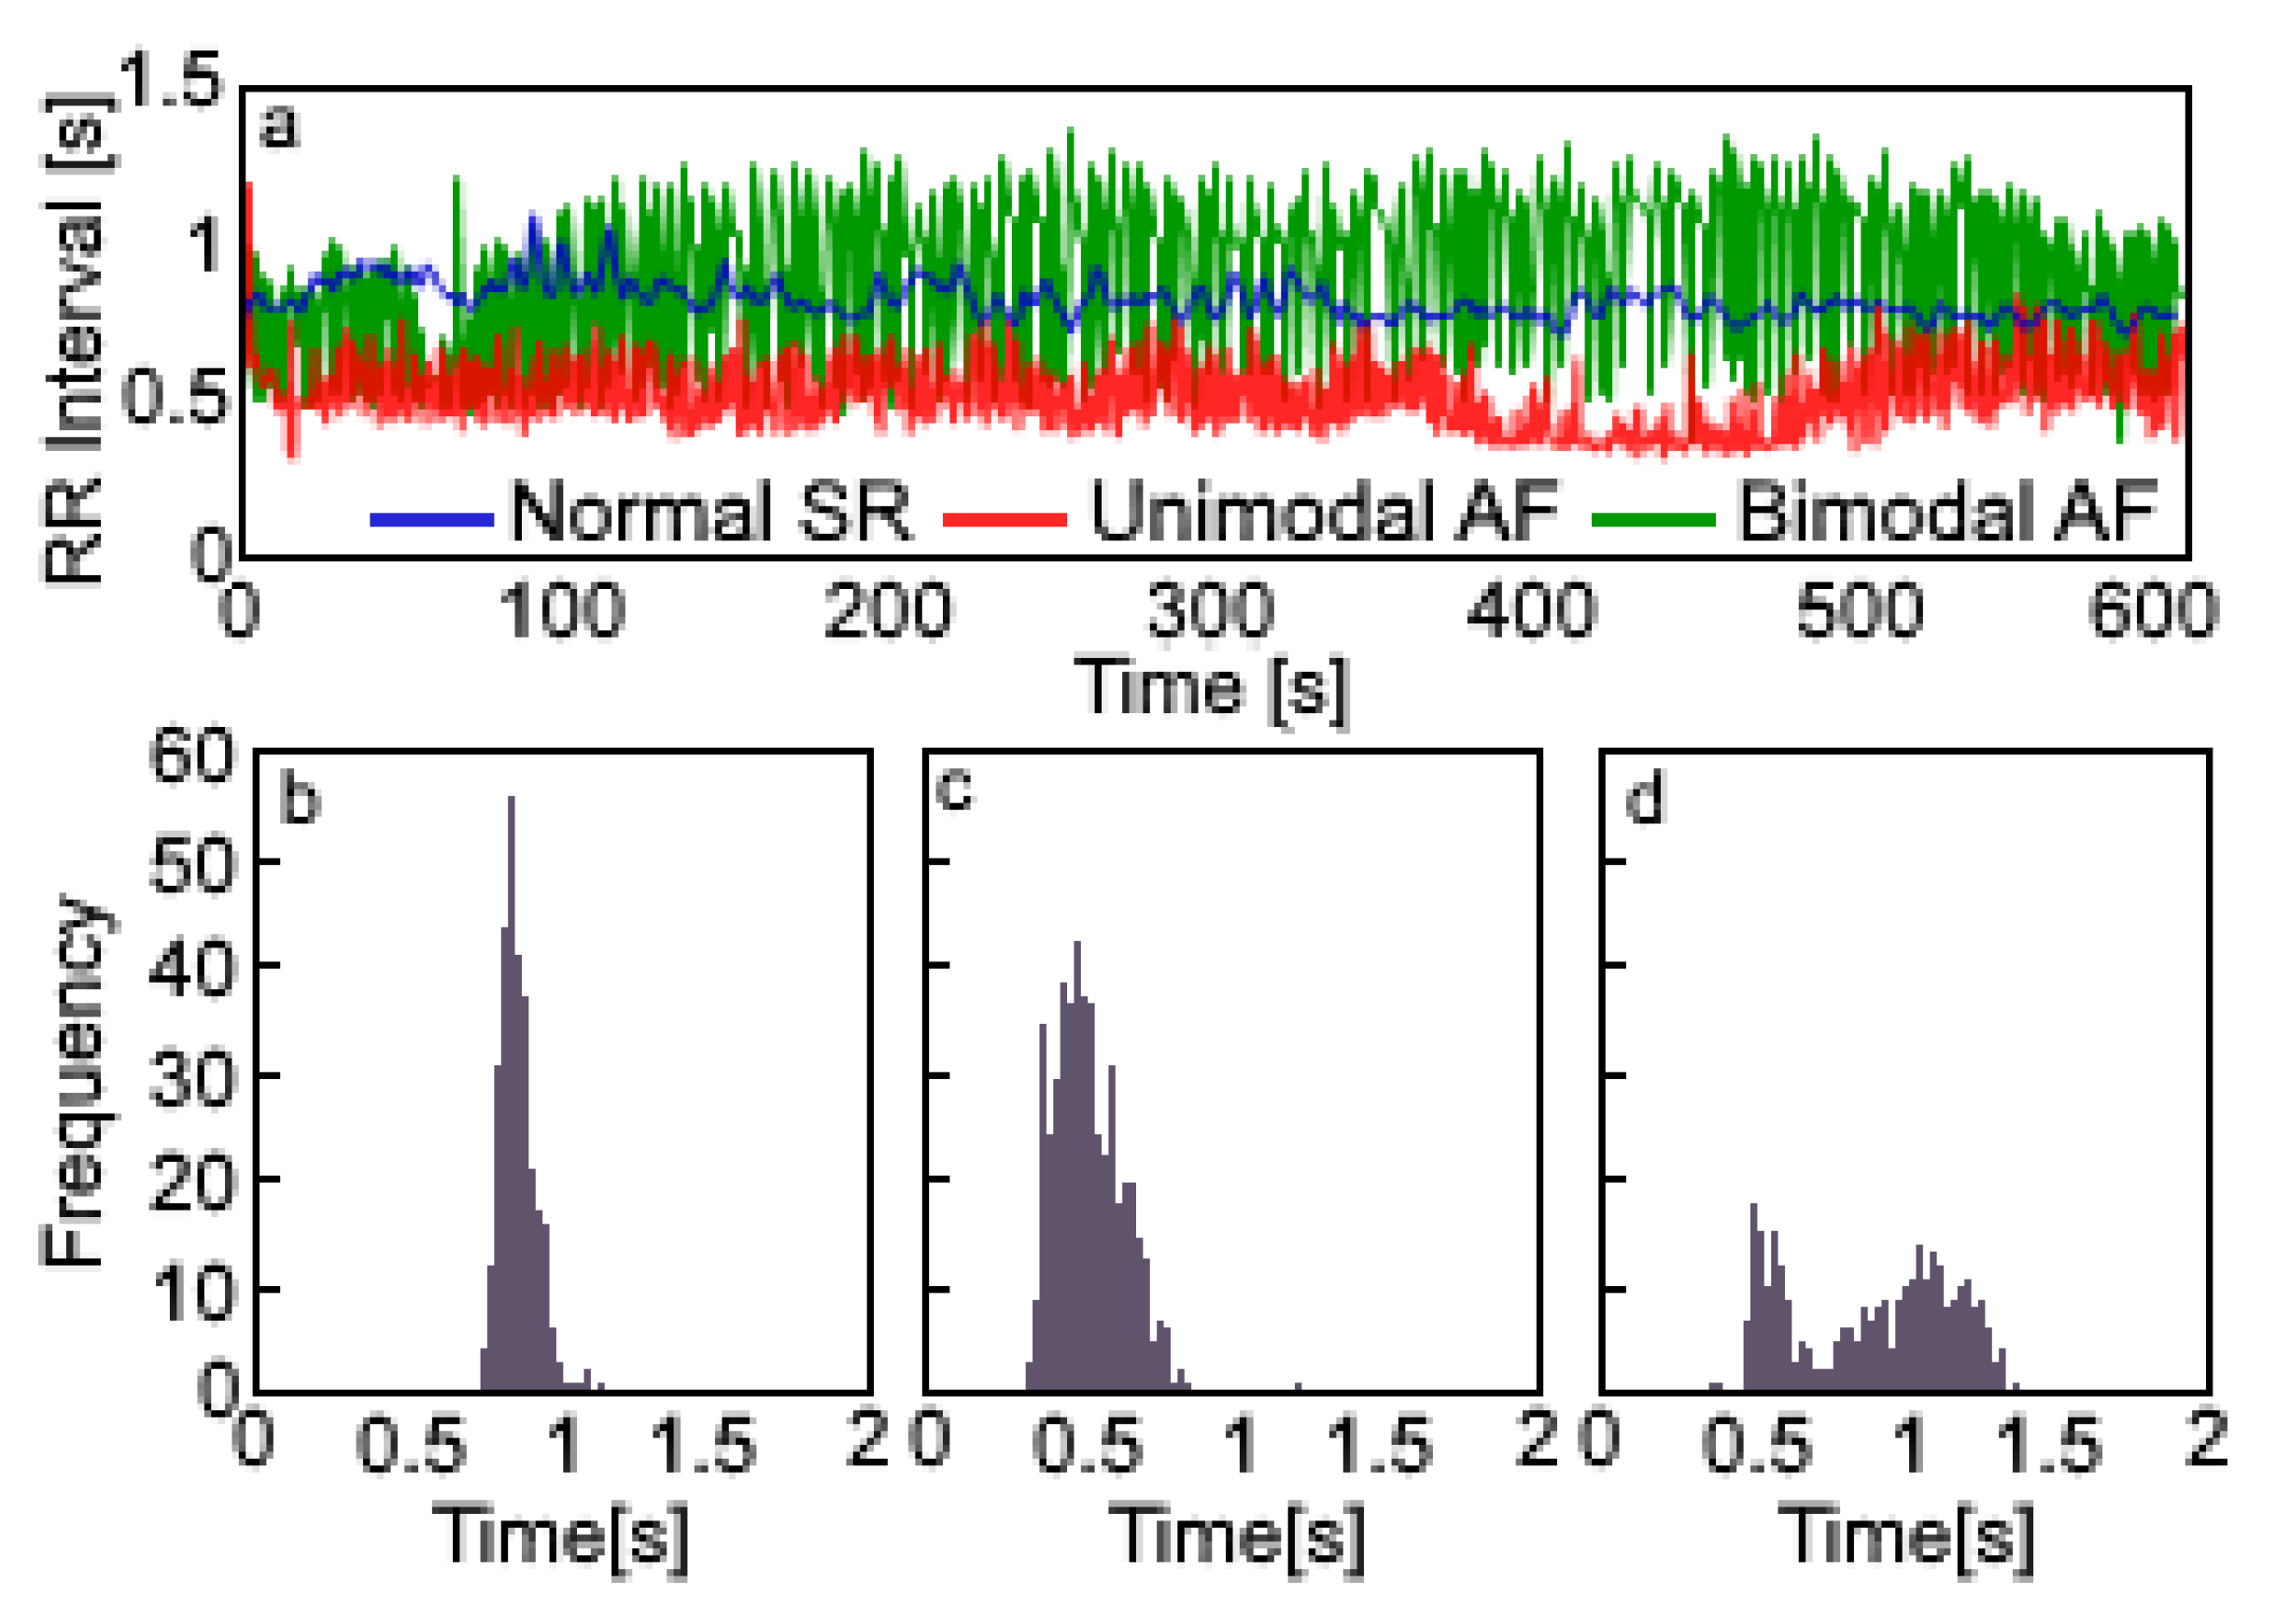
2.1. RR Interval Series

In this study, RR intervals were extracted from the patients’ Electrocardiogram (ECG) data sets available on PhysioNet (https://physionet.org/). These were used as the duration of consecutive heartbeats to simulate AF and normal SR [25] over a ten minute period. The distribution of RR intervals during AF can be unimodal, bimodal or multimodal [5] depending on the average heartbeat duration over a certain period [26]. Unimodal and bimodal RR interval distributions for AF were taken from a long-term AF database, as given in [27]. The data in this database was digitised at a sampling rate of 128 Hz at 16 bit resolution. The signals were band-pass filtered utilising a cut-off frequency at 1 and 50 Hz to avoid power line interference [27]. RR interval data from three different subjects was used in the simulations. The mean of the RR intervals simulating normal sinus rhythm (SR) was 0.828 s with a 0.051 s standard deviation and 0.006 coefficient of variation. The mean of the RR intervals simulating AF with a unimodal distribution was 0.512 s with a 0.106 s standard deviation and 0.207 coefficient of variation, whereas the mean RR interval duration simulating AF with a bimodal distribution was 0.884 s with a 0.260 s standard deviation and 0.294 coefficient of variation in the cardiovascular system model. The RR intervals and frequency histograms of the normal SR and AF data used in the simulations is given in Figure 1.

2.2. Cardiac Function

Ventricular functions were described using the relationship between ventricular pressure and volume signals by utilising both active and passive contraction components. The left ventricular pressure signal (plv) during the active contraction of the left ventricle is driven by an activation function (fact,lv) and it utilises the end-systolic elastance (Ees,lv), left ventricular volume (Vlv) and left ventricular zero pressure volume (Vlv,0) [28]. The left ventricular passive pressure component (plv,p) was modelled using an exponential relationship between pressure and volume signals [28].
p l v , a ( t ) = E e s , l v ( V l v V l v , 0 ) f a c t , l v ( t ) ,
p l v , p = A e ( B V l v ) 1 ,
p l v = p l v , a + p l v , b ,
Left ventricular volume (Vlv) was described using the left ventricular radius (rlv), long axis length (llv) and an additional coefficient (Klv), which includes effects of the contraction in the long axis and scales the proportion between the left ventricular radius and volume over a cardiac cycle [28]. Change of the left ventricular radius (rlv) was described utilising the flow rates through the aortic and mitral valves (Qav, Qmv), left ventricular volume, long axis length and the coefficient Klv [28].
V l v = 2 3 π K l v r l v 2 l l v ,
d r l v d t = 3 ( Q m v Q a v ) 4 π K l v l l v ( 3 V l v 2 π K l v l l v ) 1 / 2 ,
The activation function (fact,lv) was described using instantaneous time (t), the durations of active contraction (T1) and relaxation (T2) phases and the duration of an RR interval (RR) [29].
f a c t , l v ( t ) = { 1 cos ( ( t / T 1 ) π ) 2 0 t < T 1 , 1 + cos ( ( t T 1 ) / ( T 2 T 1 ) π ) 2 T 1 t < T 2 0 T 2 t < R R , ,
The durations of the active contraction (T1) and relaxation (T2) phases in the cardiovascular system model with normal SR were described by utilising linear relationships considering the physiological data [30].
T 1 = 0.33 R R ,
T 2 = 0.45 R R ,
The left atrial pressure (pla) and volume (Vla) relationship was described using elastance (Ela) [28,29].
p l a ( t ) = E l a ( t ) ( V l a V l a , 0 ) ,
Left atrial volume (Vla) was described using the left atrial radius (rla), long axis length (lla) and an additional coefficient (Kla) [28]. Change of the left atrial radius (rla) was described utilising the flow rates through the mitral valve and pulmonary vein (Qmv, Qvp), left atrial volume, long axis length and the coefficient Kla [28].
V l a = 2 3 π K l a r l a 2 l l a ,
d r l a d t = 3 ( Q p v Q m v ) 4 π K l a l l a ( 3 V l a 2 π K l a l l a ) 1 / 2 ,
E l a ( t ) = E min , l a + 0.5 ( E max , l a E min , l a ) f a c t . l a ( t D ) ,
f a c t , l a ( t ) = { 0 0 t < T a , 1 cos ( 2 π t T a T T a ) T a t < R R ,
Here, Emin,la and Emax,la are the minimal and maximal atrial elastances over a cardiac cycle, respectively, and Ta is the atrial activation time instant. The right ventricular pressure and volume signals were modelled in a similar way to the left ventricular pressure and volume signals using different parameter values. The right atrial pressure and volume signals were modelled in a similar way to the left atrial pressure and volume signals using different parameter values. Detailed information about the model used to describe atrial ventricular functions can be found in [28].
The atrial contraction contributes to ventricular filling around 10%–15% over each cardiac cycle for a healthy condition [31]. However, the absence of P-wave indicates an impaired function of atrial contraction due to continuous atrial activity resulting from both ectopic and re-entrant sources [32]. The impaired atrial contraction was described in the cardiovascular system models simulating AF using only the minimal atrial elastance (Emin,la) as given below [33].
E l a ( t ) = E min , l a ,
The systolic elastance in the cardiovascular system models, simulating heart failure with normal SR and AF with unimodal and bimodal RR interval distributions, was adjusted to provide the similar mean blood flow from the left ventricle over a 10 min period. Typical value of systolic elastance in healthy subjects is around 2.5 mmHg/mL; however, it reduces significantly during heart failure [34]. Therefore, systolic elastance in the cardiovascular system model, simulating the heart failure with normal SR, was set to 0.865 mmHg/mL to simulate reduced ejection fraction. A positive correlation exists between the systolic function of left ventricle and the ratio of the preceding RR intervals in heart failure patients with AF [9]. The left ventricular end-systolic elastances in the cardiovascular system models, simulating AF with unimodal (Ees,lv,u) and bimodal (Ees,lv,b) RR interval distributions, were adjusted by adopting patient-specific correlations from heart failure patients, as given in [9], to provide the similar mean blood flows in these models as in the cardiovascular system model simulating heart failure with normal SR. The left ventricular end-systolic elastances in the cardiovascular system models simulating AF were described as below.
E e s , l v , u = 0.27 R R 1 R R 2 + 0.52 ,
E e s , l v , b = 0.34 R R 1 R R 2 + 0.80 ,

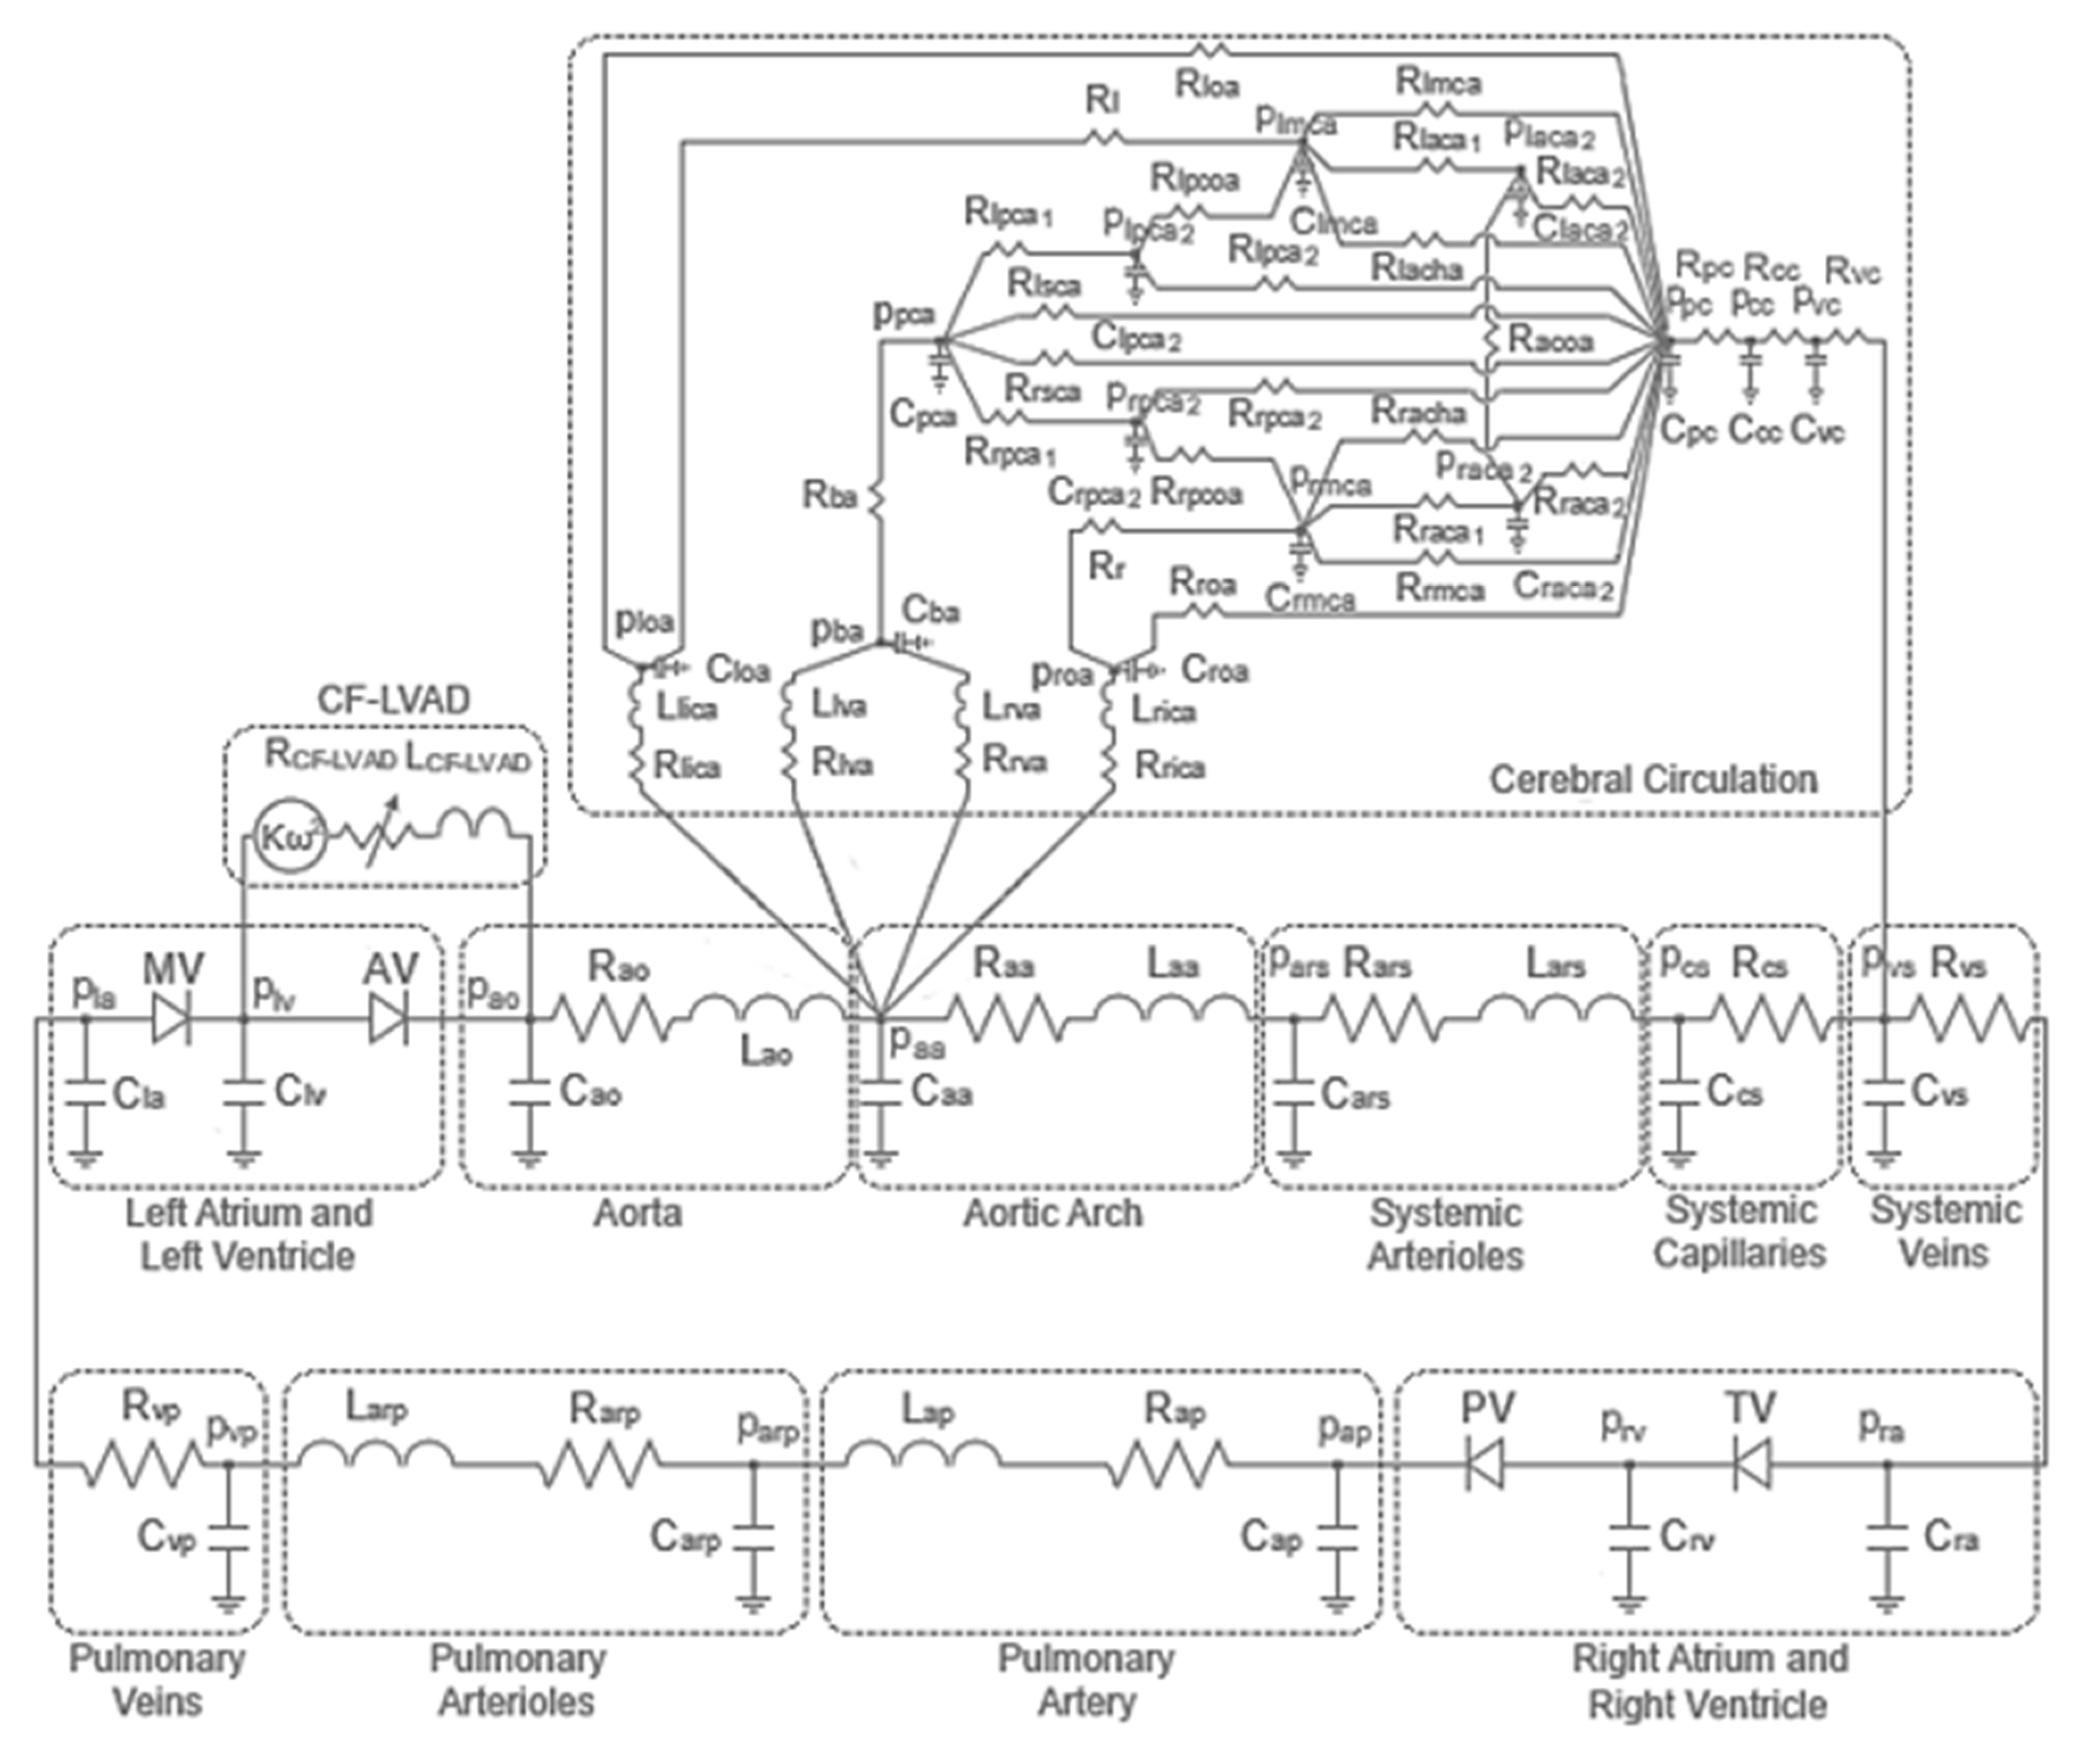
2.3. Circulatory System

The circulatory system model includes the systemic and pulmonary circulation and cerebral circulation. The model also simulates blood flow in the circle of Willis, as presented in [35]. Blood flow in the circulatory system model was described using a lumped parameter model, which included electrical analogues for resistance (R), compliance (C) and inertia (L). The heart valves were modelled as ideal diodes allowing for one-way blood flow. The aortic blood pressure (pao) and flow rate signals (Qao), as well as the aortic valve flow signal (Qav) in the circulatory system model, have been given below.
d p a o d t = Q a v Q a o C a o ,
d Q a o d t = p a o p a a R a o Q a o L a o ,
Q a v = p l v p a o R a v ,
Here, paa represents pressure in the aortic arch, Cao, Rao and Lao are the compliance, resistance and inertance in the aorta, respectively, and Rav is the aortic valve resistance. The other compartments in the circulatory system were modelled in the same way using different parameter values.

2.4. Continuous Flow Left Ventricular Assist Device (CF-LVAD) Support
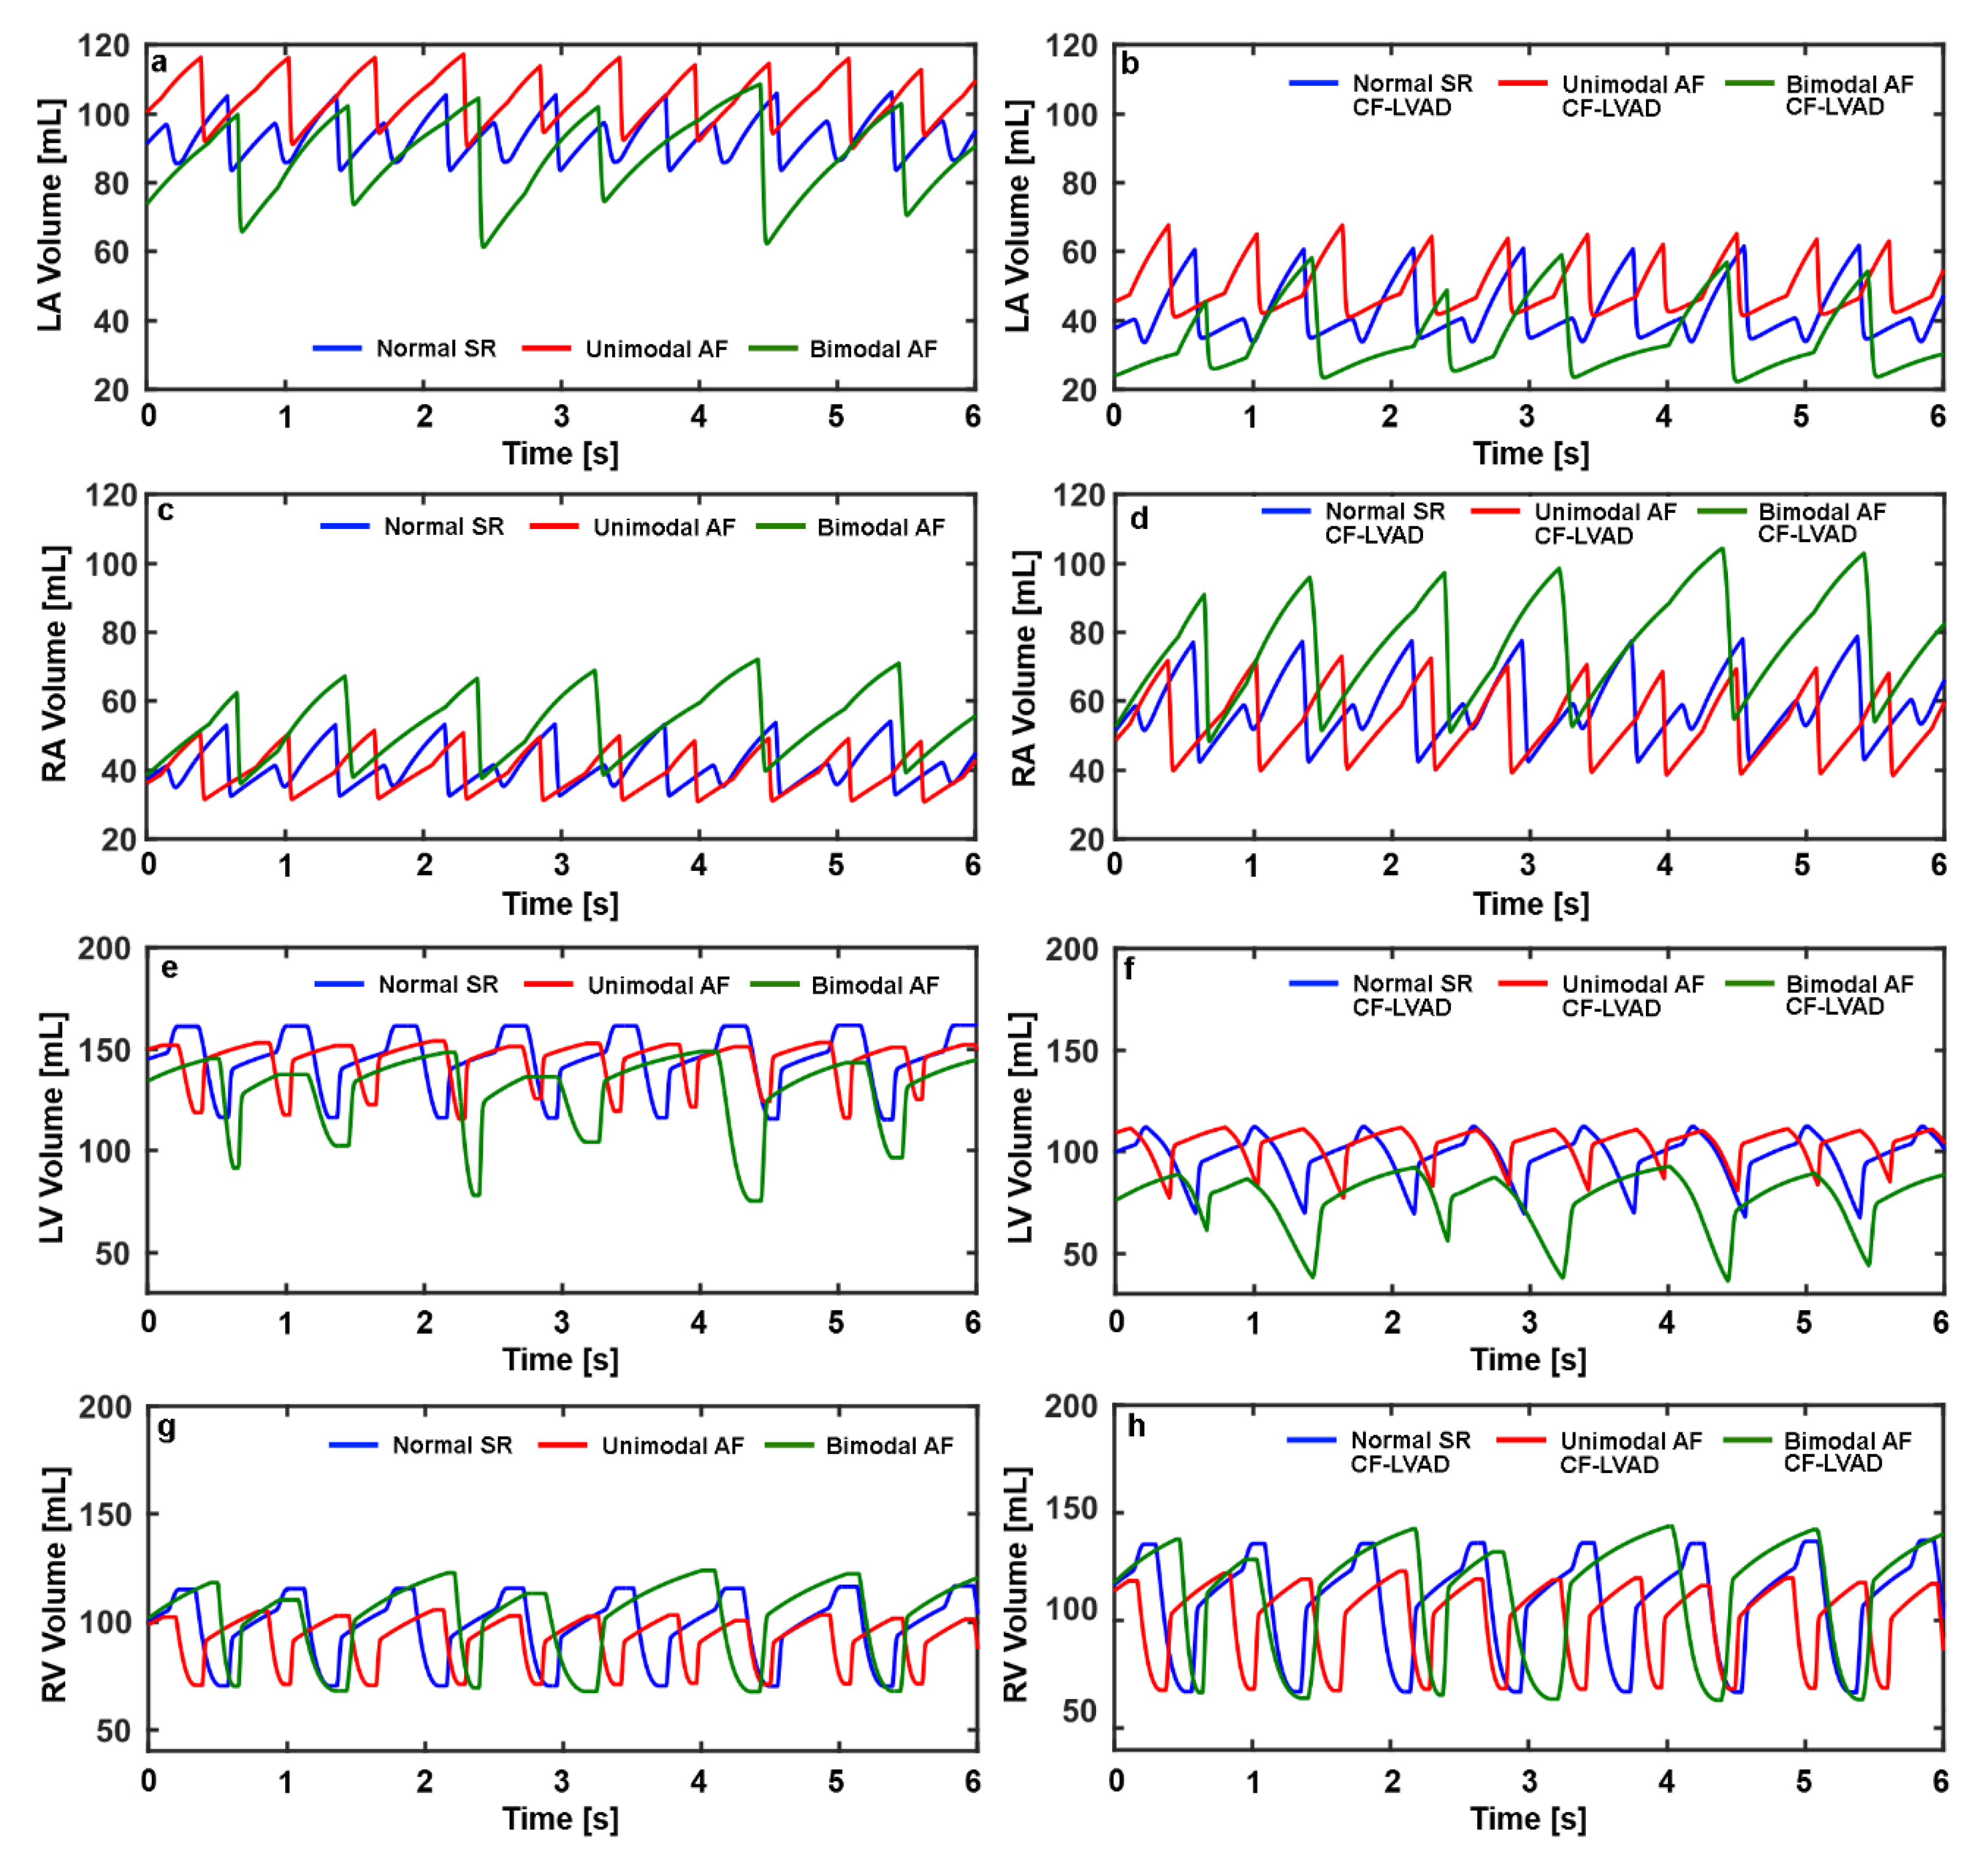
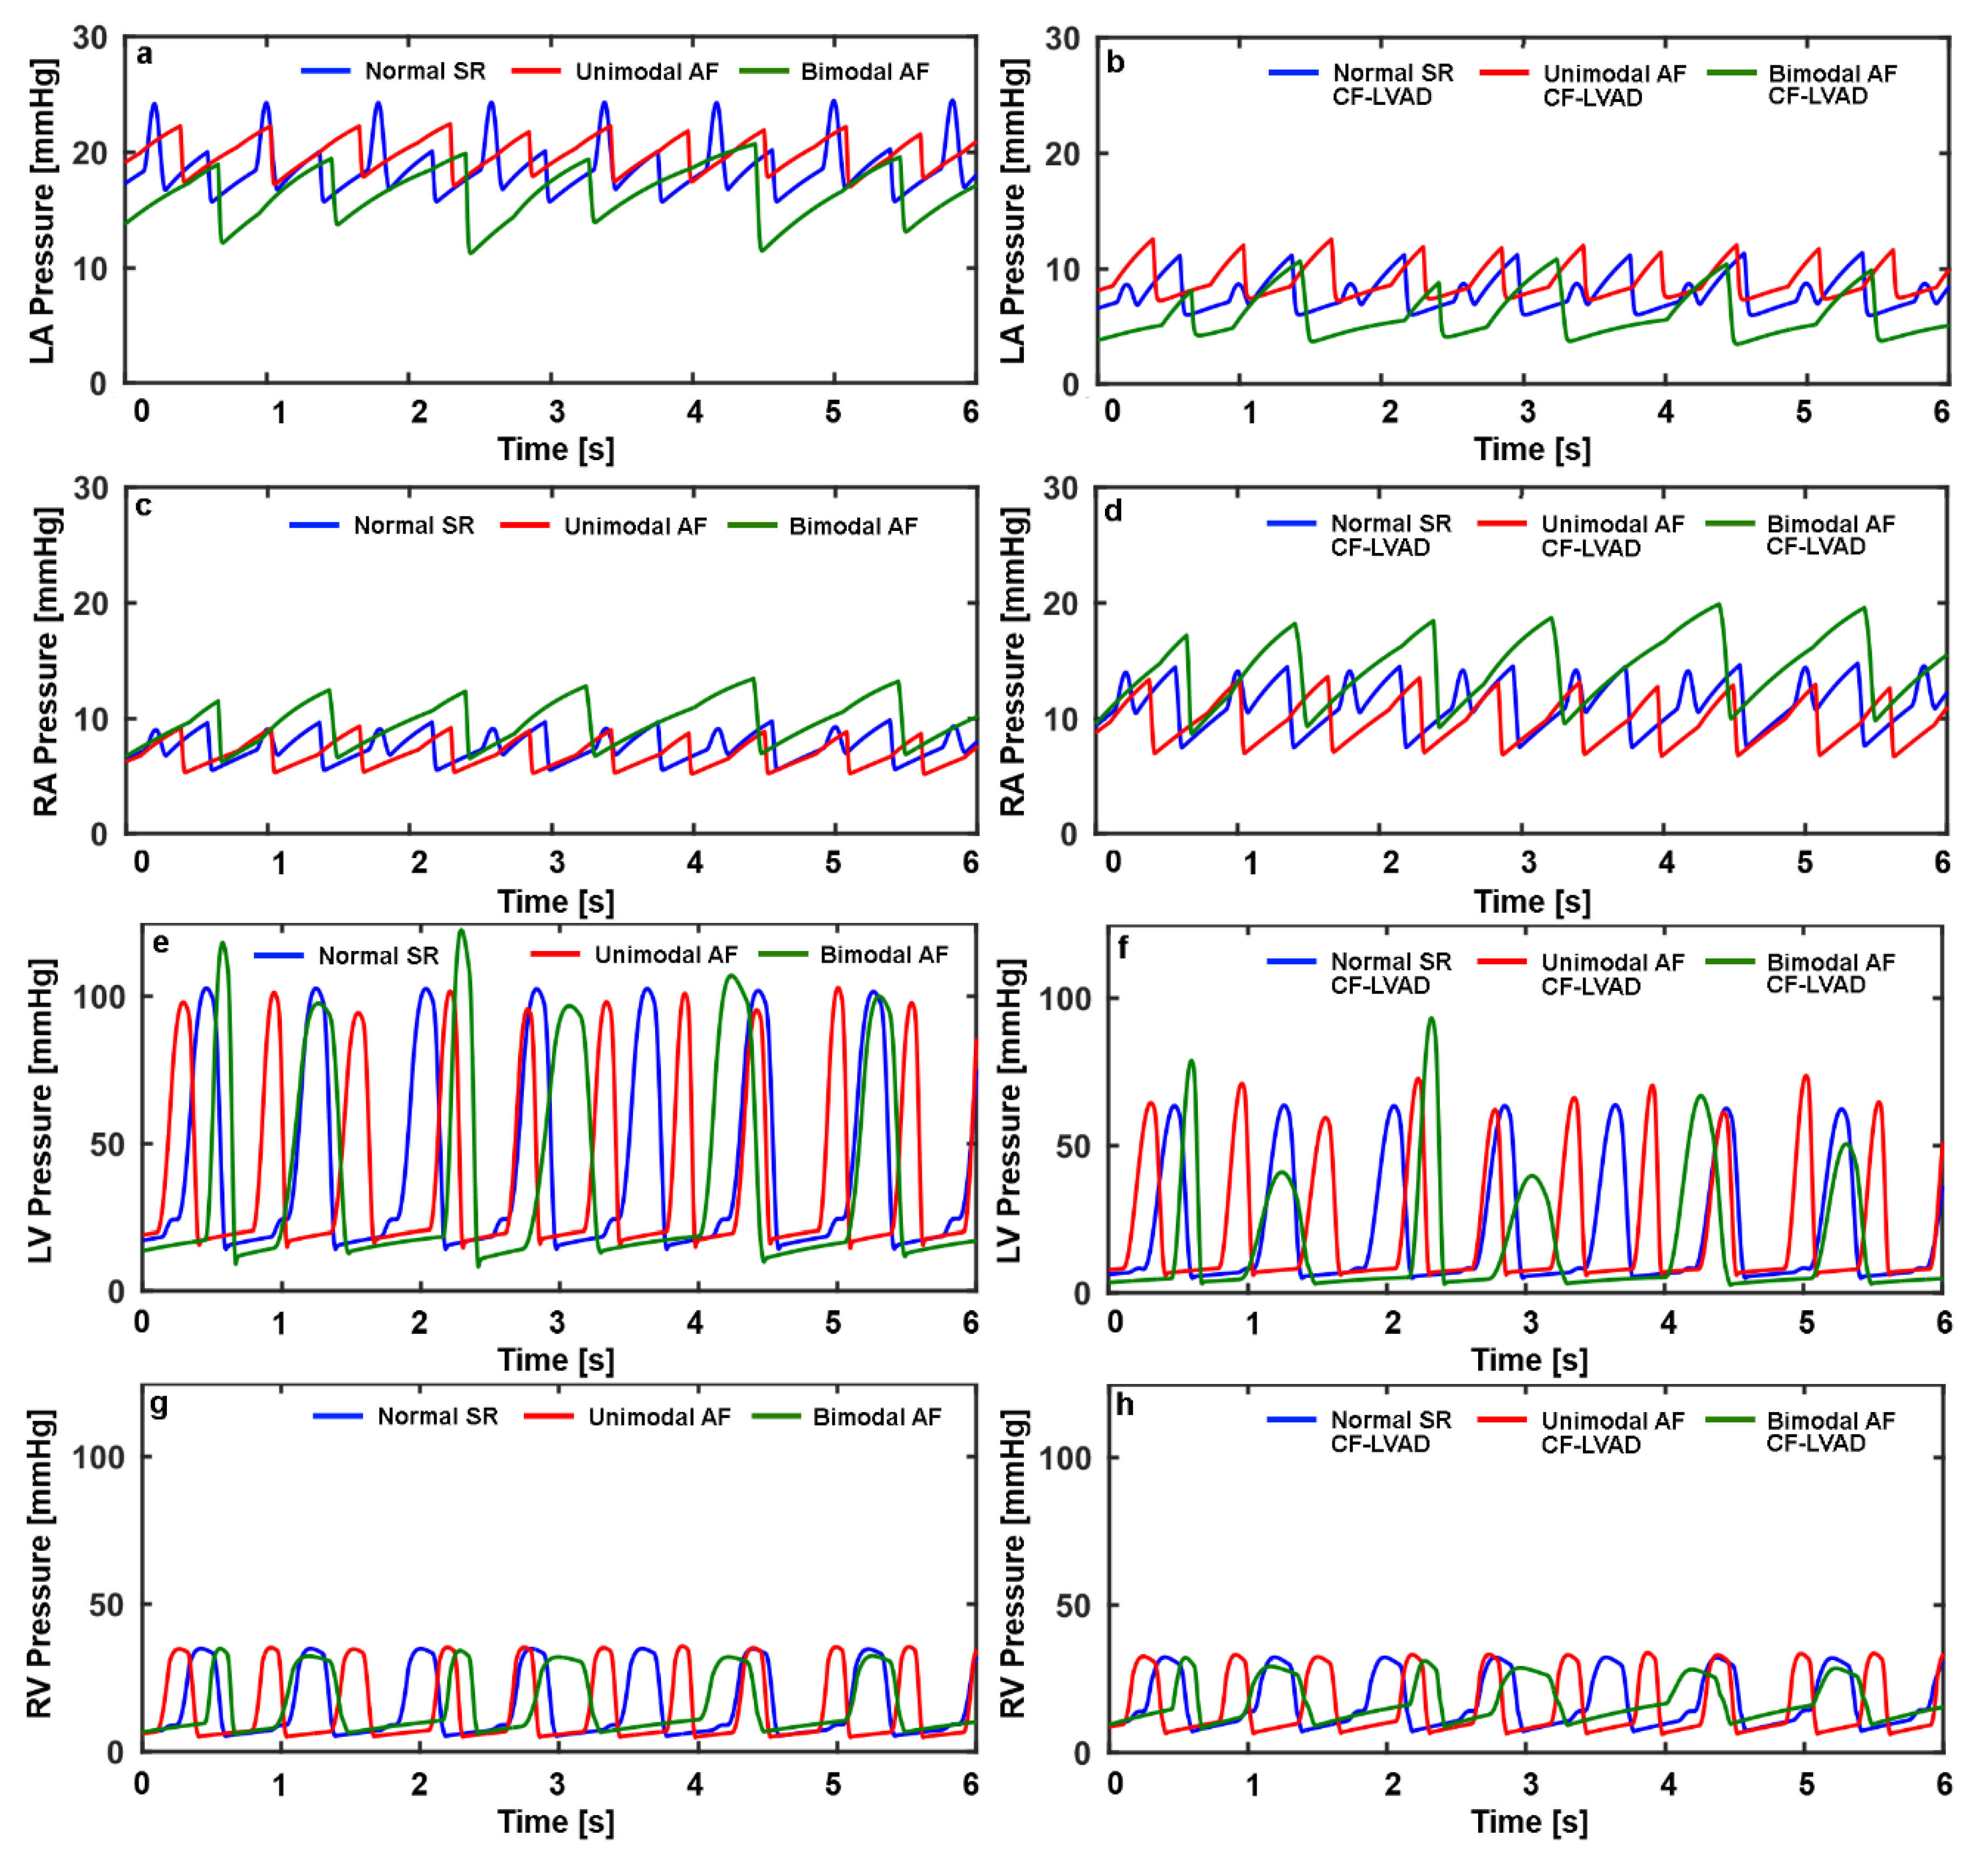
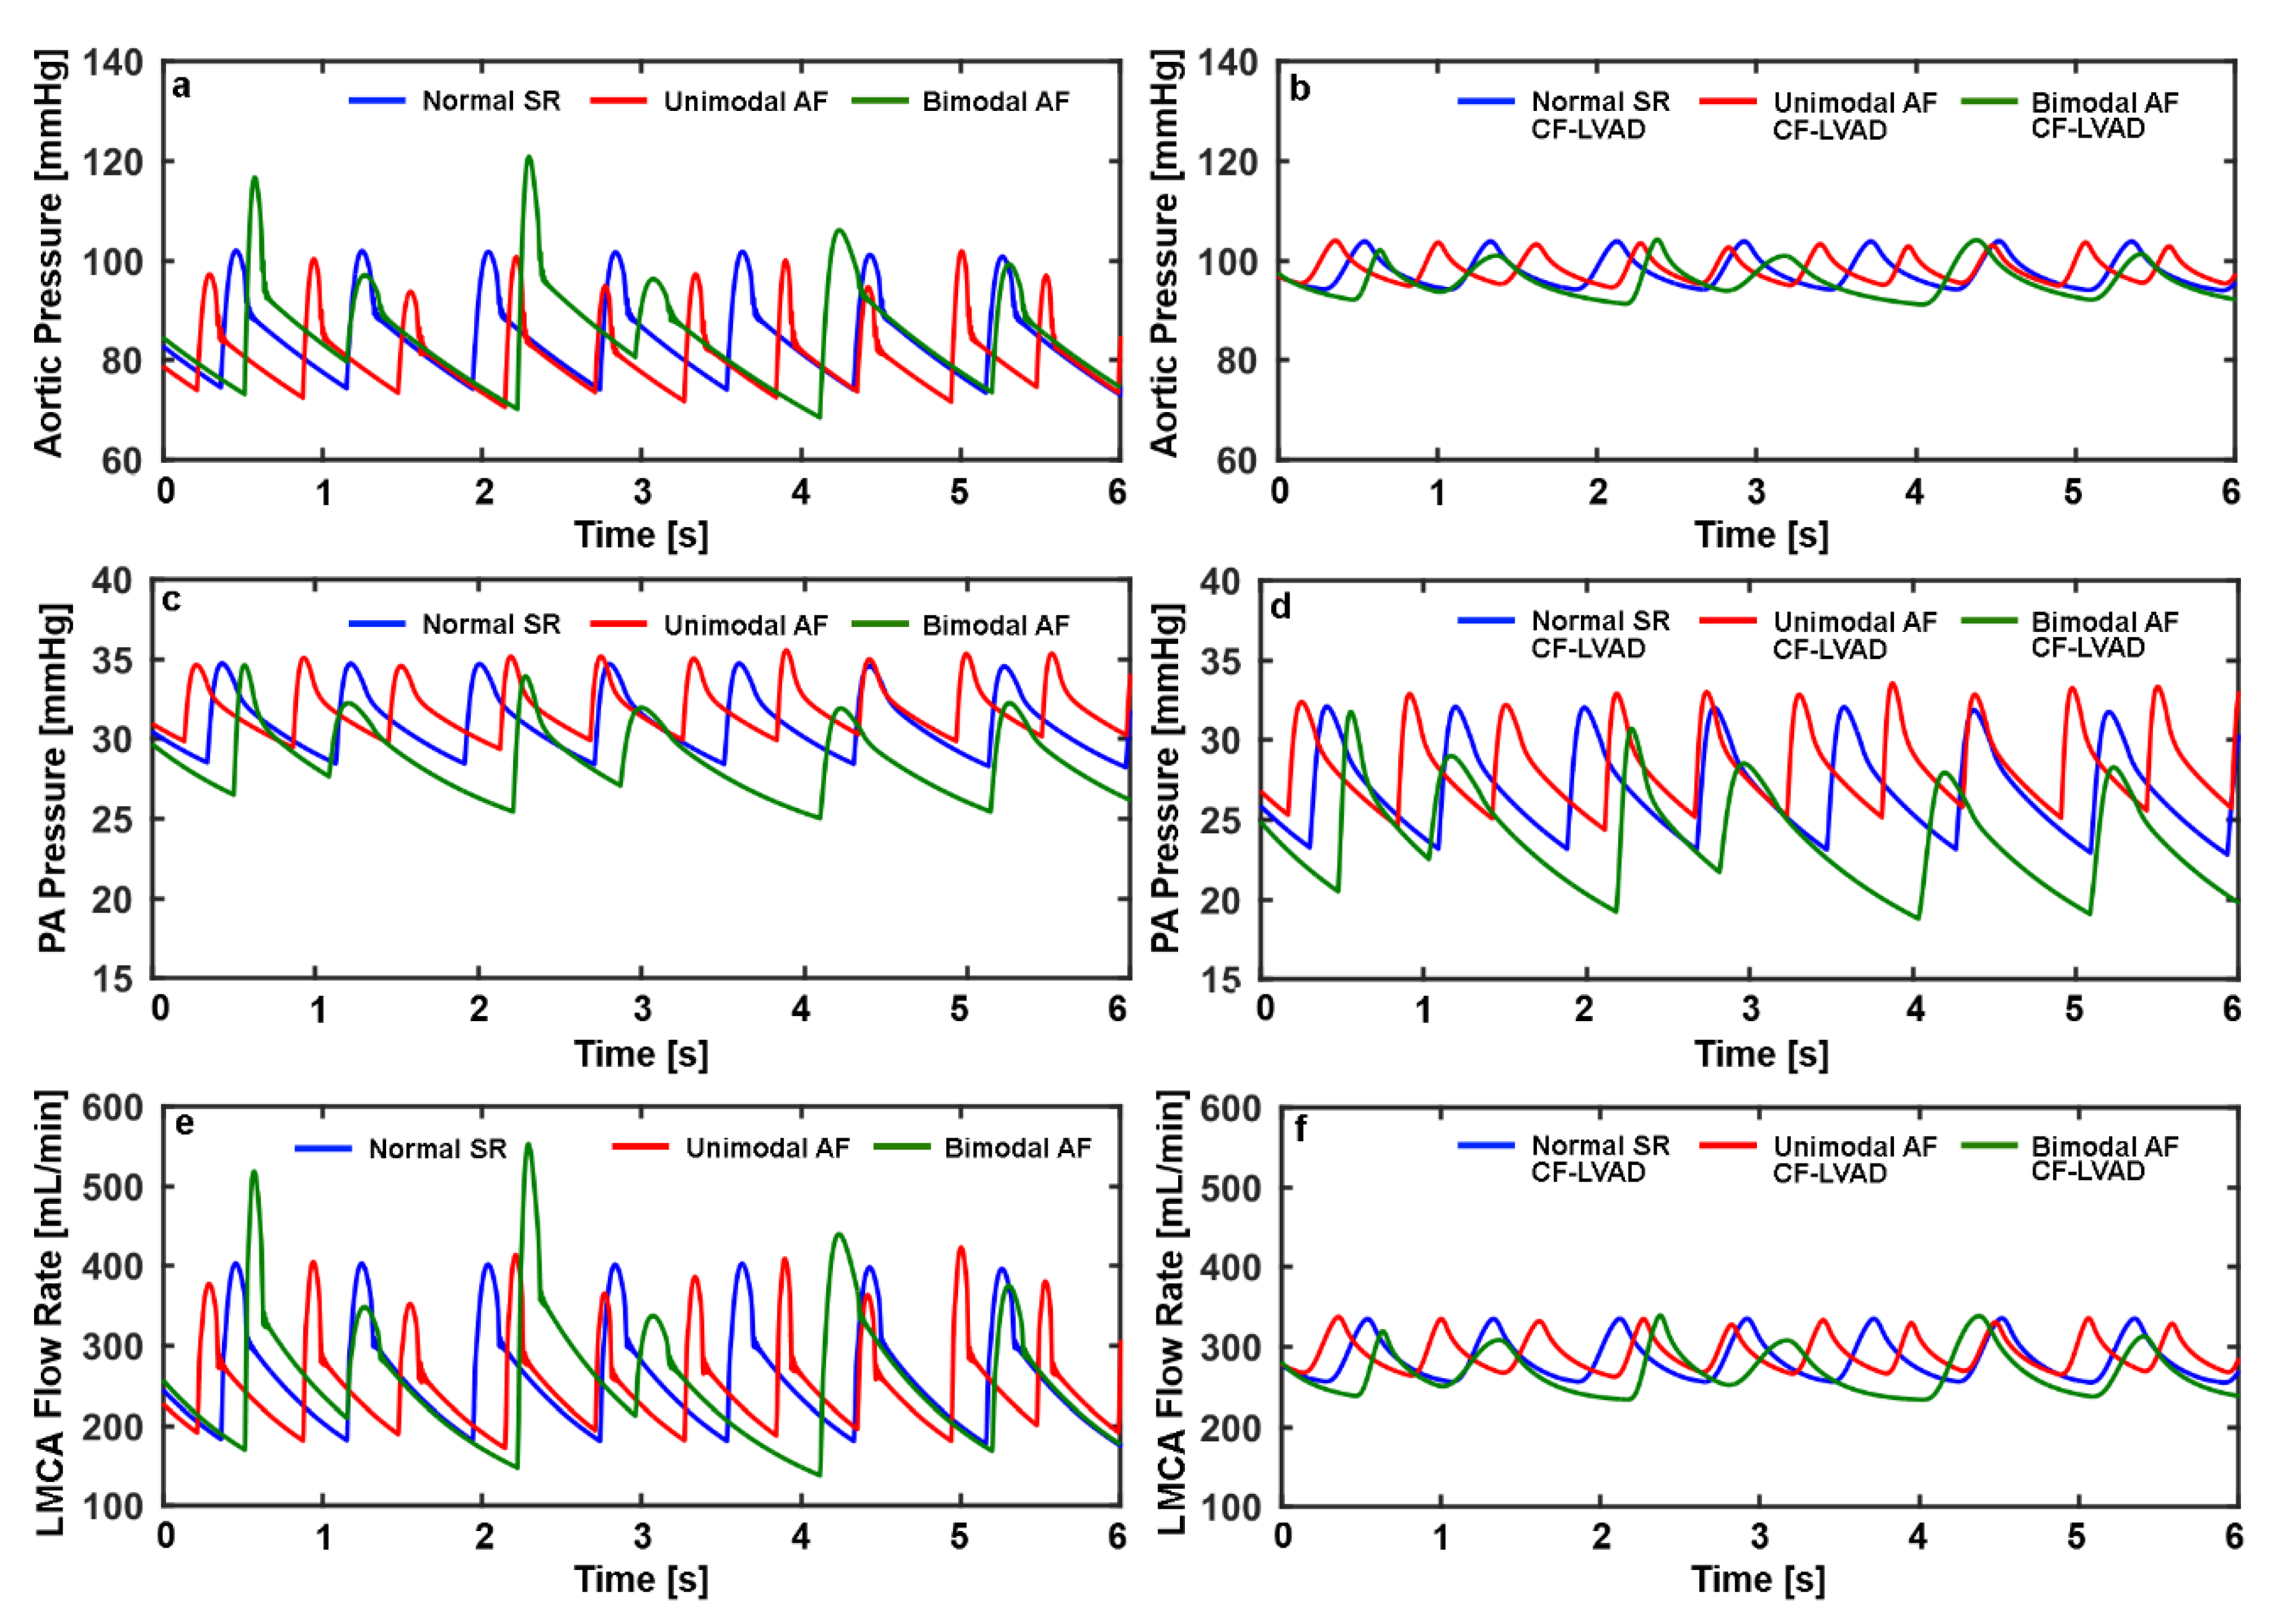
To simulate CF-LVAD support, a model that estimates the pressure difference across an axial CF-LVAD (ΔpCF-LVAD), considering operating speed of the pump (ωCF-LVAD), flow rate (QCF-LVAD) and change of the flow rate through the pump (dQCF-LVAD/dt) [36], was integrated into the cardiovascular system model.
Δ p C F L V A D = K ω C F L V A D 2 R C F L V A D Q C F L V A D L C F L V A D d Q C F L V A D d t ,
R C F L V A D = k 1 Q C F L V A D + k 2 ,
In the equations above, LCF-LVAD and RCF-LVAD are the inertance and resistance effects in the pump, respectively. K, k1 and k2 are the estimated parameters [36]. The CF-LVAD was operated at a 10,500 rpm rotation speed in the cardiovascular system models simulating the heart pump support. The CF-LVAD model was implemented into the cardiovascular system model by modifying the equations which describe change of the left ventricular radius (Equation (5)) and aortic pressure (Equation (19)) as below.
d r l v d t = 3 ( Q m v Q a v Q C F L V A D ) 4 π K l v l l v ( 3 V l v 2 π K l v l l v ) 1 / 2 ,
d p a o d t = Q a v + Q C F L V A D Q a o C a o .
Systemic arteriolar resistance was 1.25 mmHg/mL for the cardiovascular system model simulating heart failure as it increases to maintain perfusion levels in the body for a failing heart [37]. It was reduced to a healthy value, 0.75 mmHg/mL, for CF-LVAD support in the simulations, because mechanical circulatory support restores the blood flow, and pressure levels in circulatory system baroreflex control is expected to reduce the peripheral systemic resistance with increasing arterial pressure [38].
The electric-analogue of the heart chambers and the circulatory loop used to simulate normal SR and AF with unimodal and bimodal RR interval distributions for heart failure and CF-LVAD support is given in Figure 2. The list of abbreviations and the parameter values used in the circulatory loop and cardiac functions is given in the Appendix A section.
The simulations were performed using MATLAB Simulink R2017a. The set of equations was solved using the ode15 s solver. The maximum step size was 1e-3 s and the relative tolerance was set to 1e-3. All of the cardiovascular system models were run at a 40 s simulation time at a 75 bpm constant heart rate, to obtain a periodic steady state solution, before the RR intervals were used as temporal ranges for the heartbeats.

3. Results

The mean values and standard deviations of maximal and minimal volumes in the heart chambers, the left and right ventricular ejection fractions, the mean aortic and pulmonary arterial pressures and middle cerebral arterial flow for normal SR and AF with unimodal and bimodal RR interval distributions over each cardiac cycle, and cardiac and mean pump outputs for heart failure and CF-LVAD support over a ten min period are given in Table 1.
The waveforms of the left and right atrial and ventricular volumes for the simulated normal SR and AF with unimodal and bimodal RR interval distributions during heart failure and CF-LVAD support over a 6 s period are given in Figure 3.
Amplitude of the left and right atrial volume signals was relatively high during AF with bimodal RR interval distribution. Similarly, amplitude of the left and right ventricular volume signals during AF with bimodal RR interval distribution was higher, with respect to the amplitude of left and right ventricular volume signals during normal SR and AF with unimodal RR interval distribution. CF-LVAD support reduced the left atrial and ventricular volumes, whereas right atrial volumes and right ventricular end-diastolic volumes increased under CF-LVAD support for all the simulated cases. The waveforms for the left and right atrial and ventricular pressure signals for the simulated normal SR and AF with unimodal and bimodal RR interval distributions for heart failure and CF-LVAD support over a 6 s period are given in Figure 4.
Left atrial pressure during AF with bimodal RR interval distribution remained relatively low for heart failure. CF-LVAD support reduced the overall left atrial pressures for all the simulated cases, whereas right atrial pressures increased under CF-LVAD support. Left ventricular peak pressure was relatively high over some of the cardiac cycles during AF with bimodal RR interval distribution for heart failure, because of the simulated relation between left ventricular systolic elastance and preceding and pre-preceding cardiac cycle duration ratio. CF-LVAD support reduced the left ventricular pressures for all the simulated cases. Right ventricular pressures slightly decreased under CF-LVAD support. The waveforms for the aortic and pulmonary arterial pressure signals and left middle cerebral arterial blood flow rate signal for the simulated normal SR and AF with unimodal and bimodal RR interval distributions for heart failure and CF-LVAD support over a 6 s period have been given in Figure 5.
Amplitude of the aortic pressure signal during AF with bimodal RR interval distribution was higher with respect to amplitudes of the aortic pressure signals for the other cases. CF-LVAD support reduced the systolic aortic pressure for all the cases while increasing the diastolic pressure. Moreover, amplitudes of the aortic pressure signals were similar under CF-LVAD support for all the cases. Pulmonary arterial pressure reduced under CF-LVAD support for all the simulated cases. The amplitude of the middle cerebral arterial flow rate signal during AF with bimodal RR interval distribution was higher with respect to the amplitudes of the middle cerebral arterial flow rate during normal SR and AF with unimodal RR interval distribution. The amplitudes of the middle cerebral arterial flow rate signals were similar for all cases where there was CF-LVAD support.

4. Discussion

This study utilises a computational model simulating cardiovascular system dynamics and an integrated CF-LVAD model. The cardiovascular system model allows to simulate different physiological scenarios and mechanisms. For instance, the interaction between the preceding and pre-preceding RR intervals and left ventricular systolic function in patients with chronic AF and dilated cardiomyopathy was simulated in this study. Therefore, the effect of RR interval distributions on the haemodynamic outcome CF-LVAD support can be simulated using the presented cardiovascular system model.
The mean RR interval duration in the cardiovascular system model simulating AF with unimodal RR interval distribution was 0.512 s corresponding to a 117 bpm heart rate. Although such a high heart rate is common in untreated AF patients, the current guidelines suggest to reduce the heart rate below 100 bpm in AF patients [39]. The RR interval duration in the cardiovascular system model simulating AF with bimodal RR interval distribution was 0.884 s corresponding to 68 bpm. This is below the suggested target heart rate. It should also be noted that the RR interval durations used in this study are patient specific and the AF treatment is not included in the utilised numerical models.
The left ventricular ejection fraction was relatively low in the cardiovascular system simulating AF with unimodal RR interval distribution. It has already been shown that there is a strong correlation between the ejection fraction and the ratio of preceding and pre-preceding RR intervals during AF [40]. A higher preceding and pre-preceding RR interval ratio results in high ejection fraction as in the cardiovascular system model simulating AF with bimodal RR interval distribution [40].
The low right ventricular ejection fraction during normal SR and AF with bimodal RR interval distribution increased above 50% under CF-LVAD support similar to a healthy cardiovascular system [41]. Although the right ventricular ejection fraction during AF with a unimodal RR interval distribution increased as well under CF-LVAD support, it was around 40% which indicates an impaired function. It is already known that the right ventricular function may be impaired in heart failure patients with AF under CF-LVAD support [42]. The cardiovascular system model produced impaired right ventricular function for relatively short cardiac cycles and unimodal RR interval distribution. Systolic pulmonary arterial pressures also reported to be relatively high in LVAD implanted heart failure patients with AF with respect to patients without AF [20]. Again, the cardiovascular system model produced relatively high systolic pulmonary arterial pressures for unimodal RR interval distribution under CF-LVAD support (Table 1). Higher aortic peak pressures and middle cerebral arterial peak flow rates may result in increased cerebral hypertensive events [24]. Relatively high aortic peak pressures and middle cerebral arterial peak flow rates were relatively high produced for bimodal RR interval distribution without CF-LVAD support (Figure 5). The peak values in the aortic pressure and middle cerebral arterial flow rate signals were reduced to similar values under CF-LVAD support for all the cases (Figure 5). Such a result may show the beneficial effect of CF-LVAD therapy on the patients with AF. However, it should be noted that the mean values of the aortic pressures and middle cerebral arterial flow rates were different in each case under heart pump support. Although cardiovascular system model generated similar cardiac outputs for each case, the mean pump outputs were remarkably different. The different mean pump outputs were obtained for each case depending on the duration of the cardiac cycles utilised in the simulations and varying CF-LVAD resistance used to describe CF-LVAD support (Equation (21)).
The left and right atrial volumes are similar in healthy cardiovascular system [43,44,45]. However, relatively high left atrial volumes were simulated in the cardiovascular system models for all of the cases because the simulations were performed considering impaired systolic left ventricular function which may cause dilation in the left atrium [46]. It should be noted that the left atrial volumes were reduced to values comparable to healthy conditions for all the simulated cases under CF-LVAD support.
The simulation results in this study depend on the selected patient-specific relations and parameter settings. However, it should be noted that utilised patient-specific relations and parameter settings were able simulate conditions such as reduced right ventricular ejection fraction or high systolic pulmonary arterial pressure, which are also observed in the clinical studies [20,42] for different cases. The simulations were performed using data from two different AF patients and one healthy individual. The mean values and variability of the haemodynamic parameters for each cardiac cycle are given in the Results section. A statistical comparison between the groups was not performed because the data from one patient were utilised for each case. Nonetheless, the results provide useful insights about the effect of preceding and pre-preceding RR intervals of AF and CF-LVAD support. The cardiovascular system model utilises patient-derived series to simulate AF. Incorporating dynamical models that simulate electrocardiogram signals or dual pathway atrioventricular nodal conduction [47,48,49,50] with the existing cardiovascular system model may allow to simulate the dependence of the cardiovascular response on the rate and regularity of ventricular activation in AF [51]. Elaborating the cardiovascular system model to simulate atrioventricular nodal dynamics and the evaluation of CF-LVAD support and validation of the results will be future work.

5. Conclusions

The presented cardiovascular system model simulates AF for unimodal and bimodal RR interval distributions and Normal SR. Clinically-observed haemodynamic outcomes under CF-LVAD support during AF such as reduced right ventricular ejection fraction or high systolic pulmonary arterial pressure were simulated utilising patient-derived RR interval series and the interaction between the preceding and pre-preceding RR interval and left ventricular systolic function. The results in the submitted study show that patient specific conditions such as duration of preceding and pre preceding RR intervals may play a role on the outcome of the CF-LVAD therapy during atrial fibrillation. Moreover, the simulation results provide insights and possible future research directions for AF under CF-LVAD support.

Funding

This research received no external funding.

Conflicts of Interest

The author declares no conflicts of interest.

Appendix A

Table A1. List of abbreviations.
Nomenclaturevppulmonary veins
ppressurericaright internal carotid artery
Vvolumelicaleft internal carotid artery
Qflow ratervaright vertebral artery
ttimelvaleft vertebral artery
Rresistanceroaright ophthalmic artery
Linertanceloaleft ophthalmic artery
Ccompliancebabasilar artery
AVaortic valvepcaposterior cerebral arteries
MVmitral valverpcaright posterior cerebral artery
PVpulmonary valvelpcaleft posterior cerebral artery
TVtricuspid valverpcoaright posterior communicating artery
EFejection fractionlpcoaleft posterior communicating artery
AFatrial fibrillationrscaright superior cerebellar artery
NSRnormal sinus rhythmlscaleft superior cerebellar artery
UAFAF with unimodal RR interval distributionracharight anterior choroidal artery
BAFAF with bimodal RR interval distributionlachaleft anterior choroidal artery
CF-LVADcontinuous flow left ventricular assist devicermcaright middle cerebral artery
Subscriptslmcaleft middle cerebral artery
laleft atriummcamiddle cerebral artery
lvleft ventricleracaright anterior cerebral artery
raright atriumlacaleft anterior cerebral artery
rvright ventricleacoaanterior communicating artery
aoaortapcpial circulation
aaaortic archcccerebral capillaries
arssystemic arteriolesvccerebral veins
cssystemic capillaries1segment one
vssystemic veins2segment two
appulmonary arteriesmaxmaximal
arppulmonary arteriolesminminimal
Table A2. Parameter values used circulatory loop. R, L and C represent resistance, inertance and compliance of the blood vessels, respectively. The value in the brackets show systemic arteriolar resistance under CF-LVAD support.
R [mmHgs/mL]L [mmHgs2/mL]C [mL/mmHg]
Mitral Valve0.0025--
Aortic Valve0.0025--
Pulmonary Valve0.0010--
Tricuspid Valve0.0010--
Aorta0.010.00010.04
Aortic Arch0.050.00010.25
Systemic Arterioles1.25 (0.75)0.00012
Systemic Capillaries0.24-4
Systemic Veins0.1-30
Pulmonary Arteries0.020.00013
Pulmonary Arterioles0.10.00016
Pulmonary Veins0.1-30
Internal Carotid Arteries1.7380.0001-
Vertebral Arteries50.0001-
Basilar Artery6.474-0.001
Posterior Cerebral Arteries 10.821-0.001
Posterior Cerebral Arteries 23.877-0.001
Posterior Communicating Arteries321--
Superior Cerebellar Arteries7.143--
Anterior Choroidal Arteries125--
Middle Cerebral Arteries8.940-0.001
Ophthalmic Arteries125-0.001
Anterior Cerebral Arteries 19.761--
Anterior Cerebral Arteries 24.178-0.001
Anterior Communicating Artery53.571--
Pial Circulation3.6-0.5
Cerebral Capillaries0.1-2
Cerebral Veins0.1-6
Table A3. Parameter values used in the atrial and ventricular models. LA, LV, RA and RV represent left atrium and ventricle and right atrium and ventricle, respectively, NSR, UAF and BAF represent normal sinus rhythm, unimodal atrial fibrillation and bimodal atrial fibrillation, respectively, Emax, Emin and Esys are the maximal and minimal elastances in atria and systolic elastance in ventricles, respectively, and A and B are coefficients use in the model describing the passive component of the ventricular pressure signal.
Emax [mmHg/mL]Emin [mmHg/mL]Esys [mmHg/mL]AB
LANSR0.30.2---
UAF-0.2---
BAF-0.2---
LVNSR--0.86510.02
UAF--0.27(RR1/RR2) + 0.5210.02
BAF--0.34(RR1/RR2) + 0.8010.02
RANSR0.30.2---
UAF-0.2---
BAF-0.2---
RVNSR--110.02
UAF--110.02
BAF--110.02

References

  1. Chamberlain, A.M.; Redfield, M.M.; Alvaro, A.; Weston, S.A.; Roger, V.L. Atrial Fibrillation and Mortality in Heart Failure. Circ. Heart Fail. 2011, 4, 740–746. [Google Scholar] [CrossRef] [PubMed] [Green Version]
  2. Thacker, E.L.; McKnight, B.; Psaty, B.M.; Longstreth, W.T.; Sitlani, C.M.; Dublin, S.; Arnold, A.M.; Fitzpatrick, A.L.; Gottesman, R.F.; Heckbert, S.R. Atrial fibrillation and cognitive decline: A longitudinal cohort study. Neurology 2013, 81, 119–125. [Google Scholar] [CrossRef] [PubMed]
  3. Piccini, J.P.; Daubert, J.P. Atrial Fibrillation and Sudden Cardiac Death: Is Heart Failure the Middleman? JACC Heart Fail. 2014, 2, 228–229. [Google Scholar] [CrossRef] [PubMed]
  4. Odutayo, A.; Wong, C.X.; Hsiao, A.J.; Hopewell, S.; Altman, D.G.; Emdin, C.A. Atrial fibrillation and risks of cardiovascular disease, renal disease, and death: Systematic review and meta-analysis. BMJ 2016, 354, i4482. [Google Scholar] [CrossRef] [PubMed] [Green Version]
  5. Weismüller, P.; Kratz, C.; Brandts, B.; Kattenbeck, K.; Trappe, H.J.; Ranke, C. AV nodal pathways in the R-R interval histogram of the 24-hour monitoring ECG in patients with atrial fibrillation. Ann. Noninvasive Electrocardiol. 2001, 6, 285–289. [Google Scholar] [CrossRef]
  6. Tebbenjohanns, J.; Schumacher, B.; Korte, T.; Niehaus, M.; Pfeiffer, D. Bimodal RR interval distribution in chronic atrial fibrillation: Impact of dual atrioventricular nodal physiology on long-term rate control after catheter ablation of the posterior atrionodal input. J. Cardiovasc. Electrophysiol. 2000, 11, 497–503. [Google Scholar] [CrossRef]
  7. Kirchhof, P.; Benussi, S.; Kotecha, D.; Ahlsson, A.; Atar, D.; Casadei, B.; Castella, M.; Diener, H.-C.; Heidbuchel, H.; Hendriks, J.; et al. 2016 ESC Guidelines for the management of atrial fibrillation developed in collaboration with EACTS. Eur. J. Cardio-Thorac. Surg. 2016, 50, e1–e88. [Google Scholar] [CrossRef]
  8. Mohamed, H.A. Tachycardia-induced Cardiomyopathy (Tachycardiomyopathy). Libyan J. Med. 2007, 2, 26–29. [Google Scholar] [CrossRef]
  9. Tanabe, M.; Onishi, K.; Dohi, K.; Kitamura, T.; Ito, M.; Nobori, T.; Nakano, T. Assessment of left ventricular systolic function in patients with chronic atrial fibrillation and dilated cardiomyopathy using the ratio of preceding to prepreceding R-R intervals. Int. J. Cardiol. 2006, 108, 197–201. [Google Scholar] [CrossRef]
  10. Deshmukh, A.; Kim, G.; Burke, M.; Anyanwu, E.; Jeevanandam, V.; Uriel, N.; Tung, R.; Ozcan, C. Atrial Arrhythmias and Electroanatomical Remodeling in Patients With Left Ventricular Assist Devices. J. Am. Heart Assoc. 2017, 6, e005340. [Google Scholar] [CrossRef] [Green Version]
  11. Kadado, A.J.; Akar, J.G.; Hummel, J.P. Arrhythmias after left ventricular assist device implantation: Incidence and management. Trends Cardiovasc. Med. 2018, 28, 41–50. [Google Scholar] [CrossRef] [PubMed]
  12. Hickey, K.T.; Garan, H.; Mancini, D.M.; Colombo, P.C.; Naka, Y.; Sciacca, R.R.; Abrams, M.P.; Solove, M.; Zeoli, N.; Flannery, M.; et al. Atrial Fibrillation in Patients With Left Ventricular Assist Devices: Incidence, Predictors, and Clinical Outcomes. JACC Clin. Electrophysiol. 2016, 2, 793–798. [Google Scholar] [CrossRef] [PubMed]
  13. Kittipibul, V.; Rattanawong, P.; Kewcharoen, J.; Chongsathidkiet, P.; Vutthikraivit, W.; Kanjanahattakij, N. Atrial Fibrillation Is Not Associated With Thromboembolism in Left Ventricular Assist Device Patients: A Systematic Review and Meta-Analysis. ASAIO J. 2019, 65, 456–464. [Google Scholar] [CrossRef] [PubMed]
  14. Xuereb, L.; Go, P.H.; Kaur, B.; Akrawe, S.; Nemeh, H.W.; Borgi, J.; Williams, C.T.; Paone, G.; Morgan, J.A. Impact of Preoperative Atrial Fibrillation on Postoperative Thromboembolic Events After Left Ventricular Assist Device Implantation. Ann. Thorac. Surg. 2016, 102, 1543–1549. [Google Scholar] [CrossRef] [PubMed] [Green Version]
  15. Xia, Y.; Stern, D.; Friedmann, P.; Goldstein, D. Preoperative atrial fibrillation may not increase thromboembolic events in left ventricular assist device recipients on midterm follow-up. J. Heart Lung Transplant. 2016, 35, 906–912. [Google Scholar] [CrossRef] [PubMed]
  16. Oezpeker, C.; Zittermann, A.; Pühler, T.; Ensminger, S.; Gummert, J.F.; Morshuis, M. Permanent Atrial Fibrillation and 2 Year Clinical Outcomes in Patients with a Left Ventricular Assist Device Implant. ASAIO J. 2017, 63, 419–424. [Google Scholar] [CrossRef]
  17. Stulak, J.M.; Deo, S.; Schirger, J.; Aaronson, K.D.; Park, S.J.; Joyce, L.D.; Daly, R.C.; Pagani, F.D. Preoperative atrial fibrillation increases risk of thromboembolic events after left ventricular assist device implantation. Ann. Thorac. Surg. 2013, 96, 2161–2167. [Google Scholar] [CrossRef]
  18. Enriquez, A.D.; Calenda, B.; Gandhi, P.U.; Nair, A.P.; Anyanwu, A.C.; Pinney, S.P. Clinical impact of atrial fibrillation in patients with the HeartMate II left ventricular assist device. J. Am. Coll. Cardiol. 2014, 64, 1883–1890. [Google Scholar] [CrossRef] [Green Version]
  19. Brisco, M.A.; Sundareswaran, K.S.; Milano, C.A.; Feldman, D.; Testani, J.M.; Ewald, G.A.; Slaughter, M.S.; Farrar, D.J.; Goldberg, L.R. HeartMate II Clinical Investigators Incidence, risk, and consequences of atrial arrhythmias in patients with continuous-flow left ventricular assist devices. J. Card. Surg. 2014, 29, 572–580. [Google Scholar] [CrossRef]
  20. Hawkins, R.B.; Mehaffey, J.H.; Guo, A.; Charles, E.J.; Speir, A.M.; Rich, J.B.; Quader, M.A.; Ailawadi, G.; Yarboro, L.T. Postoperative atrial fibrillation is associated with increased morbidity and resource utilization after left ventricular assist device placement. J. Thorac. Cardiovasc. Surg. 2018, 156, 1543–1549. [Google Scholar] [CrossRef]
  21. McKellar, S.H.; Koliopoulou, A.; Selzman, C.H. Atrial Fibrillation in Advanced Heart Failure Patients Receiving Left Ventricular Assist Devices. ASAIO J. 2018, 64, 573. [Google Scholar] [CrossRef] [PubMed]
  22. Doost, S.N.; Ghista, D.; Su, B.; Zhong, L.; Morsi, Y.S. Heart blood flow simulation: A perspective review. Biomed. Eng. OnLine 2016, 15, 101. [Google Scholar] [CrossRef] [PubMed] [Green Version]
  23. Bozkurt, S.; Bozkurt, S. In-silico evaluation of left ventricular unloading under varying speed continuous flow left ventricular assist device support. Biocybern. Biomed. Eng. 2017, 37, 373–387. [Google Scholar] [CrossRef]
  24. Saglietto, A.; Scarsoglio, S.; Ridolfi, L.; Gaita, F.; Anselmino, M. Higher ventricular rate during atrial fibrillation relates to increased cerebral hypoperfusions and hypertensive events. Sci. Rep. 2019, 9, 3779. [Google Scholar] [CrossRef] [Green Version]
  25. Goldberger, A.L.; Amaral, L.A.; Glass, L.; Hausdorff, J.M.; Ivanov, P.C.; Mark, R.G.; Mietus, J.E.; Moody, G.B.; Peng, C.K.; Stanley, H.E. PhysioBank, PhysioToolkit, and PhysioNet: Components of a new research resource for complex physiologic signals. Circulation 2000, 101, E215–E220. [Google Scholar] [CrossRef] [PubMed] [Green Version]
  26. Tateno, K.; Glass, L. Automatic detection of atrial fibrillation using the coefficient of variation and density histograms of RR and deltaRR intervals. Med. Biol. Eng. Comput. 2001, 39, 664–671. [Google Scholar] [CrossRef]
  27. Petrutiu, S.; Sahakian, A.V.; Swiryn, S. Abrupt changes in fibrillatory wave characteristics at the termination of paroxysmal atrial fibrillation in humans. Europace 2007, 9, 466–470. [Google Scholar] [CrossRef]
  28. Bozkurt, S. Mathematical modeling of cardiac function to evaluate clinical cases in adults and children. PLoS ONE 2019, 14, e0224663. [Google Scholar] [CrossRef]
  29. Korakianitis, T.; Shi, Y. A concentrated parameter model for the human cardiovascular system including heart valve dynamics and atrioventricular interaction. Med. Eng. Phys. 2006, 28, 613–628. [Google Scholar] [CrossRef]
  30. Hall, J.E. Guyton and Hall Textbook of Medical Physiology, 13rd ed.; Saunders: Philadelphia, PA, USA, 2015; ISBN 978-1-4557-7005-2. [Google Scholar]
  31. Klabunde, R.E.; Oh, J.K.; Seward, J.B.; Tajik, A.J. Cardiovascular Physiology Concepts 2nd Ed. + the Echo Manual, 3rd ed.; Lippincott Williams & Wilkins: Philadelphia, PA, USA, 2013; ISBN 978-1-4698-4997-3. [Google Scholar]
  32. Howlett, P.J.; Hatch, F.S.; Alexeenko, V.; Jabr, R.I.; Leatham, E.W.; Fry, C.H. Diagnosing Paroxysmal Atrial Fibrillation: Are Biomarkers the Solution to This Elusive Arrhythmia? Available online: https://www.hindawi.com/journals/bmri/2015/910267/ (accessed on 11 August 2019).
  33. Scarsoglio, S.; Guala, A.; Camporeale, C.; Ridolfi, L. Impact of atrial fibrillation on the cardiovascular system through a lumped-parameter approach. Med. Biol. Eng. Comput. 2014, 52, 905–920. [Google Scholar] [CrossRef] [Green Version]
  34. Bozkurt, S.; Safak, K.K. Evaluating the hemodynamical response of a cardiovascular system under support of a continuous flow left ventricular assist device via numerical modeling and simulations. Comput. Math. Methods Med. 2013, 2013, 12. [Google Scholar] [CrossRef] [PubMed]
  35. Bozkurt, S. Effect of Cerebral Flow Autoregulation Function on Cerebral Flow Rate Under Continuous Flow Left Ventricular Assist Device Support. Artif. Organs 2018, 42, 800–813. [Google Scholar] [CrossRef] [PubMed] [Green Version]
  36. Moscato, F.; Danieli, G.A.; Schima, H. Dynamic modeling and identification of an axial flow ventricular assist device. Int. J. Artif. Organs 2009, 32, 336–343. [Google Scholar] [CrossRef] [PubMed]
  37. Cox, L.G.E.; Loerakker, S.; Rutten, M.C.M.; de Mol, B.A.J.M.; van de Vosse, F.N. A mathematical model to evaluate control strategies for mechanical circulatory support. Artif. Organs 2009, 33, 593–603. [Google Scholar] [CrossRef]
  38. Ursino, M. Interaction between carotid baroregulation and the pulsating heart: A mathematical model. Am. J. Physiol. 1998, 275, H1733–H1747. [Google Scholar] [CrossRef]
  39. Van Gelder, I.C.; Wyse, D.G.; Chandler, M.L.; Cooper, H.A.; Olshansky, B.; Hagens, V.E.; Crijns, H.J.G.M. RACE and AFFIRM Investigators Does intensity of rate-control influence outcome in atrial fibrillation? An analysis of pooled data from the RACE and AFFIRM studies. Europace 2006, 8, 935–942. [Google Scholar] [CrossRef]
  40. Tabata, T.; Grimm, R.A.; Greenberg, N.L.; Agler, D.A.; Mowrey, K.A.; Wallick, D.W.; Zhang, Y.; Zhuang, S.; Mazgalev, T.N.; Thomas, J.D. Assessment of LV systolic function in atrial fibrillation using an index of preceding cardiac cycles. Am. J. Physiol. Heart Circ. Physiol. 2001, 281, H573–H580. [Google Scholar] [CrossRef]
  41. Ostenfeld, E.; Flachskampf, F.A. Assessment of right ventricular volumes and ejection fraction by echocardiography: From geometric approximations to realistic shapes. Echo. Res. Pract. 2015, 2, R1–R11. [Google Scholar] [CrossRef] [Green Version]
  42. Nagai, T.; Anzai, T. Atrial Fibrillation Does Not Matter in Japanese Ventricular Assist Device Patients? Half-Way up the Hill. Circ. J. 2019, 83, 1202–1203. [Google Scholar] [CrossRef]
  43. Aune, E.; Baekkevar, M.; Roislien, J.; Rodevand, O.; Otterstad, J.E. Normal reference ranges for left and right atrial volume indexes and ejection fractions obtained with real-time three-dimensional echocardiography. Eur. J. Echocardiogr. 2009, 10, 738–744. [Google Scholar] [CrossRef] [Green Version]
  44. Sato, T.; Tsujino, I.; Oyama-Manabe, N.; Ohira, H.; Ito, Y.M.; Yamada, A.; Ikeda, D.; Watanabe, T.; Nishimura, M. Right atrial volume and phasic function in pulmonary hypertension. Int. J. Cardiol. 2013, 168, 420–426. [Google Scholar] [CrossRef] [PubMed]
  45. Li, W.; Wan, K.; Han, Y.; Liu, H.; Cheng, W.; Sun, J.; Luo, Y.; Yang, D.; Chung, Y.-C.; Chen, Y. Reference value of left and right atrial size and phasic function by SSFP CMR at 3.0 T in healthy Chinese adults. Sci. Rep. 2017, 7, 1–11. [Google Scholar] [CrossRef] [PubMed]
  46. Fang, F.; Lee, A.P.-W.; Yu, C.-M. Left atrial function in heart failure with impaired and preserved ejection fraction. Curr. Opin. Cardiol. 2014, 29, 430–436. [Google Scholar] [CrossRef] [PubMed]
  47. McSharry, P.E.; Clifford, G.D.; Tarassenko, L.; Smith, L.A. A dynamical model for generating synthetic electrocardiogram signals. IEEE Trans. Biomed. Eng. 2003, 50, 289–294. [Google Scholar] [CrossRef] [PubMed] [Green Version]
  48. Climent, A.M.; Guillem, M.S.; Zhang, Y.; Millet, J.; Mazgalev, T.N. Functional mathematical model of dual pathway AV nodal conduction. Am. J. Physiol. Heart Circ. Physiol. 2011, 300, H1393–H1401. [Google Scholar] [CrossRef]
  49. Masè, M.; Glass, L.; Disertori, M.; Ravelli, F. Nodal recovery, dual pathway physiology, and concealed conduction determine complex AV dynamics in human atrial tachyarrhythmias. Am. J. Physiol. Heart Circ. Physiol. 2012, 303, H1219–H1228. [Google Scholar] [CrossRef]
  50. Masè, M.; Marini, M.; Disertori, M.; Ravelli, F. Dynamics of AV coupling during human atrial fibrillation: Role of atrial rate. Am. J. Physiol. Heart Circ. Physiol. 2015, 309, H198–H205. [Google Scholar] [CrossRef] [Green Version]
  51. Climent, A.M.; Guillem, M.S.; Husser, D.; Castells, F.; Millet, J.; Bollmann, A. Role of the atrial rate as a factor modulating ventricular response during atrial fibrillation. Pacing Clin. Electrophysiol. PACE 2010, 33, 1510–1517. [Google Scholar] [CrossRef]
Figure 1. (a) The RR intervals used in simulations to simulate normal sinus rhythm (SR) and atrial fibrillation (AF) with unimodal and bimodal sample distributions, the frequency diagrams of RR intervals used to simulate (b) normal sinus rhythm, (c) atrial fibrillation with unimodal RR interval distribution and (d) atrial fibrillation with bimodal RR interval distribution. Time bin is 5 ms in the frequency histograms.
Applsci 10 00876 g001
Figure 2. The electric-analogue of the heart chambers and circulatory loop used to simulate normal sinus rhythm and atrial fibrillation with unimodal and bimodal RR interval distributions for heart failure and Continuous Flow Left Ventricular Assist Device (CF-LVAD) support.
Applsci 10 00876 g002
Figure 3. (a) Left atrial (LA) volumes for heart failure during normal sinus rhythm (SR) and atrial fibrillation (AF) with unimodal and bimodal RR interval distributions; (b) LA volumes for CF-LVAD support during normal SR and AF with unimodal and bimodal RR interval distributions; (c) right atrial (RA) volumes for heart failure during normal SR and AF with unimodal and bimodal RR interval distributions; (d) RA volumes for CF-LVAD support during normal SR and AF with unimodal and bimodal RR interval distributions; (e) left ventricular (LV) volumes for heart failure during normal SR and AF with unimodal and bimodal RR interval distributions; (f) LV volumes for CF-LVAD support during normal SR and AF with unimodal and bimodal RR interval distributions; (g) right ventricular (RV) volumes for heart failure during normal SR and AF with unimodal and bimodal RR interval distributions; (h) RV volumes for CF-LVAD support during normal SR and AF with unimodal and bimodal RR interval distributions.
Applsci 10 00876 g003
Figure 4. (a) Left atrial (LA) pressures for heart failure during normal sinus rhythm (SR) and atrial fibrillation (AF) with unimodal and bimodal RR interval distributions; (b) LA pressures for CF-LVAD support during normal SR and AF with unimodal and bimodal RR interval distributions; (c) right atrial (RA) pressures for heart failure during normal SR and AF with unimodal and bimodal RR interval distributions; (d) RA pressures for CF-LVAD support during normal SR and AF with unimodal and bimodal RR interval distributions; (e) left ventricular (LV) pressures for heart failure during normal SR and AF with unimodal and bimodal RR interval distributions; (f) LV pressures for CF-LVAD support during normal SR and AF with unimodal and bimodal RR interval distributions; (g) right ventricular (RV) pressures for heart failure during normal SR and AF with unimodal and bimodal RR interval distributions; (h) RV pressures for CF-LVAD support during normal SR and AF with unimodal and bimodal RR interval distributions.
Applsci 10 00876 g004
Figure 5. (a) Aortic pressures for heart failure during normal sinus rhythm (SR) and atrial fibrillation (AF) with unimodal and bimodal RR interval distributions; (b) aortic pressures for CF-LVAD support during normal SR and AF with unimodal and bimodal RR interval distributions; (c) pulmonary arterial (PA) pressures for heart failure during normal SR and AF with unimodal and bimodal RR interval distributions; (d) PA pressures for CF-LVAD support during normal SR and AF with unimodal and bimodal RR interval distributions; (e) left middle cerebral arterial (LMCA) flow rates for heart failure during normal SR and AF with unimodal and bimodal RR interval distributions; (f) LMCA flow rates for CF-LVAD support during normal SR and AF with unimodal and bimodal RR interval distributions.
Applsci 10 00876 g005
Table 1. The mean values and standard deviations of maximal and minimal volumes in the heart chambers (Vla,max, Vla,min, Vra,max, Vra,min, Vlv,ed, Vlv,es, Vrv,ed, Vrv,es), left and right ventricular ejection fractions (EFVlv, EFVrv), mean aortic and pulmonary arterial pressures and middle cerebral arterial flow rate (pao,mean, pap,mean, Qmca,mean) for normal sinus rhythm (NSR), and atrial fibrillation with unimodal and bimodal RR interval distributions (UAF, BAF) over each cardiac cycle, cardiac and mean pump outputs (CO, MPOs) over a ten minute period for heart failure and CF-LVAD support.
NSRUAFBAFNSR
CF-LVAD
UAF
CF-LVAD
BAF
CF-LVAD
Vla,max [mL]106.2 ± 1.1114.1 ± 2.2102.8 ± 3.560.3 ± 1.265 ± 2.753.8 ± 5.1
Vla,min [mL]83.3 ± 0.493 ± 2.369.3 ± 3.932.6 ± 1.444.1 ± 3.325 ± 3.6
Vra,max [mL]54.7 ± 1.747.4 ± 3.067.2 ± 4.480.4 ± 3.365.6 ± 6.296.7 ± 8.4
Vra,min [mL]33.1 ± 0.630.5 ± 1.137.9 ± 1.743.8 ± 1.537.5 ± 2.651.3 ± 4.0
Vlv,ed [mL]161.7 ± 0.4152.6 ± 0.9146.2 ± 1.8110.4 ± 2.2113 ± 2.891.4 ± 5.6
Vlv,es [mL]114.7 ± 1.5122.8 ± 5.594.2 ± 9.866.1 ± 2.287 ± 7.048.3 ± 11.9
Vrv,ed [mL]117.2 ± 1.7101.4 ± 3.5120.7 ± 3.6138.4 ± 2.6116.6 ± 5.4139.9 ± 5.2
Vrv,es [mL]70.2 ± 0.271.4 + 0.268.6 ± 0.966.6 ± 0.569.1 ± 2.164.6 ± 1.5
EFVlv [%]29.1 ± 1.119.6 ± 3.935.5 ± 7.1---
EFVrv [%]40.1 ± 1.029.5 ± 2.843.1 ± 2.351.9 ± 1.340.5 ± 3.753.7 ± 2.8
pao,mean [mmHg]83.1 ± 1.482.6 ± 2.585.6 ± 4.197.3 ± 0.598.9 ± 0.996.3 ± 1.4
pap,mean [mmHg]30.9 ± 0.232.2 ± 0.429.1 ± 0.826.5 ± 0.529 ± 0.924.4 ± 1.5
Qmca,mean [mL/min]131 ± 3.0132.5 ± 7.2133.5 ± 13.7144.3 ± 1.7151.2 ± 3.0138.5 ± 4.9
CO [L/min]3.363.383.36---
MPO [L/min]---5.145.374.91

