Abstract
Given the relentless development of intelligent information and communication technology (ICT) systems, a growing need for cities to transform towards smart solutions and, on the other hand, a lack of firm methodological approaches to implement such transformations, the paper contributes to establishing a theory for modeling the transformation of cities towards sustainable, smart cities. The article presents the results of research: a model and a visualization method for supporting cities in elaborating and implementing transformation strategies. The authors’ experience is that intelligible, algorithmizable, and easily visualized models are being sought to assist city authorities in making informed decisions regarding the development of their cities. The paper proposes the concepts of the smartness zone and sustainability corridor, which allow one to devise and visualize the process of a city’s development and transformation in a simple, coherent, and comprehensible way, and to observe and monitor its development path. It presents a new generic instrument for modeling transformation strategies, which are the tools addressed to municipal authorities, analysts, and developers who can use them in order to design, implement, monitor, and optimize transformation strategies towards smart cities.
1. Introduction
Cities have always been, and undoubtedly always will be, the sites of civilizational development and centers of power, science, culture, and wealth but also poverty and exclusion. They are organic structures with fervent dynamics. Cities are spaces of intensive communication and the creation of a social capital as well as the social and technological innovations that determine, not only the future of cities, but also the destiny of states and nations. At the turn of the twenty-first century the term smart city became popular in public debate. What distinguishes ordinary urban improvements and innovations from smart cities solutions is that the latter include omnipresent and significant components of urban data acquisition and processing, which are often pursued automatically and in real time along with autonomous decision-making, both of which are based on information and communication technology (ICT).
There is a growing need for cities of various kinds and sizes that can be transformed into smart cities. In 2016 the global smart city market was valued at USD 446 billion, and is estimated to reach USD 1933 billion by the end of 2020 [1]. Examples of such cities as, Amsterdam, Barcelona, Dubai, Guangzhou, and Palava, spur and spark the imagination of municipal authorities worldwide. It is sometimes said that the precise tool to address this need is ICT, whose relentless development of intelligent systems promises a quick and effortless solution. This is not true, for other material and intangible components are necessary, among which, and of the utmost importance, is a firm multifaceted methodology for determining how to devise and implement such transformations.
The methodology for transforming cities into intelligent cities should deliver technical models and solutions based on innovative technologies, new organizational and management models, and new regulations, all leading to sustainable development and growth being supported. In our modeling approach, stress is put on establishing sustainable urban ecosystems aimed at, and for, the inhabitants of cities. The focus is especially on developing facilities of common goods, participatory awareness and attitudes of the dwellers, networking between people [2], more horizontal than vertical organizational structures, social capital, and a large variety of e-solutions, e-services, and e-governance, many of which are based on artificial intelligence, big and open data, machine learning, and the massive use of IoT (Internet of Things) solutions. A smart city is a learning environment capable for generating development scenarios, self-assessment, and adaptation, depending on the changes that occur.
While preparing a transformation methodology that was commissioned by The Bureau for Digital Transformation of the Mayor’s Office of Warsaw in Poland, the authors of the paper realized that Warsaw’s municipal authorities are seeking transparent, intelligible, algorithmizable, and easily visualized models to support informed decisions by regarding the development of the city. The abstract model proposed in this paper introduces the concepts of the smartness zone and sustainability corridor, which allow one to devise and visualize, in both qualitative and quantitative terms, the process of a city’s development and transformation in a simple, coherent, and comprehensible way, and to observe and monitor its development path. The paper, however, does not offer any specific solutions for any specific city; rather, it presents a new generic instrument for modeling transformation strategies and for monitoring and optimizing the path to reach the desired level of smartness.
The structure of the paper is as follows. In Section 2, the basic assumptions underpinning the proposed model along with a brief survey of selected approaches for defining and tackling the issues of smart cities are presented. Section 3 is devoted to the presentation of the model, and its valuation and transformation strategies, which are the tools addressed to that municipal authorities, analysts, and developers who can use them in order to design and implement transformation strategies towards smart cities, including the monitoring of these processes. Noteworthy, the model precisely defines such notions as smart city, sustainable city, and sustainable smart city. Section 4 gives a few proposals aimed at further development of the model. Section 5 provides some illustrations of the model by using the actual data obtained during the study of Warsaw as a smart city [3,4]. The paper ends with a conclusion and a note on further work, and a list of references.
2. A Brief Review of Smart City Approaches
It seems that, despite its small size, Bletchley Park, could be considered a prefiguration of a smart city; here, intellectual work like running a high-level code and cypher school, top-notch laboratories, and precise manufacturing, as well as carrying out advanced scientific research (on the Nazi’s Enigma cryptography machine) was closely integrated and intertwined with a human-friendly habitat. Many definitions for the smart city concept can be found in the literature and ordinary discourse pervading public debates; for instance, a review of 116 definitions is included in [5], and an attempt to quantify the degree to which a city is intelligent was made in [6]. Often—and we share this approach—a smart city is seen as a synergetic collaboration of various systems and services that are equipped with intelligent components, and which altogether constitute a complex urban ecosystem featuring self-learning, self-monitoring, self-assessment, adaptation to change, and the like. It is an aggregation of social, business, and political elements and processes combined with a town’s technical infrastructure and utilities (electricity, gas, water and sewage, heating, transportation systems, street lighting, etc.) [7,8]. Thus, a smart city, by its very nature, is an ecosystem composed of new concepts, solutions, communities, and artifacts all patterned on a predefined vision and framework of the city. The way a smart city runs and develops its facilities, procedures, and services is not a series of spontaneous reactions caused by the various events and challenges; rather—when seeing beneath the surface—it is a painstakingly planned, implemented, and monitored process for conscious transformation towards a higher level of smartness.
In our work for the Bureau of Digital Transformation of the Mayor’s Office of Warsaw [3], we were faced with the need to clarify the relationship between the notions of a modern city and a smart city. At first glance these terms might seem very close to each other, or even synonymous. Being aware that these two terms are often used interchangeably, we, however, find them different. This distinction will be elucidated in Section 3 and will determine the grounds for setting up our transformation model. A smart city is not the plain sum of its modern technical systems; it is a living and sustainably evolving aggregate of intelligent facilities integrated with its dwellers and their communities, and serves businesses, industry, administration, culture, education, health, etc.
We sympathize with the approach proposed by researchers at the Vienna University of Technology in [9], where a smart city is defined as “a city that is supported by a pervasive presence and massive use of advanced ICT, which, in connection with various urban domains and systems and how these intricately interrelate, enables cities to become more sustainable and to provide citizens with a better quality of life.”. It is worth noting that this understanding is very much compatible with the definition agreed at the meetings of ITU’s Focus Group on Smart Sustainable Cities that reads: “A smart sustainable city is an innovative city that uses information and communication technologies (ICTs) and other means to improve quality of life, efficiency of urban operation and services, and competitiveness, while ensuring that it meets the needs of present and future generations with respect to economic, social and environmental aspects” [10].
Our approach includes the notion of sustainability, which can be found in [11]: “[it is a] balance between environmental protection and integration, economic development and regeneration, and social equity and justice within cities as long-term goals through the strategic process of sustainable urban development as a desired trajectory. Thereby, it seeks to create healthy, livable, and prosperous human environments with minimal demand on resources (energy, material, etc.) and minimal impact on the environment (toxic waste, air and water pollution, hazardous chemicals, etc.)”.
Most proposals for capturing the specificity of smart cities consider various dimensions, for example, mobility or the environment, each of which characterizes an aspect of the city that municipal authorities consider vital in terms of contributing to the city’s smartness. An example of such an approach is the IDC Government Insights’ Smart City Maturity Model [12], which identifies the stages, key measures, results, and actions required for cities to move through stages and progress toward the final objective of becoming a smart city. The model determines the key characteristics, intermediary goals, and benefits of each stage. Another example is the methodology developed within the REMOURBAN project [13], which characterized 41 European middle-sized cities with the aim of devising their sustainable urban transformation. For each application domain, sets of technical indicators such as energy, mobility, and ICT; and non-technical indicators like people, governance, and finance were defined. These indicators, along with statistical methods, were used for clustering together cities that had similar characteristics.
Cities strive to become smart. Governments, agencies, and in particular the European Commission are bombarded with project applications. Thus, the issue of the selection of valuable proposals arises. The same is true for the assessment of on-going and completed smart city projects [14,15]. The ASCIMER project, supported by the European Investment Bank, has developed a methodology to assess and prioritize smart city projects [16]. By the same token, the Scottish Government together with the Scottish Cities Alliance commissioned a project [17] whose aim was to help Scotland’s cities to: (i) assess the position of cities along the path of transformation; (ii) decide where cities want to be by 2020; (iii) identify what investments and adjustments are required; and (iv) consider whether any parts of transformation programs might be better advanced in collaboration with other cities and partners. Sometimes the models confine themselves to specific areas, as the model presented in [13], which evaluates the performance of planning urban energy use only.
The issue of smart cities is subject to permanent standardization efforts. One example is the smart city concept model (SCCM) published by the British Standards Institution [18], which defines a series of 27 concepts that can be used to describe the entities that are typically contained in city data, and goes on to highlight where those concepts are linked to city scenarios. SCCM served as the basis of the ISO 37106 Standard of Smart Operating Model [19], which can help cities and communities in their transformation initiatives. The CEN-CENELEC-ETSI (CEN—European Committee for Standardization, CENELEC—European Committee for Electrotechnical Standardization, ETSI—European Telecommunications Standards Institute) Sector Forum on Smart and Sustainable Cities and Communities has mapped standardization activities and published a set of standards related to the development of smart cities [20]. The indicators regarding ICT are collected in the ISO/IEC 30146:2019 “Information Technology—Smart City ICT Indicators” standard [21].
3. The Multiagency Sustainable Smart City Model and Transformation Strategies
This section presents a simple model of a smart city and cities’ transformation strategies. The model was conceived as a spin-off result of authors’ cooperation with The Bureau for Digital Transformation of the Mayor’s Office of Warsaw on the study of Warsaw as a smart city [3,4]. From the standpoint of the municipal authorities of a city, analysts, and managers the advantage of having the model of a smart city and its transformation options is at least fourfold: (i) they can quantify the level of the city development (and if data regarding other cities is available to compare their city with other cities); (ii) they can define a transformation strategy (an itinerary) to become the smart city; (iii) they can monitor the development and progress of the city in terms of its sustainability and smartness level; and (iv) they can better structure and organize their analytical work (which by the way was the case of the aforementioned study), and efficiently manage the transformation process.
As mentioned in the previous section, cities can be characterized by a set of dimensions (for instance mobility, environment, living, people, economy, and governance, as in [9]). The dimensions are a kind of agency of a city’s standing. The wider the scope and quality of the agency, the more impact it has on the city’s standing. A set of particular features, for example, ICT infrastructure, competitiveness, quality of education, or cost of living, is assigned to each dimension. Incidentally, in the ITU’s Technical Report, 30 features were identified [10]. Then a method for assigning a quantitative value to each feature, along with a weight, is given. The values of all the features are then aggregated according to a predefined formula, and, thereby, give a value to the corresponding dimension (agency). Following this, the values of all dimensions are aggregated and lead to a synthetic indicator that describes the level of city’s development. Incidentally, synthetic indicators can be used for ranking cities, for instance: the World’s Best Cities, or the Quality of Life.
3.1. Model Description
Our city model is defined in the following way. The city is characterized by a finite set, D = {D1, D2, …, Dr} composed of r dimensions (city agencies), where each dimension is a finite set of its features , i.e., such that . To each feature is assigned its value (a positive real number) and it is weighted by the value for = 1, 2, …, r; = 1, 2, …, n.
Let denote the value to be assigned to . Formally, the following formulae determine the model:
where .
where .
where .
Note that as a result of normalization, for any . The formula to calculate the synthetic indicator, I , that provides a general description of the city is the following:
where is the weight associated with , .
The above model does not take into account the possible relationships occurring between the dimensions D = {D1, D2, …, Dr}. In order to enhance the model, the relationships can be modeled by means of Cartesian products over D. Let denote an i-ary Cartesian product over D, for example,. So, the set of all relationships between the dimensions is defined as follows: Obviously not all possible relationships occur, therefore, what actually takes place is a subset of This approach for modelling the relationships can, in a similar way, go deeper down to the level of features ; this exercise is left to the reader.
For each dimension, , we assigned its smartness threshold, = 1, 2, …, r). Now, we were able to formally define what is meant by the term smart city. The city whose dimensions take on the values D1, D2, …, Dr is smart if, and only if,
for any {1, 2, …, r}.
Note that in the case where:
does not guarantee that the city is smart. A simple example given in Table 1 proves this statement.

Table 1.
Exemplary relationships between and
The city described in the above table is not smart because D2 < S2 (0.7 < 0.9) despite fulfilling (4). It might be convenient to introduce the notion of local smartness. The domain , is locally smart if , where is the smartness threshold assigned to this domain.
Let us consider all the domains, whose values, , are greater or equal to , and calculate their sum:
Let be the number of all such that By city smartness level, denoted by csl, we understand the following quotient:
Note that csl . The city’s smartness level could be used to evaluate the degree of smartness the city has achieved. The case means that some yet not all city domains are smart, but some are not; in this case . If however (meaning ), then the city is smart.
For the sake of narrative lucidity further on, we assumed that , meaning the city is characterized by two agencies (dimensions) only. The values of D1 will be marked on the x axis of the coordinate system, and D2 on the y axis. Figure 1a shows the 2D space within which cities can be found. It is a square with sides of length 1 (this is because they have all been normalized, i.e., , —see Formula 1). A city is represented by the couple (D1, D2). The rectangular area (zone) of smartness is determined by the boundaries of the 2D space and the lines and (colored in grey). Looking at Figure 1a, it is straightforward to note that cities A and B were smart (they lie within the grey area) whereas cities C, D, and E were not smart. City C was smart from the D2 point of view yet was not smart from the D1 perspective, and, therefore, was not smart as such.
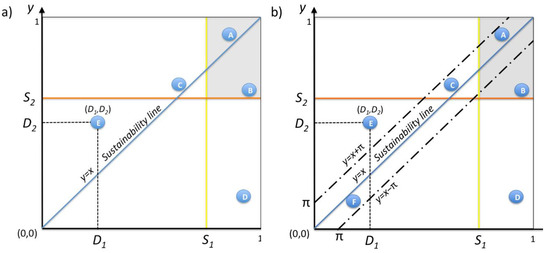
Figure 1.
(a) 2D space with the zone of city smartness (in grey) and (b) sustainability corridor.
Having explained the notion of city smartness let us define the notion of sustainability in the context of cities. Intuitively, sustainability means that the set of dimensions of the city D = {D1, D2, …, Dr} is balanced, meaning that the values D1, D2, …, Dr are similar, i.e., D1 D2 … Dr. In the ideal case D1 = D2 = … = Dr. For 2D space, such a case is represented by a straight line whose equation is . We dub this line a sustainability line, that is, a line of equilibrium perfectly balanced between the domains. This line can be found in Figure 1a. Thus, sustainable cities should find themselves as close to this line as possible. To describe this observation formally, we constructed a “corridor” that forms a neighboring area to the sustainability line, and is constrained by two straight lines lying above and beneath the sustainably line and that keep the same distance from it. Let denote the sustainability distance. The equations for the straight lines determining the corridor are:
These lines are depicted in Figure 1b. The area , such that , is called a sustainability corridor. Colloquially, the city is called a sustainable city if it lies within the sustainability corridor. Formally, the city (D1, D2) is sustainable if, and only if:
It is worth emphasizing that the notion of sustainability and smartness are of different categories. It may well happen that a city is sustainable, i.e., finds itself within the corridor, yet does not satisfy (3) and, therefore, is not smart, which is the case for city F in Figure 1b. In practice it means that the domains of such a city are harmoniously balanced but the value of its synthetic indicator, I, is low.
The notations and definitions introduced above allow us to define the concept of a sustainable smart city. Given the smartness thresholds (S1, S2), sustainable distance , and a city (D1, D2), the city is sustainably smart if, and only if, it is smart and sustainable, i.e., both (3) and (8) are fulfilled.
A model that assumes a sustainability corridor constructed of two parallel straight lines might be considered too restrictive. A modification of this model may use diverging straight lines, which allows more cities to sit within the corridor. Now the equations for the straight lines that define the corridor are as follows:
where is a divergence factor. Figure 2 presents the modified model. Now city B, which was previously beyond the corridor, fits in to it and makes the city sustainably smart.
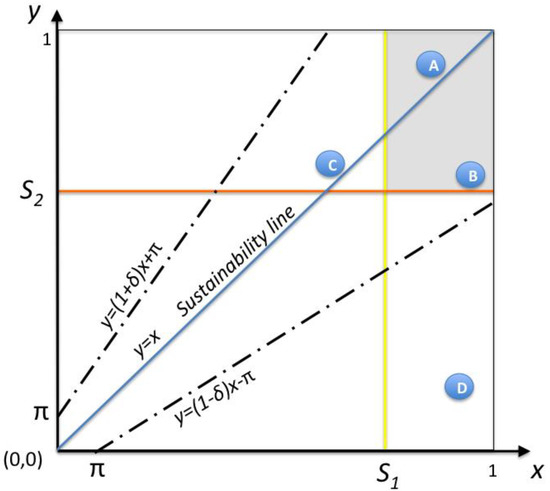
Figure 2.
Two-dimensional model with a sustainability corridor.
Formally, the city (D1, D2) is sustainable if, and only if:
3.2. Model Valuation and Transformation Strategies
The model presented above assumes r dimensions. Figure 1 and Figure 2 show two-dimensional models. They can be generalized to higher dimensions, for instance three dimensions or even further. While working on the study of Warsaw as a smart city [4], it turned out that a three-dimensional model could pretty well draft its transformation towards a smart city.
Decisions on the part of municipal authorities have to be taken in order to make use of the above model, which means model parameters have to be valued. The process of model valuation (substantiation of the model with actual data) may go as follows:
- Decide which and how many agencies (dimensions) are to be taken into account; in other words, the set D = {D1, D2, …, Dr} and the value of r have to be given,
- The features of each agency, , along with the weights, , have to be identified. This action determines the depth of the model and will influence the amount of effort and costs that will be necessary to collect specific data on each feature, , in order to calculate the values of (update of these values will have to be done periodically while monitoring the standing of the city, and also during the transformation process towards the zone of smartness). The result are the values , (see Formula 1),
- Assign weights, , to each ,
- Calculate the synthetic indicator, I (Formula 2),
- Assign the smartness threshold, Si (i = 1, 2, …, r) to each dimension .
In fact, this is the moment when the meaning of the smart city in the context of the city in question is defined. Such decisions can be prepared by comparing the values with their counterparts for other cities. The final decision will have to be approved by the city authorities. Of course, the other indices defined above should be calculated in order to have a complete picture of the city’s standing and, therefore, the possibility of comparing it with other towns.
The last task of the analytical team for setting up the model is to determine the sustainability line and sustainability corridor; this can be done in a similar way to the procedure for defining the zone of smartness. Let us emphasize that the value of the model lies not only in its qualitative features but also in the way it is substantiated with the data. This data comes on the one hand from the research and indigenous databases of the model users (city authorities and their agendas), and on the other hand are the result of cities’ development policies, priorities, and strategic decisions on the part of the authorities.
Once the model has been established one can devise a city transformation strategy towards the smartness zone. To this end the following cases can occur:
- (a)
- The city is outside the sustainability corridor and none of the agencies’ values exceed their corresponding smartness threshold. In such cases the city has three options:
- Head for the sustainability corridor along the shortest possible route, and after having reached the corridor, follow the path set out by the corridor towards the smartness zone;
- Head for the sustainability corridor (not yet lying within the smartness zone) to the point indicated by the analytical team and/or city authorities, and then follow the path set out by the corridor towards the smartness zone;
- Head directly towards the smartness zone.
- (b)
- The city is outside the sustainability corridor but at least one, but yet not all the values, of its agencies exceed their corresponding smartness thresholds. Basically, the city can follow one of the three aforementioned options in point (a).
- (c)
- The city is already inside the sustainability corridor, in which case the strategy is simple, namely, head directly towards the smartness zone without leaving the corridor.
The above cases are sketched out in Figure 3. The cities are marked A, B, and C, which correspond to the above cases (a), (b), and (c), respectively.
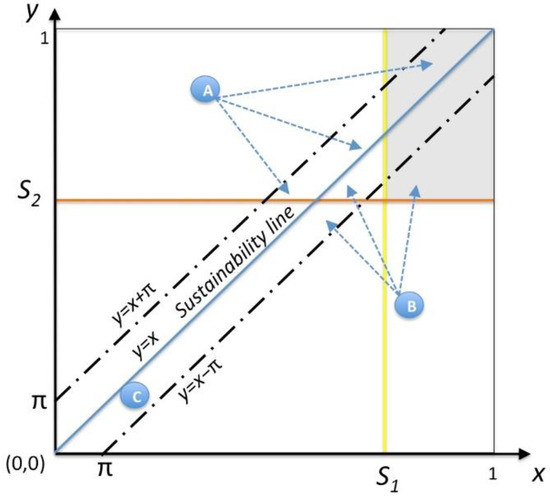
Figure 3.
Transformation paths.
4. Possible Development of the Proposed Model
A two-dimensional classification of smart cities based on their selected characteristics and implemented in an orthogonal (non-metric) coordinate system specified by the standards ISO 37120:2018, “Sustainable Cities and Communities—Indicators for City Services and Quality of Life” [22] and ISO/IEC 30146:2019, “Information Technology—Smart City ICT Indicators” [21] may serve as an exemplification of the two-dimensional model described in the previous section. In such a system, the x-axis represents the “Quality of life” and the y-axis the “Level of ICT infrastructure” so that not only is two-dimensional classification possible, but also an analysis of the interactions between particular characteristics. A much more interesting solution, however, is the three-dimensional model, which, in addition to the above-mentioned two axes defined by the ISO standards, also uses a third axis: the “City’s potential” (Figure 4a).

Figure 4.
(a) Three-dimensional exemplary case. (b) Analogy of the RGB model. (x) City’s potential, (y) quality of life, and (z) information and communication technology (ICT) infrastructure.
The three dimensions, as shown in Figure 4a, are the following (the labels for the bullets below indicate the axes mentioned in the Figure):
The x-axis represents the overall physical, institutional, juridical, and organizational potential of the city and its ability and openness to absorb innovative social and technical solutions. The city’s potential also includes the so-called creative class (the “creative class” is a socioeconomic term introduced by Richard Florida to designate a class that is the main driving force behind the economic development of post-industrial cities) [23]. In this example the features that define this dimension are:
- Technical infrastructure and utilities,
- Innovative economy,
- Participation culture/awareness,
- Personal mobility and flexibility,
- Transformation of governance structures towards e-governance,
- Level of qualification and competences of public administration,
- Transparency in law-making,
- Stability of regulations,
- Ease of doing business (e.g., level of taxes, quality of procedures).
The y-axis represents quality of life. From the city dwellers’ point of view it is the most important dimension of the city’s characteristics. The following features describe this dimension:
- Public safety,
- Availability and access to services such as health service, education, administrative services,
- Costs of living,
- Environment protection, optimized energy consumption,
- Culture, entertainment and tourism.
The z-axis represents the level of ICT infrastructure, which includes the most important existing ICT infrastructure and the general purpose ICT-based solutions available to citizens and organizations of the city. It is important to take into account not only the ICT entities but also the level of its interoperability and synergy. The features characterizing this dimension are as follows:
- Coverage of ICT systems,
- Quality of ICT systems and services,
- Level of interoperability and integration of ICT infrastructure and systems, including IoT (Internet of Things).
It should be noted that the amount and extent of ICT technical infrastructure is not enough to characterize the city given its smartness level. As mentioned in Section 1, of particular importance is the existence and availability of components and networking of the infrastructure based on advanced mechanisms of data collection and analysis, artificial intelligence, and autonomous decision-making.
In the authors’ opinion, the necessary, but insufficient, condition for calling a city smart is its sustainable development. The sustainability aspect of smart city development manifests itself in the harmonized growth of the city’s potential, the level of ICT development, and the quality of life indices. For a visualization of this concept (Figure 4b), the RGB additive color model (in the additive RGB color model, red, green, and blue light are added together in various ways to reproduce a broad array of colors, as an example on the TV and computer screens) was used. Red, green, and blue colors of various intensities correspond to the axes defining the position of a given city in the smart city cube (the city’s potential, ICT infrastructure, and quality of life). Their superimposition in equal proportions gives an achromatic color scheme. Zero intensity for each component gives the darkest color (black), and the highest intensity of each gives white. The achromatic line (the diagonal of a cube) defines the level of smartness of the cities analyzed using this model. The cities showing sustainable development characteristics are placed along this diagonal. A hypothetical zero-smartness level city will be at the origin of the x (city’s potential), y (quality of life), and z (ICT infrastructure) axes so that this origin can be considered the starting point for the smart city transformation. All three values were in balance, which, at its zero level, resulted in black (zero smartness). As the values increased equally along the x, y, and z axes, they fulfilled the conditions for sustainable development and defined the level of smartness of the analyzed city.
The perfect zero-dimensional cube diagonal is the asymptotic pattern of the ideal level of smartness. In real life, various social, economic, cultural, political, and organizational conditions result in a model of smart city development that has a vast space around the diagonal, and variable boundaries. This may be visualized as an upside-down model. In this model, sustainable development was quantified at a range of levels but not necessarily on a quantitative scale. In practice, this means that the three components of development—city’s potential, quality of life, and ICT infrastructure—should reach the standard range, i.e., medium or high. This assumption underlies the separation of a solid geometrical object from a non-metric, three-dimensional smart city evaluation space.
The cities depicted in yellow, purple, and blue solid objects (Figure 4b) cannot be called entirely smart because at least one of the components was at a low level. The city represented by the grey cube was on the smart path, namely, in its developing phase. For a utopian super-smart or perfect smart city (the white dot on Figure 4b), all components reached the equal and maximum level of the contemporary enlightenment, which, using the analogy of the RGB color space, was white. One may note that not all of the cities have to reach this level; some will never reach it because of their external conditions. It may be enough for them to become sustainable organisms staying inside the cone, although only in its dark grey part. It is up to the city’s authorities to assess the current position of their city and to draw its development path, not necessarily one ending in the utopian White Dot City.
When analyzing the various methods and variants of classifying the level of smartness of smart cities, it is essential to emphasize that it should be treated as a stochastic process, not a single “freeze-frame.”. It is a process that evolves in many ways, one of which worth considering is the evolving and expanding non-metric space of characteristics defined by the city’s potential, quality of life, and ICT infrastructure parameters (Figure 5).
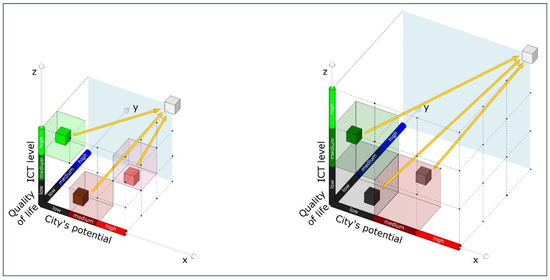
Figure 5.
Smart city transformation—the concept of an expanding cube.
The essential and simplified variant assumes that within the system of the proposed smart city cube, the analyzed city has a defined, fixed place in the adopted coordinate system. This suffices for many applications and evaluations, as this model can be used, for example, to compare the development of different cities at any given moment. However, when establishing a long-term strategy for the city’s development, it may be necessary to adopt a more sophisticated solution.
The development of the technology and methodology of smart city management, and the expectations concerning the quality of the residents’ lives, all lead to an “increase” in the non-metric space of the smart city cube (Figure 5). Residents’ demands for living standards are continually increasing, along with the technological capabilities and the potential of a given city. What seemed utterly satisfying 50 years ago does not even meet the minimum requirements today.
With an inappropriate strategy, the city may reach the smart level that had been expected at the start, but by the time this happens it will have become a universal standard, while other cities will have become much smarter and friendlier towards its residents. By analogy to the theory of expanding galaxies, the “green” city in the T0 epoch is determined by the coordinates X0, Y0, and Z0 (expressed on a rank scale): low, low, and high. The same city in the T1 epoch will have the coordinates X1, Y1, and Z1: low, low, and medium (Figure 5). The model proposed in the form of a smart city cube will always be expanding, albeit unevenly. This is an issue worth considering and formalizing in the form of a stochastic process (e.g., Markov chains), which will be the subject of separate publications.
5. The Practical Experiment
In order to better explain the theoretical model defined in the previous section, in what follows is a wireframe of its three-dimensional instantiation. For this purpose, the results of the project carried out by the authors for the City of Warsaw were used [4]. This project focused mainly on analyzing the level of sophistication and interoperability of ICT systems, therefore indicators related to the Z axis were determined more precisely than those regarding the X and Y axes.
5.1. ICT Level
At the time of conducting research for the city of Warsaw, the ISO/IEC 30146 (first edition 2019-10) [21] standard was not yet known, therefore the authors defined their own indicators (as described in Section 4), that would allow one to ‘’place’’ the city in the proposed coordinate system. The additional analysis was also carried out and the link to the indicators from the ISO was defined.
Among others, the following documents constituted the basis for researching the current state of Warsaw in terms of its transformation into a smart city:
- Stocktaking of activities in line with the smart city idea in Warsaw (AS IS): a sheet that systematically details over 300 systems and measures adopted and conducted in the city of Warsaw (developed by a team from Comtegra S.A. company in October 2017).
- Warsaw as a smart city: a catalogue of solutions established solutions, adopted measures, and implemented projects related to the smart city idea (document prepared by the Economic Development Bureau of the Capital City of Warsaw, Department of Economic Promotion in September 2017).
- A register of over 100 internal systems and registers compiled by the Digitization Bureau (systems and registers used by organizational units of the Warsaw City Hall and entities or affiliated companies).
The approach to determining the value of grades is shown in Table 2. In addition, it shows the relationship of the proposed proprietary indicators with the indicators from the ISO standard. This assessment (a fragment of the list of indicators) is one of a number of variants made. Each of the assessed key ICT systems received a rating of 0–3 for each feature. The value 0 was assigned when the condition was not met or the information was not provided, the value 1 means a poor rating of the feature and the maximum value is 3. The detailed method of issuing these ratings has also been developed, but its presentation was outside the scope of this article. The number of points obtained by each type of ICT system/service was divided by the maximum value possible to obtain for a given feature, and then the average for all three features was calculated. In this way, the Z axis coordinate was obtained.
Table 2.
Assessment of features of the ICT system.
The theoretical model proposed in Section 3 is flexible. Instead of the proposed indicators and key systems, it will be possible to use directly the indicators and the method of their calculation indicated in the ISO/IEC 30146 standard.
5.2. Quality of Life
Standards mentioned in Section 2 and Section 4 contain the number of quality of life descriptors. The following ISO 37120 performance indicators may be considered as describing quality of life in the approach taken in this paper:
- Population income and dwelling profiles (persons per dwelling unit, average household income, Gini coefficient, and percentage of city population living in poverty),
- Educational indicators (i.e., number of higher education degrees per 100 thousand population),
- Energy (i.e., power consumption per capita),
- Environmental data (PM2.5 and PM10 concentration, greenhouse gas emission, and waste treatment),
- Public safety (i.e., number of disasters and disaster fighting services, number of police officers per 100 thousand population, and number of crimes),
- Health and recreation (average life expectancy, number of physicians and hospital beds per 100 thousand population, public recreations space, and green areas per capita).
The extensive set of indicators and model for mapping the smart cities was proposed in the study “Mapping Smart Cities in the EU” commissioned by the European Parliament’s Committee on Industry, Research, and Energy (ITRE) in 2014 [24]. The indicators were grouped taken from the model proposed and used in the project europeansmartcities.eu by the team of researchers from the Centre of Regional Science at the Vienna University of Technology (TU WIEN), OTB Research Institute for Housing, Urban, and Mobility Studies at the Delft University of Technology and the Department of Geography at University of Ljubljana [9]. The model was used in the europeansmartcities rankings editions 2007, 2013, 2014, and 2015. All together 74 indicators were used grouped in six categories: Smart Economy, Smart Mobility, Smart Environment, Smart People, Smart Living, and Smart Governance. The most factors closest to the quality of life approach taken in this paper can be found in the Smart Environment and Smart Living categories.
Different arrangements of features describing the quality of life dimension are widely used in other rankings of smart cities as well. American human resources and financial services company Mercer annually releases its Mercer Quality of Living Survey [25], comparing cities based on 39 criteria (safety, education, hygiene, health care, culture, environment, recreation, political-economic stability, public transport, and access to goods and services). The cities are compared to New York City, which is given a baseline score of 100 points. The ranking is used by multinational companies, i.e., deciding where to open offices or plants, and how much to pay employees in various locations. Since 2016 the number 1 position on the list is Vienna (with 99.1 points it is closest to 100 points assigned to NYC).
Its Global Liveability Ranking publishes annual The Economist Intelligence Unit’s (EIU) [26]. It ranks 140 cities for the quality of life based on assessments in the categories of stability (prevalence of crime, threat of terror, military conflict, and civil unrest), healthcare (availability and quality of healthcare, availability of OTC – over-the-counter – drugs, and general indicators), culture and environment (climate factors, social and religious restrictions, levels of corruption and censorship, availability of sport and culture, food, drinks, and consumer goods and services), education (availability and quality private education, and public education indicators), and infrastructure (quality and availability of road network, public transport, energy and water, telecommunications, and housing).
In the IESE Cities in Motion Index (IESE CIMI) calculated by IESE (El Instituto de Estudios Superiores de la Empresa) Business School of University of Navarra [27] the indicators relevant to the quality of life axis are grouped in the following categories:
- Human Capital (16 factors: education facilities and expenditure, museum and art galleries, theaters, and expenditure on leisure and recreations),
- Social Cohesion (16 factors: i.e., Gini index, crime rate, health index, price of properties, number of hospitals, and ratio of female workers in public administration),
- Economy (13 factors: i.e., productivity ratio, time required to start business, GDP data, salaries, and purchasing power),
- Environment (11 factors related to emission and PM particle data, access to water, and solid waste treatment),
- Mobility and Transportation (10 factors related to road traffic, public transportation, and bike sharing),
- Urban Planning (five factors: bike sharing points, sanitation facilities, the number of people per household, percentage of high-rise building above 35 meters high, and the number of completed building).
As the Y-axis descriptor in the RGB model presented in this paper may use the relative position of Warsaw compared to positions of cities leading in IESE CIMI. The positions of Warsaw in the categories of indicators related to Y-axis of the model described in this paper are presented in Table 3.
Table 3.
Positions of Warsaw in IESE Cities in Motion Index (IESE CIMI) proposed as values on the quality of life axis.
In Mercer Quality of Living 2019 mentioned above the position of Warsaw is No 82 out of 231 cities compared. Of the Central and Eastern Europe 20 cities are classified, with Prague in position 47, Lubljana (74), Budapest (76), Bratislava (80), and Vilnius (81) in higher positions than Warsaw.
A set of so-called indicators for city services and quality of life proposed in ISO 37120: 2014 “Sustainable development of communities—Indicators for city services and quality of life” (Table 4) was used to assess the quality of life. The data required to determine individual indicators were obtained from the Digitization Bureau of the Warsaw City Hall and the “Statistical Yearbook of Warsaw 2018” [28].
Table 4.
Assessment of features of the quality of life.
5.3. City’s Potential
The bases for the analysis of Warsaw’s potential were “Statistical Yearbook of Warsaw 2018” [28], “Report on Polish Metropolises” [29] (prepared in 2019 by PwC Poland consulting company), and data provided by the Warsaw City Hall. Parameters for assessing the social potential, inspired by the concept of creative class were also incorporated into the methodology adopted for assessing the potential of Warsaw. This approach utilizes the analysis of the level of development of the “super-creative core”, i.e., employees of a wide range of areas from science through engineering, education, computer programming, to research and development, as well as those associated with art, design, and media. The analysis of CSO’s (Central Statistical Office of Poland) statistical data indicates that when compared to the national average (approx. 7%), this group is exceptionally developed in Warsaw (approx. 18% of professionally active people). The Table 5 contains a selection of several data sets from among 87 factors included in the authorial methodology for assessing Warsaw’s potential. The data, depicting Warsaw against the backdrop of other Polish cities, made it possible to determine the component values of the city’s potential.
Table 5.
Selected characteristics from the “Statistical Yearbook of Warsaw 2018”.
The report prepared by PwC distinguishes seven types of so-called development capital that characterize the analyzed major Polish cities. Since 2007 PwC has been conducting the analyses in 4-year cycles; the consistent methodology ensures the comparability of separate editions in the assessment of the studied 12 cities. Using the research carried out by PwC, the authors of this article have introduced modifications resulting from access to information obtained from the Digitization Bureau of the Warsaw City Hall (Table 6). The adopted methodology identifies the assessment of the following capital: Institutional and Democratic, Technical and Infrastructure, Culture and Image, Quality of Life, Sources of Finance, Investment Attractiveness, and Human and Social. PwC studies have shown that compared to the national average (defined as 100%), the metropolis of Warsaw has the highest potential for development in Poland (131% of the average level). Warsaw is an undisputed leader in the Investment Attractiveness Capital (three times higher than the other cities). It is also worth noting that 60% of the largest foreign investors invest in Warsaw, which demonstrates the city’s enormous investment attractiveness. What is also of great importance to increasing the city’s potential are projects implemented by the Digitization Bureau of the Warsaw City Hall, e.g., “Warsaw 19115”, which is a state-of-the-art contact center, not only a comprehensive alarm system for reporting problems or breakdowns, but a platform for communicating ideas for changes in the way the city operates.
Table 6.
Assessment of features of the city’s potential. The evaluation of Warsaw’s potential (based on PwC’s analysis, 2019, with authorial modifications).
The conducted research showed that when compared to that of other Polish metropolises, the potential of Warsaw was substantial. More importantly, the analysis of its changes over the years revealed a strong growing tendency when compared to the national average. However, when concluding, one must bear in mind the local context of these analyses and assessments—such potential of a city was significant when compared to other Polish cities while it might be the average when compared to other European capitals.
Reviewing the research and results obtained for Warsaw (Figure 6), it should be stated that in many respects the capital of Poland could be considered a high-level smart city (dimension of the city’s potential) that had reached a satisfactory level in terms of the development of ICT services and quality of life. The analysis of the change dynamics indicates that there was a tendency for fast and growing changes in all analyzed dimensions.
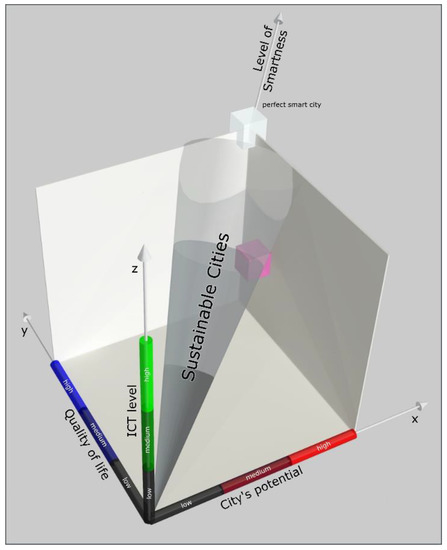
Figure 6.
Summary evaluation of Warsaw in the proposed 3D model.
It should be noted that the final assessment of the city of Warsaw might increase after analyzing additional information. In many cases the indicators received the value "0" due to a lack of data. However, the lack of data should be included in the final assessment for two reasons. It allows a reliable assessment of the city at a given time. Secondly, easy access to information is an important feature of a smart city. A lack of information should therefore reduce the rating for a given moment and mobilize city managers to obtain the necessary data. It should be emphasized that it was only an attempt to check, in practice, the value and correctness of the proposed model.
6. Conclusions and Future Work
Municipal authorities are desperate to improve the standings of their cities and the living conditions of their habitants. The path to achieve this is replete with a myriad traps, obstacles, and conditions, and requires talent, expertise, pragmatism, and even a stroke of luck. Although governing, managing, and transforming cities is a very practical exercise, it is good to found these activities and tasks on a sound theory, for, as Kurt Lewin noted, “Nothing is more practical than a good theory.”. In the previous sections we proposed a multiagency model that could be the kernel of a sustainable smart city theory. The model allows one to represent the qualitative and quantitative factors of the city’s complex machinery, and to map entities, relationships, and processes that constitute the city. It can help determine the standing of the city and compare it with other cities, to work out a strategy to transform it into a sustainable smart city, to monitor the process of transformation, and last but not least, to periodically evaluate the state of the city after it reaches its level of smartness. Our approach attempts to combine two essential notions, namely, smartness and sustainability, which is the lesson learned from the project that we executed for The Bureau for Digital Transformation of the Mayor’s Office of Warsaw [4]. In this approach, sustainability is a state that does not require smartness, and that can occur in cities that are not smart. However, in terms of devising a transformation strategy towards a smart city, sustainability is a recommended state in the transformation process, which in our model was represented by the sustainability corridor that led to the smartness zone.
The proposed solution is mainly addressed to city analysts, managers, and decision makers. It aims to help them determine the starting point, destination, and optimal strategy of the city in the process of planned transformation into a smart level in a conscious way. The currently used tools and standards focus primarily on assessing the city at a given moment. The proposed solution, remaining in full compliance with existing standards and developed good practices, facilitates the selection of strategies to reach the smart city level by placing the city in a coordinate system (e.g., three-dimensional) and checking where a given city is located and if it is contained in the smart city cone (see Figure 4b). It should be stipulated that experiments carried out on data from the city of Warsaw, it was only an attempt to check, in practice, the correctness of the proposed theoretical model. The proposed method of assessing the location of the city on the road to being “smart” turned out to be easy to carry out and giving clear results.
The authors plan to further develop this model and theory by introducing new elements, among which will be the valuation of the model’s parameters based on fuzzy sets theory. The current work being carried out on the software framework of the model will also be advanced to include new functionality and a more ergonomic interface.
Author Contributions
Conceptualization, D.G. and T.K. and M.M. and R.O.; Methodology, D.G. and T.K. and M.M. and R.O.; Investigation, D.G. and T.K. and M.M. and R.O.; Writing D.G. and T.K. and M.M. and R.O.; Visualization, M.M. and R.O. All authors have read and agreed to the published version of the manuscript.
Funding
This research received no external funding.
Acknowledgments
The authors express their gratitude to Comtegra S.A. company for the invitation to implement the project “Objectives of the Smart City Program in the Capital City of Warsaw”, the development of a detailed inventory of the systems in Warsaw, and an effective cooperation, and to The Bureau for Digital Transformation of the Mayor’s Office of Warsaw for their substantive cooperation, stimulating discussions and granting us access to the materials. We also thank the anonymous reviewers for their thoughtful comments and efforts towards improving our manuscript.
Conflicts of Interest
The authors declare no conflict of interest.
References
- Indonesiawala, H. Smart City Market is Expected to Reach USD 1933 Billion by the End of the Forecast Period Growing at 27.68% CAGR, Herald Keeper. Available online: http://heraldkeeper.com/market/smart-city-market-expected-reach-usd-1933-billion-end-forecast-period-growing-27-68-cagr-103601.html (accessed on 23 August 2018).
- Daniel, G.; Annika, W.; Gerd, K.; Rebecca, B. Reimagining the role of citizens in Smart City projects. In Adjunct Proceedings of the 2015 ACM International Joint Conference on Pervasive and Ubiquitous Computing and Proceedings of the 2015 ACM International Symposium on Wearable Computers; ACM: New York, NY, USA, 2015; pp. 1587–1594. Available online: http://oro.open.ac.uk/43770/1/citizenInnovation_ubicomp2015_cameraReady.pdf (accessed on 15 October 2018).
- Gotlib, D.; Kulisiewicz, T.; Muraszkiewicz, M.; Olszewski, R. Smart Governance in the Capital City of Warsaw with the Use of ICT and Geoinformation Technologies. In Proceedings of the ISPRS Annals of the Photogrammetry, Remote Sensing and Spatial Information Sciences, Kuala Lumpur, Malaysia, 1–3 October 2019; Volume IV-4/W9. [Google Scholar]
- The Report of Project Objectives of the Smart City Program in the Capital City of Warsaw; The Bureau for Digital Transformation of the Mayor’s Office of Warsaw: Warsaw, Poland, 2018; not published.
- Lazaroiu, G.C.; Roscia, M. Definition methodology for the smart cities model. Energy 2012, 47, 326–332. [Google Scholar] [CrossRef]
- Mkrtychev, O.; Starchyk, Y.; Yusupova, S.; Olga Zaytceva, O. Analysis of various definitions for Smart City concept. IOP Conf. Ser.Mater. Sci. Eng. 2018, 365, 022065. [Google Scholar] [CrossRef]
- Hollands, R.G. Will the Real Smart City Please Stand Up? In City: Analysis of Urban Trends, Culture, Theory. Policy Action 2018, 12, 303–320. [Google Scholar]
- Komninos, N. Intelligent Cities: Innovation, Knowledge Systems and Digital Space; Routledge: Abingdon-on-Thames, UK, 2002. [Google Scholar]
- TU—Vienna University of Technology. Europeansmartcities 4.0. Available online: http://www.smart-cities.eu/?cid=2&ver=4 (accessed on 9 May 2018).
- ITU-T FG-SSC. An Overview of Smart Sustainable Cities and the Role of Information and Communication Technologies. ITU-T Focus Group on Smart Sustainable Cities. Available online: https://www.itu.int/en/ITU-T/focusgroups/ssc/Documents/website/web-fg-ssc-0100-r9-definitions_technical_report.docx (accessed on 11 December 2018).
- Bibri, S.; Krogstie, J. Smart Sustainable Cities of the Future: An Extensive Interdisciplinary Literature Review. Sustain. Cities Soc. 2017, 31, 183–212. [Google Scholar] [CrossRef]
- Yesner Clarke, R. IDC Government Insights’ Smart City Maturity Model. 2013. Available online: https://www.scribd.com/document/410718275/IDC-Government-Insights-Smart-City-Maturity-Model-IDC (accessed on 23 April 2018).
- García-Fuentes, M.Á.; Quijano, A.; De Torre, C.; García, R.; Compere, P.; Degard, C.; Tomé, I. European cities characterization as basis towards the replication of a Smart and Sustainable Urban Regeneration Model. Energy Procedia 2017, 111, 836–845. [Google Scholar] [CrossRef]
- Kitchin, R. Making sense of smart cities: Addressing present shortcomings. Camb. J. Reg. Econ. Soc. 2015, 8, 131–136. [Google Scholar] [CrossRef]
- Townsend, A.M. Smart Cities. In Big Data, Civic Hackers, and the Quest for a New Utopia; W.W. Norton & Company: New York, NY, USA, 2013. [Google Scholar]
- The Transport Research Centre TRANSyT-UPM. Assessing Smart City Initiatives for the Mediterranean Region. Available online: http://www.eiburs-ascimer.transyt-projects.com/ (accessed on 29 August 2019).
- The Scottish Government. Smart Cities Maturity Model and Self-Assessment Tool. Available online: https://www.scottishcities.org.uk/site/assets/files/1103/smart_cities_readiness_assessment_-_guidance_note.pdf (accessed on 22 October 2018).
- The British Standards Institution. The British Standards Institution. Available online: https://shop.bsigroup.com/upload/283914/PAS-182.pdf (accessed on 25 October 2018).
- ISO. ISO 37106:2018(en) Sustainable cities and communities—Guidance on Establishing Smart City Operating Models for Sustainable Communities. Available online: https://www.iso.org/obp/ui/#iso:std:iso:37106:ed-1:v1:en (accessed on 19 December 2018).
- Sector Forum for Smart and Sustainable Cities and Communities. CEN-CENELEC-ETSI Sector Forum on Smart and Sustainable Cities and Communities. CEN CENELEC. Available online: ftp://ftp.cencenelec.eu/EN/EuropeanStandardization/Fields/SmartLiving/City/SSCC-CG/Mapping_SF-SSCC_Overview_of_Standards_for_SmartCities.pdf (accessed on 19 April 2018).
- ISO. ISO/IEC 30146:2019(en) Information Technology—Smart city ICT Indicators. Available online: https://www.iso.org/obp/ui/#iso:std:iso-iec:30146:ed-1:v1:en (accessed on 30 November 2019).
- ISO 37120:2018, Sustainable Cities and Communities—Indicators for City Services and Quality of Life. Available online: https://www.iso.org/obp/ui/#iso:std:iso:37120:ed-2:v1:en (accessed on 22 May 2018).
- Florida, R. Cities and the Creative Class; Routledge: Abingdon-on-Thames, UK, 2005; ISBN 0-415-94887-8. [Google Scholar]
- Directorate General for Internal Policies, Policy Department A: Economic and Scientific Policy, Bruxelles. Mapping Smart Cities in the EU. Available online: http://www.europarl.europa.eu/RegData/etudes/etudes/join/2014/507480/IPOL-ITRE_ET%282014%29507480_EN.pdf (accessed on 25 May 2019).
- Mercer 2019 Quality of Living City Ranking, London. Available online: https://mobilityexchange.mercer.com/Insights/quality-of-living-rankings (accessed on 25 May 2019).
- The Economist Intelligence Unit, London (2019), the Global Liveability Index 2019, a Free Overview. Available online: http://www.eiu.com/Handlers/WhitepaperHandler.ashx?fi=Liveability-Free-report-2019.pdf&mode=wp&campaignid=liveability (accessed on 11 October 2019).
- Berrone, Pascual; Ricart, Joan Enric; Duch, Ana; Carrasco, Carlos, IESE Cities in Motion Index 2019, IESE, ST-509-E. Available online: https://media.iese.edu/research/pdfs/ST-0509-E.pdf (accessed on 25 May 2019).
- Statistical Yearbook of Warsaw 2018. Available online: https://warszawa.stat.gov.pl/publikacje-i-foldery/roczniki-statystyczne/rocznik-statystyczny-warszawy-2018,6,15.html# (accessed on 25 May 2019).
- Report on Polish Metropolises Prepared in 2019 by PwC Poland Consulting Company. Available online: https://www.pwc.pl/pl/publikacje/2019/raport-o-polskich-metropoliach-2019.html (accessed on 25 November 2019).
© 2020 by the authors. Licensee MDPI, Basel, Switzerland. This article is an open access article distributed under the terms and conditions of the Creative Commons Attribution (CC BY) license (http://creativecommons.org/licenses/by/4.0/).