Article

Pre-Cancerous Stomach Lesion Detections with Multispectral-Augmented Endoscopic Prototype

1
ImViA EA 7535, Univ. Bourgogne Franche-Comté, 21078 Dijon, France
2
Hôpital Ambroise Paré de Boulogne Billancourt, 92100 Boulogne-Billancourt, France
*
Author to whom correspondence should be addressed.
Appl. Sci. 2020, 10(3), 795; https://doi.org/10.3390/app10030795
Submission received: 18 December 2019 / Revised: 14 January 2020 / Accepted: 19 January 2020 / Published: 22 January 2020
(This article belongs to the Special Issue Computer-aided Biomedical Imaging 2020: Advances and Prospects)

Abstract

:

Featured Application

The presented work has been developed to be used in operating rooms, during upper gastrointestinal exploration of the stomach. The system can distinguish between healthy mucosa, chronic gastritis and intestinal metaplasia.

Abstract

In this paper, we are interested in the in vivo detection of pre-cancerous stomach lesions. Pre-cancerous lesions are unfortunately rarely explored in research papers as most of them are focused on cancer detection or conducted ex-vivo. For this purpose, a novel prototype is introduced. It consists of a standard endoscope with multispectral cameras, an optical setup, a fiberscope, and an external light source. Reflectance spectra are acquired in vivo on 16 patients with a healthy stomach, chronic gastritis, or intestinal metaplasia. A specific pipeline has been designed for the classification of spectra between healthy mucosa and different pathologies. The pipeline includes a wavelength clustering algorithm, spectral features computation, and the training of a classifier in a “leave one patient out” manner. Good classification results, around 80%, have been obtained, and two attractive wavelength ranges were found in the red and near-infrared ranges: [745, 755 nm] and [780, 840 nm]. The new prototype and the associated results give good arguments in favor of future common use in operating rooms, during upper gastrointestinal exploration of the stomach for the detection of stomach diseases.

1. Introduction

Based on GLOBOCAN 2018 data [1], stomach cancer is the sixth most common and the fourth most deadly cancer. Unfortunately, the five-year survival rate of this cancer is about 30% and has not increased since the 1990s. Improving the survival rate of this cancer is important to have a better diagnosis and a better understanding of the early stages of cancer. Thus, a promising way is to focus on pre-cancerous lesions and to use new imaging modalities with supervised learning techniques.
Presently, practicians mostly use upper gastrointestinal endoscopy, under white light (WL) or Narrow Band Imaging (NBI), to diagnose stomach pathologies. Recognizing inflammatory lesions is still a hard task as they are often undetectable, especially under white light. Lesions are often too small to be seen at a macroscopic level. Thus, biopsies are performed in a systematic and non-oriented way. Little pieces of the stomach are collected and analyzed a posteriori in a laboratory to make a diagnosis. As the location of the samples is randomly chosen, the result could be different from one location to another and depends on the endoscopist’s experience.
NBI is a system created by Olympus, made of two or three narrow filters centered on the Hemoglobin absorption peaks, thus showing vascularity darker than the surroundings. The system has been successfully used to diagnose Barett’s esophagus [2] and allows good visualization of specific patterns of chronic gastritis and intestinal metaplasia [3].
The main alternative to NBI is the “Fuji Intelligent Chromo Endoscopy” (FICE) system by FUJI [4]. FICE estimates multispectral images, between 400 and 695 nm, with a 5 nm step, from a standard endoscopic image. Then, the practician can choose to display three images among them in red, green, and blue channels. Ten settings are pre-configured. FICE has been proven to be useful for the detection of complete and incomplete metaplasia [5]. The significant difference between FICE and NBI is that FICE proposes a software improvement with the computation of spectral images, and NBI proposes an optics improvement with specific filters [6].
Fuji recently proposed two new medical systems, the Blue Light Imaging (BLI) and the Linked Color Imaging (LCI). BLI allows better visualization of superficial vascular and mucosal patterns with a sensor sensitivity focused on the Hemoglobin absorption peak at 410 nm [7]. LCI has a specific pre-processed composition of the light and applies image processing techniques to increase the color contrast, thus also improving the delineation of pathologies [8].
Lately, endoscope manufacturers (e.g., FUJI, Olympus, Pentax) greatly improved image resolutions [9]. However, fewer improvements are introduced for the detection of the lesions. A better system is the magnifying NBI [10]. Uedo et al. used this system to link the apparition of white and blue crests on the stomach’s surface to metaplasia [11].
These systems show that non-conventional imaging, more specifically the use of spectral information, is promising to improve the detection of stomach lesions. Multispectral or hyperspectral systems use reflectance or fluorescence to get meaningful information on tissue composition. In particular, reflectance represents the fraction of light coming back from the tissue as a function of the wavelengths. Fluorescence is the emission of light by tissues in response to a shorter exciting wavelength. The light response can be influenced in a different way by amount and type of each of a different biomolecule acting as chromophore or fluorophore present in the tissue. The overall light signal recorded from the tissue will result from the different effects of various components, and that is the reason for which it depends on the tissue composition.
For example, the system made by Gu et al., made of seven bands between 465 nm and 665 nm. The three bands, 645 nm, 545 nm, and 495 nm, have been selected as the triplet that minimizes mutual information. These three bands are then used to create an enhanced RGB image for better visualization. The system has been tested for ulcer detection [12].
Visualization helps to detect pathologies, but the interpretation remains in endoscopists’ hands. The diagnosis thus depends on the endoscopist’s experience and is not necessarily correlated with histological results. It is essential to improve the detection thanks to signal and image processing methods adapted to non-conventional modalities. For example, Kiyotoki et al. used a hyperspectral camera between 400 and 800 nm to characterize the spectral response of resected tumors [13]. 14 patients have been studied by selecting spectra on healthy and cancerous areas. Ogihara et al. have conducted similar works. They also used a hyperspectral camera in the range [400, 800 nm] to analyze resected stomachs. They noticed a high inter-patient variability that led them to normalize all spectra according to the mean spectra taken on healthy areas. These works are promising but are all conducted ex vivo.
A few works considering in vivo exploration with multispectral systems exist in the literature. In 2017, Hohmann et al. demonstrated that multispectral data was useful for the detection of adenocarcinoma [14]. Their system is composed of a standard endoscope and a modified light source. The spectral range used in this study is [438, 628 nm]. They have tested several classifiers including Random Forest, RobustBoost, Adaboost or Support Vector Machine (SVM). Their classification accuracy was around 60%. Makhlouf et al. worked on a confocal microendoscope with two modes. One with a gray-level image to observe the fluorescence response and the other to obtain a multispectral image of fluorescence [15].
An attractive aspect of hyperspectral acquisitions is the link between spectra and biological parameters. A spectrum is the sum of several chromophores’ contributions. Thus, an unmixing process can be done. For example, Grosberg et al. characterized gastric mucosa with hyperspectral two-photon microscopy. They obtained images at cellular levels. Unmixing was performed to distinguish four tissue types: epithelium, lamina propria, collagen, and lymphatic tissue [16]. Bergholt et al. acquired spectra via Raman spectroscopy [17]. Spectra were also unmixed to find the relative contribution of DNA, proteins, lipids, and glycoproteins. Relative contributions were successfully used to classify four tissue types: healthy, intestinal metaplasia, dysplasia, and adenocarcinoma. They have obtained a good sensitivity between 80% and 90% and a specificity higher than 90% with a Partial Least Squares-Discriminant Analysis PLS-DA).
Martinez et al. developed a system with a filter wheel for acquisitions at six different wavelengths. The principle drawback is that images must be registered. A “Nearest Neighbors” classifier and an SVM classifier (with a linear or a gaussian kernel) have been used on 5x5 patches to detect pre-cancerous states in the stomach [18]. The best results have been obtained with the SVM classifier with a gaussian kernel with an accuracy of 77%. Except for this work, we rarely find other papers related to in vivo stomach exploration.
Other techniques have been developed to help the detection of pathologies with imaging systems. For example, contrast agents can be used to characterize the stomach wall like chromoendoscopy [19]. Some agents are absorbed by cells or accumulate on peaks and valley of the mucosa, thus showing the structure of the cells. The use of contrast agents is not mandatory. Some biological substances can be stimulated by light, acting as fluorophores. This phenomenon is exploited by fluorescence techniques: by exciting fluorophores with at a certain wavelength, they re-emit light in a higher wavelength [20]. In practice, collagen is the most important in sub-mucosa but we can also find Pyridoxal phosphate, riboflavin, phospholipid and porphyrins I and II (PPS) [21]. To the opposite, Chromophores (Hemoglobin for instance) does not re-emit light but absorb it. The result of fluorophores and chromophores is usually visualized by a multispectral camera [22].
In the present paper, a new prototype is introduced for acquiring NBI endoscopic images and multispectral images. We demonstrate how this prototype can be used for the recognition of several pre-cancerous gastric lesions such as chronic gastritis or intestinal metaplasia. In Section 2, we first introduced a previous preclinical study on mice’s stomach [23]. Then a new clinical prototype based on multispectral cameras is detailed and the acquisition of data and the signal processing methods are given. In Section 3, the classification results are presented and discussed.

2. Materials and Methods

2.1. Preclinical Study on Mice’s Stomach

In a previous paper, the reflectance of the stomach has been studied on mice infected by H. pylori, a bacteria involved in the development of gastritis on mice and humans [23]. The mice were sacrificed at different time-point after infection and their stomach resected for multispectral analysis with a spectrometer. The work on mice can be seen as a preliminary work in which a classification pipeline has been developed. This pipeline allowed us to separate spectra between control and inflamed mice with good accuracy of 98% and, more interestingly, to identify two wavelength ranges in the red/infrared ranges that are discriminant for the classification: [620, 668 nm] and [668, 950 nm]. This study proves that analyzing reflectance spectra is a promising way to detect pathologies. We re-use the methodology and the pipeline for the processing of in vivo human’s data as presented in the following paragraphs.
The data that are acquired consist of a set of spectra. More precisely, two sets of spectra, one in the visible range with wavelengths between 400 and 630 nm with a 10 nm step (thus, 24 points by spectra) and in the near-infrared with wavelengths between 610 and 840 nm with a 10 nm step (also 24 points by spectra). It is interesting to examine the correlation between the wavelengths (i.e., the 24 points). Figure 1a,b show this correlation. The value of each point (i,j) of these correlation matrices corresponds to the correlation between reflectance spectra at wavelengths i and j. In both images, red squares can be observed along the diagonal. These squares indicate that some wavelengths are highly correlated, especially the ranges around [410, 480 nm] and [520, 580 nm] in the visible and around [610, 690 nm] and [780, 840 nm] in the near-infrared. This observation motivates us to cluster the spectral bands into coherent groups. Figure 1c,d show the results of the band clustering algorithm. A median spectrum is presented with vertical black lines allowing the visualization of borders. For the visible (VIS) camera, eight bands are obtained, and, for the near-infrared (NIR) camera, seven bands are obtained.
To obtain these results, we recursively merge the neighboring bands that are correlated more than 90%. At every iteration, the correlation between neighboring bands is computed, and the two most correlated bands are merged. The detailed algorithm is presented in Algorithm 1. The algorithm uses the same scheme as hierarchical clustering with an additional connectivity constraint. At the beginning of the algorithm, every wavelength is a cluster, and at each iteration, two clusters are merged. A version of this algorithm exists with connectivity constraints. In our case, only neighboring wavelengths can be merged. This algorithm is unsupervised because the label (i.e., control, chronic gastritis, or metaplasia) is not used.
Algorithm 1: Pseudo code of the wavelengths clustering algorithm
Applsci 10 00795 i001
The wavelengths that have been clustered are reduced to their spectral mean μ i on the cluster range according to Equation (1):
μ i = 1 N i λ = λ i λ i + 1 S λ
where N i is the number of wavelengths in the range [ λ i , λ i + 1 ] and S λ is the reflectance of the spectra at λ .
After the reduction of the number of wavelengths, features are extracted. Three types of features are investigated: either the reduced bands are directly used, or the features are computed as the ensemble of all possible subtractions or divisions. More formally, we denote the ratios as R i , j and the differences as D i , j . They are defined in Equations (2) and (3):
R i , j = μ i μ j ,
D i , j = μ i μ j .
Then, a univariate selection step is performed to reduce the complexity of the classifier. Reducing complexity helps us to avoid over-fitting problems. The F-test of ANalysis Of VAriance (ANOVA) [24] is used to extract the k most discriminant features. It consists of the computation of a p-value, the probability that two distributions are the same. The lower the p-value is, the more discriminant the feature is.
The classification consists of a simple SVM classifier with a linear kernel. Leave one patient out cross-validation is performed. At every iteration, all spectra except for one patient are used to train the classifier. The complete pipeline is written in Python thanks to the Scikit-learn library [25] and is summarized in Algorithm 2.
Algorithm 2: Classification pipeline
Applsci 10 00795 i002

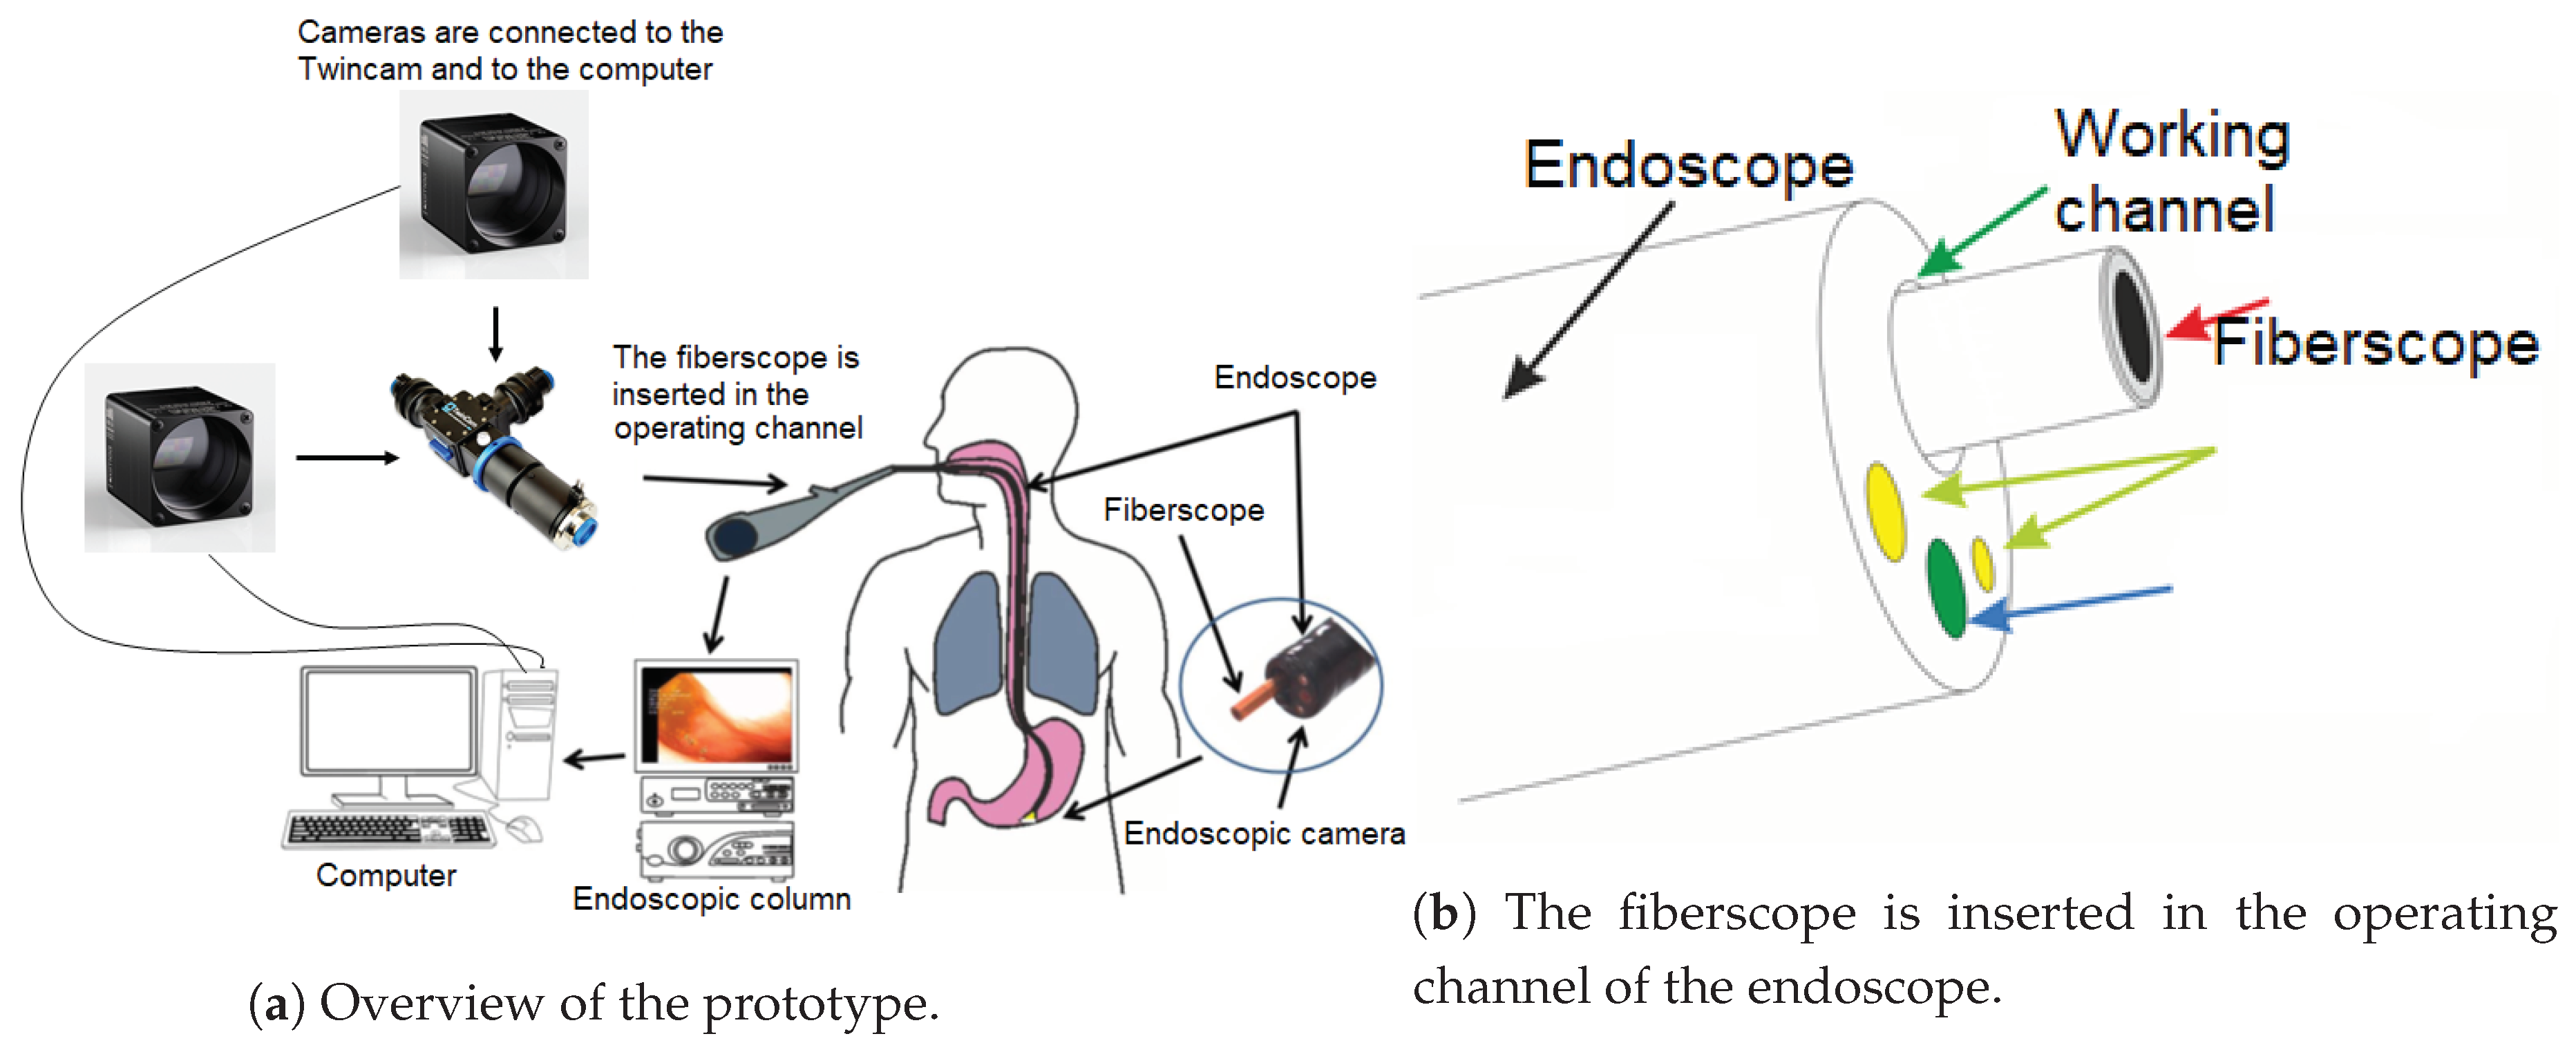
2.2. Description of the Prototype

The system that has been designed in this study can acquire NBI images and multispectral images. A standard endoscope (Olympus Exera III) that already exists in most operating rooms is used. Moreover, there are two multispectral cameras (XIMEA based on CMOSIS CMV2000 technology [26]), one in the visible range (450–620 nm) with 16 bands and one in the red and near-infrared (600–1000 nm) with 25 bands. The cameras are connected to a computer with USB 3.0 ports. For convenience, these cameras are respectively called VIS and NIR. To acquire images inside the stomach, a fiberscope (microflex fiberscope from ITConcepts, 2.5 m length, and 2.5 mm thick [27]) is used. The fiberscope contains emitting fibers to illuminate the stomach and receiving fibers to catch images. It is to notice that this fiberscope must be sterilized before each use, this is one of the current limitations as the multispectral system cannot be used during the cleaning of the fiberscope procedure. To connect the fiberscope to the cameras, a beamsplitter system is used (TwinCam from Cairn Research [28]). A dichroic filter splits light rays into two according to the wavelength ranges [470–620 nm] and [600–975 nm]. Additionally, a filter is added to avoid Ultraviolet (UV) light. In our case, a 1000 W powerful external light source is needed because the fiber and the sensitivity of the camera induce a loss of intensity. Thus, a Mercury-Xenon light source controlled by a controller device helps to illuminate the stomach (Newport reference: 66924-1000XF-R1).
The system must be calibrated spatially and spectrally. The spatial and spectral calibration have been presented in a previous paper [29]. Spatial calibration is needed to correct the redial distortion and to register the NBI image with the multispectral images. The calibration is done by using the tip of the fiberscope, which is visible in the NBI images. Spectral calibration is required because the filters of the cameras are based on the Fabry-Perot structure. They have a primary response but also a secondary response. Moreover, it exists noisy response out of the initial expected wavelength range called crosstalk problem. The calibration has been done by learning a multilinear transformation on a set of patches of the ColorChecker ® . More concretely, the 24 bands ([400, 630 nm] with a step of 10 nm) are deduced from the 16 original bands with the multiplication of a 16 × 24 matrix and, in the same way from the 24 bands ([610, 840 nm] with a step of 10 nm) are deduced from the 25 original bands with the multiplication of a 25 × 24 matrix. After this transformation, all spectra are normalized according to their l 2 norm, meaning that all spectra are divided by their sum of squares.
In a practical situation, the endoscopist inserts the fiberscope in the operating channel of the endoscope, as described in Figure 2. This operating channel is usually used to insert tools like pincer or cutting/grasping instruments. The endoscopy usually lasts 1 or 2 minutes during which the multispectral cameras acquire images every second approximatively. A specific acquisition software has been developed in C# programming language with .NET 4.5 framework and the library xiAPI that allows the control of the multispectral cameras [30]. This software manages the data saving and adapts the exposition time of the cameras automatically. The cameras have been optically calibrated such that the focus is approximately 2 cm. This distance is the mean distance that exists between the fiberscope tip and the stomach wall.

2.3. Data Acquisition and Preprocessing

The presented bimodal system can acquire multispectral images at approximately one image per second. This exposure time is due to the low power of light that comes back in the fiber. Figure 3a shows an example of a multispectral image acquired in the stomach. The image is rearranged in 16 small images to show the 16 bands of the VIS camera. We can see the disk in the center, which is the area covered by the fiberscope. All images do not necessarily contain useful information. In general, multispectral images are often blurry. This phenomenon is due to the movements of the endoscope, the poor spatial resolution, the fiberscope, and the high exposure time. Then, it is challenging to use textural information as some parts of the image could be too dark or over-exposed. Therefore, we make sure to keep only pixels whose maximum is under 512. Indeed, the camera’s technical documentation specifies that if the 10th bit is set to 1, then the pixel is considered saturated. In the same manner, pixels whose spectral mean does not exceed 128 are considered too dark to be exploited. To understand this choice, we present an example in Figure 3b. Three pixels are compared: in blue, a pixel which is too dark, in green, a valid pixel, and in red, a saturated pixel.
A linear transformation described in a previous paper [29] is applied to the spectral radiance to get estimated reflectance spectra (Figure 3c) i.e., to estimate the 24 points in the VIS and the 24 points in the NIR from the original 16 bands of the VIS camera and the 25 bands of the NIR camera.
As the multispectral images are difficult to interpret directly, an experienced gastro-endoscopist selected NBI endoscopic images in which the fiber is focused on a significative zone of the pathology. Then we can select the temporally nearest multispectral image for the analysis.
The image should then be filtered with a low-pass filter to reduce the noise. Although it exists a various number of filtering like the use of wavelets [31]. In our case, we have chosen to use a simple pyramidal filter:
1 2 3 4 3 2 1 2 4 6 8 6 4 2 3 6 9 12 9 6 3 4 8 12 16 12 8 4 3 6 9 12 9 6 3 2 4 6 8 6 4 2 1 2 3 4 3 2 1 .
Then, spectra are taken on a grid by considering 1 pixel over 7 (vertically and horizontally). We gathered data for 16 patients. The Table 1 classifies them according to their histological results. For all these patients, 200 valid spectra were randomly taken among the valid spectra to have the same number of spectra for each patient.
Figures and results from the two cameras are intentionally separated. Cameras acquire images independently, and in practice, if no pixel in an image is valid (i.e., either too dark or over-exposed), the image is removed.
The two Figure 4 show median spectra of the 16 patients after calibration, respectively for VIS camera (Figure 4a) and NIR (Figure 4b). The color indicates histological results: blue for control, green for chronic gastritis, and red for intestinal metaplasia. We do not see specific behavior in the visible range, but control spectra seem clustered for the NIR camera, they have a lower derivative. On the spectral range [610, 730 nm], plots corresponding to metaplasia are under the plots of control class and inversely for the spectral range [730, 840 nm].
The obtained spectra are then processed by the pipeline detailed in Section 2. The next sections give the classification results obtained separately with VIS and NIR data.

3. Results

In this section, the classification results are presented. A support vector machine (SVM) with a linear kernel is trained in a “leave one patient out” manner. The three types of features are tested, i.e., the reduced bands, the subtractions features, or the divisions’ features. It is to note that two hyperparameters can be tuned: the number of features retained in the feature selection step k and the regularization parameter c that controls the balance between misclassification rate and the size of the margin. A lower value of c leads to a better misclassification rate but also a smaller margin, thus being less robust to over-fitting.
In this section, data acquired by the two cameras are processed separately. The Table 2 presents the results obtained with the VIS camera and Table 3, the one obtained with the NIR camera.
In Table 2, we observe that intestinal metaplasia is confounded with chronic gastritis. For the three types of features, the results are close to 53% of precision and 67% recall. Better results are obtained in Table 3, especially with divisions and subtractions’ features. The average of the three classes is 80% for the precision and 80% for the recall.
It can be seen in the confusion matrix Figure 5 that the healthy class is sometimes confounded with intestinal metaplasia and that chronic gastritis is sometimes confounded with intestinal metaplasia. This second point is more acceptable in the sense that intestinal metaplasia usually appears as little patches in the middle of chronic gastritis. Thus, a patient with intestinal metaplasia has always chronic gastritis too.
It is interesting to detail the classification results for each patient. Figure 6 presents the number of spectra classified in each category for each patient. It can be seen that the classification is usually good except for patients 10 and 15, which are healthy and have mostly “intestinal metaplasia”-like spectra. Patient 13 has intestinal metaplasia, but its spectra are mostly classified as chronic gastritis. More generally, 13 patients out of 16 patients have most of their spectra classified in the right class.
Moreover, the interesting point is that only one ratio is sufficient to reach good classification results. The best results are obtained with k = 1 , the best ratio is the one with the highest score in Figure 7b i.e., R 4 , 6 . R 4 , 6 is the division of the range [745, 755 nm] by the range [780, 840 nm]. It can be observed in Figure 7a that the distribution of the three classes (blue for healthy, green for chronic gastritis, and red for intestinal metaplasia) for this particular ratio shows a good separability, especially between healthy and the two pathologies. It is interesting to also note the correlation between the preclinical study on mice. In both cases, the most discriminant wavelength range is in the red and near-infrared part of the spectra.

4. Conclusions

In this paper, a new prototype is introduced to acquire endoscopic NBI videos and multispectral videos during in vivo stomach exploration. The prototype is used to acquire spectra on 16 patients. For each of these patients, 200 spectra are selected, leading to a dataset of 3200 spectra. Spectra obtained with multispectral cameras are processed with a classification pipeline containing a wavelength reduction algorithm, the computation of three types of features (reduced bands, subtractions and divisions) and a leave one patient out classification with an SVM classifier with a linear kernel. The classifier can recognize a healthy stomach wall from chronic gastritis and intestinal metaplasia with a good precision of 80%. Moreover, two exciting wavelength ranges are identified in the red and near-infrared ranges: [745, 755 nm] and [780, 840 nm]. To the best of our knowledge, the analysis of this ensemble of three types of tissues (i.e., chronic gastritis, intestinal metaplasia, and healthy) has never been considered in a previous paper.
These promising results must be confirmed on a larger dataset. The prototype can also be improved to have better quality for the images and, thus, to be able to exploit textural information caught by the multispectral cameras. Finally, unmixing algorithms can be used to get information on the relative concentration of chromophores and thus have a better understanding of the biological changes that appear with pre-cancerous lesions.

Author Contributions

Investigation, A.K.; Methodology, A.K.; Project administration, F.M.; Resources, D.L. and T.B.; Supervision, Y.B., F.M. and D.L.; Writing—original draft, A.K.; Writing—review & editing, A.K., Y.B. and F.M. All authors have read and agreed to the published version of the manuscript.

Funding

This study was supported by the French Research National Agency (ANR) program EMMIE under the grant agreement 15-CE17-0015.

Conflicts of Interest

The authors declare no conflict of interest.

References

  1. Ferlay, J.; Colombet, M.; Soerjomataram, I.; Mathers, C.; Parkin, D.; Piñeros, M.; Znaor, A.; Bray, F. Estimating the global cancer incidence and mortality in 2018: GLOBOCAN sources and methods. Int. J. Cancer 2019, 144, 1941–1953. [Google Scholar] [CrossRef] [PubMed] [Green Version]
  2. Sharma, P.; Bergman, J.J.; Goda, K.; Kato, M.; Messmann, H.; Alsop, B.R.; Gupta, N.; Vennalaganti, P.; Hall, M.; Konda, V.; et al. Development and validation of a classification system to identify high-grade dysplasia and esophageal adenocarcinoma in Barrett’s esophagus using narrow-band imaging. Gastroenterology 2016, 150, 591–598. [Google Scholar] [CrossRef] [PubMed]
  3. Bansal, A.; Ulusarac, O.; Mathur, S.; Sharma, P. Correlation between narrow band imaging and nonneoplastic gastric pathology: A pilot feasibility trial. Gastrointest. Endosc. 2008, 67, 210–216. [Google Scholar] [CrossRef] [PubMed]
  4. FICE Fuji Intelligent Chromo Endoscopy. Available online: http://www.sfed.org/files/documents_sfed/partenaires/fujinon/pdf/fice.pdf (accessed on 27 May 2019).
  5. Burgos, H.; Porras, M.; Brenes, F.; Izquierdo, E. Fujinon FICE electronic chromovideoendoscopy helps differentiate the type of metaplasia in patients with chronic atrophic gastritis. Gastrointest. Endosc. 2007, 65, AB353. [Google Scholar] [CrossRef]
  6. Song, L.M.W.K.; Adler, D.G.; Conway, J.D.; Diehl, D.L.; Farraye, F.A.; Kantsevoy, S.V.; Kwon, R.; Mamula, P.; Rodriguez, B.; Shah, R.J.; et al. Narrow band imaging and multiband imaging. Gastrointest. Endosc. 2008, 67, 581–589. [Google Scholar] [CrossRef] [PubMed]
  7. Weigt, J.; Malfertheiner, P.; Canbay, A.; Haybaeck, J.; Bird-Lieberman, E.; Link, A. Blue Light Imaging and Linked Color Imaging for the Characterization of Mucosal Changes in Chronic Gastritis: A Clinicians View and Brief Technical Report. Dig. Dis. 2020, 38, 9–14. [Google Scholar] [CrossRef]
  8. Dohi, O.; Yagi, N.; Onozawa, Y.; Kimura-Tsuchiya, R.; Majima, A.; Kitaichi, T.; Horii, Y.; Suzuki, K.; Tomie, A.; Okayama, T.; et al. Linked color imaging improves endoscopic diagnosis of active Helicobacter pylori infection. Endosc. Int. Open 2016, 4, E800–E805. [Google Scholar] [CrossRef] [Green Version]
  9. Gono, K. An Introduction to High-Resolution Endoscopy and Narrowband Imaging. In Comprehensive Atlas of High-Resolution Endoscopy and Narrowband Imaging; Wiley Online Library: Hoboken, NJ, USA, 2017; pp. 7–15. [Google Scholar]
  10. Bruno, M. Magnification endoscopy, high resolution endoscopy, and chromoscopy; towards a better optical diagnosis. Gut 2003, 52, iv7–iv11. [Google Scholar] [CrossRef]
  11. Uedo, N.; Ishihara, R.; Iishi, H.; Yamamoto, S.; Yamada, T.; Imanaka, K.; Takeuchi, Y.; Higashino, K.; Ishiguro, S.; Tatsuta, M. A new method of diagnosing gastric intestinal metaplasia: Narrow-band imaging with magnifying endoscopy. Endoscopy 2006, 38, 819–824. [Google Scholar] [CrossRef]
  12. Gu, X.; Yao, L.; Zhong, Y.; Han, Z.; Shi, Q.; Fu, Y.; Liu, C.; Wang, X.; Xie, T. Image enhancement based on in vivo hyperspectral gastroscopic images: A case study. J. Biomed. Opt. 2016, 21, 101412. [Google Scholar] [CrossRef] [Green Version]
  13. Kiyotoki, S.; Nishikawa, J.; Okamoto, T.; Hamabe, K.; Saito, M.; Goto, A.; Fujita, Y.; Hamamoto, Y.; Takeuchi, Y.; Satori, S.; et al. New method for detection of gastric cancer by hyperspectral imaging: A pilot study. J. Biomed. Opt. 2013, 18, 026010. [Google Scholar] [CrossRef] [PubMed] [Green Version]
  14. Hohmann, M.; Kanawade, R.; Klämpfl, F.; Douplik, A.; Mudter, J.; Neurath, M.; Albrecht, H. In-vivo multispectral video endoscopy towards in-vivo hyperspectral video endoscopy. J. Biophotonics 2017, 10, 553–564. [Google Scholar] [CrossRef] [PubMed]
  15. Makhlouf, H.; Gmitro, A.F.; Tanbakuchi, A.A.; Udovich, J.A.; Rouse, A.R. Multispectral confocal microendoscope for in vivo and in situ imaging. J. Biomed. Opt. 2008, 13, 044016. [Google Scholar] [CrossRef] [PubMed]
  16. Grosberg, L.E.; Radosevich, A.J.; Asfaha, S.; Wang, T.C.; Hillman, E.M. Spectral characterization and unmixing of intrinsic contrast in intact normal and diseased gastric tissues using hyperspectral two-photon microscopy. PLoS ONE 2011, 6, e19925. [Google Scholar] [CrossRef] [Green Version]
  17. Bergholt, M.S.; Zheng, W.; Ho, K.Y.; Teh, M.; Yeoh, K.G.; So, J.B.Y.; Shabbir, A.; Huang, Z. Fiber-optic Raman spectroscopy probes gastric carcinogenesis in vivo at endoscopy. J. Biophotonics 2013, 6, 49–59. [Google Scholar] [CrossRef] [PubMed]
  18. Martinez-Herrera, S.E.; Benezeth, Y.; Boffety, M.; Emile, J.F.; Marzani, F.; Lamarque, D.; Goudail, F. Multispectral endoscopy to identify precancerous lesions in gastric mucosa. In Proceedings of the International Conference on Image and Signal Processing, Cherburg, France, 30 June–2 July 2014; Springer: Berlin/Heidelberg, Germany, 2014; pp. 43–51. [Google Scholar]
  19. Reddymasu, S.C.; Sharma, P. Advances in endoscopic imaging of the esophagus. Gastroenterol. Clin. 2008, 37, 763–774. [Google Scholar] [CrossRef] [PubMed]
  20. Namikawa, T.; Sato, T.; Hanazaki, K. Recent advances in near-infrared fluorescence-guided imaging surgery using indocyanine green. Surg. Today 2015, 45, 1467–1474. [Google Scholar] [CrossRef]
  21. Li, Y.; Xie, X.; Yang, X.; Guo, L.; Liu, Z.; Zhao, X.; Luo, Y.; Jia, W.; Huang, F.; Zhu, S.; et al. Diagnosis of early gastric cancer based on fluorescence hyperspectral imaging technology combined with partial-least-square discriminant analysis and support vector machine. J. Biophotonics 2019, 12, e201800324. [Google Scholar] [CrossRef]
  22. Kobayashi, M.; Tajiri, H.; Seike, E.; Shitaya, M.; Tounou, S.; Mine, M.; Oba, K. Detection of early gastric cancer by a real-time autofluorescence imaging system. Cancer Lett. 2001, 165, 155–159. [Google Scholar] [CrossRef]
  23. Krebs, A.; Camilo, V.; Touati, E.; Benezeth, Y.; Michel, V.; Jouvion, G.; Yang, F.; Lamarque, D.; Marzani, F. Detection of H. pylori Induced Gastric Inflammation by Diffuse Reflectance Analysis. In Proceedings of the 18th International Conference on Bioinformatics and Bioengineering (BIBE), Taichung, Taiwan, 29–31 October 2018; pp. 287–292. [Google Scholar]
  24. Neuhauser, M. Nonparametric Statistical Tests: A Computational Approach; Chapman and Hall/CRC: Boca Raton, FL, USA, 2011. [Google Scholar]
  25. Pedregosa, F.; Varoquaux, G.; Gramfort, A.; Michel, V.; Thirion, B.; Grisel, O.; Blondel, M.; Prettenhofer, P.; Weiss, R.; Dubourg, V.; et al. Scikit-learn: Machine learning in Python. J. Mach. Learn. Res. 2011, 12, 2825–2830. [Google Scholar]
  26. USB3 Vision Compliant Cameras-xiQ. Available online: https://www.ximea.com/en/products/usb3-vision-standard-designed-cameras-xiq (accessed on 27 May 2019).
  27. ITConcepts microFlex. Available online: http://www.itconceptsworld.com/index.html (accessed on 27 May 2019).
  28. TwinCam. Available online: https://www.cairn-research.co.uk/product/twincam/ (accessed on 25 May 2019).
  29. Zenteno, O.; Krebs, A.; Treuillet, S.; Lucas, Y.; Benezeth, Y.; Marzani, F. Spatial and Spectral Calibration of a Multispectral-Augmented Endoscopic Prototype. In Proceedings of the International Joint Conference on Computer Vision, Imaging and Computer Graphics, Funchal-Madeira, Portugal, 27–29 January 2018; Springer: Berlin/Heidelberg, Germany, 2018; pp. 262–280. [Google Scholar]
  30. Ximea API. Available online: https://www.ximea.com/support/wiki/apis/xiAPINET (accessed on 21 January 2020).
  31. Cetin, A.E.; Tofighi, M. Projection-based wavelet denoising [lecture notes]. Signal Process. Mag. 2015, 32, 120–124. [Google Scholar] [CrossRef]
Figure 1. Correlation between wavelengths.
Applsci 10 00795 g001
Figure 2. Functional scheme of the prototype.
Applsci 10 00795 g002
Figure 3. Example of the extraction of spectra from the multispectral image.
Applsci 10 00795 g003
Figure 4. Acquisitions with VIS and NIR cameras.
Applsci 10 00795 g004
Figure 5. Confusion matrix.
Applsci 10 00795 g005
Figure 6. Results by patient.
Applsci 10 00795 g006
Figure 7. Analysis of divisions features.
Applsci 10 00795 g007
Table 1. Distribution of multispectral data according to histology.
HealthyChronic
Gastritis
Intestinal
Metaplasia
475
Table 2. Classification results with the VIS camera.
Optimal
Hyperparameter
ClassPrecisionRecallF1-Score
Reduced
Bands
c = 0.0001
k = 1
Healthy0.981.000.99
Chronic gastritis0.580.990.73
Intestinal metaplasia0.000.000.00
Average0.520.660.57
Divisionsc = 0.0001
k = 1
Healthy1.001.001.00
Chronic gastritis0.581.000.74
Intestinal metaplasia0.000.000.00
Average0.530.670.58
Subtractionsc = 0.0001
k = 1
Healthy1.001.001.00
Chronic gastritis0.581.000.74
Intestinal metaplasia0.000.000.00
Average0.530.670.58
Table 3. Classification results with the NIR camera.
Optimal
Hyperparameter
ClassPrecisionRecallF1-Score
Reduced
Bands
c = 0.001
k = 1
Healthy0.880.510.64
Chronic gastritis0.590.940.73
Intestinal metaplasia0.730.370.49
Average0.730.610.62
Divisionsc = 0.001
k = 1
Healthy0.870.560.68
Chronic gastritis0.870.960.91
Intestinal metaplasia0.690.780.73
Average0.800.800.80
Subtractionsc = 0.001
k = 1
Healthy0.860.570.69
Chronic gastritis0.860.960.91
Intestinal metaplasia0.690.760.73
Average0.800.770.77

