Article

Effect of Landing Posture on Jump Height Calculated from Flight Time

1
Japan Institute of Sports Sciences, 3-15-1, Nishigaoka, Kita-ku, Tokyo 115-0056, Japan
2
National Institute of Fitness and Sports in Kanoya; 1 Shiromizucho, Kanoya, Kagoshima 891-2393, Japan
*
Author to whom correspondence should be addressed.
Appl. Sci. 2020, 10(3), 776; https://doi.org/10.3390/app10030776
Submission received: 31 December 2019 / Revised: 19 January 2020 / Accepted: 20 January 2020 / Published: 22 January 2020
(This article belongs to the Special Issue Biomechanical Spectrum of Human Sport Performance)

Abstract

:
Flight time is widely used to calculate jump height because of its simple and inexpensive application. However, this method is known to give different results than the calculation from vertical velocity at takeoff. The purpose of this study is to quantify the effect of postural changes between takeoff and landing on the jump height from flight time. Twenty-seven participants performed three vertical jumps with arm swing. Three-dimensional coordinates of anatomical landmarks and the ground reaction force were analyzed. Two methods of calculating jump height were used: (1) the vertical velocity of the whole-body center of mass (COMwb) at takeoff and (2) flight time. The jump height from flight time was overestimated by 0.025 m compared to the jump height from the takeoff velocity (p < 0.05) due to the lower COMwb height at landing by −0.053 m (p < 0.05). The postural changes in foot, shank, and arm segments mainly contributed to decreasing the COMwb height (−0.025, −0.014, and −0.017 m, respectively). The flight time method is reliable and had low intra-participant variability, but it cannot be recommended for a vertical jump when comparing with others (such as at tryouts) because of the potential “cheating” effect of differences in landing posture.

1. Introduction

Jumping ability is regarded as one of the most important aspects of many sports. Vertical jump measurement is a method to assess lower limb power [1], strength [2], and neuromuscular status [3]. Therefore, the vertical jump test has been used to assess the impact of training [2] and to select high-level players at tryouts in many sports such as American football [4] and basketball [5].
The force platform is one of the most widely used methods of vertical jump measurement and is considered the gold standard for determining the mechanical outputs of jumping [6]. Force platforms are used to measure the ground reaction force (GRF) and derive the velocity of the whole-body center of mass (COMwb) using the impulse–momentum relationship. However, they are costly for sports teams and strength coaches, so their use is limited mainly to university laboratories and research institutes.
Recently, the calculation of jump height from flight time using a contact mat, a photoelectric cell, and a smartphone that utilizes a high-speed camera application has become increasingly popular due to its low cost and straightforward assessment methods. In this method, jump height is calculated using a uniform acceleration equation. The equation justifies the method only if the height of the COMwb is the same at takeoff and landing. It has been reported, however, that the method overestimates the countermovement jump without arm swing (CMJ) height by 2% [7], 3–4% [8], 8% [8], and 11% [9] compared to the method using vertical velocity at takeoff from a force platform. These results suggest that the height of the COMwb at landing is lower than that at takeoff, making the flight time longer. Consequently, the jump height from flight time is overestimated.
One potential determining factor for this difference, suggested by the previous studies, is that participants landed with their lower limbs partially bent, resulting in an inflated flight time [8,9]. Kibele [7] showed that knee and ankle joints were more flexed, and the COMwb height was lower at landing than at takeoff. Also, a different arm posture at takeoff and landing seems to affect the difference in the COMwb height when arm swing is permitted [10]. Previous studies reported that the COMwb height at takeoff in the vertical jump with arm swing (VJ) was 0.024 m [11] and 0.034 m [12] higher than that in CMJ.
The flight time method of calculating jump height is widely used by laboratories and sports teams, even though many researchers have acknowledged the postural differences at takeoff and landing. However, there have been few studies which have aimed to understand the sources of error in jump height from flight time. In order to fully understand the sources of error, it is helpful to quantify the relationship between the postural difference and the difference in the COMwb height. This is because the height of the center of mass of a system is given by a mathematical formulation: the mass-weighted average of the heights of the segments. Therefore, the purpose of this study is to quantify the effect of postural changes in each segment on the COMwb height difference between takeoff and landing. We hypothesized that lower limb bending and arm movement are the primary factors that affect the overestimation of jump height from flight time. Understanding the sources of error in jump height from flight time would be useful for better instruction to reduce systematic bias and interpersonal variability when using the simple and low-cost method of vertical jump measurement.

2. Materials and Methods

2.1. Participants

Twenty-four males and three females (age: 19 to 42 years; height: 1.77 ± 0.11 m; mass: 75.3 ± 11.9 kg) participated in this experiment. They provided written informed consent to undergo the experimental procedures, which were conducted in accordance with the Declaration of Helsinki and were approved by the ethics committee of the Japan Institute of Sports Sciences (H29-0065).

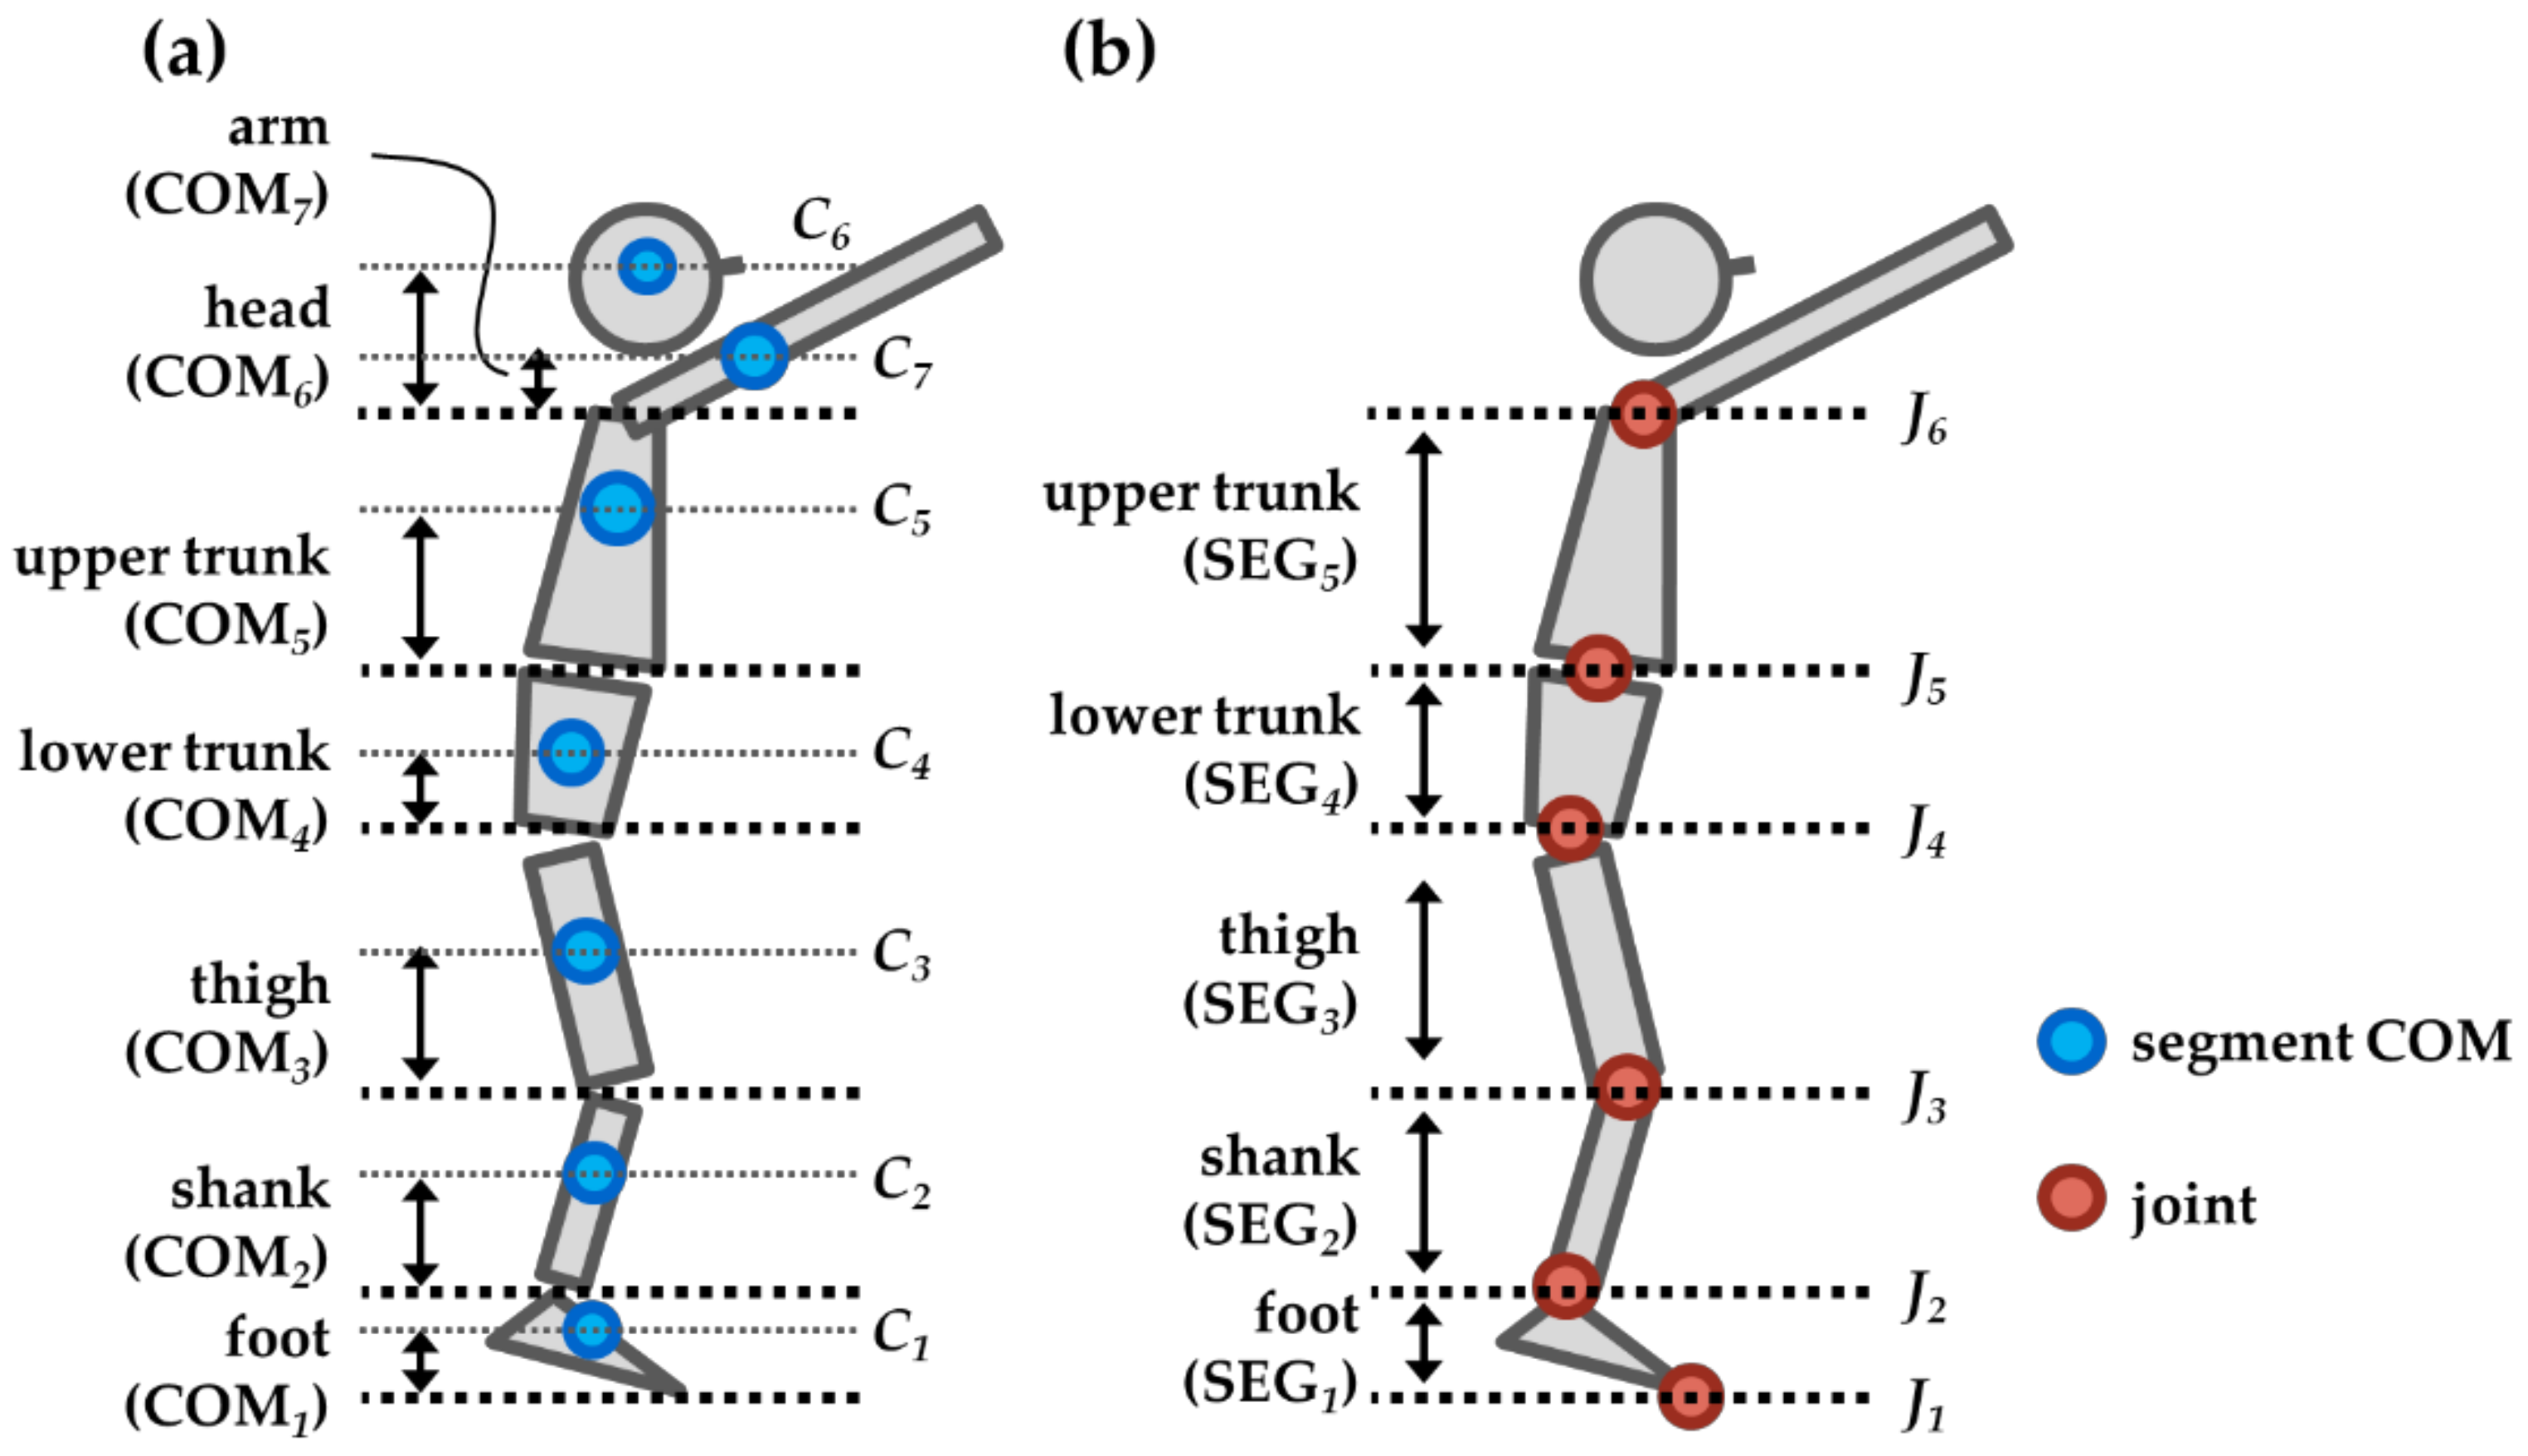
2.2. Instrumentation

Three-dimensional coordinates of the anatomical landmarks were acquired using a 3D optical motion capture system with ten cameras (500 Hz; Vicon, Oxford, UK). Forty-seven reflective markers were placed on each participant’s body—the same as in the previous study [13]. All kinematic data was filtered and interpolated using a Woltring quintic spline [14]. To choose the optimal cut-off frequency of 4.6–7 Hz, a residual analysis was performed [15]. Participants wore their athletic shoes. GRF data was obtained at 1000 Hz using two force platforms (0.9 m × 0.6 m, type 9287B; Kistler, Winterthur, Switzerland).

2.3. Procedures

Participants performed three maximal VJs after warm-up and familiarization. They were instructed to stand upright and motionless for 1 s then began the movement of the jump. They were required not to bend their lower limbs before landing. Two or more experimenters watched each trial, and if they noted that the requirement was not met (i.e., leg tucking), the trial was repeated.

2.4. Data Reduction

Two methods of calculating jump height were used: (1) the vertical velocity of the COMwb at takeoff, and (2) flight time. The vertical GRFs (Fver) were integrated by trapezoid rule integration to estimate the vertical velocity [6]. The vertical velocity at takeoff (Vto) was calculated using the following equation:
V to   =   1 m wb t st t to F ver m wb g dt
where mwb, Fver, g, tst, and tto represent the body mass, vertical GRF, gravitational acceleration (9.806 m/s2 [16]), the time of the start of the initial jumping motion, and the time of its termination at takeoff, respectively. The body mass was calculated by averaging Fver over the 0.3 s quiet stance [7] and dividing by gravitational acceleration. We confirmed that the coefficient of variance (CV) of Fver during the quiet phase in each trial was low (less than 1%). The start of the motion was identified as the first Fver detected to deviate above or below body weight by 1%. To eliminate the influence of inter-participant variance in body weight, takeoff and landing times were defined as the first intersection of Fver with 1% of body weight (7.4 ± 1.2 N, range 5.0 to 9.9 N). The jump height from Vto (Hv) was calculated using the following equation:
H v   =   1 2 g V to 2 .
Hv was used in this study as the criterion for comparison. Jump height from flight time (Ht) was calculated using the following equation:
H t   =   1 8 g t flight 2
where tflight represents the flight time (see Appendix A).
The COMwb position was calculated as the weighted sum of a 15-segment model (i.e., head, upper trunk, lower trunk, upper arms, forearms, hands, thighs, shanks, and feet) based on body-segment parameters [17]. To compare the difference in the whole-body posture between takeoff and landing, we used a seven-segment model of the head, arm, upper trunk, lower trunk, thigh, shank, and foot (Figure 1). The positions of the arm, thigh, shank, and foot segments were the average of the right and left side.
Once an object is projected into the air, the COM of the system must follow a parabolic trajectory, and the trajectory cannot be altered in the air until landing. When the position of a segment moves relative to the COMwb, it affects the other segments’ positions relative to the COMwb to keep the COMwb trajectory constant. As a result, the difference in a segment posture influences the COMwb height at landing. To understand the effects of the postural difference between takeoff and landing on the COMwb height, we quantified the contributions of the changes in the vertical component of each segment on the COMwb height. When one segment changes its posture, it affects (1) the segment COM height and (2) the COM height of all segments above it. We defined the vertical component of the segment COM length (COMk) by the following equations:
COM k   =   h C k / J k   k   =   1   to   6
COM k   =   h C k / J 6   k   =   7
where k represents the segment number (see Figure 1) and h C k / J k represents the height from the lower edge point (joint) of the segment to the segment COM (Figure 1a). COM7 (i.e., the arm segment) was defined relative to the proximal joint (the suprasternal notch). In the same way, we defined the vertical component of the segment length (SEGk) by the following equation:
SEG k   =   h J k + 1 / J k
where h J k + 1 / J k represents the height from the lower edge point (joint) of the segment to the proximal joint (Figure 1b). Then, we calculated the contributions for all seven segments (CONTk) using the following equations:
CONT k   =     m k m wb Δ h C k / J k   + i   =   k + 1 7 m i m wb Δ h J k + 1 / J k   k   =   1   to   5
CONT k   =     m k m wb Δ h C k / J 6                                       k   =   6   and   7
where m and Δ represent the segment mass and the difference in a variable between takeoff and landing, respectively.
When a lower COMwb at landing is observed, the difference makes the flight time longer, meaning that the jump height from flight time is overestimated. To understand the influence of the difference in the COMwb height on jump height overestimation (ΔH), we created a contour color map using the following equations:
Δ H   =   H t H v
Δ H   =   1 8 g 2 H v g + 2 H v + Δ COM wb g 2 H v
where ΔCOMwb represents the difference in the COMwb height. The term in brackets on the right side of Equation (8) is the flight time (see Appendix B). All numerical calculations were performed using MATLAB 2018b (The MathWorks, Inc., Natick, MA, USA).

2.5. Statistical Analysis

The three jumps performed with each device were averaged to provide a representative value for each variable. Means and standard deviations (SDs) were calculated after verifying the normality of distributions using Kolmogorov–Smirnov statistics. Paired-sample t-tests were used to compare the mean differences between methods and between time phases (takeoff and landing). One-sample t-tests were used to examine CONTk against zero. The magnitude of the difference was also assessed using Cohen’s d, where d > 0.8 is a large effect, 0.5 ≤ d ≤ 0.8 is a moderate effect, 0.2 ≤ d ≤ 0.5 is a small effect, and d < 0.2 is a trivial effect [18]. The intra-participant reliability of the variables of the three jumps was examined by the intraclass correlation coefficient, one-way random-effects model (ICC1,1). Acceptable reliability was defined as an ICC > 0.70 [19]. The analysis of the fixed bias with its upper and lower limits of agreement (LOA) between the jump heights for all 81 trials obtained from the two calculations was performed by using a Bland–Altman plot [20]. Heteroscedasticity of error (proportional bias) was defined as a coefficient of determination (r2) > 0.1 [21]. Statistical significance was determined by a probability level of p < 0.05. All calculations were performed using IBM SPSS Statistics version 19 (IBM Co., Chicago, IL, USA).

3. Results

Ht was significantly higher than Hv (0.421 ± 0.081 and 0.396 ± 0.074 m, respectively, p < 0.001, d = 1.046). The mean fixed bias (with 95% LOA) between Ht and Hv was 0.025 m (with range −0.028 to 0.079 m) (Figure 2a). The further analysis of the Bland–Altman plot (Figure 3) revealed very low r2 values (r2 = 0.068), meaning outcomes estimated from Ht had no proportional bias to overestimate or underestimate jump performance. Acceptable intra-participant reliabilities were observed for both Ht and Hv (ICC1,1 = 0.964 and 0.979, respectively).
The COMwb was significantly lower at landing than at takeoff (1.087 ± 0.100 m and 1.140 ± 0.071, respectively, p < 0.001, d = 1.17) (Table 1). Acceptable intra-participant reliabilities were observed for the COMwb at both takeoff and landing (ICC1,1 = 0.991 and 0.967, respectively). Inter-participant variability ranged from −0.182 to 0.008 m (Figure 2b). COMarm, COMshank, and COMfoot showed lower values at landing compared to at takeoff (p < 0.05, large effect size) (Table 1). SEGshank and SEGfoot showed lower values at landing (p < 0.05, large effect size) compared to at takeoff (Table 2). The intra-participant reliabilities of those variables were acceptable (ICC1,1 > 0.7). CONTarm, CONTshank, and CONTfoot showed lower values compared to zero (p < 0.05, moderate to large effect size) (Table 3 and Figure 4).
From Equation (8), the difference in jump height (ΔH) was influenced by ΔCOMwb and jump height (Hv). The contour map (Figure 5) showed that the jump height did not greatly affect the overestimation of jump height.

4. Discussion

The purpose of the present study was to quantify the effect of postural changes between takeoff and landing on jump height overestimation. The jump height from flight time was 0.025 m (6.4%) higher than the jump height calculated from velocity. We confirmed that the current result was reasonable compared to the previous studies, which showed 2–11% overestimation of CMJ height [7,8,9].
The difference in the vertical components of the foot and shank segment lengths were the main contributions to the difference in the COMwb height. Also, the inter-participant differences were large (range −0.092 to 0.018 m for foot and −0.040 to 0.003 m for the shank, see Figure 4). Therefore, the observed lower COMwb height at landing was mostly due to lower ankle dorsiflexion. In some previous studies, experimenters instructed each participant not to flex their knees [22] and hips [23] at landing. In other studies, experimenters instructed participants to land in a similarly extended position at takeoff [24,25]. From these previous studies, it is suggested that ankle dorsiflexion at landing was considered a less serious effect on the jump height, whereas our results indicate that it is the most critical motion. In these studies, each trial was also watched and judged by the experimenter subjectively to ensure that the instructions had been followed. To reduce the difference in the COMwb height, it is recommended that an experimenter instruct participants about the landing technique for the jump tests, primarily focusing on foot and shank segments, such as “landing with toes pointing downwards” [26]. However, such instruction seems to be inappropriate. One reason for this is that the posture at landing is essential because high impacts cause lower joint injuries [27]. Preparatory flexing at the hip, knee, and ankle is an effective strategy to reduce the impact of landing [28]. Moreover, a previous study revealed that extra attention increased the impact of landing [29]. It may be difficult to control the posture at landing in detail without increasing the risk of injury and excess stress.
It is unlikely—but not impossible—that the control of the upper body affects the lower limb bending. Because the total momentum and total angular momentum of a system both remain constant unless acted upon by an external influence, when a segment moves relative to the COMwb, the other segments have to move to compensate. Therefore, there is a possibility that the upper trunk movement affected the shank and foot postures. It is notable that the causal relationships between these postural effects are unknown.
In this study, the difference in the arm COM height relative to the suprasternal notch also affected the difference in the COMwb height between takeoff and landing, though there was a large inter-participant variability (from −0.046 m to 0.008 m). Although no previous study has reported the effect of arm posture on flight time overestimation, some studies reported that an arm swing contributes to increased the COMwb height [11]. The height of the arm COM in 23 out of 27 participants was above the proximal joint at takeoff, and in 14 of the 23 participants, it was below the proximal joint at landing. When VJ is performed, experimenters do not instruct the participants regarding the height of arm movement before takeoff, because they want to evaluate jump performance using arm swing as much as possible, comparing it to jumps without arm swing. On the other hand, it might be possible to control the height of the arm movement at landing through instruction, such as “arms above the shoulder at landing.” No studies justify that the height of the COMwb should be the same at takeoff and landing. At least, the current instruction focusing on lower limb posture cannot prevent the potential “cheating” that can be accomplished by lowering arms as much as possible at landing. Previous studies have shown that arm swing improved jump height [30], but the improvement might be somewhat overestimated when the jump height was calculated from flight time. Therefore, the flight time method cannot be recommended for a vertical jump with arm swing, especially when compared with others, such as at tryouts.
From the contour curve (Figure 5), jump height did not greatly affect the overestimation. For example, if the jump height is 0.20 m and the COMwb height is 0.04 m lower at landing compared to takeoff, then the jump height from flight time is overestimated by 0.0195 m. if the jump height changes to 0.60 m, the overestimation from the same difference in the COMwb height is 0.0198 m. The relationship between the difference in the COMwb height and the overestimation of jump height is in a ratio of almost two to one.
Many studies have considered force platforms as the “gold standard” to evaluate jump height [22,31,32], but this confuses the instrumentation with the calculation method. We can calculate jump height by two methods using force platforms: (1) vertical velocity at takeoff, and (2) the time in the air [8,9]. To clarify the validity and reliability of the simple methodology to calculate jump height from flight time, force platforms are considered the gold standard to calculate flight time because the method contained is valid under certain conditions, as described above. The jump height from vertical velocity at takeoff is the true gold standard for jump height measurement.
Calculating jump height from flight time is still useful for coaches who want to measure changes in an individual resulting from their training program because of its low cost, simplicity, and ease of implementation. Recently, many commercial devices are have been developed to measure jump height from flight time, such as an iPhone app [33] and inertial measurement unit [24]. Other methods have also been in development, such as linear position transducers, but these showed overestimation by 7.0 cm compared to the jump height from flight time [34]. In this study, we confirmed that the flight time method has high intra-participant reliability and no proportional bias, though there is a fixed bias. Researchers and coaches are usually interested in comparing jump height before and after training. If the same device is used for both pre- and post-tests, it is useful.

5. Conclusions

In conclusion, we found that jump height from flight time is overestimated compared to the jump height from takeoff velocity as a result of the lower limb and arm postures at landing. Understanding the sources of error in jump height from flight time can be used to develop better instruction to reduce the systematic error.

Author Contributions

Conceptualization, D.Y., M.M. and Y.I.; methodology, D.Y., M.M. and Y.I.; software, D.Y., M.M. and Y.I.; validation, D.Y., M.M. and Y.I.; formal analysis, D.Y., M.M. and Y.I.; investigation, D.Y., M.M. and Y.I.; writing—original draft preparation, D.Y., M.M. and Y.I.; visualization, D.Y.; funding acquisition, D.Y., M.M. and Y.I. All authors have read and agreed to the published version of the manuscript.

Funding

This work was supported by the research grant of the Japanese Society of Biomechanics.

Acknowledgments

The authors would like to thank the executive committee members of “KEIHIROBA”, a conference of the Japanese Society of Biomechanics, for their helpful comments.

Conflicts of Interest

The authors declare no conflict of interest.

Appendix A. Calculation of Jump Height from Flight Time

It is noted that the assumption for this calculation is that the height of the COMwb is the same at takeoff and landing of the jump (Hv is equal to Ht). Once an object is projected into the air, the COMwb must follow a parabolic trajectory, and the trajectory cannot be altered in the air until landing because only the gravitational acceleration is applied to it. Therefore, the vertical velocity of the COMwb is calculated as
V t =   V 0 g t
where V(t) represents the vertical velocity, V0 represents the initial velocity, and t represents the time of travel. As V(t) becomes zero at the highest point during flight phase the time from the takeoff to the highest point (ttop) is expressed as
V to g t up   =   0
V to   =   g t up
tup should be half of the flight time, with the peak of the jump happening at exactly the midpoint of the flight time, expressed as follows:
V to   =   1 2 g t flight
Substituting Equation (A3) for Equation (2), we obtain Equation (3) as follows:
H t   =   H v   =   1 2 g 1 2 g t flight 2
H t   =   1 8 g t flight 2

Appendix B. Calculation of the Flight Time from the Vertical Displacement of the COMwb

The vertical displacements of the COMwb travelling from takeoff to the highest point (vertical velocity becomes zero) and from the highest point (vertical velocity is zero) to landing are both expressed as
h t   =   1 2 g t 2
where h(t) represents the vertical displacement. During the time from the takeoff to the highest point (tup), h(t) is equal to Hv, and Equation (A6) gives
H v   =   1 2 g t up 2
t up   =   2 H v g
On the other hand, during the time from the highest point to landing (tdown), h(t) is the sum of Hv and ΔCOMwb, and Equation (A6) gives
H v + Δ COM wb   =   1 2 g t down 2
t down   =   2 H v + Δ COM wb g
The flight time (tflight) is the sum of tup and tdown. Therefore, tflight is expressed as
t flight   =   2 H v g   + 2 H v + Δ COM wb g

References

  1. Ache-Dias, J.; Dal Pupo, J.; Gheller, R.G.; Kulkamp, W.; Moro, A.R. Power Output Prediction From Jump Height and Body Mass Does Not Appropriately Categorize or Rank Athletes. J. Strength Cond. Res. 2016, 30, 818–824. [Google Scholar] [CrossRef]
  2. Young, W.B.; Bilby, G.E. The Effect of Voluntary Effort to Influence Speed of Contraction on Strength, Muscular Power, and Hypertrophy Development. J. Strength Cond. Res. 1993, 7, 172–178. [Google Scholar] [CrossRef]
  3. Claudino, J.G.; Cronin, J.; Mezencio, B.; McMaster, D.T.; McGuigan, M.; Tricoli, V.; Amadio, A.C.; Serrao, J.C. The countermovement jump to monitor neuromuscular status: A meta-analysis. J. Sci. Med. Sport 2016, 20, 397–402. [Google Scholar] [CrossRef]
  4. Sierer, S.P.; Battaglini, C.L.; Mihalik, J.P.; Shields, E.W.; Tomasini, N.T. The National Football League Combine: Performance differences between drafted and nondrafted players entering the 2004 and 2005 drafts. J. Strength Cond. Res. 2008, 22, 6–12. [Google Scholar] [CrossRef]
  5. Teramoto, M.; Cross, C.L.; Rieger, R.H.; Maak, T.G.; Willick, S.E. Predictive Validity of National Basketball Association Draft Combine on Future Performance. J. Strength Cond. Res. 2017. [Google Scholar] [CrossRef]
  6. Lake, J.; Mundy, P.; Comfort, P.; McMahon, J.J.; Suchomel, T.J.; Carden, P. Concurrent Validity of a Portable Force Plate Using Vertical Jump Force-Time Characteristics. J. Appl. Biomech. 2018, 34, 410–413. [Google Scholar] [CrossRef]
  7. Kibele, A. Possibilities and Limitations in the Biomechanical Analysis of Countermovement Jumps: A Methodological Study. J. Appl. Biomech. 1998, 14, 105. [Google Scholar] [CrossRef]
  8. Moir, G.L. Three Different Methods of Calculating Vertical Jump Height from Force Platform Data in Men and Women. Meas. Phys. Educ. Exerc. Sci. 2008, 12, 207–218. [Google Scholar] [CrossRef]
  9. Aragón, L.F. Evaluation of four vertical jump tests: Methodology, reliability, validity, and accuracy. Meas. Phys. Educ. Exerc. Sci. 2000, 4, 215–228. [Google Scholar] [CrossRef]
  10. Dowling, J.J.; Vamos, L. Identification of kinetic and temporal factors related to vertical jump performance. J. Appl. Biomech. 1993, 9, 95–110. [Google Scholar] [CrossRef] [Green Version]
  11. Lees, A.; Vanrenterghem, J.; De Clercq, D. Understanding how an arm swing enhances performance in the vertical jump. J. Biomech. 2004, 37, 1929–1940. [Google Scholar] [CrossRef]
  12. Hara, M.; Shibayama, A.; Takeshita, D.; Fukashiro, S. The effect of arm swing on lower extremities in vertical jumping. J. Biomech. 2006, 39, 2503–2511. [Google Scholar] [CrossRef]
  13. Suzuki, Y.; Ae, M.; Takenaka, S.; Fujii, N. Comparison of support leg kinetics between side-step and cross-step cutting techniques. Sport. Biomech. 2014, 13, 144–153. [Google Scholar] [CrossRef]
  14. Woltring, H.J. A Fortran package for generalized, cross-validatory spline smoothing and differentiation. Adv. Eng. Softw. 1986, 8, 104–113. [Google Scholar] [CrossRef]
  15. Winter, D.A. Biomechanics and Motor Control of Human Movement, 4th ed.; John Wiley & Sons, Inc: Hoboken, NJ, USA, 2009. [Google Scholar]
  16. Street, G.; McMillan, S.; Board, W.; Rasmussen, M.; Heneghan, J.M. Sources of error in determining countermovement jump height with the impulse method. J. Appl. Biomech. 2001, 17, 43–54. [Google Scholar] [CrossRef]
  17. Ae, M.; Tang, H.; Yokoi, T. Estimation of inertia properties of the body segments in Japanese athletes. Biomechanisms 1992, 11, 23–33. [Google Scholar] [CrossRef] [Green Version]
  18. Cohen, J. Statistical Power Analysis for the Behavioral Sciences; Routledge: Abington, UK, 2013. [Google Scholar]
  19. Baumgartner, T.A.; Chung, H. Confidence Limits for Intraclass Reliability Coefficients. Meas. Phys. Educ. Exerc. Sci. 2001, 5, 179–188. [Google Scholar] [CrossRef]
  20. Bland, J.M.; Altman, D. Statistical methods for assessing agreement between two methods of clinical measurement. Lancet 1986, 327, 307–310. [Google Scholar] [CrossRef]
  21. García-Ramos, A.; Pérez-Castilla, A.; Martín, F. Reliability and concurrent validity of the Velowin optoelectronic system to measure movement velocity during the free-weight back squat. Int. J. Sports Sci. Coach. 2018, 13, 737–742. [Google Scholar] [CrossRef]
  22. Rogers, S.A.; Hassmén, P.; Hunter, A.; Alcock, A.; Crewe, S.T.; Strauts, J.A.; Gilleard, W.L.; Weissensteiner, J.R. The Validity and Reliability of the MyJump2 Application to Assess Vertical Jumps in Trained Junior Athletes. Meas. Phys. Educ. Exerc. Sci. 2018, 1–9. [Google Scholar] [CrossRef]
  23. Rodriguez-Rosell, D.; Mora-Custodio, R.; Franco-Marquez, F.; Yanez-Garcia, J.M.; Gonzalez-Badillo, J.J. Traditional vs. Sport-Specific Vertical Jump Tests: Reliability, Validity, and Relationship With the Legs Strength and Sprint Performance in Adult and Teen Soccer and Basketball Players. J. Strength Cond. Res. 2017, 31, 196–206. [Google Scholar] [CrossRef]
  24. Casartelli, N.; Müller, R.; Maffiuletti, N.A. Validity and reliability of the Myotest accelerometric system for the assessment of vertical jump height. J. Strength Cond. Res. 2010, 24, 3186–3193. [Google Scholar] [CrossRef]
  25. Glatthorn, J.F.; Gouge, S.; Nussbaumer, S.; Stauffacher, S.; Impellizzeri, F.M.; Maffiuletti, N.A. Validity and reliability of Optojump photoelectric cells for estimating vertical jump height. J. Strength Cond. Res. 2011, 25, 556–560. [Google Scholar] [CrossRef]
  26. Kenny, I.C.; Cairealláin, A.Ó.; Comyns, T.M. Validation of an electronic jump mat to assess stretch-shortening cycle function. J. Strength Cond. Res. 2012, 26, 1601–1608. [Google Scholar] [CrossRef] [Green Version]
  27. McKay, G.D.; Goldie, P.A.; Payne, W.R.; Oakes, B.W. Ankle injuries in basketball: Injury rate and risk factors. Br. J. Sports Med. 2001, 35, 103–108. [Google Scholar] [CrossRef]
  28. Iida, Y.; Kanehisa, H.; Inaba, Y.; Nakazawa, K. Activity modulations of trunk and lower limb muscles during impact-absorbing landing. J. Electromyogr. Kinesiol. 2011, 21, 602–609. [Google Scholar] [CrossRef]
  29. Shinya, M.; Wada, O.; Yamada, M.; Ichihashi, N.; Oda, S. The effect of choice reaction task on impact of single-leg landing. Gait Posture 2011, 34, 55–59. [Google Scholar] [CrossRef]
  30. Young, W.B.; MacDonald, C.; Flowers, M.A. Validity of double-and single-leg vertical jumps as tests of leg extensor muscle function. J. Strength Cond. Res. 2001, 15, 6–11. [Google Scholar]
  31. Lesinski, M.; Muehlbauer, T.; Granacher, U. Concurrent validity of the Gyko inertial sensor system for the assessment of vertical jump height in female sub-elite youth soccer players. BMC Sports Sci. Med. Rehabil. 2016, 8, 35. [Google Scholar] [CrossRef] [Green Version]
  32. McMahon, J.J.; Jones, P.A.; Comfort, P. A Correction Equation for Jump Height Measured Using the Just Jump System. Int. J. Sports Physiol. Perform. 2016, 11, 555–557. [Google Scholar] [CrossRef] [Green Version]
  33. Balsalobre-Fernandez, C.; Glaister, M.; Lockey, R.A. The validity and reliability of an iPhone app for measuring vertical jump performance. J. Sports Sci. 2015, 33, 1574–1579. [Google Scholar] [CrossRef]
  34. O’Donnell, S.; Tavares, F.; McMaster, D.; Chambers, S.; Driller, M. The validity and reliability of the GymAware linear position transducer for measuring counter-movement jump performance in female athletes. Meas. Phys. Educ. Exerc. Sci. 2018, 22, 101–107. [Google Scholar] [CrossRef] [Green Version]
Figure 1. The definition of (a) vertical component of the segment center of mass length (COMk) and (b) vertical component of the segment length (SEGk).
Applsci 10 00776 g001
Figure 2. (a) The difference in jump height (ΔH) and (b) the difference in whole-body COM height (ΔCOMwb) for each participant. Each bar represents a participant. They are arranged in descending (a) and ascending (b) order.
Applsci 10 00776 g002
Figure 3. Bland–Altman plot for the jump height from the vertical velocity at takeoff (Hv) and the jump height from flight time (Ht). The central line represents the absolute average difference between the methods, and the upper and the lower lines represent ± 1.96 standard deviation (SD).
Applsci 10 00776 g003
Figure 4. The contribution of the difference in the vertical component of the segment length (SEGk) to the difference in the whole-body center of mass (COMwb) height (contributions for all seven segments, CONTk). The sum of the differences in all of the segments is the difference in the COMwb height. Each bar shows the result for a participant; the values are arranged in ascending order.
Applsci 10 00776 g004
Figure 5. An illustration of the influence of the difference in the COMwb height (ΔCOMwb) and jump height (Hv) on jump height overestimation (ΔH) (Equation (8)). The top-left triangular area in white shows there are no real roots because ΔCOMwb cannot be greater than Hv. The red circles represent each experimental data point.
Applsci 10 00776 g005
Table 1. The vertical component of the segment center of mass (COMk) at takeoff and landing.
SegmentTakeoff (m)Landing (m)Difference (m)Effect Size (d)
Whole body1.140 ± 0.0711.087 ± 0.100 *–0.0531.17
Head0.143 ± 0.0240.143 ± 0.0280.0000.02
Arm0.109 ± 0.133–0.067 ± 0.187 *–0.1751.33
Upper Trunk0.183 ± 0.0210.184 ± 0.0190.0010.13
Lower Trunk0.086 ± 0.0100.086 ± 0.0100.0000.00
Thigh0.225 ± 0.0130.227 ± 0.0150.0020.25
Shank0.237 ± 0.0180.229 ± 0.021 *–0.0091.64
Foot0.129 ± 0.0090.108 ± 0.031 *–0.0210.97
* p < 0.05.
Table 2. The vertical component of the segment length (SEGk) at takeoff and landing.
SegmentTakeoff (m)Landing (m)Difference (m)Effect Size (d)
Upper Trunk0.321 ± 0.0350.323 ± 0.0320.0020.13
Lower Trunk0.220 ± 0.0260.220 ± 0.0280.0000.00
Thigh0.427 ± 0.0260.430 ± 0.0030.0030.25
Shank0.400 ± 0.0320.385 ± 0.035 *–0.0151.64
Foot0.199 ± 0.0110.173 ± 0.037 *–0.0250.99
* p < 0.05.
Table 3. The contribution of the difference in the vertical component of the segment length (SEGk) to the difference in the whole-body center of mass (COMwb) height (CONTk).
SegmentContribution (m)Effect Size (d)
Head0.000 ± 0.0010.023
Arm–0.017 ± 0.013 *1.259
Upper Trunk–0.001 ± 0.0050.119
Lower Trunk0.000 ± 0.0060.009
Thigh0.003 ± 0.0110.244
Shank–0.014 ± 0.009 *1.446
Foot−0.025 ± 0.032 *0.781
* p < 0.05.

