Review

Time-Gated Single-Photon Detection in Time-Domain Diffuse Optics: A Review

1
Politecnico di Milano, Dipartimento di Fisica, Piazza Leonardo da Vinci, 32, 20133 Milan, Italy
2
Consiglio Nazionale delle Ricerche, Istituto di Fotonica e Nanotecnologie, Piazza Leonardo da Vinci, 32, 20133 Milan, Italy
*
Author to whom correspondence should be addressed.
Appl. Sci. 2020, 10(3), 1101; https://doi.org/10.3390/app10031101
Submission received: 31 December 2019 / Revised: 27 January 2020 / Accepted: 5 February 2020 / Published: 6 February 2020

Abstract

:
This work reviews physical concepts, technologies and applications of time-domain diffuse optics based on time-gated single-photon detection. This particular photon detection strategy is of the utmost importance in the diffuse optics field as it unleashes the full power of the time-domain approach by maximizing performances in terms of contrast produced by a localized perturbation inside the scattering medium, signal-to-noise ratio, measurement time and dynamic range, penetration depth and spatial resolution. The review covers 15 years of theoretical studies, technological progresses, proof of concepts and design of laboratory systems based on time-gated single-photon detection with also few hints on other fields where the time-gated detection strategy produced and will produce further impact.

1. Introduction

Diffuse optics (DO) is a branch of optics which aims to study the optical properties of a diffusive medium using light in the near-infrared spectral window, that is the wavelength range where the water absorption is negligible [1]. When light interacts with matter, it is typically attenuated because of the selective absorption of the various chromophores of the material investigated at different wavelengths. In diffusive media, the ballistic photons are also deviated in different directions (scattered) because of the structural heterogeneities of the medium. The retrieval of the optical properties, i.e., absorption (μa) and reduced scattering (μs) coefficients, of a diffusive medium is the main purpose of diffuse optical spectroscopy (DOS) [2]. Examples of diffusive media are fruits, vegetables [3], wood [4], plastic or resins [5], pharmaceutical tablets [6], fog and clouds [7], and biological tissues such as brain, muscles, breast, bones, thyroid and others [8,9,10,11,12]. The main advantages of DO techniques are: (i) non-invasiveness and non-destructiveness: in-vivo measurements on human and industrial applications are possible without damaging the tissue/sample; (ii) functional measurements: possibility to follow the temporal variations of the optical properties with a real-time feedback; (iii) possibility to derive other parameters from the optical properties, such as—for biological media—the main tissue components (e.g., lipid, collagen and water) or metabolic and oxidative state indicators (e.g., oxygen saturations, hemoglobin and flux). Due to its intrinsic non-invasive nature, DO has a strong potential in several applications both in laboratories and professional environments (industries and clinics). Thanks to the key advantages described above, the most widespread application of DO is on biological tissues, where the aim is the non-invasive and real time assessment of the concentration of the main chromophores—e.g., oxy-(O2Hb) and deoxy-hemoglobin (HHB)—and the microvascular blood flow. These parameters can be assessed using near infrared spectroscopy (NIRS) and diffuse correlation spectroscopy (DCS), respectively [13,14].
The time-domain (TD) approach, based on the use of picosecond pulsed lasers and time-resolved single-photon detection, offers the possibility to discriminate photons on the basis of their arrival time and to retrieve absolute values of the optical properties [15]. The temporal profile of laser pulses travelling through a diffusive medium is strongly shaped by the medium optical properties. In particular, the distribution of time-of flight (DTOF) of photons re-emitted at a given distance from the injection point (source-detector distance) is temporally broadened because of scattering and is attenuated with an exponentially decreasing tail due to absorption. In Figure 1 of Ref. [16], the reader can find a graphical representation of the changes in the DTOF for different values of the optical properties for a homogeneous medium. Starting from the DTOF at a given wavelength, it is possible to retrieve the medium optical properties by fitting the experimental data (e.g., using the classical Levenberg–Marquardt approach) with a proper theoretical model, obtained by the solution of the diffusion equation (DE). From the optical properties, and applying the Lambert Beer Law together with the chromophores extinction coefficients, it is possible to retrieve the hemodynamic parameters of interest or the concentration of key tissue constituents. It goes beyond the scope of this review to describe the different solutions of the DE for different geometries as well as other more advanced solutions of the transport equation or to discuss the specific procedures to extract the hemodynamic parameters out of the optical properties. For further details and schematics on TD measurements the reader can see Refs. [15,16]. Examples of TD-DO in the field of biomedical optics are (but not limited to) the monitoring of brain hemodynamics [12] or of muscular oxidative metabolism [17]. Other applications of TD-DO ranges from the non-invasive deep spectroscopy of biological tissues like the breast [18] or the bone [19] to the basic characterization of key absorbers such as lipid [20] or collagen [21]. TD-DO was also successfully applied in the non-destructive assessment of qualities of fruit [22] and wood [23], and in the optical characterization of pharmaceutical products [24] and semiconductor powders [25] or even on small animals [26].
The TD technique improves DO capabilities in terms of depth resolution and sensitivity, as will be widely explained in Section 2. For example, it permits to enhance the signal arising from the brain cortex, avoiding confounding physiological effects due to the extra-cerebral compartment [16]. This feature is carried out thanks to the possibility to evaluate the DTOF in particular temporal instants. The method of selecting the photons on the basis of their arrival time is called “time-gating” and is typically accomplished as a post-processing analysis on the acquired signal. The DTOF is sliced into multiple temporal windows associated with the photon arrival time [27]. Then, different approaches to remove the early (superficial) photons from the whole signal [28,29,30] can be applied. More recently, a “hardware” gating was proposed to select photons on the basis of their arrival time right at the detection stage itself [31]. For this purpose, detectors operated in a time-gated (TG) modality instead of a free-running regime are needed. Apart from traditional photomultiplier tubes (PMTs) [32] and silicon photomultipliers (SiPMs) [33], which at present cannot be time-gated, the other detectors typically employed in TD-DO, such as intensified charge coupled device (ICCD) [28,34], microchannel plates (MCP) [35], streak cameras [36] and single-photon avalanche diodes (SPADs), [37] can be used also in the TG modality [31]. In almost all these detectors, performances are limited by early photons impinging onto the detector, thus increasing dramatically the background noise or even damaging the detector. This problem can be overcome by employing SPADs [31], which will be widely discussed in Section 3. Furthermore, these detectors allow for new frontiers of measurements such as the small source-detector distance approach [38], which opens the way to better performances and novel applications. In addition, microelectronics detectors like SPADs and SiPMs permit to reduce the dimensions of the detection stage, in particular combined with new generation of time-to-digital converters (TDCs) [39] rather than the more traditional TD acquisition electronics based on time-correlated single photon counting (TCSPC) [40] boards, enabling the development of portable TD-DO systems. The scalability, modularity and the possibility of components miniaturization, with a resulting drop of the production costs, together with the other advantages already listed, are interesting characteristics of TG-DO. In the future, these will allow for the realization of wearable devices for continuous monitoring of the patient at home, in the settings of the personalized medicine of a rehabilitation program, for example. This technology could be applied for athletes training programs, to monitor and adjust their exercise on the basis of the muscular performances [41,42,43]. Furthermore, this opens new applications in emerging fields such as Internet of Things (IoT) [43,44], brain-computer interfaces (BCI) [45], artificial intelligences [46], augmented/virtual reality environments, medical settings and completely different fields such as neuro-economics and neuro-marketing or customer satisfaction evaluation [47,48].
In this review we focus, in particular, on the latest advancements and perspectives of the use of TG detection for TD-DO, applied mainly in, but not limited to, biophotonics. In Section 2, the main physical principles underlining photon diffusion in a diffusive medium and the time-gating approach will be discussed. In Section 3, the hardware for accomplishing the TG modality will be presented, focusing mainly on SPADs. In Section 4, few hints on the main applications and future perspectives of TG methods for diffuse optics in biophotonics and other fields will be addressed.

2. Physical Concepts

Photon propagation in a highly diffusive medium (e.g., biological tissue) is primarily determined by two parameters, µs and µa [49]. The former alters the paths of photons in the medium generating a collection of possible photon trajectories (random walks). The latter reduces progressively the photon survival rate with a typical exponentially decreasing probability given by the expression exp(−µa·s) for homogeneous media, where s is the travelled pathlength (Lambert Beer law) [50,51]. A typical DO measurement consists of injecting light at a given point on the surface of the diffusive medium (e.g., on the skin) and collecting the re-emitted photons at a different location on the surface. Depending on the measurement geometry, both transmittance (injection and collection on the opposite side of a diffusive slab, as for the compressed breast) or reflectance (injection and collection on the same side) arrangements are feasible [8,52].
The signal conveyed by detected photons carries information from the regions visited by photons along their random path, and more specifically on the optical properties of the explored tissues (µa and µs). More specifically, µa is related to the tissue composition and functional status (e.g., water, lipid, collagen and blood content, oxygenation). Conversely, µs is related to discontinuities of the dielectric constant at the cellular and sub-cellular level, which can then be ascribed to the microstructure and to the presence of organelles (e.g., mitochondria).
The adoption of a TD scheme for detection of diffused photons is possibly the most natural way to study diffusive media since it directly discriminates photons on the basis of their arrival time, and therefore of the length of the path travelled into the medium. In particular, the TD approach offers a series of advantages as summarized in the following:
  • For a homogeneous medium, µa and µs affect differently the DTOF, and therefore can be more easily disentangled [52,53,54];
  • A change in amplitude in the detected signal does not affect the shape of the DTOF [55,56]. Therefore, a TD measurement relying only on the DTOF profile will be largely independent of the optical contact, the moving artefacts, the skin pigmentation, and also the laser power fluctuations;
  • Space is encoded by time, meaning that the higher the photon travelling time, the farther the average distance from the injection point explored by photons. As a direct consequence, for reflectance measurements longer lived (late) photons propagate deeper into the medium [27,57,58,59].
In the context of TD-DO, time-gating is particularly interesting for the possibility to extract few meaningful photons out of the multitude of collected photons. With reference to Figure 1, a proper time-gating permits for instance to select late photons arising from deeper structures. A standard continuous wave (CW) measurement would mix late photons with the overwhelming majority of other more “superficial” photons, thus diluting the weak information content.
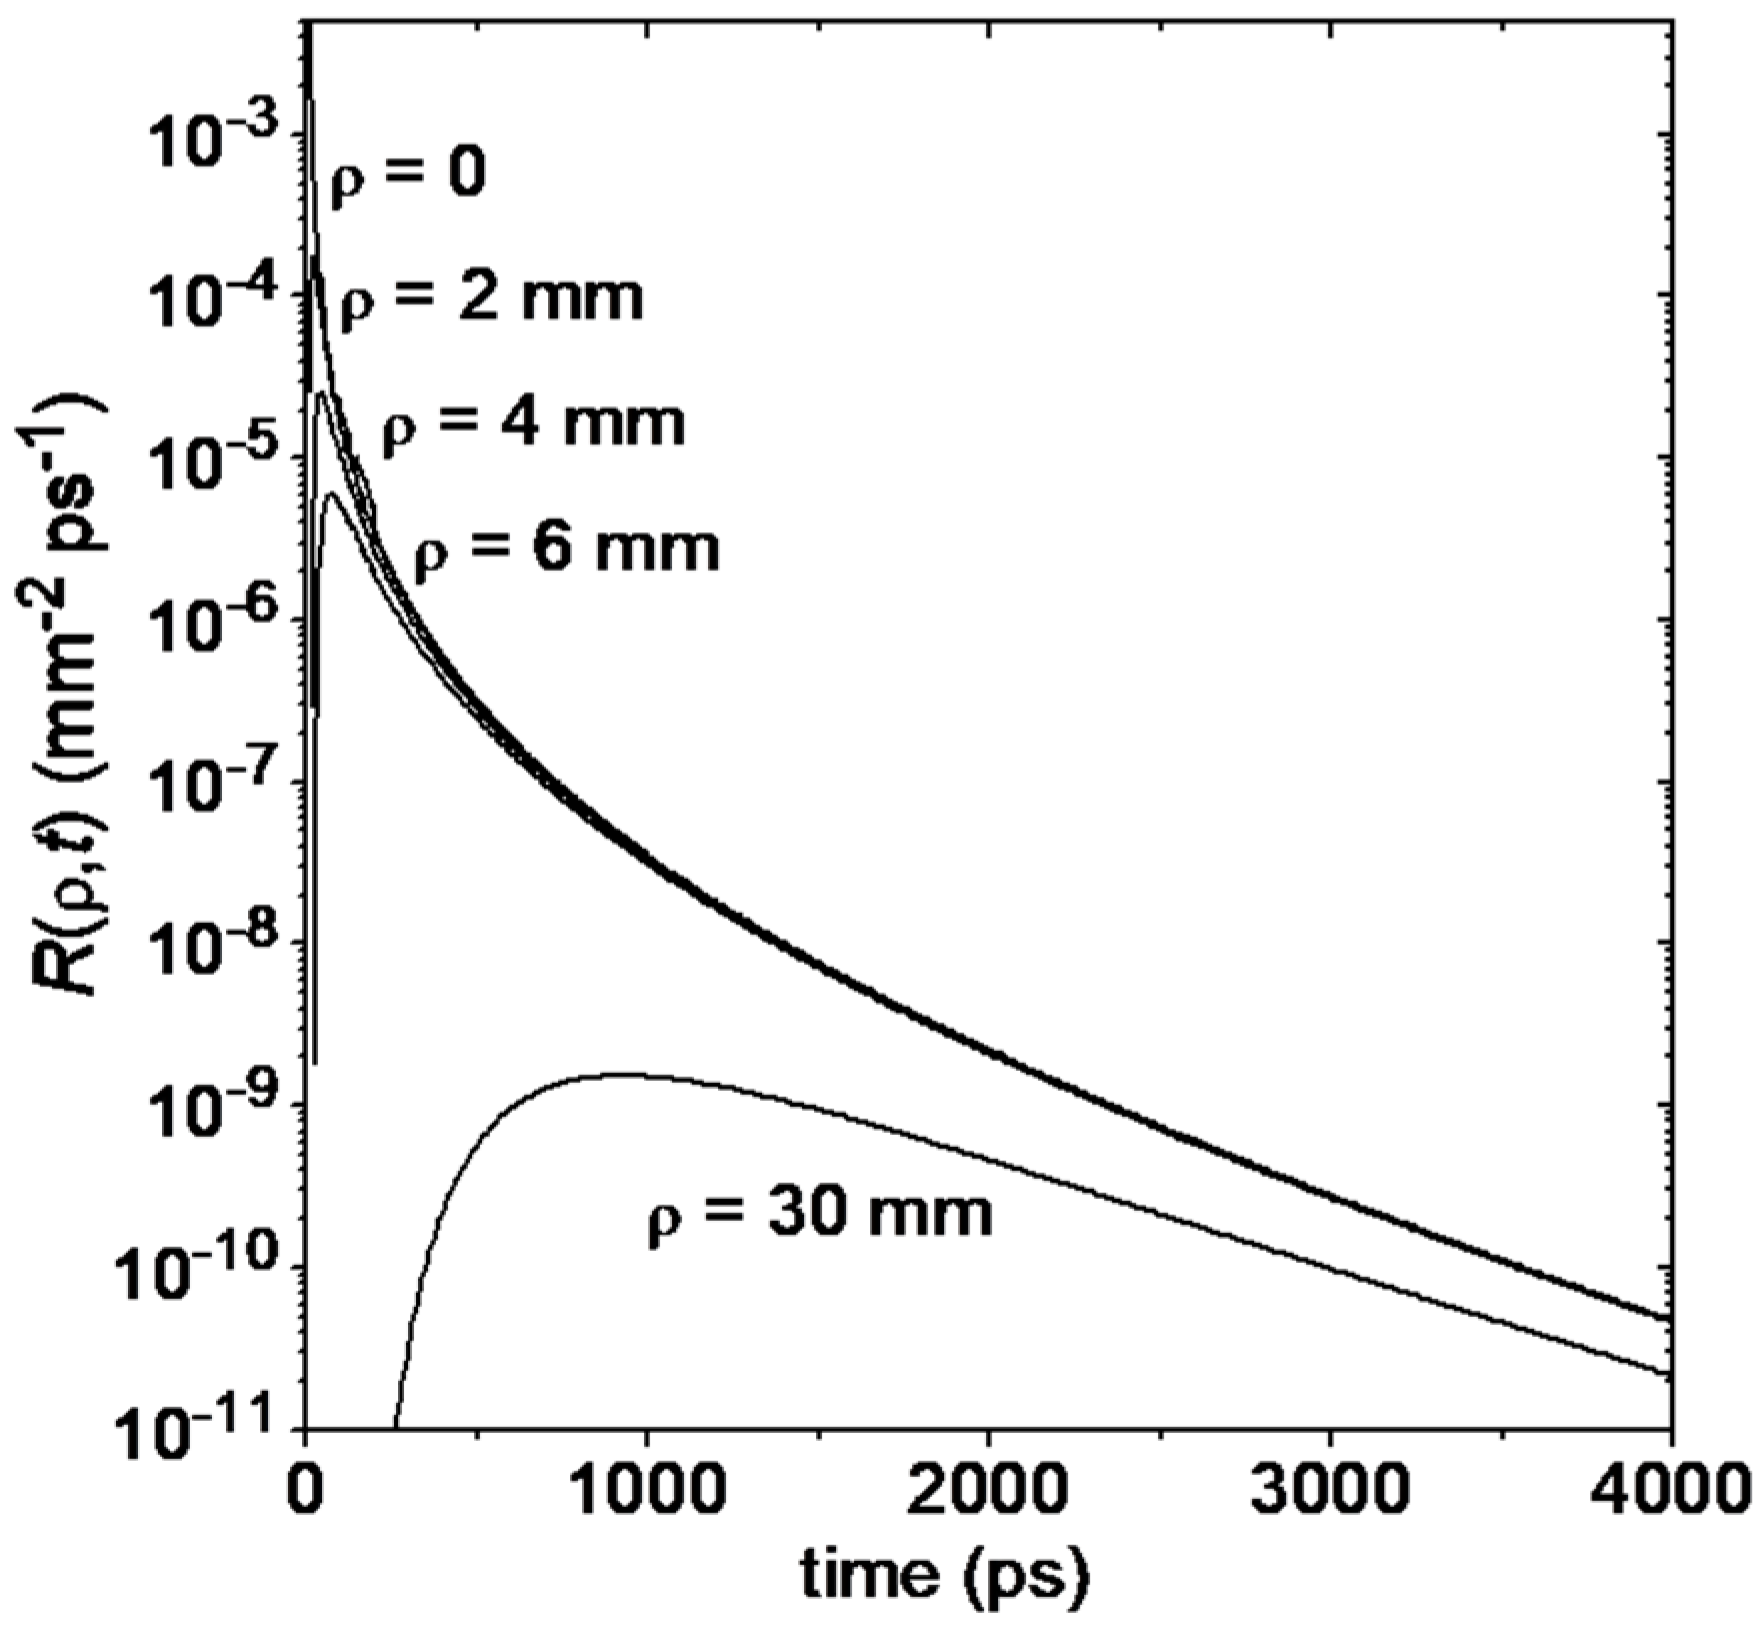
This feature opens the possibility to perform time-resolved reflectance measurements at null source-detector distances (ρ) [38]. In general, upon increasing ρ, the diffusely reflected signal decreases at all photon arrival times, as shown in Figure 2. Thus, at least in principle, acquisition at ρ = 0 is always granting the maximum harvesting efficiency. The key problem is that the increase in signal at ρ = 0 is extreme for early photons so that for a classical detector the contribution of late photons would be overwhelming. The adoption of a hardware time-gating mechanism can solve this issue by gating-off early photons and enabling the detector only for late photons.
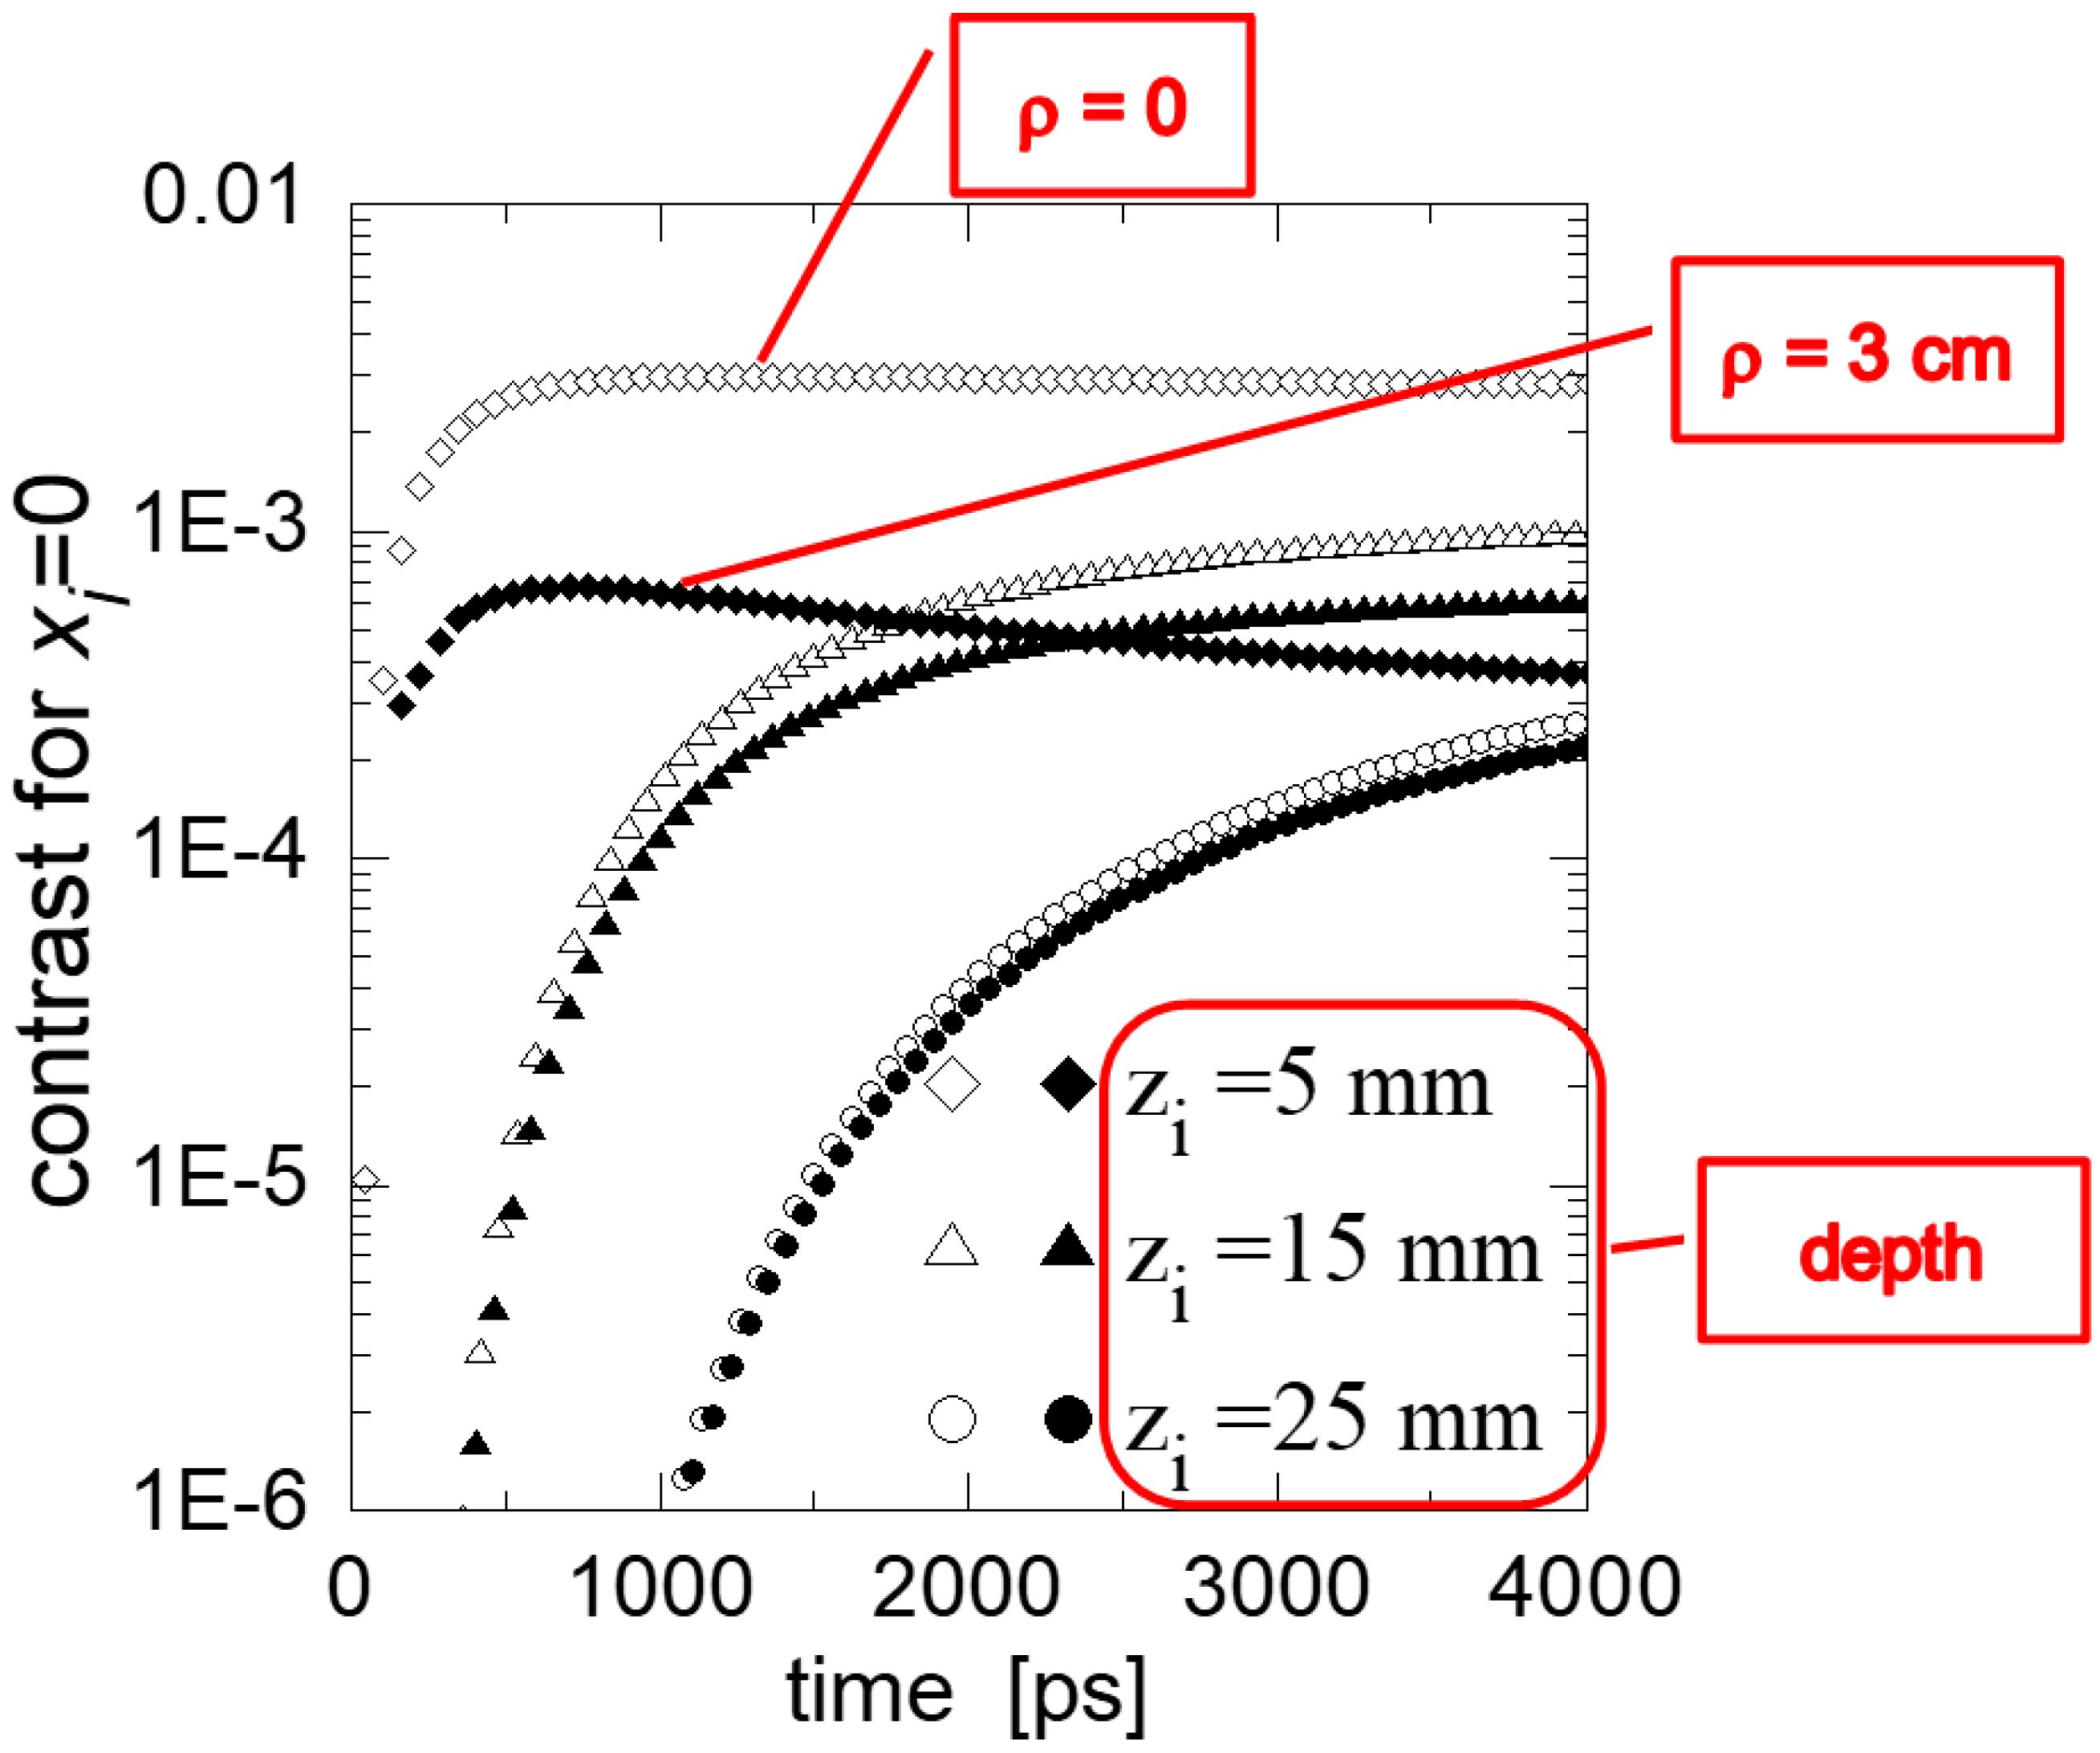
The feasibility of TD diffuse reflectance at ρ = 0 enabled by hardware time-gating offers additional benefits. The contrast (C) produced by localized optical inhomogeneities—i.e., the sensitivity to optical changes, in formula: C = N 0 N N 0 where N 0 and N are the number of photons for the unperturbed and perturbed case, respectively [60]—is enhanced due to the strongest confinement of photon trajectories, as shown in Figure 3. The depth sensitivity is dependent only on the photon arrival time and is independent of the source-detector distance ρ. Conversely, for ρ = 0 the spatial spread of photon trajectories is minimized, leading to a better confinement of the explored region.
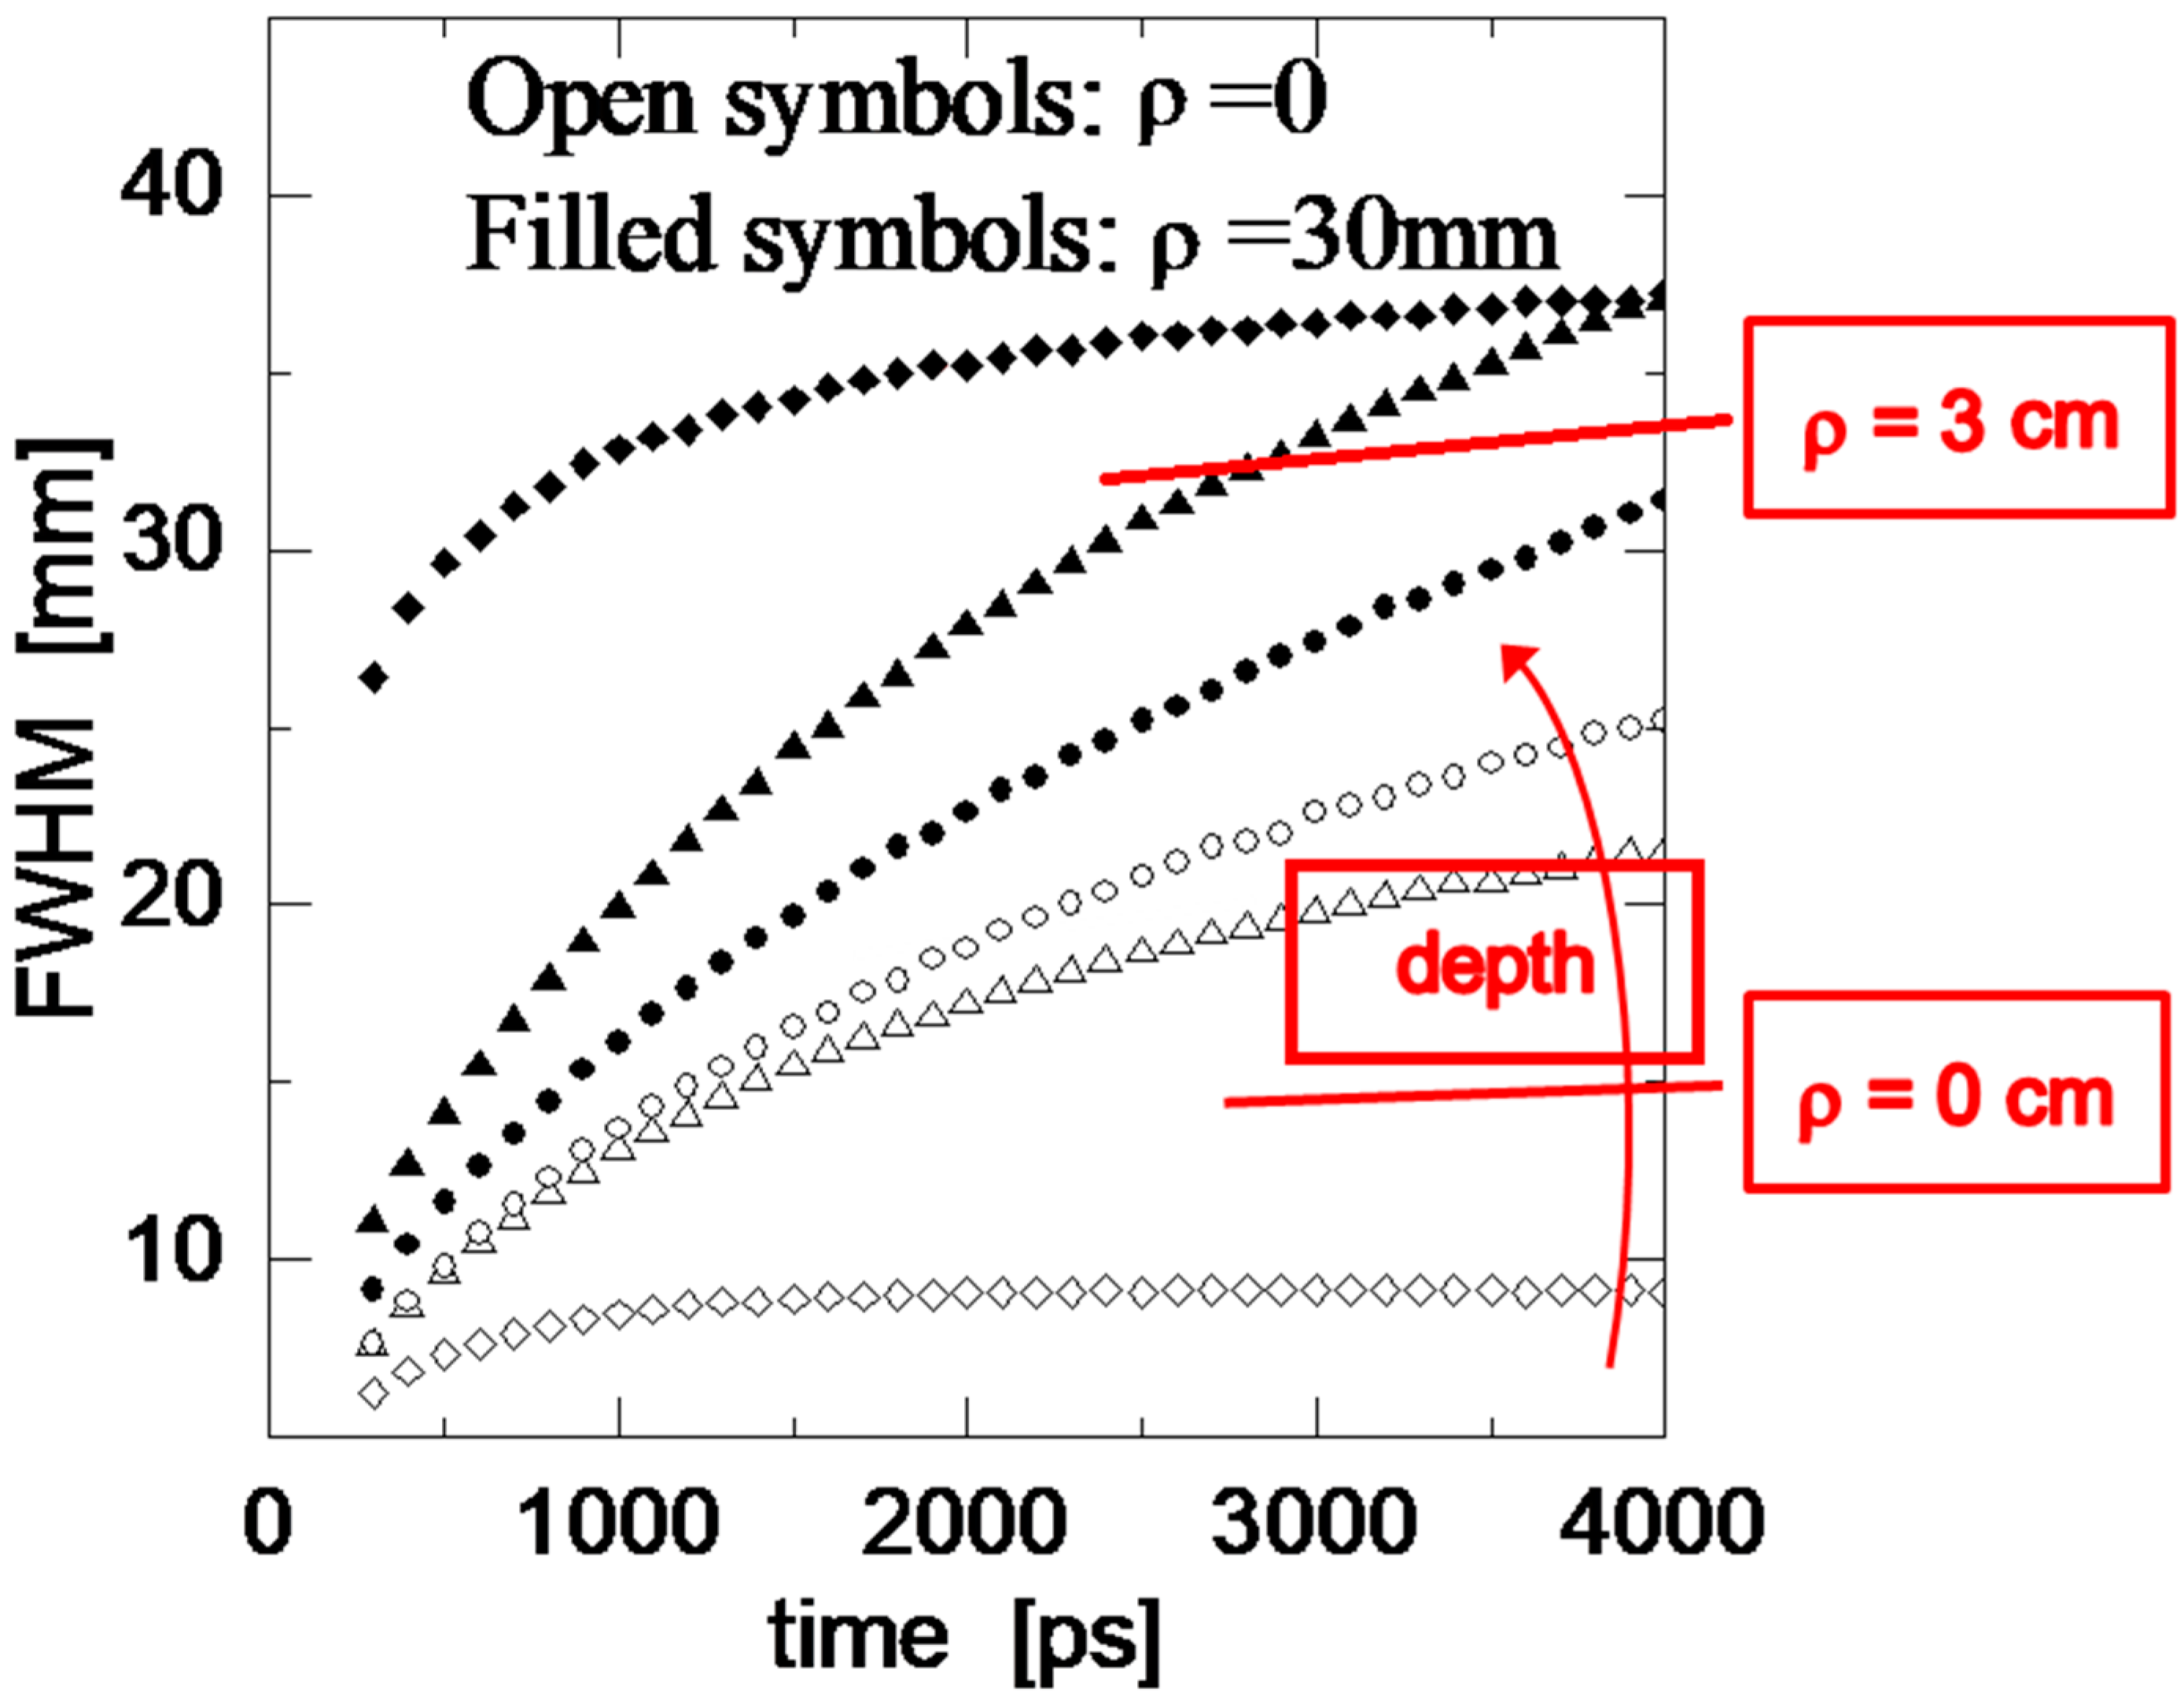
The practical consequence of higher spatial confinement is the increase in contrast, as shown in Figure 4 and the improvement in spatial resolution, displayed in Figure 5. The spatial resolution is defined as the full width at half maximum—FWHM—of the spatial point spread function—PSF—obtained measuring the diffuse reflectance curve with the perturbation at the given depth z and using the source-detector distance ρ (in formula: F W H M [ P S F ( z , ρ ) ] ) [60]. The former consequence leads to a better capability of ρ = 0 measurements to detect deep optical perturbations as in the case of functional brain imaging, discussed in Section 4. The latter would permit to improve spatial resolution when imaging through diffusive media. Still, the gain in resolution is significant for shallower regions (z < 10 mm), while at higher depths the improvement in spatial resolution is less significant.
It is necessary to warn that all these statements hold true for an ideal case of a perfect time-resolved system with a delta-like instrument response function (IRF) coupled with a sharp hardware time-gating. Practical systems exhibit non-ideal behaviors which distort the theoretical picture and diminishes the advantages of the ρ = 0 approach, as will be duly discussed in Section 3. In practical cases, a sage compromise taking into account the real system performances must be sought. On the other hand, the ideal case helps in addressing directions for technological advancements.
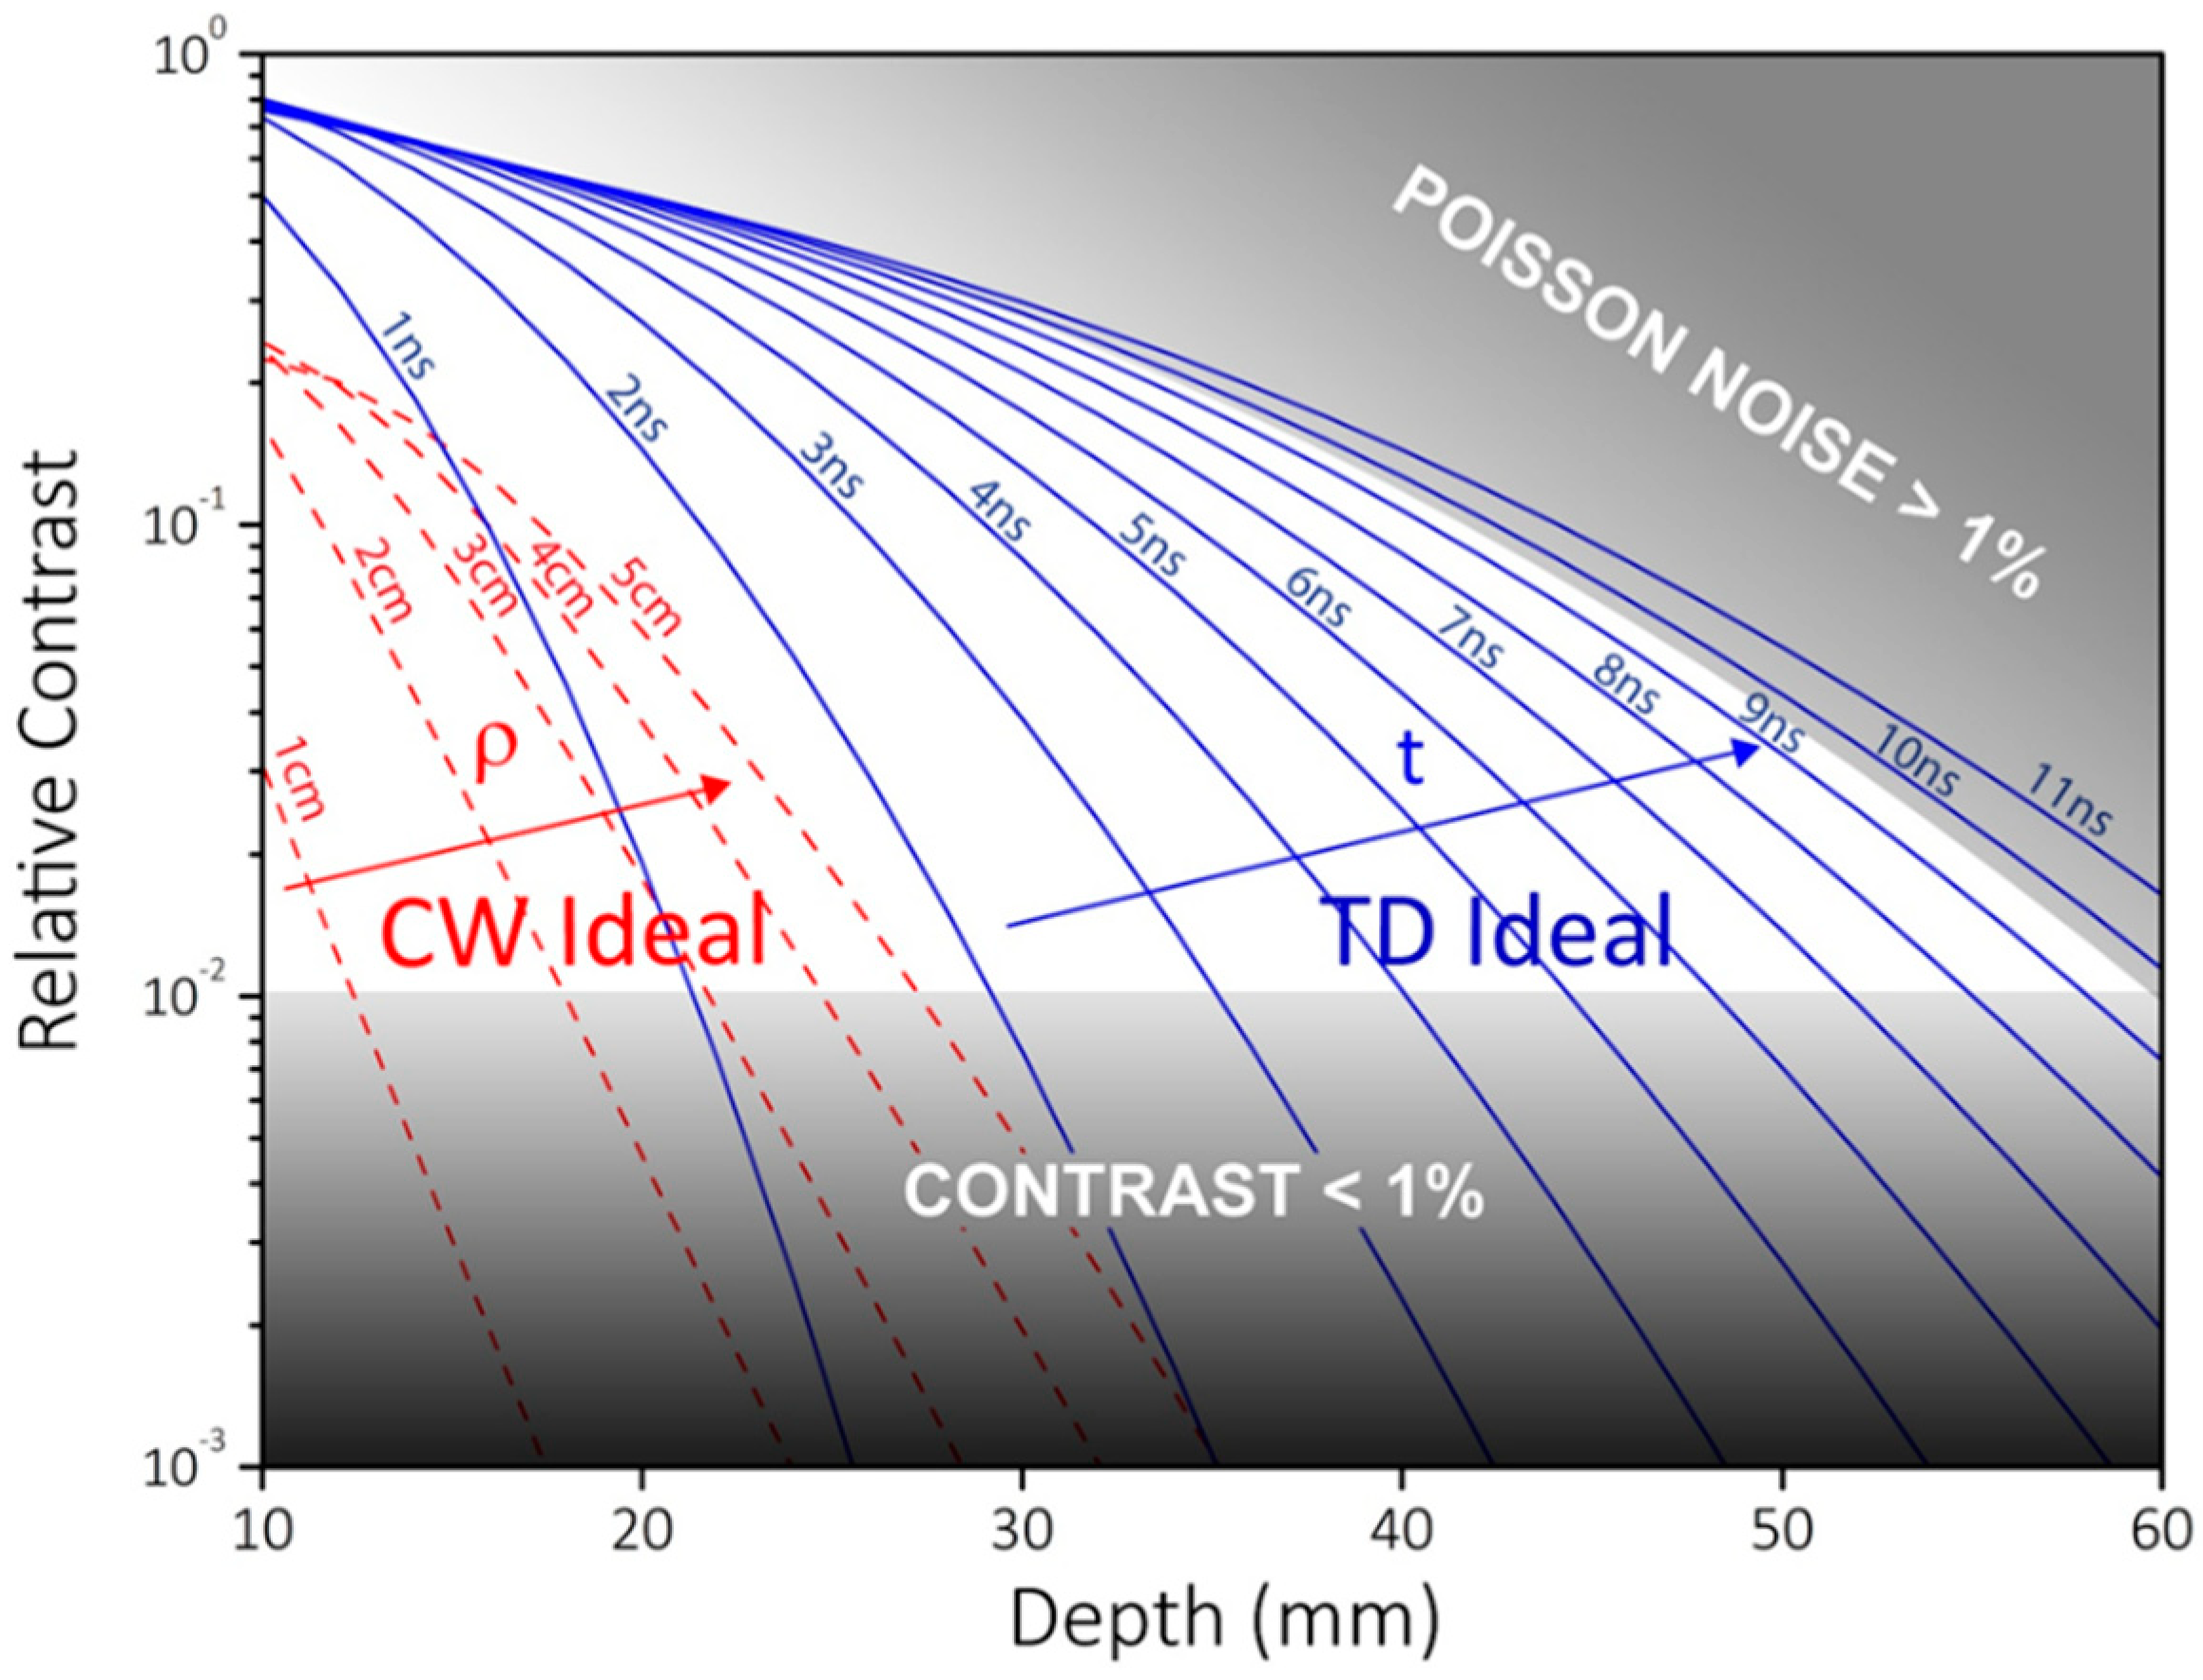
To draw the future research directions, it is useful to identify the ultimate limits of diffuse optics in terms of maximum depth and sensitivity [61]. Figure 6 displays the results of simulations on the relative contrast produced by a 1 cm3 localized optical perturbation with twice absorption as the background buried at increasing depths in a tissue-like diffusive medium. As a criterion of detectability, we require to have a change in the detected signal higher than 1% of baseline (contrast > 1%) and a fluctuation in the signal due to the intrinsic shot noise lower than 1% (Poisson < 1%). This corresponds to the white region in the figure. Both CW and TD approaches are considered, where—in the latter case—the temporal response of the detector is assumed to be an ideal delta function and a perfect sharp hardware gating is applied to progressively suppress photons arriving at earlier time. In both cases, a 1 cm2 ideal detector with 100% quantum efficiency is considered together with a uniform illumination over 1 cm2 area with 4 mW/mm2 intensity (chosen in [61] representative of typical maximum permitted skin exposure). An ideal CW acquisition can increase depth sensitivity enlarging the source-detector separation. Yet, the contrast is diluted because of the larger explored area and even for ρ = 5 cm a perturbation deeper than 3 cm is hardly detectable. For an ideal TD approach, a limiting depth of 6 cm can be reached for the same scenario exploiting gated photons at 10 ns. The clue here is the capability of extracting long lived photons. These are enough to grant suitable contrast with acceptable signal level, but the vast majority of re-emitted photons arrive at earlier times and must be suppressed using a suitable gating mechanism.

3. Technology

3.1. Advantages of Single-Photon Avalanche Diodes (SPADs) for TG Measurements

The efficient fast time-gating of single-photon detectors is not straightforward and represented a challenge in the field of single-photon counting for diffuse optical measurements. Photocathode-based detectors [62], the historical choice for TD-DO, have been gated in two different ways: (i) by applying fast voltage transitions to the electron beam amplification stage (i.e., dynodes in photomultiplier tubes or micro-channels in microchannel plates or in intensified charge-coupled devices) to selectively enable and suppress the multiplication [28,34,63,64,65]; (ii) by seeping photoelectrons generated by undesired photo-detections out of the phosphor screen in streak cameras [36]. However, these techniques offer limited performance for TD-DO at small/null ρ as the photocathode is not shielded by the burst of early-photons, thus increasing its dark count rate due to extreme light exposition, also risking a persistent damage. For this reason, single-photon avalanche diodes (SPADs) [37] were considered. SPADs are solid-state detectors exploiting high electric field in a reversely biased p-n junction (above its breakdown voltage) to multiply photo-generated electron-hole pairs through impact ionization, thus resulting in macroscopic avalanche current pulses (milliampere range) in response to single-photons [37]. As compared to typical photocathode-based detectors, SPADs have much smaller active areas (with typical diameters ≤ 200 µm), but can be time-gated by swiftly changing their bias voltage above or below breakdown, turning them respectively ON and OFF [31]. In this way, a burst of early photons can just generate electron-hole pairs in the device, without persistent alteration of the SPAD performance.

3.2. Electronics Issues for Time-Gated (TG) Operations

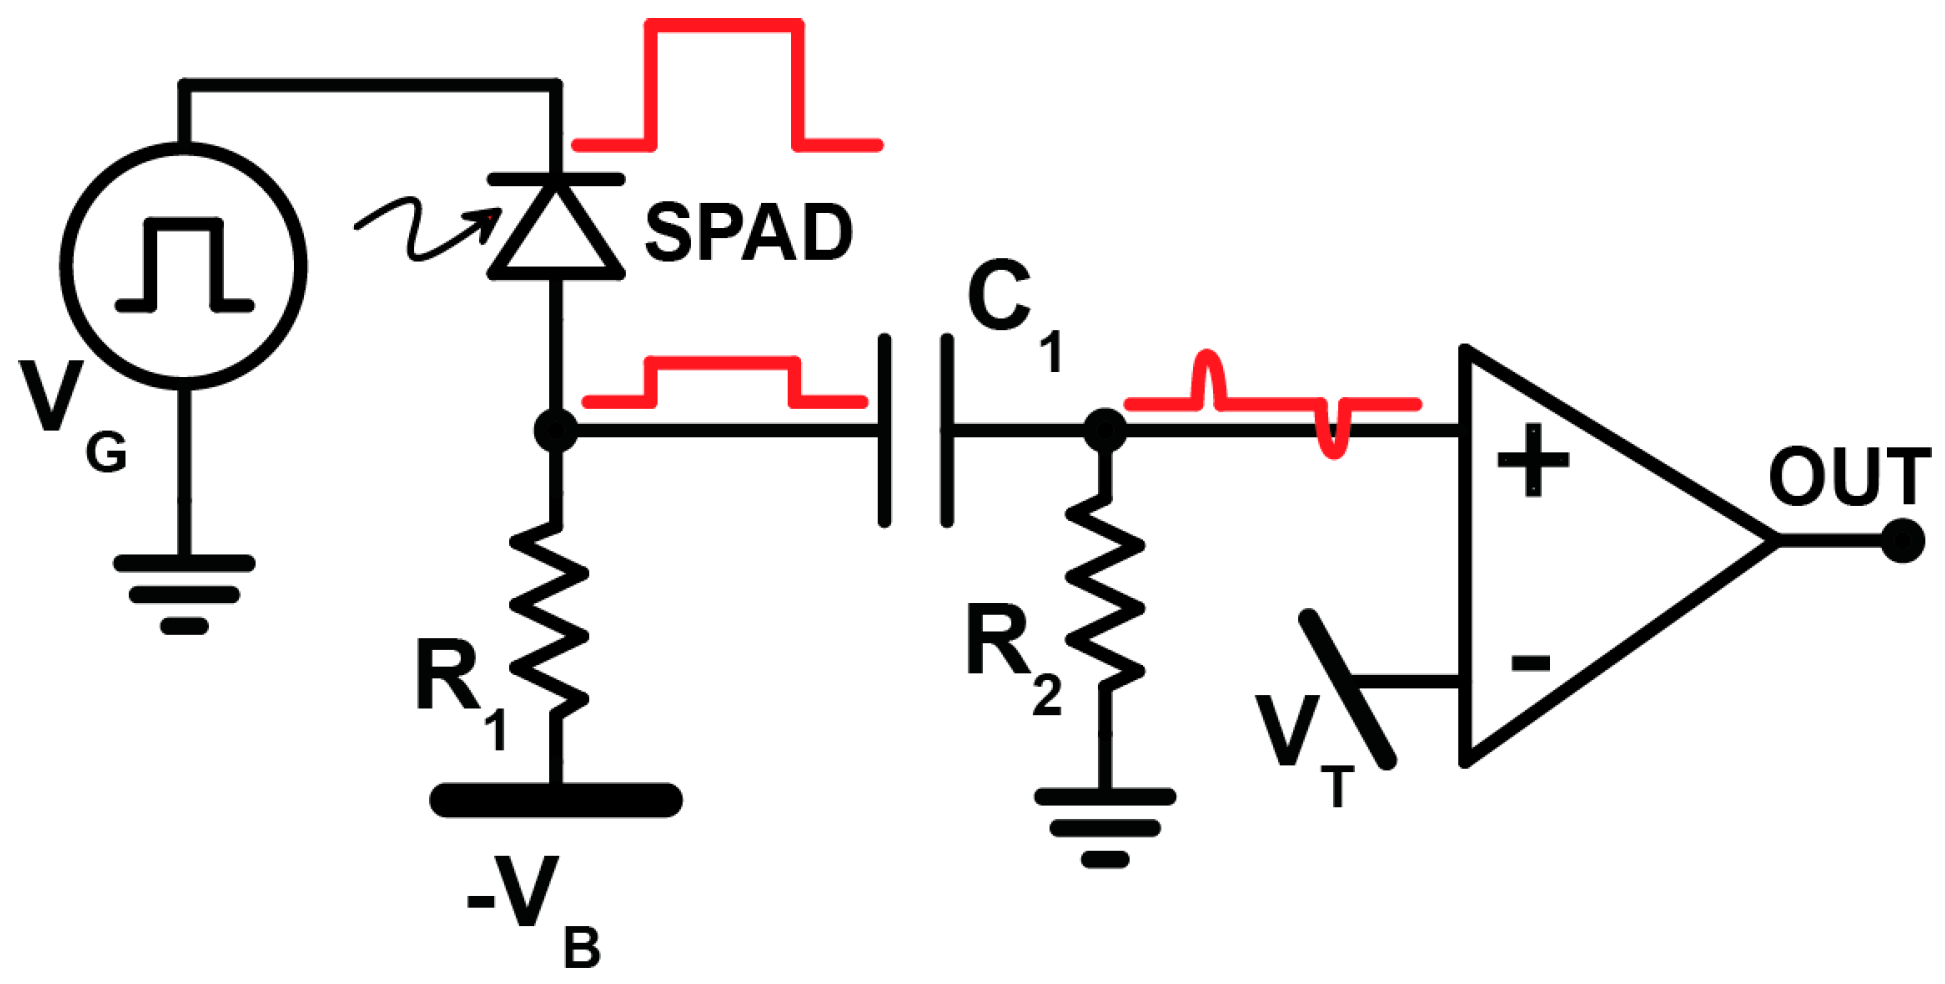
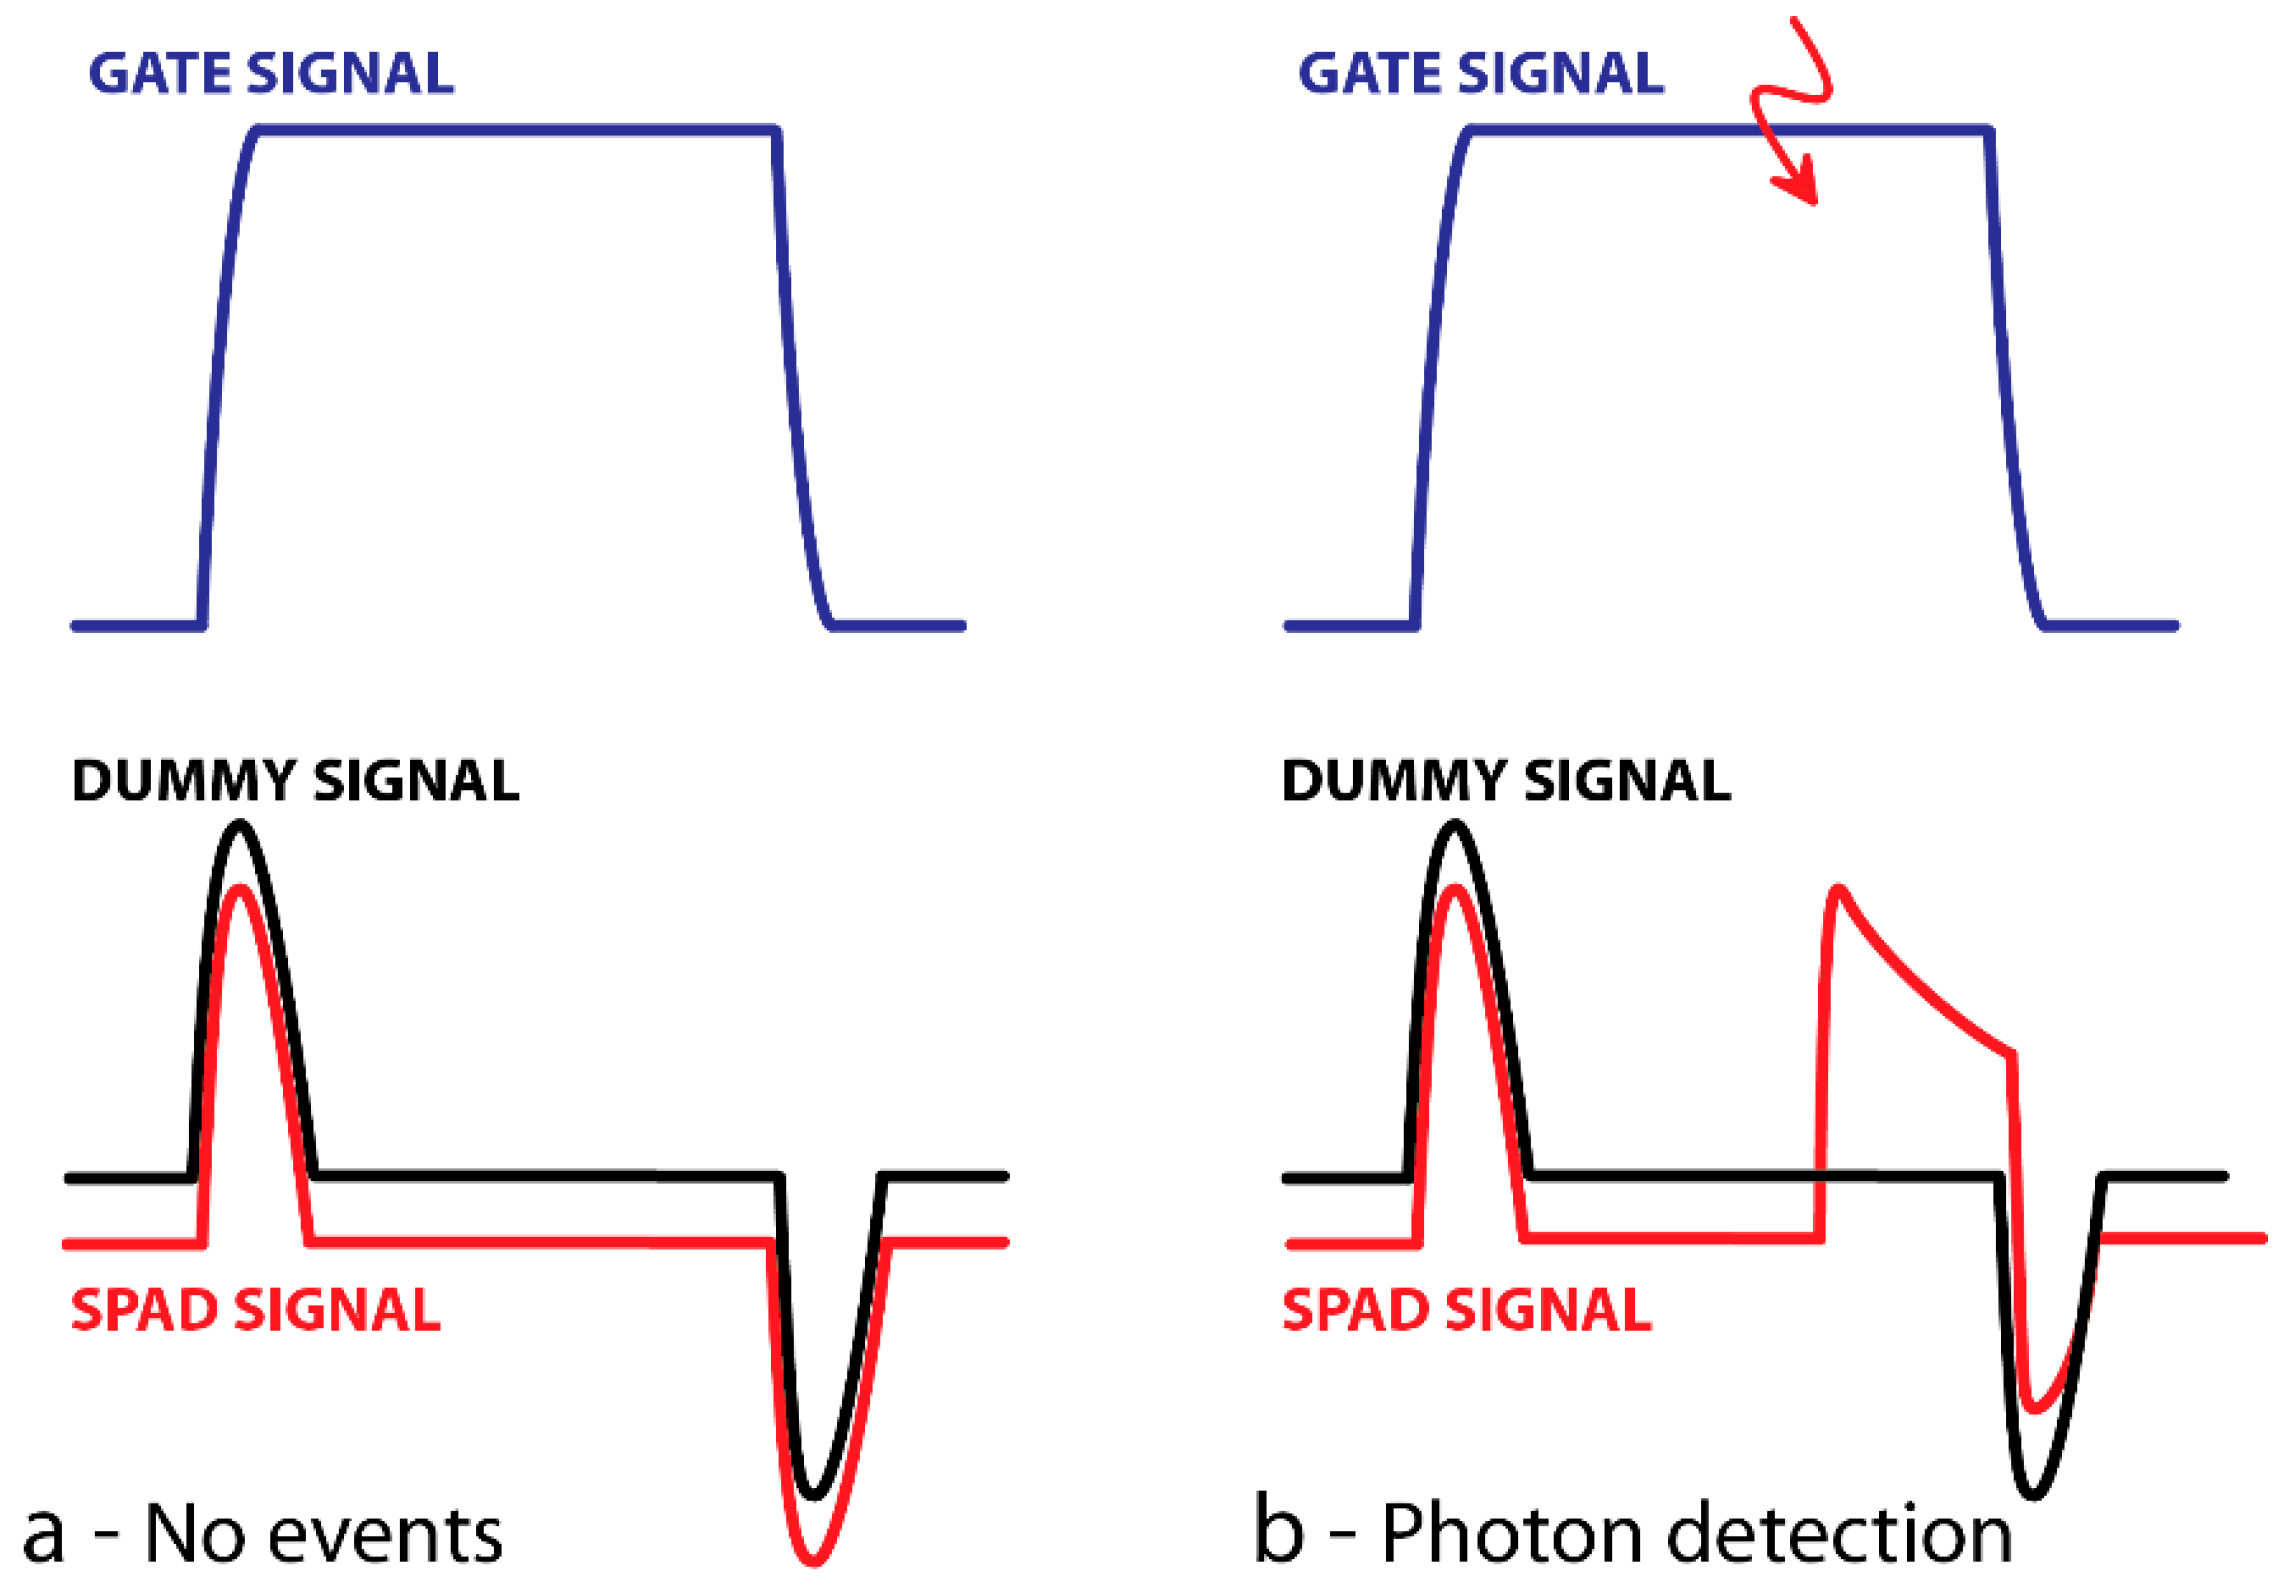
Unfortunately, fast voltage transitions applied to the detector give rise to spurious feed-through voltage spikes at the avalanche detection electronics [66]. When no current flows within the junction, the SPAD can be modeled as a small capacitance due to the depleted region of the p-n junction [67]. This situation is represented in Figure 7 where the SPAD is surrounded by a typical basic front-end circuit. As shown, the anode voltage changes during the gate transition due to the presence of a voltage divider between the SPAD capacitance and the resulting impedance of the anode-side connections. Then, the high-pass filter of the readout circuit generates the spikes. In slow gate conditions (i.e., transitions in the nanoseconds range) these spikes force the use of high avalanche detection thresholds to avoid to detect the spike instead of the avalanche [31]. This has the effect of increase the time jitter in time-resolved applications as best timing performance of SPADs are always obtained when sensing the very first part of the avalanche current leading edge [68]. In fast gate conditions (transitions in a range of tens or hundreds of picoseconds) the voltage spikes amplitude can exceed the amplitude of avalanche pulses, thus preventing the photon detection [31] (see Figure 8). The former scenario (slow gate) is typical when gated detection is used to grant the effectiveness of the detector when light is expected. Indeed, in free-running operation a dark count can mask following photons due to the detector dead time (i.e., time needed to quench the avalanche and to restore the operative conditions after each photon detection). Time-gating is therefore important in the case of high dark count rate devices like InGaAs or germanium SPADs [68,69]. The latter case (fast gate) is of interest in TD-DO as early photons can anticipate late photons of just a fraction of nanosecond [38].

3.3. The Path towards First TG-DO Measurements

A first solution for avoiding detrimental effects from voltage spikes, proposed in 2000, was to exploit reflection at the end of transmission lines (coaxial cables) to obtain their cancellation when two consecutive gate pulses are applied [70,71,72]. The need for fine tuning the cable length and the presence of two consecutive gates makes this technique quite complex. In 2002 it was proposed to delete the spikes by combining balanced outputs of two SPADs using a 180° hybrid junction to generate the differential signal between the two detectors [73]. The technique is efficient in quantum key distribution as two detectors are useful, but can be too expensive when a single detection channel is needed. In 2004 it was proposed to exploit differences in the falling edge spikes to indirectly detect avalanche [74]. Indeed, when and avalanche occurs, the SPAD cannot be electrically modeled as a single capacitance [31], thus changing its response to fast gate transitions and, consequently, the shape of the spurious spikes (see Figure 8 where the second spike, related to the gate OFF transition, is different between the left—no avalanche—and right—avalanche triggered—cases). This technique is not suitable in time-resolved application as it can only detect whenever the avalanche was present during the gating time, not resolving the photon arrival time. In 2006 it was proposed a technique based on capacitive compensation and magic-T circuit (i.e., combination of transformers) to reject common mode signals before amplifying the avalanche pulse [75]. The technique demonstrated optimum performance in associating photon detections to different time gates, but photon-timing performance within the gate was not demonstrated. In 2007, two different techniques were proposed. The former was based on the integration of the avalanche current pulse into a capacitance, that was sampled after the end of the gate pulse to detect whenever an avalanche occurred during the gate pulse [76]. As in the case of Ref. [74], the technique is not suitable for photon-timing applications. The latter is conceptually similar to that proposed in Refs. [70,71,72] as voltage spikes are compensated by differentially reading the detector signal during a given gate window and a delayed replica of the same signal during a previous gate [77]. Therefore, its limitations are similar to those of the previous solution. Finally, in 2008, a novel time-gating technique developed at Politecnico di Milano allowed to demonstrate the feasibility of TD-DO measurements at quasi-null ρ both on phantoms and in-vivo [78]. In this case, as in 2006 the gate signal is applied to both the SPAD and a capacitance with suitable radiofrequency performance, providing a “dummy” signal only containing voltage spikes [31]. The two signals are then connected to the two differential inputs of a fast comparator so that the avalanche detection threshold contains the two voltage spikes allowing to avoid their detection (see Figure 8).

3.4. General Performances of First TG Prototypes

With the solution proposed in [31], it was possible to gate ON and OFF SPADs at a rate of about 50 MHz obtaining single-photon timing resolution better than 100 ps FWHM. Thanks to a proper design of the SPAD front-end circuit (following radiofrequency rules to minimize stray inductance and capacitances), it was possible to obtain a flat response from the detector during the gating window, free from large voltage ringing [31]. In this way, the information taken with gate windows opened at different delays with respect to the laser synchronism can be combined, obtaining reconstructed optical waveforms spanning 7–8 orders of magnitude in 1 or few seconds of acquisition time (see Figure 9). It is worth noting that this dynamic range can be obtained also with a standard free-running (i.e., not time-gated) SPAD detector, by increasing the acquisition time to obtain a sufficient information about latest photons. However, it was calculated that this could require integration times in the order of few years, that is surely not reasonable for any application [79].

3.5. Other Solutions for SPADs Time-Gating

Other techniques for SPADs time-gating were proposed in the following years; some examples can be found in Refs. [80,81,82,83,84,85,86,87,88,89,90,91,92]. However, it is worth noting that: (i) none of them (apart the one proposed in Ref. [89]) has been applied to TD-DO; (ii) many of them (including the one proposed in Ref. [89]) do not really prevent the triggering of the detector by early photons, but just mask the signal at the level of processing electronics and (iii) some of them are not suitable for time-resolved applications.

3.6. State of the Art

The possibility to increase the measurement dynamic range by fast SPAD gating opened the way to previously unthinkable applications not only in the biomedical field but also in other fields, which will be discussed in the next section. In parallel, the technique was further developed by increasing the gating rate, the speed of the gating transitions [93] and the resulting timing resolution [94], thus allowing the fabrication of commercial TG SPAD modules [95]. On the other hand, at the research level, the effort was devoted to miniaturization of prototypes as the first gated SPADs, as well as the above-mentioned commercial modules, were devices of a volume of few dm3 and a weight > 1 kg, preventing from envisaging both wearable diffuse optical systems and dense arrangements of detection points to further increase the signal or for a step towards tomographic systems. In 2015, a first compact probe embedding a TG SPAD (featuring 200 µm active area diameter) and related circuits for quenching and restoring the detector (with also a probe-hosted pulsed laser diode to fabricate a complete TD-DO optode) was demonstrated. It allowed the use in direct contact with the tissue under investigation, avoiding the use of cumbersome optical fibers and increasing the signal collection thanks to the large numerical aperture of the detector (approaching 1) [61]. In the following years, other researchers in the world started to work on similar concepts to develop their own compact TG devices and optodes based on dummy signal generation [96,97,98,99,100]. In these cases, the TG detector active area has a diameter of few ~10 µm, limiting the collection capability of diffused light [100].

3.7. Current Research Challenges

It is worth noting that the parallel development of compact pulsed laser sources [101] and timing electronics [39] is going to allow the design of cheap, compact and wearable systems. However, the technique is still far from a widespread adoption at all levels (research, medicine, market, etc.) due to some barriers which should be addressed in the years to come. Here we discuss, in agreement with the scope of this paper, those mostly related to the TG detector. The discussion of other limitations (e.g., limited power of the laser pulse), more related to the other components of a TD-DO systems, can be found elsewhere [39,61,102].

3.7.1. Detector Active Area

As explained in Section 2, the collection area is a crucial parameter and the major limitation of TG SPADs applied to DO. Indeed, having a Lambertian distribution, the light exiting from diffusive media cannot be efficiently focused onto detectors featuring small active areas. The possibility to collect light with a detector featuring, e.g., a 1 cm2 area would increase the signal level with respect to commercial TG detectors embedding a 100 µm active area device by about five orders of magnitude (four due to the increased area and one due to the possibility to avoid optical fibers, exploiting the full numerical aperture of the detector) [61]. With respect to more advanced solutions like the compact probe embedding a 200 µm diameter TG SPAD [61], used in direct contact with the tissue under investigation, it could be still possible to gain a remarkable factor of 3000 in the signal level, making a clear difference with respect to performance of state of the art devices. This increase will result in the possibility of computing the contrast produced by a localized perturbation at much later times along the recorded DTOF thanks to the increased collection of late photons, thus enhancing the depth sensitivity. To this purpose, SiPMs have been recently introduced in TD-DO [103,104,105,106] giving rise to a new generation of devices [100,106,107]. SiPMs are large-area microelectronics single-photon detectors based on multiple SPADs, each one with an integrated quenching resistor, with a common output signal. These devices feature an active area comparable to that of PMTs or of hybrid PMTs, but being just silicon dice (i.e., microelectronic integrated circuits), they are compact, cheap and rugged, allowing their use in contact with the tissue as well as the fabrication of innovative tomographic systems. However, traditional SiPMs detectors cannot be time-gated due to the presence of the quenching resistor preventing the application of a fast voltage transition to each SPAD of the SiPM. The design of a TG large-area detector is therefore an open challenge. Furthermore, as a good SiPM detector can easily have a dark count rate of 50–100 thousand counts per second (cps) per square millimeter, a 1 cm2 detector could easily feature 10 Mcps, posing serious problems like the need to work beyond the single-photon statistics with high-throughput systems [108,109].

3.7.2. Detector Response Tail

The typical single-photon timing response shape of a SPAD is given by two main contributions: (i) a sharp Gaussian peak due to photons directly absorbed in the depleted region of the SPAD p-n junction and (ii) a slow decaying exponential tail starting about one order of magnitude below the response peak. This tail is due to photons absorbed in the neutral regions of the detector, generating charge carriers which have to slowly diffuse before being possibly captured by the high electric field of the depleted region, thus being able to generate an avalanche [110]. Typically, tail contributions can have a time constant spanning from few tens of ps up to a few hundred ps. The obvious effect of the tail in TD-DO is to spread in time the information, thus contaminating the contrast at late times with a memory of early photons. As it has been demonstrated in a previous work [110], a device featuring a 240 ps tail decay time cannot perform TG measurements at small ρ. On the contrary, with an 85 ps tail decay time it was possible to get rid of early-photons.

3.7.3. Detector Memory Effect

The possibility to operate a SPAD in TG regime, by extending the dynamic range, highlights a previously unknown source of background noise affecting these devices, which was hidden orders of magnitude below their response peak [111,112]. This phenomenon was named as “memory effect” as it arises in SPADs when exposed to strong illumination before being turned ON, giving a sort of memory of photons impinging on the active area before the gate-ON window [110]. This is different from the standard after-pulse noise, which arises when the detector is illuminated during the ON state and consists in avalanches triggered in the detector due to the late release of a charge carrier trapped in deep trap energy levels during a previous avalanche multiplication. The after-pulsing causes an additional background noise contribution with respect to the primary dark count rate [111]. The contribution of the memory effect to the IRF is similar to an additional diffusion tail. Probably, it is due to charge carriers generated in the deepest layers of the SPAD, well beyond the neutral region giving the classical response tail described in Section 3.7.2 [112]. This hypothesis is in agreement with the amplitude of this decay (attaching different orders of magnitude below the SPAD response peak due to the low probability that such carriers have to succeed in reaching the depleted region to generate an avalanche) and with its time constant (in the range of hundreds of ns due to the long diffusion time needed to reach the depleted region). Similarly to the classical diffusion tail, this phenomenon generates a spread in time of the collected photons, which results in a further contamination of late photons with a residual memory of early ones [110]. Due to the long time constant, which is orders of magnitude longer than the classical diffusion tail, the memory effect is detrimental in TG measurements as it is not possible to increase the delay of analysis along the DTOF to reach times where this contamination is negligible.

3.7.4. Non-Time Invariant Detector Response

TG SPAD measurements are particularly complex also due to the need to cope with a non-time-invariant detector response. Indeed, some regions of the gate windows are affected by localized oscillations of the bias voltages or electrical disturbances on the SPAD/dummy signals entering the fast comparator. Typically, these are mainly localized close to the rising edge of the gating window [31]. Thus, a realistic modeling of the full detector behavior in a TD-DO system, which is fundamental to understand the effect of key bottlenecks of a TG detector like the diffusion tail, is more difficult due to impossibility of applying the convolution theorem. A first solution was proposed in Ref. [110] with the generation of the so-called “spread matrix”, which is a discrete representation of the system behavior, assessing the temporal spread of detected photons by acquiring them at different delays from the laser pulse injection time, at very fine steps of, e.g., 100 ps. In this way, it is possible to characterize how the real photon arrival times on the detector are spread when photons are classified by the system at a given measured time.

3.7.5. Impact of the Overall Detector Response Shape

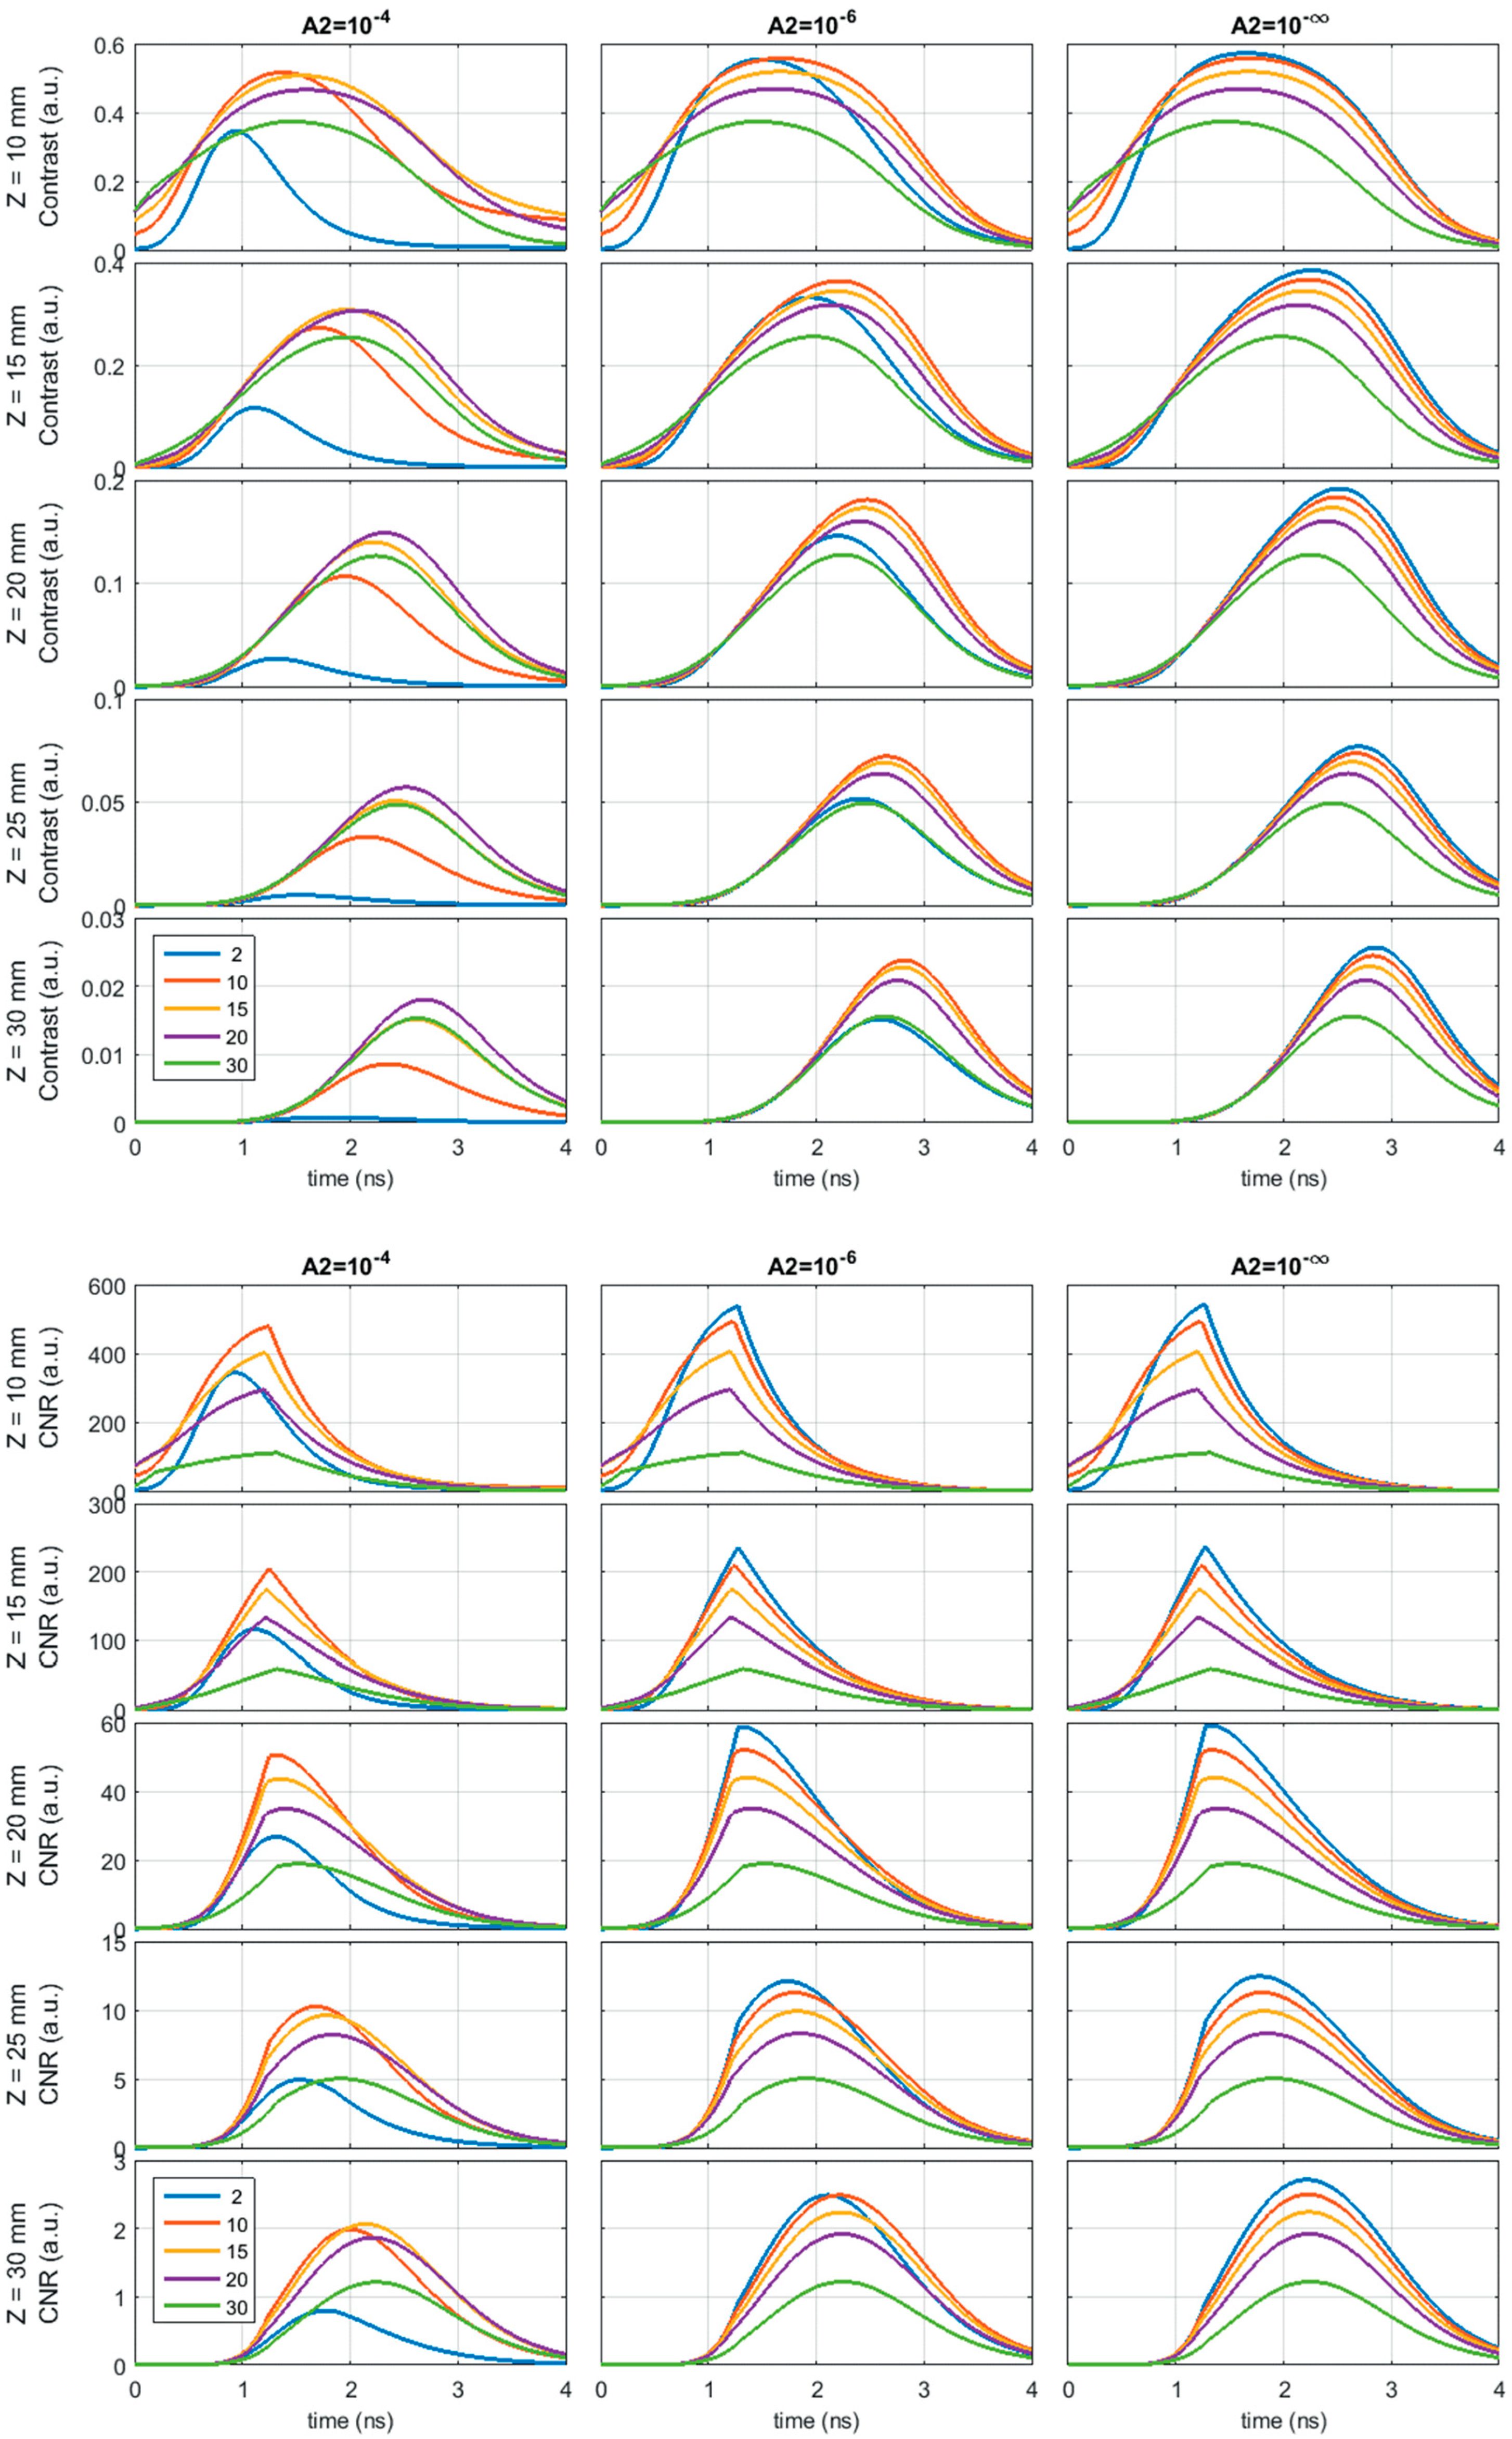
In a recent study performed by some of us [102], the effect of instrumental, optical and geometrical parameters on TG diffuse optics measurements within heterogeneous media have been estimated by performing comprehensive simulations. They take into account the strong interplay between all the different parameters in order to both provide a reference for scientist to devise the best measurement conditions depending on the problem under investigation and to identify the most critical challenges to be addressed by researchers working in the optimization of the hardware performance of TG system. The most critical parameters limiting the performance of a TD-DO system based on TG detection were found to be the memory effect and the detector active area. Figure 10 shows the simulated contrast and contrast-to-noise ratio (CNR, i.e., an index of the statistical significance of the contrast within the noise fluctuations [60], in formula: C N R = N 0 N σ ( N 0 ) where σ ( N 0 ) is the standard deviation of a series of repeated acquisition for the unperturbed case) produced by localized absorption perturbation within highly scattering media using a realistic IRF shape (measurements conditions can be found in Ref. [102]). A more comprehensive figure, which includes also possible different perturbations and different optical properties of the bulk medium, can be found in Ref. [113]. In panels at different rows the perturbation is set at different depths within inside the medium probed in a reflectance geometry (from 10 mm to 30 mm). Panels in different columns shows the performance of systems characterized by different amplitudes of the memory tail (attaching four or six decades below the IRF peak, or not present in the last column—ideal case). Different colors of curves represent different ρ, from 2 to 30 mm. In particular, the blue curve represents the small ρ (2 mm) configuration. While classical large ρ are not affected by the memory tail amplitude, in the 2 mm case both contrast and CNR strongly depend on the memory tail amplitude. Using a 2 mm ρ in presence of a high memory tail the perturbation is undetectable at the largest depths (contrast < 1%, CNR < 1 at a 30 mm depth), while in absence of memory effect a 2 mm ρ gives the best results in terms of both contrast and CNR (contrast > 20%, CNR > 2.5 at a 30 mm depth), as it was theorized in Ref. [38]. It is worth noting that here a realistic IRF shape was considered, featuring ~150 ps jitter FWHM and a diffusion tail time constant of 80 ps starting one decade below the IRF peak. Similar considerations can be drawn for the detector active area, whose effect can be found in Ref. [114]. The memory effect reduction and the increase of the detector collection area represent the main technological challenges to be addressed in the future to achieve the best performance in TG-DO systems, maximizing in this way the penetration depth inside scattering media, unleashing the full power of the technique when probing muscles and brain, but even reaching organs in the human body whose access is presently forbidden, such as heart or cerebellum, opening new applications in biomedical field and others [39].

4. Applications

Thanks to its advantages, TG detection strategies have been employed in many TD-DO applications in biomedical field. In the following, the most relevant results are presented and discussed.

4.1. Functional Imaging

One of the main fields of application of the TG technique is the brain functional imaging. Indeed, the use of the small ρ approach coupled to the time gating technique allows to increase the mean penetration depth and to realize small probes [100]. This peculiarity opens different research lines from the diagnosis/monitoring of patients’ health to the consumer market. From the medical point of view, the possibility of remote monitoring the patient in his daily routine with a small optode (that can be hosted in a cap) will enable the use of personalized telemedicine. For what concerns the consumer market, the use of wearable devices to monitor the performances of the sportsmen requires small probes thus bringing toward the adoption of the small ρ approach.
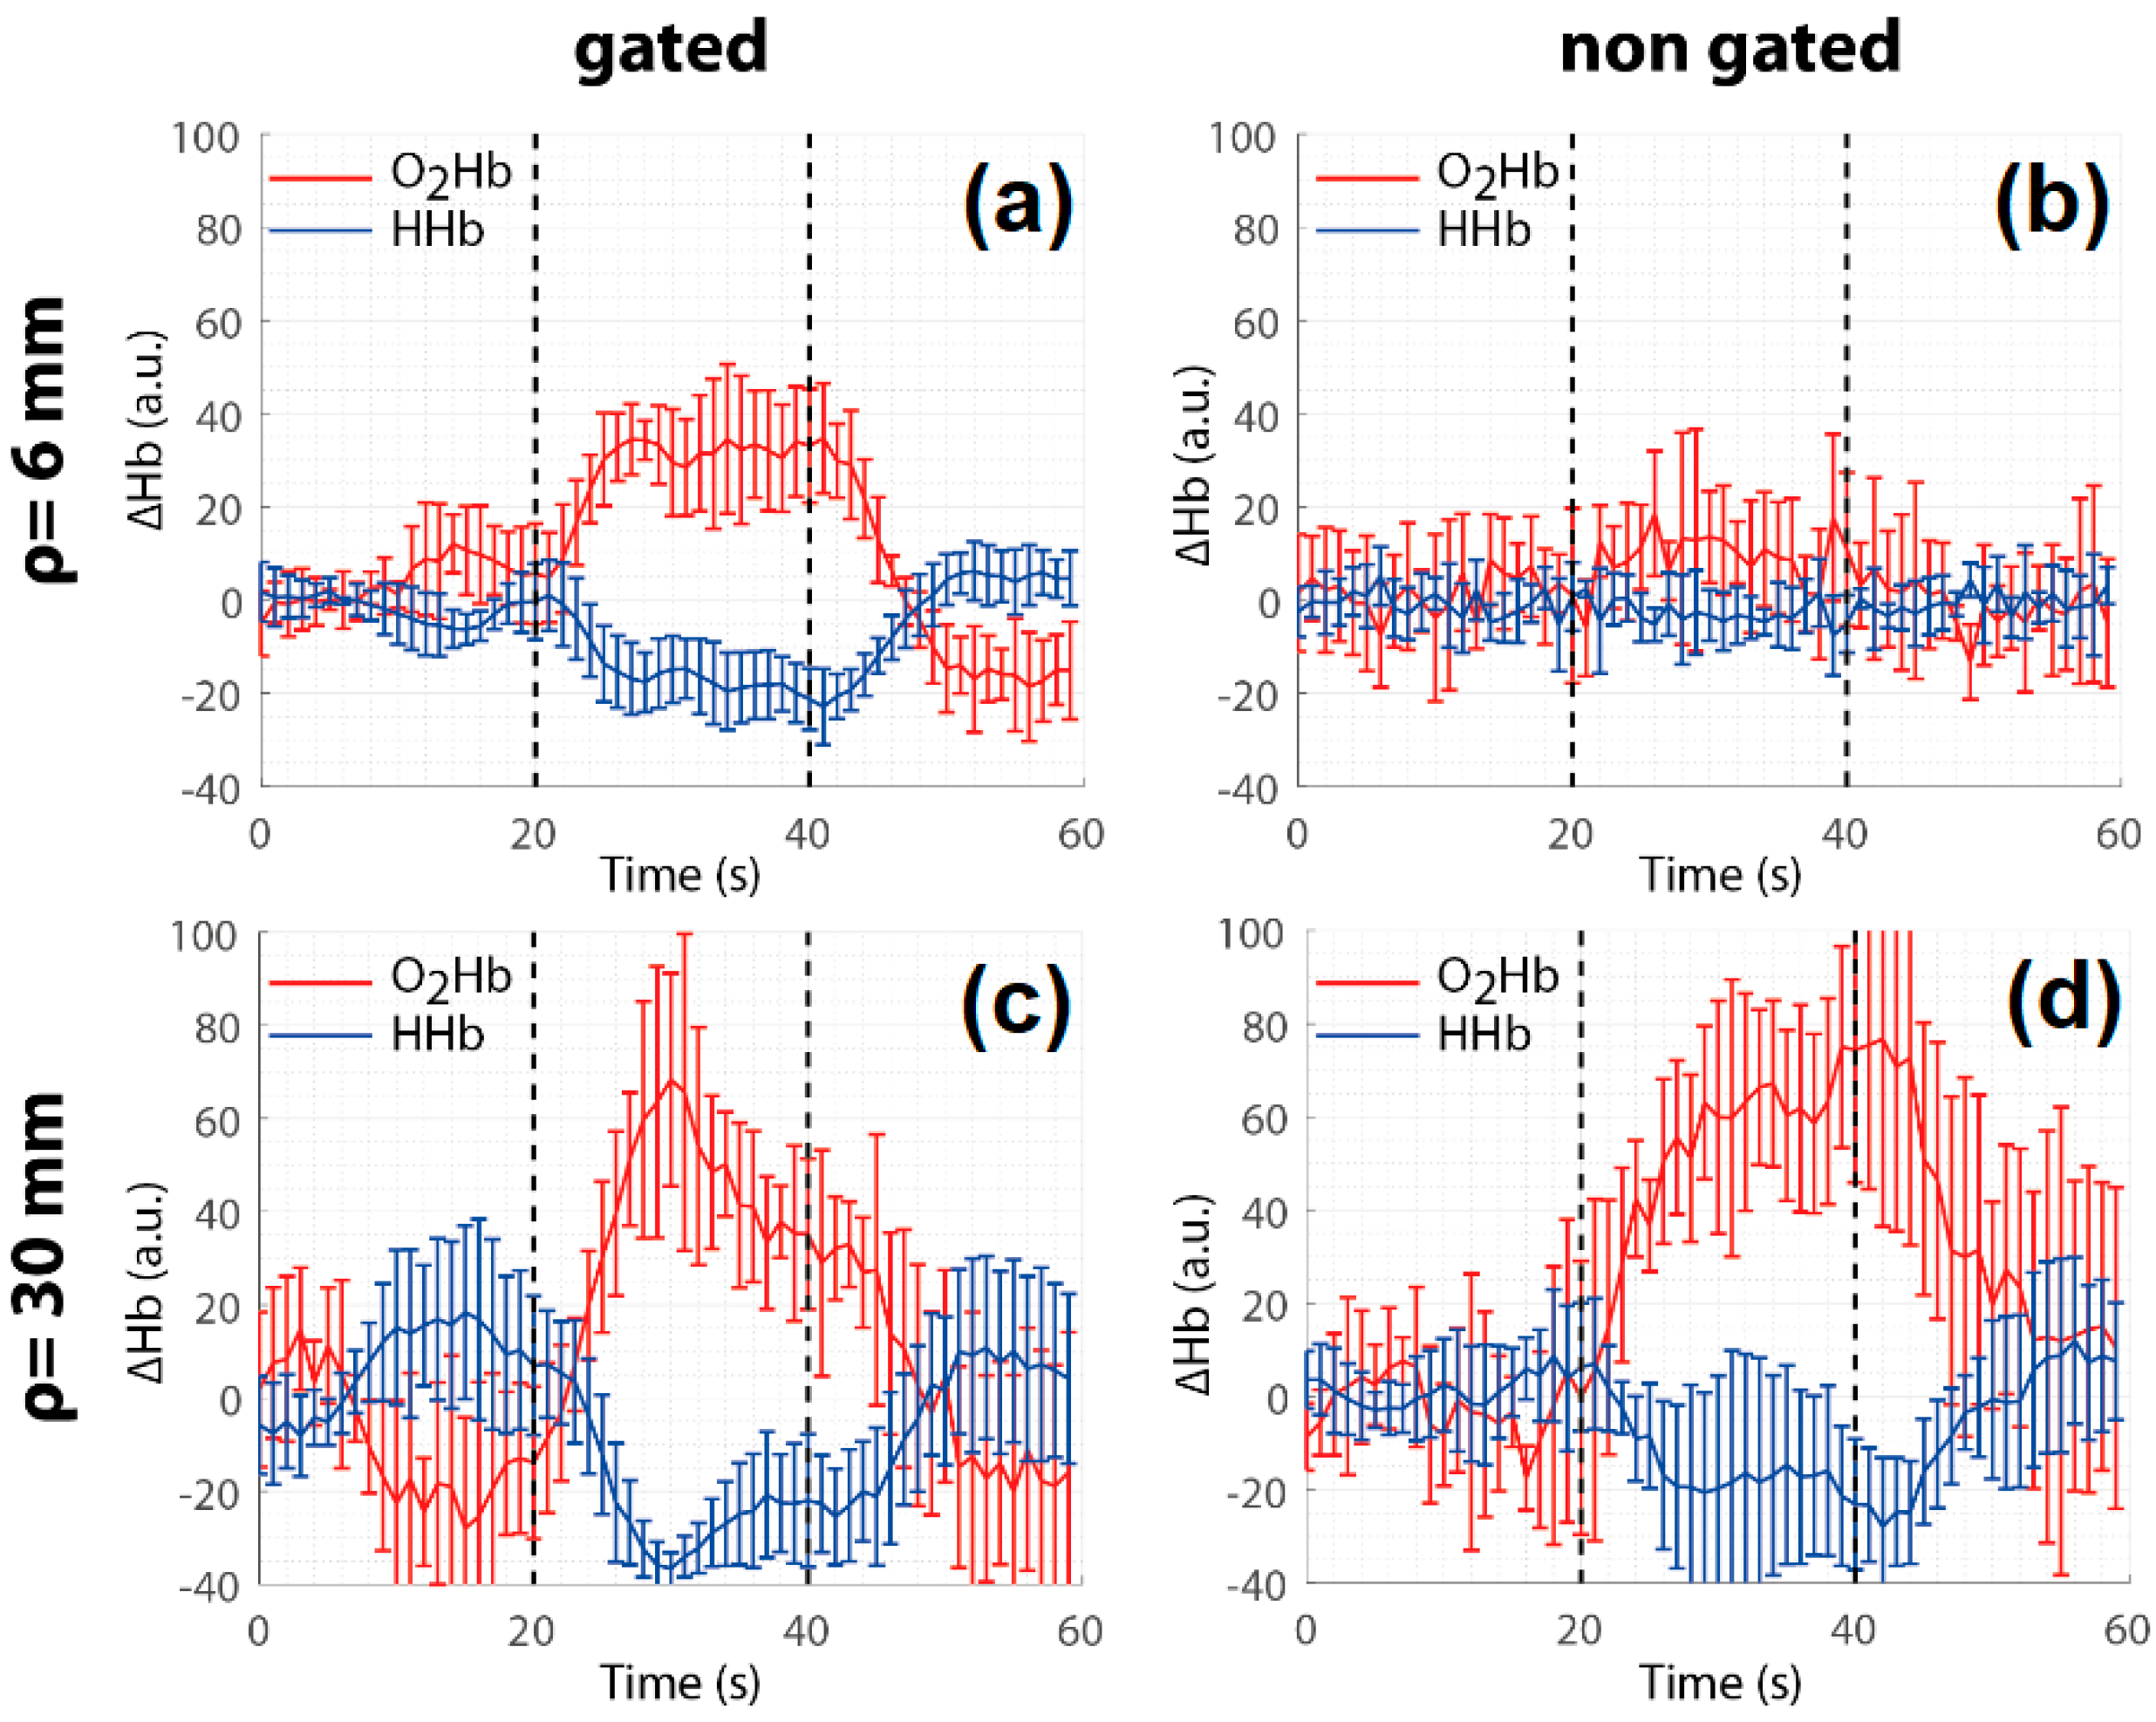
In this view, a first attempt of realization of a time-gating detection system for brain imaging has been carried out using a first prototype system based on a dual-wavelength four-wave mixing laser and two fast-gated modules [115,116]. In these works, the improvement in detecting a localized perturbation using the time-gating approach was firstly demonstrated on phantoms. To assess this capability, the two figures of merits explained in detail in Ref. [60] were chosen, namely contrast and CNR. As already explained, the former is an indicator of the visibility of the perturbation while the latter is an index of the robustness of the contrast with respect to the measurement noise. For a short ρ (e.g., 5 mm), the use of time gating is crucial to achieve a sufficient capability (i.e., sufficient contrast and CNR) to detect an inclusion in depth, without being limited by the large amount of scarcely diffused photons. The use of time-gating with a larger ρ (e.g., 20 mm) is, as expected, less effective and the penetration depth is thus lower (2.6 cm vs. the 3 cm achievable with a small ρ, for an inclusion with Δμa = 0.15 cm−1 with respect to the background [115]). On the other hand, in the same works the usefulness of the timing-gating was demonstrated for brain imaging (brain activation of motor cortex during a finger tapping exercise). Figure 11 reports results of the in-vivo measurements published in Ref. [115]. Using a small ρ, the brain activation was not visible when using a non-gated approach due to the overwhelming effect of the early photons, while it became much clearer when using a TG approach. In agreement with the theory, the improvement of the time-gating was much milder for the large ρ (30 mm), as it is clearly visible in Figure 11.

4.2. Non-Contact Imaging

The use of a non-contact imaging scheme opens up a wide series of applications both in the medical field as well as on the neuropsychology side. For the former, there are plenty of situations where the physical contact with the subject has to be avoided such as in case of burn wounds or in all those situations where the contact of the fibers can alter the hemodynamics [117,118]. On the other hand, the use of non-contact techniques to monitor the brain activation could dramatically push the neuroeconomy field, allowing one to follow the customers in their decisions.
For what concerns the TD technique, only few works [34,119] have been published with non-contact imaging but using a CCD camera which, as explained in Section 3, is not suitable for fast gating technique. Indeed, due to the small ρ (i.e., confocal scheme of the optics) the fast-gating technique is needed to reject the huge peak of early photons, thus allowing to probe deeper structure. This first proof-of-principle was developed in the paper by Mazurenka et al. [120], where the authors showed the suitability of the system working almost at null ρ (1 mm) based on fast-gated SPAD. They were able to detect an absorption perturbation yielding and equivalent a ∆µa = 0.1 cm−1 in a 1 cm3 volume buried at a depth of 15 mm inside a homogeneous medium (µa = 0.1 cm−1, µs = 10 cm−1) with an improvement in the detectability of the perturbation due to the use of larger delays. Later on, a galvo-scanner was added to the previous setup thus enabling a scanning of the region with a dense grid of points. The final setup was characterized following internationally agreed protocols (e.g., BIP and nEUROPt protocols [60,121]) for performance assessment of TD diffuse imagers and compared to a state-of-the-art brain imager. It turned out that, despite the much lower responsivity of the non-contact system (due to the smaller detector size as well as to the much lower coupling efficiency of the system), there was a large improvement in the achievable dynamic range (seven decades) and CNR as well as in the spatial resolution of the system. All those advantages derived from the use of the quasi-null ρ approach coupled to the fast-gated detection.
The same system was employed to demonstrate the possibility to achieve non-contact scanning functional measurements covering an area of about 4 × 4 cm2 with a framerate of 1 Hz [122]. Measurements of both arterial and venous occlusions of the arm as well as brain monitoring during a Valsalva maneuver and different types of activation task were published [122,123]. In all cases, the hemodynamic changes were clearly found thus showing the suitability of the proposed system for imaging applications.

4.3. Single Fiber Spectroscopy

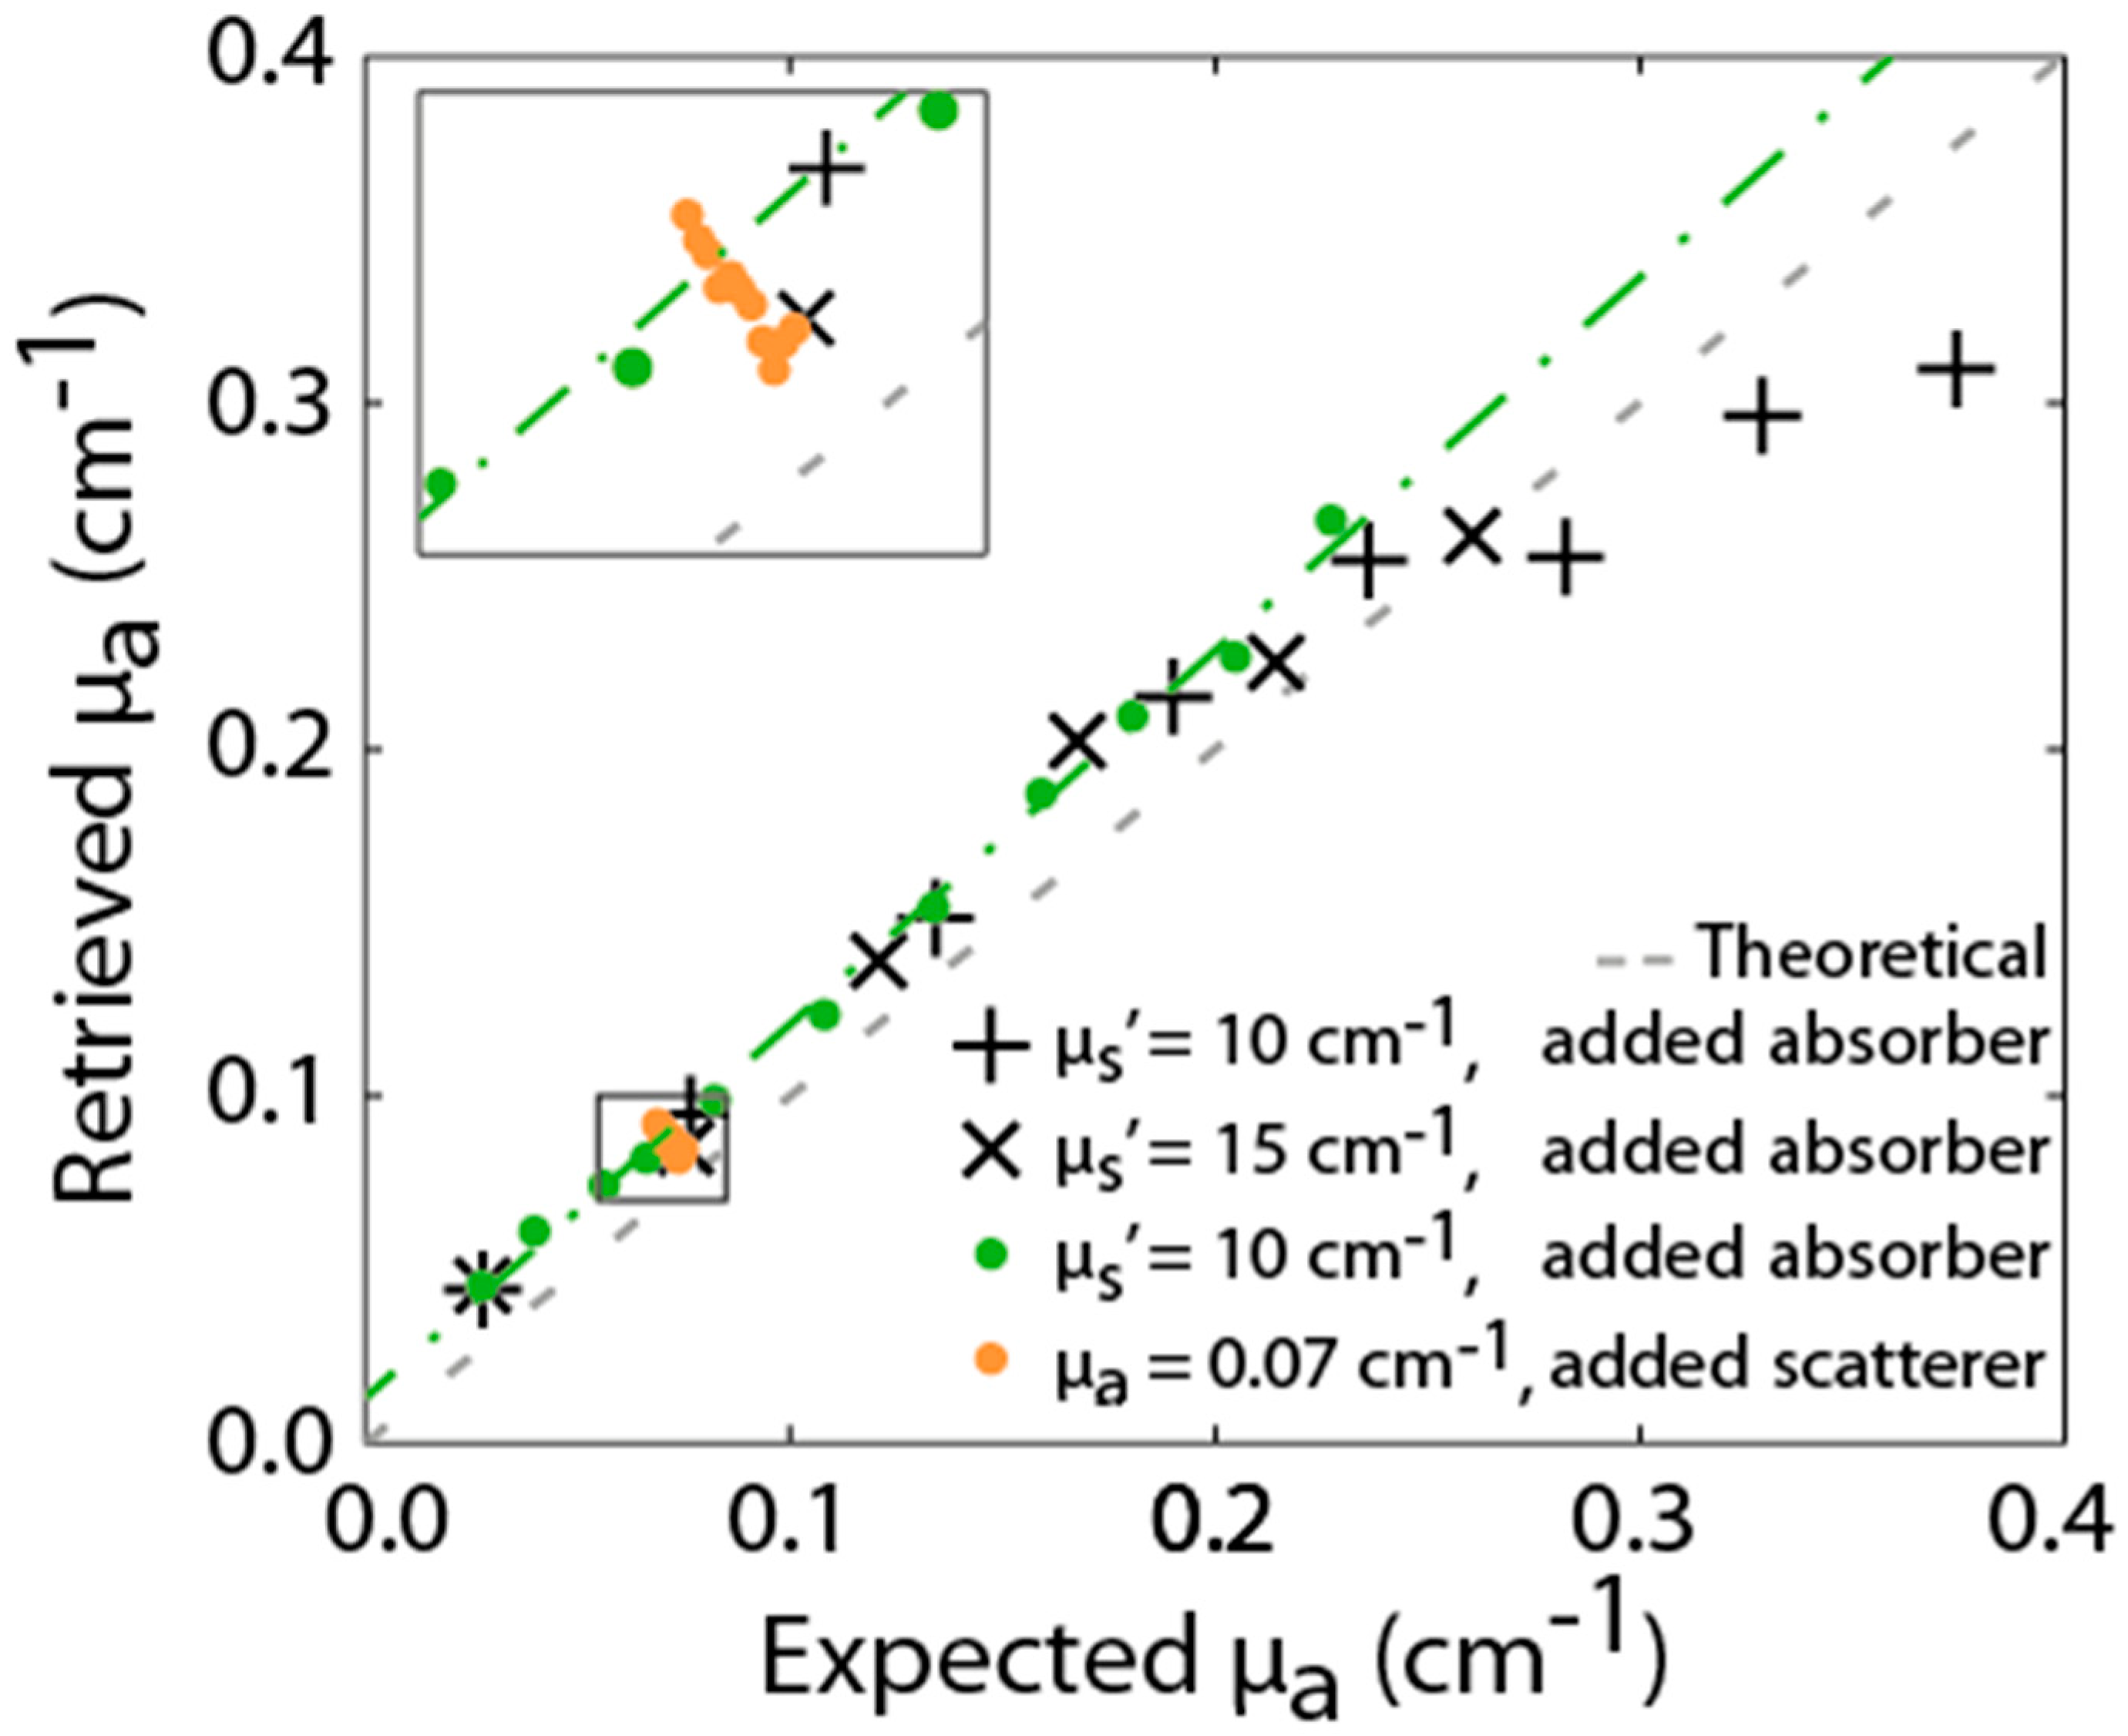
Diffuse optical techniques gained interest in the biomedical world thanks to their capability to monitor non-invasively biological processes. On the other hand, there are applications (such as photodynamic therapy [124,125,126], monitoring of the healing process after surgery or deep hemorrhage, etc.) where there is the need to implant an optical fiber. To lessen the impact of the implant, several solutions have been recently studied such as the use of bioresorbable fibers [127,128,129,130]. On the other hand, the use of a single fiber for both light injection and collection would decrease the burden of the implant thus being more attractive for many clinical applications. Similarly, to the non-contact measurements, the main limitation of this approach is given by the small ρ (in this case exactly null) requiring the rejection of the strong burst of early photons. In Ref. [130], Alerstam and co-workers adopted the TG technique to reject the large amount of reflected/scarcely diffused photons and reconstruct curves with high dynamic range (seven orders of magnitude). They showed that, in the null ρ configuration, the change in the tail due to a difference in the absorption coefficient with respect to the homogeneous background medium can be extracted from signals at five orders of magnitude below the peak; thus making the TG acquisition fundamental to retrieve the medium optical properties. Figure 12 shows the results of the linearity measurements of the absorption coefficient obtained by Alerstam and co-authors. Generally speaking, the absorption coefficient is properly retrieved over a wide range (µa between 0.05 and 0.25 cm−1) notwithstanding the (fixed) value of the scattering coefficient (µs = 10 cm−1 for first and third series—plus symbols and green dots in Figure 12—and µs = 15 cm−1 for the second one—crosses—in Figure 12). A slight offset (0.01 cm−1) can be noticed and the authors attributed it to the TG reconstruction of the DTOF or to the memory effect. For absorption values larger than 0.2 cm−1 underestimation of the value can be found. On the other hand, the authors showed that the addition of scattering particles (orange dots points in Figure 12) is not affecting the retrieval of the absorption coefficient which stays constant. The retrieval of the scattering coefficient is, conversely, very difficult at null ρ using TD measurements since for exactly ρ = 0 the DTOF gets independent of µs.

4.4. Tomography

Another field where time-gating is relevant is diffuse optical tomography (DOT). Indeed, in the last years several clinical and diagnostics applications [8,131] adopted DOT due to its capability to improve the imaging of deep inhomogeneities of the medium (e.g., tumor, local changes in O2Hb/HHb due to brain activation, etc.). The technological improvements in terms of both detectors (matrix of small detectors or large area ones) and detection electronics allows one to have faster measurements, thus going in the direction of real-time tracking of buried objects [132,133,134,135]. Additionally, the use of multiple-view acquisitions coupled to the tomographic reconstruction enables: (i) to overcome the limitation in spatial resolution typical of the diffuse optics; (ii) to improve the quantification of the absorption and scattering coefficient of the inclusion [136,137,138]. All those advantages, coupled with the enhanced penetration depth given by the use of the time-gating technique, could be exploited to acquire in real time images which may also provide the quantification of the main chromophore in the tissues (e.g., O2Hb and HHb for brain imaging or also collagen, lipid, water for breast imaging). This possibility opens up a wide range of potential disruptive applications in the imaging field both as stand-alone technique, or in conjunction with other imaging techniques. For example, DOT with a small ρ could permit the continuous and non-invasive monitoring of deep vessel permeability (even buried three or more cm in depth). On the other hand, if coupled to other techniques (e.g., ultrasound [139,140,141,142]), DOT could represent a powerful diagnostics tool for oncology thanks to the simultaneous information on position and size of a suspect lesion (using ultrasound technique) and the quantification of tissue constituents (given by DOT), potentially giving hints about the lesion malignancy.
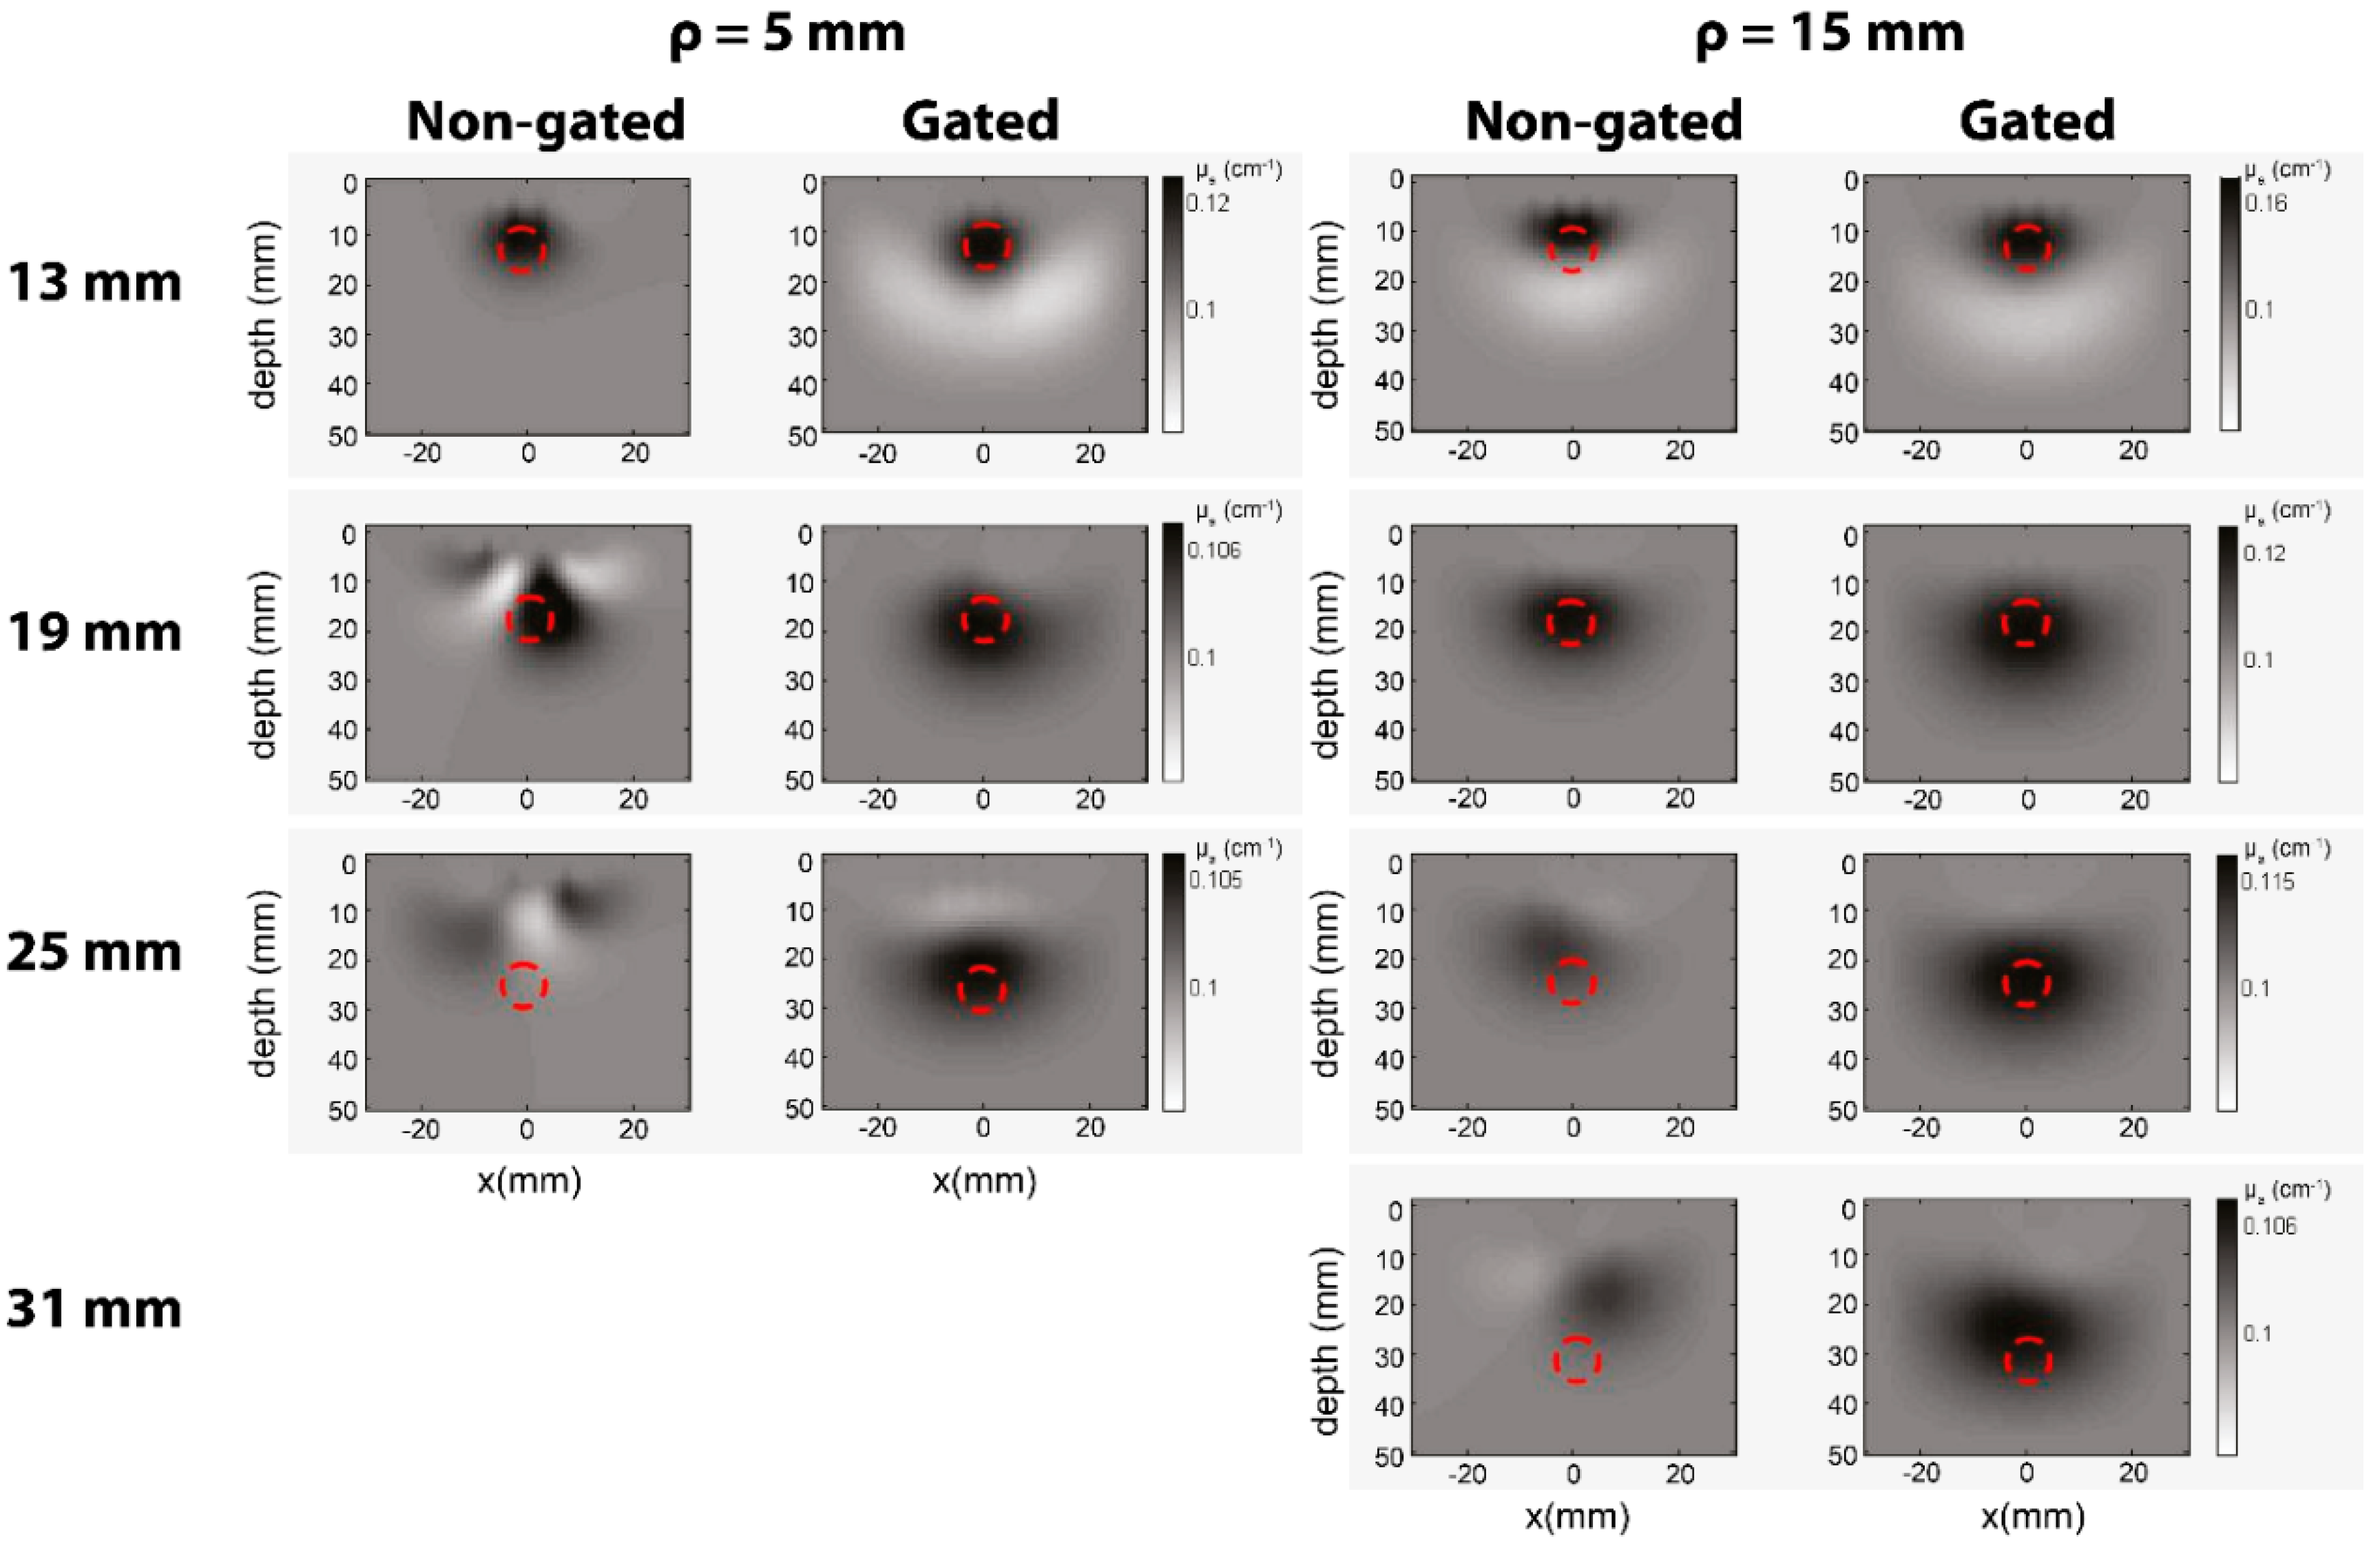
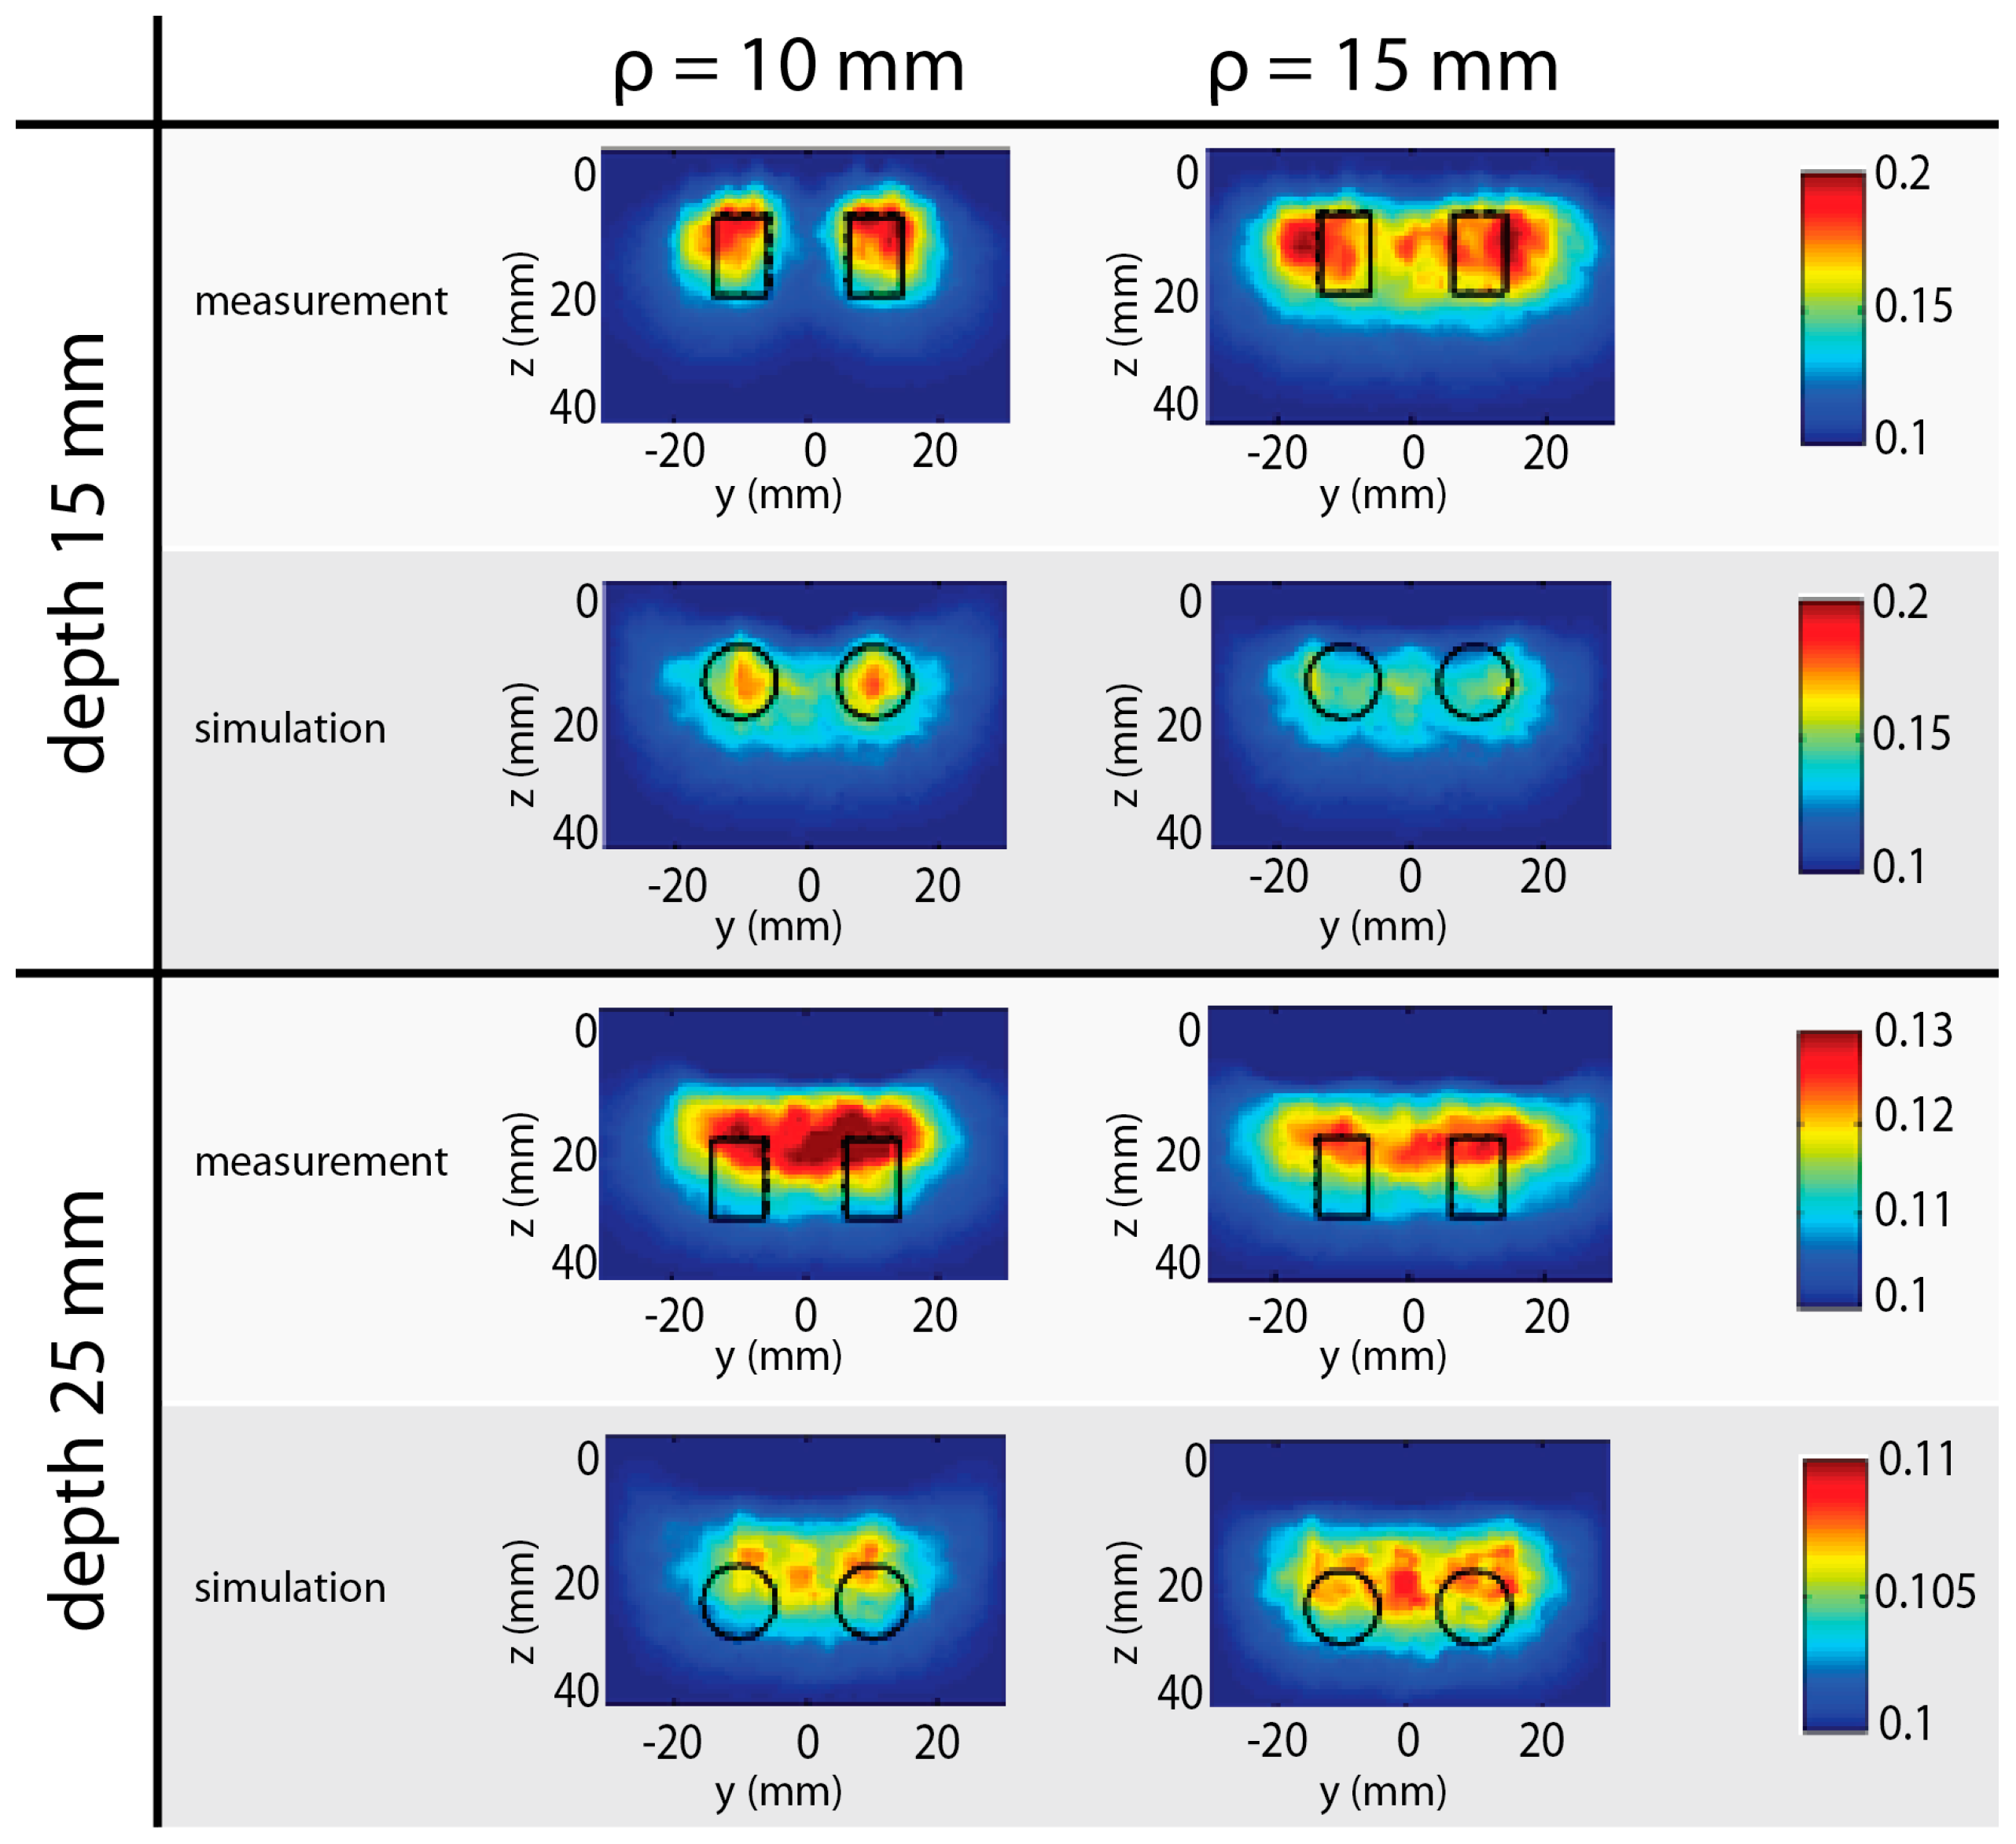
Along this direction, different papers have been published in the last years. Firstly, as soon as the implementation of the time-gating technique was possible, it was demonstrated the improvement given by the short ρ approach in terms of maximum depth sensitivity [143]. As schematically depicted in Figure 13, the improvement given by the use of the TG acquisition is clear for both a short (5 mm) and large (15 mm) ρ. It is evident that the use of TG technique is fundamental when ρ = 5 mm is used to see a deep inclusion. However, due to the memory effect [111,112], the theoretical gain in depth sensitivity is not attained when using a very small ρ. Indeed, using ρ = 15 mm with the TG technique it is possible to detect the inclusion up to a depth of 31 mm with a good localization and an improvement of around 50% with respect to the non-gated acquisitions. The use of the TG technique was shown to improve the spatial resolution, as foreseen by theory. Indeed, in Ref [144] the authors demonstrated that using a small ρ (e.g., 10 mm where the photons’ confinement is improved) it was possible to distinguish two inclusions (separated by 3 cm) at a depth of about 15 mm (see Figure 14). Going deeper, the inclusions will not be detectable due to the broadening of the banana shape thus causing artifacts to arise in the middle. Those conclusions were supported also by simulations thus setting a limit to the achievable spatial resolution with the current detector technology.
Another crucial aspect of tomography is the capability to quantify a perturbation. In the paper by Zouaoui et al. [146] the effect of the time-gating in the retrieval of the absorption coefficient of the absorbing inclusion buried at a depth of 1 to 2 cm within a homogeneous medium was studied. The quantification was demonstrated to be affected by the depth of the inclusion and the amount of the optical perturbation. The use of a-priori information for both volume and position improves the reconstruction, thus pushing to the multimodal imaging where the anatomical information is provided by other techniques (such as ultrasound). In this case, as clearly stated by the authors, the TG approach seems not to improve the quantification and this conclusion is supported both by experimental measurements and simulations.
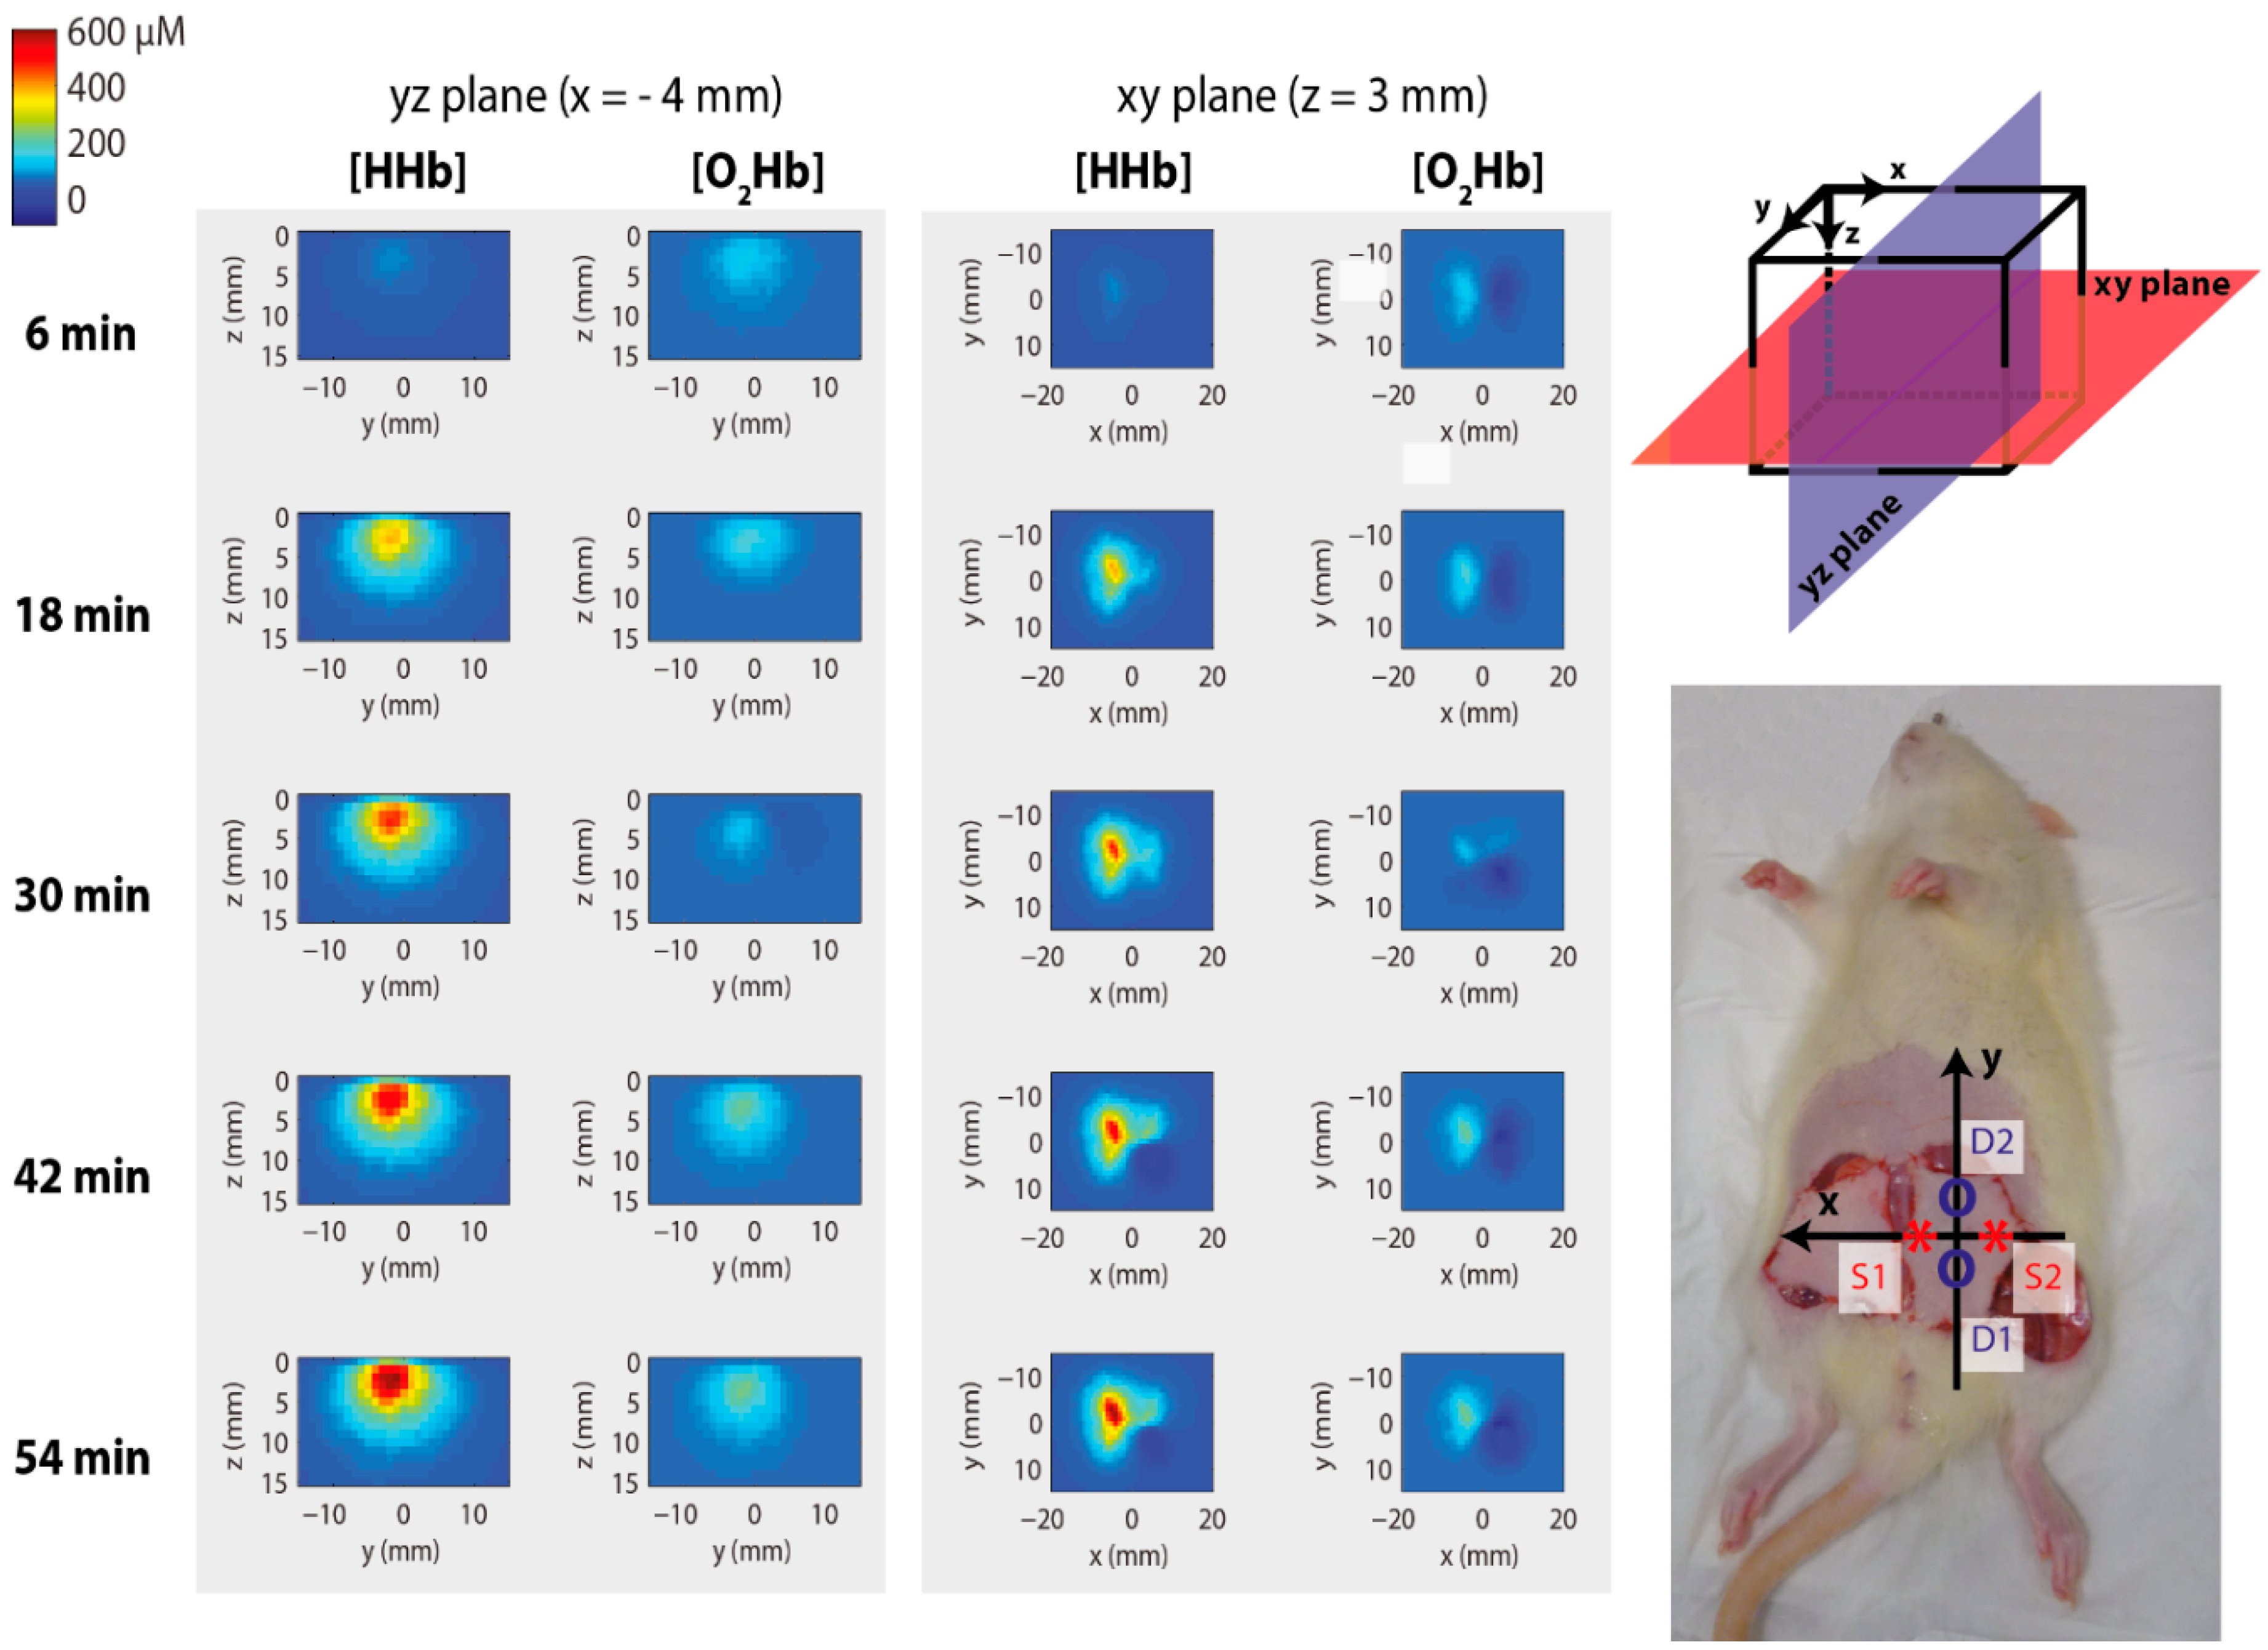
At any rate, even if the quantification is not precise, the tomography based on fast-gated acquisition can be used for clinical applications. To the best of our knowledge, the only one presented in literature is a preclinical study on the assessment of flap viability on rats [147]. In this study, the authors used four source-detector couples to get a tomographic reconstruction of the vessel below the flap where a venous occlusion was induced by clamping the vein. Using different wavelengths, they reconstructed the maps of O2Hb and HHb in space and over time as depicted in Figure 15 and they were able to properly identify the venous occlusion. The work shows the suitability of the TG tomography to reconstruct variations of O2Hb and HHb, thus paving the way to a wide range of applications where the deep monitoring of the vessel permeability is needed.

4.5. Time Domain Diffuse Correlation Spectroscopy

In recent years, the use of optical signals to assess the blood flow has gained increased interest in the scientific community. Indeed, DCS relies on the measurement of the autocorrelation in the fluctuations of light speckles generated by photons emerging from the tissue to non-invasively measure the blood flow [148,149]. The basic characteristics (i.e., light transport, non-invasiveness and penetration depth) are the same as NIRS/DOS ones, recalled in Section 2. Many DCS systems rely on the use of CW sources and detectors. However, to recover the absolute blood flow value, it is fundamental to know the optical properties of the tissue under analysis [150,151,152]. For this reason, in literature the use of a DCS system coupled to TD or frequency-domain spectroscopic instruments have been proposed [153,154]. Additionally, the CW DCS systems suffer from confounding effects introduced by extracerebral flow due to systemic physiological changes. In 2016 Sutin et al. [153], introduced for the first time the use of TD DCS in phantoms and on rats, while Pagliazzi et al. [154] extended the method also on humans with first in-vivo studies on the adult forehead and arm. In all those cases, a post-processing time-windowing of the whole DTOF was applied to improve the autocorrelation of the speckles fluctuation, as well as the sensitivity to deeper layer of the tissue. However, the use of time windowing strongly reduces the number of suitable photon counts. Without time-gating, the decrease of ρ cannot be a solution since the number of early photons will be orders of magnitude higher than the number of late ones. In this scenario, the use of the time-gating would be beneficial. The first demonstration of the TG DCS at small ρ was given in 2018 by Pagliazzi et al. [155]. In that paper, the authors demonstrated the possibility to use a fast-gated SPAD module to select the temporal window where photons will be collected and to compute the correlation. The detector output signal was directly connected to both a hardware correlator and to a TCSPC device working in time-tagging mode, with autocorrelation computed in a post-processing stage. After demonstrating that there is no difference between the correlation computed using the hardware correlator or the software one, the authors compared the relative blood flow index for an arterial arm cuff occlusion obtained with a standard time-resolved system (free running SPAD, ρ = 12 mm) with the one obtained with the quasi null ρ distance (2.85 mm) exploiting the time-gating technique. The results achieved are reported in Figure 16. The relative blood flow index was quantitatively similar for both acquisitions even if two aspects are underlined by the authors: (i) the gated measurement displayed a noisier behavior; (ii) the hyperemic peak for the gated acquisition was about 37% higher but this is compatible with the deeper region probed, where muscles are expected to show faster dynamics.

4.6. Optical Spectroscopy beyond 1000 nm

All the applications presented in the previous paragraphs rely on the use of silicon detectors, thus the wavelength range in which they are used is limited to about 1000 nm. However, in the region from 1100 to 1700 nm, some compounds such as collagen and lipids have spectral features which are of the utmost importance for clinical purposes (e.g., breast cancer risk assessment is correlated with lipid, water and collagen concentration [156]). To this extent, InGaAs/InP SPAD detectors represent a good solution thanks to their high photon detection efficiency in that range.
The exploitation of these kind of detectors allows one to explore this new spectral region, thus opening up new applications. However, as anticipated in Section 3.2, the main disadvantage of the InGaAs/InP is represented by the high level of background (due to both dark count rate and after pulsing). For this reason, in addition to a moderate detector cooling [157], a TG approach is needed to decrease the contribution of the noise, thus avoiding the detector saturation. In this case, due to the different aim of the gating (suppressing the noise and not rejecting the early arriving photons), there is no need for a sharp rising edge.
To the best of our knowledge, in diffuse optics a TG InGaAs detector was exploited only in two different papers. In the first one by Bargigia et al. [158], a phantom validation was presented together with a broadband characterization of a sample of pig fat, while in the latter one (by Konugolu Venkata Sekar et al. [159]) the optical characterization of collagen till 1700 nm was shown.
In both cases, the InGaAs/InP SPAD employed was cooled down to 230 K and gated [160]. The resulting photon detection efficiency was good (i.e., maximum value: 42% at 1100 nm while it is still 15% at 1600 nm). In Ref. [158] it was demonstrated that the system was linear in the recovery of the absorption coefficient, with a range where linearity is preserved depending on the fitting procedure. If the diffusion approximation to the radiative transfer equation was used, a good linearity was maintained till µa = 2.1 cm−1 (with a displacement from the linear trend lower than 27%). On the other hand, using a Monte Carlo fitting, the range of linearity reached a value of µa = 2.6 cm−1 (displacement from the linear trend <3%). In both cases, no saturation of the recovered absorption value was reported. For what concerns the scattering, the authors proved that using Monte Carlo fitting, also the retrieval of the scattering coefficient was linear till the lower value of 4.5 cm−1, where the relative error reached 18%.
For what concerns the recovery of the optical spectra, in Ref [158] the authors were able to measure a lipid sample in the range from 1100 to 1700 nm, retrieving a similar trend to the one published by Nachabé et al. [161]. Few years later, the same group published the characterization of collagen from 500 to 1700 nm [159]. In this case their setup was based on two different detectors, namely a SiPM module [162] for the range 500–1100 nm and an InGaAs/InP SPAD in the 1100–1700 nm range. The authors were able to retrieve the absorption spectrum of collagen over the whole 1100–1700 nm range. Additionally, thanks to the knowledge of the collagen spectrum, they were able to recover the main constituents of an absorption spectrum recorded in-vivo on a bone prominence location.

4.7. Other Applications

Apart from the applications in diffuse optics described in the previous paragraphs, there are other areas in which the use of detectors operated in TG modality is necessary. TG mode represents a possible solution, whenever, in an optical measurement, it is necessary to reduce the noise or reject a spurious signal that differs temporally from the target signal. In this paragraph we briefly present some of this kind of applications.
Fluorescence lifetime imaging (FLIM) is a technique which measures not only the fluorescence intensity of the sample, but also the lifetime of the fluorescence signal. This further information allows the discrimination of the composition of the sample and its environment and also a better contrast with respect to the background fluorescence. TG modality can be applied to FLIM: a moving gate and a simple counter allow to measure the lifetime. This simple scheme enables the use of large area detectors [163]. Furthermore, the TG capability can be used in order to reject the excitation signal without using a spectral filter by exploiting the different timing between excitation and fluorescence signals. Similar detection architectures used for FLIM can be applied also in Raman spectroscopies [163].
Stimulated emission depletion (STED) is a fluorescence microscopy with sub-diffraction resolution [164]. In STED microscopy, the resolution of the optical system is increased over a conventional microscope by adding a second beam to the excitation beam whit a “doughnut” profile which is spectrally tuned to trigger stimulated emission in the excited fluorophores. Choosing the right intensity of the second beam it is possible to quench all fluorophore emission except for a sub-diffraction region in the center of the “doughnut” where the second beam intensity is null. The use of a TG detector allows one to collect the fluorescence signal only when the stimulated emission effectively quenches the fluorophores. Thus, the secondary beam can operate at lower power (reducing sample damages) and in a nanosecond pulsed or CW regime (reducing system complexity) [165].
Another important field, where TG detectors gave a breakthrough in the last decade, is in the light detection and ranging (LIDAR) applications. LIDAR systems are used, for instance, for 3D high resolution depth imaging where the time of flight of reflected light pulses is used to probe the spatial position of distant objects. Thanks to the time gating capability of the detector, it is possible to reject the reflected pulses coming from objects between the detector and the target thus improving the dynamic range of the system and its depth sensitivity [166,167]. TG becomes important in more complex LIDAR applications where reflections of higher orders are considered, like in non-line-of-sight imaging where hidden scene are reconstructed by exploiting photons which reach the target after multiple reflections. In this case the TG mode is used for rejecting signal coming from the first reflections which are needed to shine light towards the hidden scene [168].

5. Conclusions and Perspectives

In this work we have reviewed about 15 years of research in the field of time-gated single-photon detection applied to time-domain diffuse optics, from initial theoretical ideas to latest technologies (e.g., wearable probes) and applications. Furthermore, key technological bottlenecks like the memory effect and the limited photon collection active area have been discussed to push the research of the following year in this direction. Time-gated diffuse optics has demonstrated to be the most promising approach to many problems and the breakdown of last barriers can trigger a widespread diffusion in different scenarios, from laboratory research up to the consumer market, thus also contributing to emerging fields like brain-computer interfaces, neuro-economics, internet of things and big data, becoming a new contribution for the fourth industrial revolution.

Author Contributions

Conceptualization, A.D.M. and A.P.; methodology, A.D.M. and A.P.; investigation, A.D.M., L.D.S., A.P. and D.C.; writing—original draft preparation, A.D.M., L.D.S., R.R., A.P. and D.C.; writing—review and editing, A.D.M., L.D.S., R.R., A.P. and D.C.; visualization, A.D.M., L.D.S., R.R., A.P. and D.C.; supervision, A.D.M. and D.C. All authors have read and agreed to the published version of the manuscript.

Funding

The research leading to these results has received partial funding from the European Union’s Horizon 2020 research and innovation program under project SOLUS: “Smart Optical Laser and Ultrasound Diagnostics of Breast Cancer” (www.solus-project.eu, grant agreement No 731877). The project is an initiative of the Photonics Public Private Partnership.

Conflicts of Interest

The authors declare no conflict of interest.

References

  1. Gibson, A.P.; Hebden, J.C.; Arridge, S.R. Recent advances in diffuse optical imaging. Phys. Med. Biol. 2005, 50, R1–R43. [Google Scholar] [CrossRef]
  2. Martelli, F.; Del Bianco, S.; Ismaelli, A.; Zaccanti, G. Light Propagation Through Biological Tissue; SPIE: Bellingham, WA, USA, 2010. [Google Scholar] [CrossRef] [Green Version]
  3. Zude, M. Optical Monitoring of Fresh and Processed Agricultural Crops; CRC Press: Boca Raton, FL, USA, 2008. [Google Scholar] [CrossRef]
  4. Kienle, A.; D’Andrea, C.; Foschum, F.; Taroni, P.; Pifferi, A. Light propagation in dry and wet softwood. Opt. Express 2008, 16, 9895–9906. [Google Scholar] [CrossRef] [PubMed]
  5. Di Rocco, H.O.; Iriarte, D.I.; Pomarico, J.A.; Ranea Sandoval, H.F.; Macdonald, R.; Voigt, J. Determination of optical properties of slices of turbid media by diffuse CW laser light scattering profilometry. J. Quant. Spectrosc. Radiat. Transf. 2007, 105, 68–83. [Google Scholar] [CrossRef]
  6. Johansson, J.; Folestad, S.; Josefson, M.; Sparén, A.; Abrahamsson, C.; Andersson-Engels, S.; Svanberg, S. Time-resolved NIR/Vis spectroscopy for analysis of solids: Pharmaceutical tablets. Appl. Spectrosc. 2002, 56, 725–731. [Google Scholar] [CrossRef] [Green Version]
  7. McCartney, E.J. Optics of the Atmosphere: Scattering by Molecules and Particles; John Wiley and Sons, Inc.: New York, NY, USA, 1976; p. 421. [Google Scholar] [CrossRef]
  8. Durduran, T.; Choe, R.; Baker, W.B.; Yodh, A.G. Diffuse optics for tissue monitoring and tomography. Reports Prog. Phys. 2010, 73, 076701. [Google Scholar] [CrossRef] [Green Version]
  9. Bashkatov, A.N.; Genina, E.A.; Tuchin, V.V. Optical properties of skin, subcutaneous, and muscle tissues: A review. J. Innov. Opt. Health Sci. 2011, 4, 9–38. [Google Scholar] [CrossRef]
  10. Torricelli, A.; Contini, D.; Dalla Mora, A.; Pifferi, A.; Re, R.; Zucchelli, L.; Caffini, M.; Farina, A.; Spinelli, L. Neurophotonics: Non-invasive optical techniques for monitoring brain functions. Funct. Neurol. 2014, 29, 223–230. [Google Scholar] [CrossRef]
  11. Hoshi, Y.; Yamada, Y. Overview of diffuse optical tomography and its clinical applications. J. Biomed. Opt. 2016, 21, 091312. [Google Scholar] [CrossRef] [Green Version]
  12. Lange, F.; Tachtsidis, I. Clinical brain monitoring with time domain NIRS: A review and future perspectives. Appl. Sci. 2019, 9, 1612. [Google Scholar] [CrossRef] [Green Version]
  13. Ferrari, M.; Quaresima, V. A brief review on the history of human functional near-infrared spectroscopy (fNIRS) development and fields of application. Neuroimage 2012, 63, 921–935. [Google Scholar] [CrossRef]
  14. Mesquita, R.C.; Durduran, T.; Yu, G.; Buckley, E.M.; Kim, M.N.; Zhou, C.; Choe, R.; Sunar, U.; Yodh, A.G. Direct measurement of tissue blood flow and metabolism with diffuse optics. Philos. Trans. R. Soc. A Math. Phys. Eng. Sci. 2011, 369, 4390–4406. [Google Scholar] [CrossRef] [PubMed]
  15. Yamada, Y.; Suzuki, H.; Yamashita, Y. Time-domain near-infrared spectroscopy and imaging: A review. Appl. Sci. 2019, 9, 1127. [Google Scholar] [CrossRef] [Green Version]
  16. Torricelli, A.; Contini, D.; Pifferi, A.; Caffini, M.; Re, R.; Zucchelli, L.; Spinelli, L. Time domain functional NIRS imaging for human brain mapping. Neuroimage 2014, 85, 28–50. [Google Scholar] [CrossRef] [Green Version]
  17. Barstow, T.J. Understanding near infrared spectroscopy (NIRS) and its application to skeletal muscle research. J. Appl. Physiol. 2019, 126, 1360–1376. [Google Scholar] [CrossRef]
  18. Grosenick, D.; Rinneberg, H.; Cubeddu, R.; Taroni, P. Review of optical breast imaging and spectroscopy. J. Biomed. Opt. 2016, 21, 091311. [Google Scholar] [CrossRef] [Green Version]
  19. Pifferi, A.; Torricelli, A.; Taroni, P.; Bassi, A.; Chikoidze, E.; Giambattistelli, E.; Cubeddu, R. Optical biopsy of bone tissue: A step toward the diagnosis of bone pathologies. J. Biomed. Opt. 2004, 9, 474–480. [Google Scholar] [CrossRef]
  20. Van Veen, R.L.; Sterenborg, H.J.; Pifferi, A.; Torricelli, A.; Chikoidze, E.; Cubeddu, R. Determination of visible near-IR absorption coefficients of mammalian fat using time- and spatially resolved diffuse reflectance and transmission spectroscopy. J. Biomed. Opt. 2005, 10, 054004. [Google Scholar] [CrossRef]
  21. Taroni, P.; Comelli, D.; Pifferi, A.; Torricelli, A.; Cubeddu, R. Absorption of collagen: Effects on the estimate of breast composition and related diagnostic implications. J. Biomed. Opt. 2007, 12, 014021. [Google Scholar] [CrossRef]
  22. Torricelli, A.; Contini, D.; Dalla Mora, A.; Martinenghi, E.; Tambornini, D.; Villa, F.; Tosi, A.; Spinelli, L. Recent advances in time-resolved NIR spectroscopy for nondestructive assessment of fruit quality. Chem. Eng. 2015, 44, 43–48. [Google Scholar] [CrossRef]
  23. Bargigia, I.; Nevin, A.; Farina, A.; Pifferi, A.; D’Andrea, C.; Karlsson, M.; Lundin, P.; Somesfalean, G.; Svanberg, S. Diffuse optical techniques applied to wood characterisation. J. Near Infrared Spectrosc. 2013, 21, 259–268. [Google Scholar] [CrossRef] [Green Version]
  24. Kamran, F.; Abildgaard, O.H.A.; Sparén, A.; Svensson, O.; Johansson, J.; Andersson-Engels, S.; Andersen, P.E.; Khoptyar, D. Transmission near-infrared (NIR) and photon time-of-flight (PTOF) spectroscopy in a comparative analysis of pharmaceuticals. Appl. Spectrosc. 2015, 69, 389–397. [Google Scholar] [CrossRef] [PubMed] [Green Version]
  25. D’Andrea, C.; Obraztsova, E.A.; Farina, A.; Taroni, P.; Lanzani, G.; Pifferi, A. Absorption spectroscopy of powdered materials using time-resolved diffuse optical methods. Appl. Opt. 2012, 51, 7858–7863. [Google Scholar] [CrossRef] [PubMed]
  26. Bérubé-Lauzière, Y.; Crotti, M.; Boucher, S.; Ettehadi, S.; Pichette, J.; Rech, I. Prospects on time-domain diffuse optical tomography based on time-correlated single photon counting for small animal imaging. J. Spectrosc. 2016, 2016, 1947613. [Google Scholar] [CrossRef] [Green Version]
  27. Steinbrink, J.; Wabnitz, H.; Obrig, H.; Villringer, A.; Rinneberg, H. Determining changes in NIR absorption using a layered model of the human head. Phys. Med. Biol. 2001, 46, 879–896. [Google Scholar] [CrossRef] [PubMed]
  28. Selb, J.; Joseph, D.K.; Boas, D.A. Time-gated optical system for depth-resolved functional brain imaging. J. Biomed. Opt. 2006, 11, 044008. [Google Scholar] [CrossRef] [PubMed]
  29. Re, R.; Contini, D.; Zucchelli, L.; Torricelli, A.; Spinelli, L. Effect of a thin superficial layer on the estimate of hemodynamic changes in a two-layer medium by time domain NIRS. Biomed. Opt. Express 2016, 7, 264. [Google Scholar] [CrossRef] [PubMed] [Green Version]
  30. Gerega, A.; Milej, D.; Weigl, W.; Kacprzak, M.; Liebert, A. Multiwavelength time-resolved near-infrared spectroscopy of the adult head: Assessment of intracerebral and extracerebral absorption changes. Biomed. Opt. Express 2018, 9, 2974. [Google Scholar] [CrossRef]
  31. Dalla Mora, A.; Tosi, A.; Zappa, F.; Cova, S.; Contini, D.; Pifferi, A.; Spinelli, L.; Torricelli, A.; Cubeddu, R. Fast-gated single-photon avalanche diode for wide dynamic range near infrared spectroscopy. IEEE J. Sel. Top. Quant. 2010, 16, 1023–1030. [Google Scholar] [CrossRef]
  32. Hamamatsu Photonics K.K. Photomultiplier Tubes, 4th ed.; Hamamatsu Photonics K.K.: Hamamatsu, Japan, 2017. [Google Scholar]
  33. Dolgoshein, B.; Balagura, V.; Buzhan, P.; Danilov, M.; Filatov, L.; Garutti, E.; Groll, M.; Ilyin, A.; Kantserov, V.; Kaplin, V.; et al. Status report on silicon photomultiplier development and its applications. Nucl. Instruments Methods Phys. Res. Sec. A Accel. Spectrometers Detect. Assoc. Equip. 2006, 563, 368–376. [Google Scholar] [CrossRef] [Green Version]
  34. Sawosz, P.; Zolek, N.; Kacprzak, M.; Maniewski, R.; Liebert, A. Application of time-gated CCD camera with image intensifier in contactless detection of absorbing inclusions buried in optically turbid medium which mimics local changes in oxygenation of the brain tissue. Opto-Electronics Rev. 2012, 20, 309–314. [Google Scholar] [CrossRef]
  35. Wiza, J. Microchannel plate detectors. Nucl. Intrum. Meth. 1979, 162, 587–601. [Google Scholar] [CrossRef]
  36. Hamamatsu Photonics K.K. Guide to Streak Cameras; Hamamatsu Photonics K.K.: Hamamatsu, Japan, 2008. Available online: www.hamamatsu.com/resources/pdf/sys/SHSS0006E_STREAK.pdf (accessed on 20 August 2019).
  37. Cova, S.; Ghioni, M.; Lacaita, A.; Samori, C.; Zappa, F. Avalanche photodiodes and quenching circuits for single-photon detection. Appl. Opt. 1996, 35, 1956–1963. [Google Scholar] [CrossRef] [PubMed]
  38. Torricelli, A.; Pifferi, A.; Spinelli, L.; Cubeddu, R.; Martelli, F.; Del Bianco, S.; Zaccanti, G. Time-resolved reflectance at null source-detector separation: Improving contrast and resolution in diffuse optical imaging. Phys. Rev. Lett. 2005, 95, 078101. [Google Scholar] [CrossRef] [PubMed]
  39. Pifferi, A.; Contini, D.; Dalla Mora, A.; Farina, A.; Spinelli, L.; Torricelli, A. New frontiers in time-domain diffuse optics, a review. J. Biomed. Opt. 2016, 21, 046011. [Google Scholar] [CrossRef] [PubMed] [Green Version]
  40. Becker, W. Advanced Time-Correlated Single Photon Counting Techniques; Springer: New York, NY, USA, 2005. [Google Scholar]
  41. Scano, A.; Zanoletti, M.; Pirovano, I.; Spinelli, L.; Contini, D.; Torricelli, A.; Re, R. NIRS-EMG for clinical applications: A systematic review. Appl. Sci. 2019, 9, 2952. [Google Scholar] [CrossRef] [Green Version]
  42. Grassi, B.; Quaresima, V. Near-infrared spectroscopy and skeletal muscle oxidative function in vivo in health and disease: A review from an exercise physiology perspective. J. Biomed. Opt. 2016, 21, 091313. [Google Scholar] [CrossRef] [Green Version]
  43. Peake, J.M.; Kerr, G.; Sullivan, J.P. A critical review of consumer wearables, mobile applications, and equipment for providing biofeedback, monitoring stress, and sleep in physically active populations. Front. Physiol. 2018, 9, 743. [Google Scholar] [CrossRef]
  44. Gómez, J.; Oviedo, B.; Zhuma, E. Patient monitoring system based on internet of things. Procedia Comput. Sci. 2016, 83, 90–97. [Google Scholar] [CrossRef] [Green Version]
  45. Zhang, X.; Yao, L.; Zhang, S.; Kanhere, S.; Sheng, M.; Liu, Y. Internet of things meets brain-computer interface: A unified deep learning framework for enabling human-thing cognitive interactivity. IEEE Internet Things J. 2019, 6, 2084–2092. [Google Scholar] [CrossRef] [Green Version]
  46. Martini, M.L.; Oermann, E.K.; Opie, N.L.; Panov, F.; Oxley, T.; Yaeger, K. Sensor modalities for brain-computer interface technology: A comprehensive literature review. Neurosurgery 2020, 86, E108–E117. [Google Scholar] [CrossRef]
  47. Meyerding, S.G.H.; Mehlhose, C.M. Can neuromarketing add value to the traditional marketing research? An exemplary experiment with functional near-infrared spectroscopy (fNIRS). J. Bus. Res. 2020, 107, 172–185. [Google Scholar] [CrossRef]
  48. Riva, G.; Wiederhold, B.K.; Mantovani, F. Neuroscience of virtual reality: From virtual exposure to embodied medicine. Cyberpsychol. Behav. Soc. Netw. 2019, 22, 82–96. [Google Scholar] [CrossRef] [PubMed]
  49. Ishimaru, A. Wave Propagation and Scattering in Random Media; Academic Press: New York, NY, USA, 1978; Volume 2, pp. 336–393. [Google Scholar] [CrossRef]
  50. Tsuchiya, Y. Photon path distribution and optical responses of turbid media: Theoretical analysis based on the microscopic Beer-Lambert law. Phys. Med. Biol. 2001, 46, 2067–2084. [Google Scholar] [CrossRef] [PubMed]
  51. Sassaroli, A.; Fantini, S. Comment on the modified Beer–Lambert law for scattering media. Phys. Med. Biol. 2004, 49, N255–N257. [Google Scholar] [CrossRef] [PubMed] [Green Version]
  52. Patterson, M.S.; Chance, B.; Wilson, B.C. Time resolved reflectance and transmittance for the noninvasive measurement of tissue optical properties. Appl. Optics 1989, 28, 2331–2336. [Google Scholar] [CrossRef]
  53. Jacques, S.L. Time resolved propagation of ultrashort laser pulses within turbid tissues. Appl. Optics 1989, 12, 2223–2229. [Google Scholar] [CrossRef]
  54. Madsen, S.J.; Wilson, B.C.; Patterson, M.S.; Park, Y.D.; Jacques, S.L.; Hefetz, Y. Experimental tests of a simple diffusion model for the estimation of scattering and absorption coefficients of turbid media from time-resolved diffuse reflectance measurements. Appl. Optics 1992, 31, 3509–3517. [Google Scholar] [CrossRef]
  55. Ferrari, M.; Wei, Q.; Carraresi, L.; De Blasi, R.A.; Zaccanti, G. Time-resolved spectroscopy of the human forearm. J. Photoch. Photobiol. B 1992, 16, 141–153. [Google Scholar] [CrossRef]
  56. Cubeddu, R.; D’Andrea, C.; Pifferi, A.; Taroni, P.; Torricelli, A.; Valentini, G.; Ruiz-Altisent, M.; Valero, C.; Ortiz, C.; Dover, C.; et al. Time-resolved reflectance spectroscopy applied to the nondestructive monitoring of the internal optical properties in apples. Appl. Spectrosc. 2001, 55, 1368–1374. [Google Scholar] [CrossRef] [Green Version]
  57. Del Bianco, S.; Martelli, F.; Zaccanti, G. Penetration depth of light re-emitted by a diffusive medium: Theoretical and experimental investigation. Phys. Med. Biol. 2002, 47, 4131–4144. [Google Scholar] [CrossRef]
  58. Selb, J.J.; Stott, J.J.; Franceschini, M.A.; Sorensen, A.G.; Boas, D.A. Improved sensitivity to cerebral hemodynamics during brain activation with a time-gated optical system: Analytical model and experimental validation. J. Biomed. Opt. 2005, 10, 011013. [Google Scholar] [CrossRef] [PubMed]
  59. Martelli, F.; Binzoni, T.; Pifferi, A.; Spinelli, L.; Farina, A.; Torricelli, A. There’s plenty of light at the bottom: Statistics of photon penetration depth in random media. Sci. Rep. 2016, 6, 27057. [Google Scholar] [CrossRef] [PubMed]
  60. Wabnitz, H.; Jelzow, A.; Mazurenka, M.; Steinkellner, O.; Macdonald, R.; Milej, D.; Zolek, N.; Kacprzak, M.; Sawosz, P.; Maniewski, R.; et al. Performance assessment of time-domain optical brain imagers, part 2: nEUROPt protocol. J. Biomed. Opt. 2014, 19, 86012. [Google Scholar] [CrossRef]
  61. Dalla Mora, A.; Contini, D.; Arridge, S.; Martelli, F.; Tosi, A.; Boso, G.; Farina, A.; Durduran, T.; Martinenghi, E.; Torricelli, A.; et al. Towards next-generation time-domain diffuse optics for extreme depth penetration and sensitivity. Opt. Express 2015, 6, 1749–1760. [Google Scholar] [CrossRef] [Green Version]
  62. Becker, W. The bh TCSPC Handbook, 7th ed.; Becker & Hickl GmbH: Berlin, Germany, 2017; Available online: www.becker-hickl.com/wp-content/uploads/2019/01/hb-bh-TCSPC.pdf (accessed on 20 August 2019).
  63. Jacoby, B.A.; Kotecki, D.E.; Lear, R.D. Direct gating of microchannel plates. IEEE T. Nucl. Sci. 1983, 30, 4624–4627. [Google Scholar] [CrossRef]
  64. Zipfl, P.; Schneckenburger, H.; Schoch, L. Fast photomultiplier tube gating technique for time-resolved fluorescence measurements. Proc. SPIE 1999, 3600, 158–164. [Google Scholar] [CrossRef]
  65. Milnes, J.S.; Horsfield, C.J.; Rubery, M.S.; Glebov, V.Y.; Herrmann, H.W. Ultra-high speed photomultiplier tubes with nanosecond gating for fusion diagnostics. Rev. Sci. Instrum. 2012, 83, 10D301. [Google Scholar] [CrossRef]
  66. Zappa, F.; Tosi, A.; Dalla Mora, A.; Tisa, S. SPICE modeling of single photon avalanche diodes. Sensor. Actuat. A Phys. 2009, 153, 197–204. [Google Scholar] [CrossRef]
  67. Dalla Mora, A.; Tosi, A.; Tisa, S.; Zappa, F. Single-photon avalanche diode model for circuit simulations. IEEE Photonic. Tech. L. 2007, 19, 1922–1924. [Google Scholar] [CrossRef] [Green Version]
  68. Tosi, A.; Dalla Mora, A.; Zappa, F.; Cova, S. Single-photon avalanche diodes for the near-infrared range: Detector and circuit issues. J. Mod. Optic. 2009, 56, 299–308. [Google Scholar] [CrossRef]
  69. Tosi, A.; Acerbi, F.; Dalla Mora, A.; Itzler, M.A.; Jiang, X. Active area uniformity of InGaAs/InP single-photon avalanche diodes. IEEE Photonics J. 2011, 3, 5671447. [Google Scholar] [CrossRef]
  70. Bethune, D.S.; Risk, W.P. An autocompensating fiber-optic quantum cryptography system based on polarization splitting of light. IEEE J. Quantum Electron. 2000, 36, 340–347. [Google Scholar] [CrossRef]
  71. Bethune, D.S.; Devoe, R.G.; Kurtsiefer, C.; Retterner, C.T.; Risk, W.P. System for Gated Detection of Optical Pulses Containing a Small Number of Photons Using an Avalanche Photodiode. US Patent US6218657B1, 17 April 2001. [Google Scholar]
  72. Bethune, D.S.; Risk, W.P.; Pabst, G.W. A high-performance integrated single-photon detector for telecom wavelengths. J. Mod. Opt. 2004, 51, 1359–1368. [Google Scholar] [CrossRef]
  73. Tomita, A.; Nakamura, K. Balanced gated-mode photon detector for quantum-bit discrimination at 1550 nm. Opt. Lett. 2002, 27, 1827–1829. [Google Scholar] [CrossRef] [PubMed] [Green Version]
  74. Yoshizawa, A.; Kaji, R.; Tsuchida, H. Gated-mode single-photon detection at 1550 nm by discharge pulse counting. Appl. Phys. Lett. 2004, 84, 3606–3608. [Google Scholar] [CrossRef]
  75. Zhou, C.; Wu, G.; Zeng, H.P. Multigate single-photon detection and timing discrimination with an InGaAs/InP avalanche photodiode. Appl. Opt. 2006, 45, 1773–1776. [Google Scholar] [CrossRef] [PubMed]
  76. Wei, Z.; Zhou, P.; Liu, X.; Wang, J.; Liao, C.; Guo, J.; Liang, R.; Liu, S. An integral gated mode single photon detector at telecom wavelengths. J. Phys. D Appl. Phys. 2007, 40, 6922–6925. [Google Scholar] [CrossRef]
  77. Yuan, Z.L.; Kardynal, B.E.; Sharpe, A.W.; Shields, A.J. High speed single photon detection in the near infrared. Appl. Phys. Lett. 2007, 91, 041114. [Google Scholar] [CrossRef] [Green Version]
  78. Pifferi, A.; Torricelli, A.; Spinelli, L.; Contini, D.; Cubeddu, R.; Martelli, F.; Zaccanti, G.; Tosi, A.; Dalla Mora, A.; Zappa, F.; et al. Time-resolved diffuse reflectance using small source-detector separation and fast single-photon gating. Phys. Rev. Lett. 2008, 100, 138101. [Google Scholar] [CrossRef]
  79. Tosi, A.; Dalla Mora, A.; Zappa, F.; Gulinatti, A.; Contini, D.; Pifferi, A.; Spinelli, L.; Torricelli, A.; Cubeddu, R. Fast-gated single-photon counting technique widens dynamic range and speeds up acquisition time in time-resolved measurements. Opt. Express 2011, 19, 10735–10746. [Google Scholar] [CrossRef]
  80. Cominelli, A.; Acconcia, G.; Labanca, I.; Ghioni, M.; Rech, I. Accurate non-invasive measurement of the turn-on transition of fast gated single photon avalanche diodes. Rev. Sci. Instrum. 2019, 90, 033102. [Google Scholar] [CrossRef] [PubMed]
  81. Ding, X.; Zang, K.; Zheng, T.; Fei, Y.; Huang, M.; Liu, X.; Wang, Y.; Jin, G.; Huo, Y.; Harris, J.S.; et al. Improving characterization capabilities in new single-photon avalanche diode research. Rev. Sci. Instrum. 2019, 90, 043108. [Google Scholar] [CrossRef]
  82. Portaluppi, D.; Conca, E.; Villa, F. 32 × 32 CMOS SPAD imager for gated imaging, photon timing, and photon coincidence. IEEE J. Quantum Electron. 2018, 24, 8047323. [Google Scholar] [CrossRef]
  83. Ulku, A.C.; Bruschini, C.; Antolovic, I.M.; Kuo, Y.; Ankri, R.; Weiss, S.; Michalet, X.; Charbon, E. A 512 × 512 SPAD image sensor with integrated gating for widefield FLIM. IEEE J. Quantum Electron. 2019, 25, 8449092. [Google Scholar] [CrossRef] [PubMed]
  84. Ren, X.; Connolly, P.W.R.; Halimi, A.; Altmann, Y.; McLaughlin, S.; Gyongy, I.; Henderson, R.K.; Buller, G.S. High-resolution depth profiling using a range-gated CMOS SPAD quanta image sensor. Opt. Express 2018, 5, 5541–5557. [Google Scholar] [CrossRef] [Green Version]
  85. Gyongy, I.; Calder, N.; Davies, A.; Dutton, N.A.W.; Duncan, R.R.; Rickman, C.; Dalgarno, P.; Henderson, R.K. A 256 × 256, 100-kfps, 61% fill-factor SPAD image sensor for time-resolved microscopy applications. IEEE Trans. Electron. Dev. 2018, 65, 547–554. [Google Scholar] [CrossRef]
  86. Nissinen, I.; Nissinen, J.; Kostamovaara, J. On the time gating of SPADs in a synchronized time-gated SPAD array in Raman spectroscopy. Proc. IEEE Sensors 2017, 2017, 1–3. [Google Scholar] [CrossRef] [Green Version]
  87. Prochazka, I.; Blazej, J.; Kodet, J. Effective dark count rate reduction by modified SPAD gating circuit. Nucl. Intrum. Meth. A 2015, 787, 212–215. [Google Scholar] [CrossRef]
  88. Scarcella, C.; Boso, G.; Ruggeri, A.; Tosi, A. InGaAs/InP single-photon detector gated at 1.3 GHz with 1.5% afterpulsing. IEEE J. Quantum Electron. 2015, 21, 8449092. [Google Scholar] [CrossRef] [Green Version]
  89. Di Sieno, L.; Dalla Mora, A.; Boso, G.; Tosi, A.; Pifferi, A.; Cubeddu, R.; Contini, D. Diffuse optics using a dual window fast-gated counter. Appl. Optics 2014, 53, 7394–7401. [Google Scholar] [CrossRef]
  90. Pancheri, L.; Massari, N.; Stoppa, D. SPAD image sensor with analog counting pixel for time-resolved fluorescence detection. IEEE T. Electron. Dev. 2013, 60, 3442–3449. [Google Scholar] [CrossRef]
  91. Vilella, E.; Alonso, O.; Montiel, A.; Vilà, A.; Diéguez, A. A low-noise time-gated single-photon detector in a HV-CMOS technology for triggered imaging. Sensor. Actuat. A Phys. 2013, 201, 342–351. [Google Scholar] [CrossRef]
  92. Miyata, T.; Iwata, T.; Nakayama, S.; Araki, T. A nanosecond gate-mode-driven silicon avalanche photodiode and its application to measuring fluorescence lifetimes of Ce-doped YAG ceramics. Meas. Sci. Technol. 2012, 23, 035501. [Google Scholar] [CrossRef]
  93. Buttafava, M.; Boso, G.; Ruggeri, A.; Dalla Mora, A.; Tosi, A. Time-gated single-photon detection module with 110 ps transition time and up to 80 MHz repetition rate. Rev. Sci. Instrum. 2014, 85, 083114. [Google Scholar] [CrossRef]
  94. Boso, G.; Dalla Mora, A.; Della Frera, A.; Tosi, A. Fast-gating of single-photon avalanche diodes with 200 ps transitions and 30 ps timing jitter. Sensor. Actuat. A Phys. 2013, 191, 61–67. [Google Scholar] [CrossRef]
  95. Micro Photon Devices S.r.l. FastGatedSPAD. Available online: http://www.micro-photon-devices.com/Products/SPAD-by-Wavelength/400nm-900nm/FastGATED-SPAD (accessed on 21 August 2019).
  96. Saha, S.; Lesage, F.; Sawan, M. High-voltage pulse generator with variable delay for ultrafast gating of single photon detector. In Proceedings of the IEEE 7th Latin American Symposium on Circuits & Systems (LASCAS), Florianopolis, Brazil, 28 February–2 March 2016; pp. 131–134. [Google Scholar] [CrossRef]
  97. Saha, S.; Lu, Y.; Weyers, S.; Sawan, M.; Lesage, F. Time-resolved reflectance using short source-detector separation. In Proceedings of the 2016 IEEE International Symposium on Circuits and Systems (ISCAS), Montreal, QC, Canada, 22–25 May 2016; pp. 333–336. [Google Scholar] [CrossRef]
  98. Saha, S.; Lu, Y.; Weyers, S.; Sawan, M.; Lesage, F. Compact fast optode-based probe for single-photon counting applications. IEEE Phot. Tech. L. 2018, 30, 1515–1518. [Google Scholar] [CrossRef]
  99. Saha, S.; Lu, Y.; Weyers, S.; Lesage, F.; Sawan, M. Miniaturized probe for time-domain near-infrared spectroscopy. In Proceedings of the 2018 IEEE Biomedical Circuits and Systems Conference (BioCAS), Cleveland, OH, USA, 17–19 October 2018; pp. 333–336. [Google Scholar] [CrossRef]
  100. Saha, S.; Burri, S.; Bruschini, C.; Charbon, E.; Lesage, F.; Sawan, M. Time domain NIRS optode based on null/small source-detector distance for wearable applications. In Proceedings of the 2019 IEEE Custom Integrated Circuits Conference (CICC), Austin, TX, USA, USA, 14–17 April 2019; pp. 1–8. [Google Scholar] [CrossRef]
  101. Di Sieno, L.; Nissinen, J.; Hallman, L.; Martinenghi, E.; Contini, D.; Pifferi, A.; Kostamovaara, J.; Dalla Mora, A. Miniaturized pulsed laser source for time-domain diffuse optics routes to wearable devices. J. Biomed. Opt. 2017, 22, 085004. [Google Scholar] [CrossRef] [Green Version]
  102. Behera, A.; Di Sieno, L.; Pifferi, A.; Martelli, F.; Dalla Mora, A. Instrumental, optical and geometrical parameters affecting time-gated diffuse optical measurements: A systematic study. Biomed. Opt. Express 2018, 9, 5524–5542. [Google Scholar] [CrossRef] [Green Version]
  103. Dalla Mora, A.; Martinenghi, E.; Contini, D.; Tosi, A.; Boso, G.; Durduran, T.; Arridge, S.; Martelli, F.; Farina, A.; Torricelli, A.; et al. Fast silicon photomultiplier improves signal harvesting and reduces complexity in timedomain diffuse optics. Opt. Express 2015, 23, 13937–13946. [Google Scholar] [CrossRef] [Green Version]
  104. Martinenghi, E.; Dalla Mora, A.; Contini, D.; Farina, A.; Villa, F.; Torricelli, A.; Pifferi, A. Spectrally resolved single-photon timing of silicon photomultipliers for time-domain diffuse spectroscopy. IEEE Photonics J. 2015, 7, 7159013. [Google Scholar] [CrossRef] [Green Version]
  105. Re, R.; Martinenghi, E.; Dalla Mora, A.; Contini, D.; Pifferi, A.; Torricelli, A. Probe-hosted silicon photomultipliers for time-domain functional near-infrared spectroscopy: Phantom and in vivo tests. Neurophotonics 2016, 3, 045004. [Google Scholar] [CrossRef] [PubMed] [Green Version]
  106. Buttafava, M.; Martinenghi, E.; Tamborini, D.; Contini, D.; Dalla Mora, A.; Renna, M.; Torricelli, A.; Pifferi, A.; Zappa, F.; Tosi, A. A compact two-wavelength time-domain NIRS system based on SiPM and pulsed diode lasers. IEEE Photonics J. 2017, 9, 7792611. [Google Scholar] [CrossRef] [Green Version]
  107. Ferocino, E.; Martinenghi, E.; Dalla Mora, A.; Pifferi, A.; Cubeddu, R.; Taroni, P. High throughput detection chain for time domain optical mammography. Biomed. Opt. Express 2018, 9, 755–770. [Google Scholar] [CrossRef] [PubMed] [Green Version]
  108. Dutton, N.A.W.; Gnecchi, S.; Parmesan, L.; Holmes, A.J.; Rae, B.; Grant, L.A.; Henderson, R.K. A time-correlated single-photon-counting sensor with 14GS/S histogramming time-to-digital converter. Proc. IEEE ISSCS 2015, 58, 204–205. [Google Scholar] [CrossRef]
  109. Tyndall, D.; Rae, B.; Li, D.; Richardson, J.; Arlt, J.; Henderson, R. A 100Mphoton/s time-resolved mini-silicon photomultiplier with on-chip fluorescence lifetime estimation in 0.13 μm CMOS imaging technology. Proc. IEEE ISSCS 2012, 55, 122–123. [Google Scholar] [CrossRef]
  110. Contini, D.; Dalla Mora, A.; Spinelli, L.; Farina, A.; Torricelli, A.; Cubeddu, R.; Martelli, F.; Zaccanti, G.; Tosi, A.; Boso, G.; et al. Effects of time-gated detection in diffuse optical imaging at short source-detector separation. J. Phys. D Appl. Phys. 2015, 48, 045401. [Google Scholar] [CrossRef] [Green Version]
  111. Dalla Mora, A.; Contini, D.; Pifferi, A.; Cubeddu, R.; Tosi, A.; Zappa, F. Afterpulse-like noise limits dynamic range in time-gated applications of thin-junction silicon single-photon avalanche diode. Appl. Phys. Lett. 2012, 100, 241111. [Google Scholar] [CrossRef] [Green Version]
  112. Dalla Mora, A.; Tosi, A.; Contini, D.; Di Sieno, L.; Boso, G.; Villa, F.; Pifferi, A. Memory effect in silicon time-gated single-photon avalanche diodes. J. Appl. Phys. 2015, 117, 114501. [Google Scholar] [CrossRef] [Green Version]
  113. Figshare. Dependence of Contrast and CNR on the Memory Tail Amplitude (A2). Available online: https://figshare.com/articles/Dependence_of_contrast_and_CNR_on_the_memory_tail_amplitude_A2_/6736550 (accessed on 21 August 2019).
  114. Figshare. Dependence of Contrast and CNR on the Optical Responsivity (R). Available online: https://figshare.com/articles/Dependence_of_contrast_and_CNR_on_the_optical_responsivity_R_/6736556 (accessed on 21 August 2019).
  115. Di Sieno, L.; Dalla Mora, A.; Torricelli, A.; Spinelli, L.; Re, R.; Pifferi, A.; Contini, D. A versatile setup for time-resolved functional near infrared spectroscopy based on fast-gated SPAD and on four-wave mixing laser. Appl. Sci. Basel 2019, 9, 2366. [Google Scholar] [CrossRef] [Green Version]
  116. Di Sieno, L.; Contini, D.; Dalla Mora, A.; Torricelli, A.; Spinelli, L.; Cubeddu, R.; Tosi, A.; Boso, G.; Pifferi, A. Functional near-infrared spectroscopy at small source-detector distance by means of high dynamic-range fast-gated SPAD acquisitions: First in-vivo measurements. In Proceedings of the European Conference on Biomedical Optics, Munich, Germany, 12–16 May 2013. [Google Scholar]
  117. Cerussi, A.; Siavoshi, S.; Durkin, A.; Chen, C.; Tanamai, W.; Hsiang, D.; Tromberg, B.J. Effect of contact force on breast tissue optical property measurements using a broadband diffuse optical spectroscopy handheld probe. Appl. Opt. 2009, 48, 4270–4277. [Google Scholar] [CrossRef] [Green Version]
  118. Nakhaeva, I.A.; Zyuryukina, O.A.; Mohammed, M.R.; Sinichkin, Y.P. The effect of external mechanical compression on in vivo water content in human skin. Opt. Spectrosc. 2015, 118, 834–840. [Google Scholar] [CrossRef]
  119. Sase, I.; Takatsuki, A.; Seki, J.; Yanagida, T.; Seiyama, A. Noncontact backscatter-mode near-infrared time-resolved imaging system: Preliminary study for functional brain mapping. J. Biomed. Opt. 2006, 11, 054006. [Google Scholar] [CrossRef] [PubMed] [Green Version]
  120. Mazurenka, M.; Jelzow, A.; Wabnitz, H.; Contini, D.; Spinelli, L.; Pifferi, A.; Cubeddu, R.; Dalla Mora, A.; Tosi, A.; Zappa, F.; et al. Non-contact time-resolved diffuse reflectance imaging at null source-detector separation. Opt. Express 2012, 20, 283–290. [Google Scholar] [CrossRef] [PubMed]
  121. Wabnitz, H.; Taubert, D.R.; Mazurenka, M.; Steinkellner, O.; Jelzow, A.; Macdonald, R.; Milej, D.; Sawosz, P.; Kacprzak, M.; Liebert, A.; et al. Performance assessment of time-domain optical brain imagers, part 1: Basic instrumental performance protocol. J. Biomed. Opt. 2014, 19, 86010. [Google Scholar] [CrossRef] [PubMed] [Green Version]
  122. Mazurenka, M.; Di Sieno, L.; Boso, G.; Contini, D.; Pifferi, A.; Dalla Mora, A.; Tosi, A.; Wabnitz, H.; Macdonald, R. Non-contact in vivo diffuse optical imaging using a time-gated scanning system. Biomed. Opt. Express 2013, 4, 2257–2268. [Google Scholar] [CrossRef] [PubMed]
  123. Mazurenka, M.; Di Sieno, L.; Boso, G.; Contini, D.; Pifferi, A.; Dalla Mora, A.; Tosi, A.; Wabnitz, H.; MacDonald, R. A non-contact time-domain scanning brain imaging system: First in-vivo results. In Proceedings of the European Conference on Biomedical Optics, Munich, Germany, 12–16 May 2013. [Google Scholar]
  124. Kim, J.G.; Liu, H. Variation of haemoglobin extinction coefficients can cause errors in the determination of haemoglobin concentration measured by near-infrared spectroscopy. Phys. Med. Biol. 2007, 52, 6295–6322. [Google Scholar] [CrossRef]
  125. Huang, Z. A review of progress in clinical photodynamic therapy. Technol. Cancer Res. Treat. 2005, 4, 283–293. [Google Scholar] [CrossRef] [Green Version]
  126. Lou, P.-J.J.; Jager, H.R.; Jones, L.; Theodossy, T.; Bown, S.G.; Hopper, C.; Jäger, H.R.; Jones, L.; Theodossy, T.; Bown, S.G.; et al. Interstitial photodynamic therapy as salvage treatment for recurrent head and neck cancer. Br. J. Cancer 2004, 91, 441–446. [Google Scholar] [CrossRef]
  127. Di Sieno, L.; Boetti, N.G.; Dalla Mora, A.; Pugliese, D.; Farina, A.; Konugolu Venkata Sekar, S.; Ceci-Ginistrelli, E.; Janner, D.; Pifferi, A.; Milanese, D. Towards the use of bioresorbable fibers in time-domain diffuse optics. J. Biophotonics 2018, 11, e201600275. [Google Scholar] [CrossRef] [Green Version]
  128. Dupuis, A.; Guo, N.; Gao, Y.; Godbout, N.; Lacroix, S.; Dubois, C.; Skorobogatiy, M. Prospective for biodegradable microstructured optical fibers. Opt. Lett. 2007, 32, 109–111. [Google Scholar] [CrossRef]
  129. Huby, N.; Vié, V.; Renault, A.; Beaufils, S.; Lèfevre, T.; Paquet-Mercier, F.; Pézolet, M.; Beche, B. Native spider silk as a biological optical fiber. Appl. Phys. Lett. 2013, 102, 123702. [Google Scholar] [CrossRef] [Green Version]
  130. Alerstam, E.; Svensson, T.; Andersson-Engels, S.; Spinelli, L.; Contini, D.; Dalla Mora, A.; Tosi, A.; Zappa, F.; Pifferi, A. Single-fiber diffuse optical time-of-flight spectroscopy. Opt. Lett. 2012, 37, 2877–2879. [Google Scholar] [CrossRef] [PubMed] [Green Version]
  131. Boas, D.A.; Brooks, D.H.; Miller, E.L.; Di Marzio, C.A.; Kilmer, M.; Gaudette, R.J.; Zhang, Q. Imaging the body with diffuse optical tomography. IEEE Signal Proc. Mag. 2001, 18, 57–75. [Google Scholar] [CrossRef]
  132. Mata Pavia, J.; Scandini, M.; Lindner, S.; Wolf, M.; Charbon, E. A 1 × 400 backside-illuminated SPAD sensor with 49.7 ps resolution, 30 pJ/sample TDCs fabricated in 3D CMOS technology for near-infrared optical tomography. IEEE J. Solid-St. Circ. 2015, 50, 2406–2418. [Google Scholar] [CrossRef]
  133. Di Sieno, L.; Zouaoui, J.; Hervé, L.; Pifferi, A.; Farina, A.; Martinenghi, E.; Derouard, J.; Dinten, J.-M.; Dalla Mora, A. Time-domain diffuse optical tomography using silicon photomultipliers: A feasibility study. J. Biomed. Opt. 2016, 21, 116002. [Google Scholar] [CrossRef] [Green Version]
  134. Portaluppi, D.; Conca, E.; Villa, F.; Zappa, F. Time-gated SPAD camera with reconfigurable macropixels for LIDAR applications. In Proceedings of the 32nd International Congress on High-Speed Imaging and Photonics, Twente, The Netherlands, 8–12 October 2018. [Google Scholar] [CrossRef]
  135. Lyons, A.; Tonolini, F.; Boccolini, A.; Repetti, A.; Henderson, R.; Wiaux, Y.; Faccio, D. Computational time-of-flight diffuse optical tomography. Nat. Photonics 2019, 13, 575–579. [Google Scholar] [CrossRef]
  136. McBride, T.O.; Pogue, B.W.; Gerety, E.D.; Poplack, S.B.; Osterberg, U.L.; Paulsen, K.D. Spectroscopic diffuse optical tomography for the quantitative assessment of hemoglobin concentration and oxygen saturation in breast tissue. Appl. Opt. 1999, 38, 5480–5490. [Google Scholar] [CrossRef]
  137. McBride, T.O.; Pogue, B.W.; Jiang, S.; Osterberg, U.L.; Paulsen, K.D.; Poplack, S.P. Initial studies of in vivo absorbing and scattering heterogeneity in near-infrared tomographic breast imaging. Opt. Lett. 2001, 26, 822–824. [Google Scholar] [CrossRef]
  138. Dehghani, H.; Pogue, B.W.; Shudong, J.; Brooksby, B.; Paulsen, K.D. Three-dimensional optical tomography: Resolution in small-object imaging. Appl. Opt. 2003, 42, 3117–3128. [Google Scholar] [CrossRef]
  139. Zhu, Q. Optical tomography with ultrasound localization: Initial clinical results and technical challenges. Technol. Cancer Res. Treat. 2005, 4, 235–244. [Google Scholar] [CrossRef] [Green Version]
  140. Vavadi, H.; Mostafa, A.; Zhou, F.; Uddin, K.M.S.; Althobaiti, M.; Xu, C.; Bansal, R.; Ademuyiwa, F.; Poplack, S.; Zhu, Q. Compact ultrasound-guided diffuse optical tomography system for breast cancer imaging. J. Biomed. Opt. 2018, 24, 021203. [Google Scholar] [CrossRef] [PubMed]
  141. Kavuri, V.C.; Liu, H. Hierarchical clustering method to improve transrectal ultrasound-guided diffuse optical tomography for prostate cancer imaging. Acad. Radiol. 2014, 21, 250–262. [Google Scholar] [CrossRef] [PubMed] [Green Version]
  142. SOLUS. SOLUS Project Home Page. Available online: http://www.solus-project.eu/ (accessed on 27 November 2019).
  143. Puszka, A.; Di Sieno, L.; Dalla Mora, A.; Pifferi, A.; Contini, D.; Boso, G.; Tosi, A.; Hervé, L.; Planat-Chrétien, A.; Koenig, A.; et al. Time-resolved diffuse optical tomography using fast-gated single-photon avalanche diodes. Biomed. Opt. Express 2013, 4, 1351–1365. [Google Scholar] [CrossRef] [Green Version]
  144. Puszka, A.; Di Sieno, L.; Dalla Mora, A.; Pifferi, A.; Contini, D.; Planat-Chrétien, A.; Koenig, A.; Boso, G.; Tosi, A.; Hervé, L.; et al. Spatial resolution in depth for time-resolved diffuse optical tomography using short source-detector separations. Biomed. Opt. Express 2015, 6, 1–10. [Google Scholar] [CrossRef] [Green Version]
  145. Martelli, F.; Di Ninni, P.; Zaccanti, G.; Contini, D.; Spinelli, L.; Torricelli, A.; Cubeddu, R.; Wabnitz, H.; Mazurenka, M.; Macdonald, R.; et al. Phantoms for diffuse optical imaging based on totally absorbing objects, part 2: Experimental implementation. J. Biomed. Opt. 2014, 19, 76011. [Google Scholar] [CrossRef] [Green Version]
  146. Zouaoui, J.; Di Sieno, L.; Hervé, L.; Pifferi, A.; Farina, A.; Dalla Mora, A.; Derouard, J.; Dinten, J.-M. Quantification in time-domain diffuse optical tomography using Mellin-Laplace transforms. Biomed. Opt. Express 2016, 7, 4346–4363. [Google Scholar] [CrossRef] [Green Version]
  147. Di Sieno, L.; Bettega, G.; Berger, M.; Hamou, C.; Aribert, M.; Dalla Mora, A.; Puszka, A.; Grateau, H.; Contini, D.; Hervé, L.; et al. Toward noninvasive assessment of flap viability with time-resolved diffuse optical tomography: A preclinical test on rats. J. Biomed. Opt. 2016, 21, 025004. [Google Scholar] [CrossRef] [Green Version]
  148. Durduran, T.; Yodh, A.G. Diffuse correlation spectroscopy for non-invasive, micro-vascular cerebral blood flow measurement. Neuroimage 2014, 85, 51–63. [Google Scholar] [CrossRef] [Green Version]
  149. Buckley, E.M.; Parthasarathy, A.B.; Grant, P.E.; Yodh, A.G.; Franceschini, M.A. Diffuse correlation spectroscopy for measurement of cerebral blood flow: Future prospects. Neurophoton 2014, 1, 011009. [Google Scholar] [CrossRef] [Green Version]
  150. Selb, J.; Boas, D.A.; Chan, S.-T.; Evans, K.C.; Buckley, E.M.; Carp, S.A. Sensitivity of near-infrared spectroscopy and diffuse correlation spectroscopy to brain hemodynamics: Simulations and experimental findings during hypercapnia. Neurophoton 2014, 1, 015005. [Google Scholar] [CrossRef]
  151. Diop, M.; Verdecchia, K.; Lee, T.-Y.; St Lawrence, K. Calibration of diffuse correlation spectroscopy with a time-resolved near-infrared technique to yield absolute cerebral blood flow measurements. Biomed. Opt. Express 2011, 2, 2068–2081. [Google Scholar] [CrossRef] [PubMed] [Green Version]
  152. Carp, S.A.; Farzam, P.; Redes, N.; Hueber, D.M.; Franceschini, M.A. Combined multi-distance frequency domain and diffuse correlation spectroscopy system with simultaneous data acquisition and real-time analysis. Biomed. Opt. Express 2017, 8, 3993–4006. [Google Scholar] [CrossRef] [PubMed] [Green Version]
  153. Sutin, J.; Zimmerman, B.; Tyulmankov, D.; Tamborini, D.; Wu, K.; Selb, J.; Gulinatti, A.; Rech, I.; Tosi, A.; Boas, D.; et al. Time-domain diffuse correlation spectroscopy. Optica 2016, 3, 1006–1013. [Google Scholar] [CrossRef] [PubMed] [Green Version]
  154. Pagliazzi, M.; Konugolu Venkata Sekar, S.; Colombo, L.; Martinenghi, E.; Minnema, J.; Erdmann, R.; Contini, D.; Dalla Mora, A.; Torricelli, A.; Pifferi, A.; et al. Time domain diffuse correlation spectroscopy with a high coherence pulsed source: In vivo and phantom results. Biomed. Opt. Express 2017, 8, 5311–5325. [Google Scholar] [CrossRef] [PubMed] [Green Version]
  155. Pagliazzi, M.; Konugolu Venkata Sekar, S.; Di Sieno, L.; Colombo, L.; Durduran, T.; Contini, D.; Torricelli, A.; Pifferi, A.; Dalla Mora, A. In vivo time-gated diffuse correlation spectroscopy at quasi-null source-detector separation. Opt. Lett. 2018, 43, 2450–2453. [Google Scholar] [CrossRef]
  156. Taroni, P.; Quarto, G.; Pifferi, A.; Abbate, F.; Balestreri, N.; Menna, S.; Cassano, E.; Cubeddu, R. Breast tissue composition and its dependence on demographic risk factors for breast cancer: Non-invasive assessment by time domain diffuse optical spectroscopy. PLoS ONE 2015, 10, e0128941. [Google Scholar] [CrossRef] [Green Version]
  157. Tosi, A.; Dalla Mora, A.; Zappa, F.; Cova, S.; Itzler, M.; Jiang, X. InGaAs/InP single-photon avalanche diodes show low dark counts and require moderate cooling. In Proceedings of the Photonics West, San Jose, CA, USA, 25–28 January 2009. [Google Scholar]
  158. Bargigia, I.; Tosi, A.; Bahgat Shehata, A.; Della Frera, A.; Farina, A.; Bassi, A.; Taroni, P.; Dalla Mora, A.; Zappa, F.; Cubeddu, R.; et al. Time-resolved diffuse optical spectroscopy up to 1700 nm by means of a time-gated InGaAs/InP single-photon avalanche diode. Appl. Spectrosc. 2012, 66, 944–950. [Google Scholar] [CrossRef]
  159. Konugolu Venkata Sekar, S.; Bargigia, I.; Dalla Mora, A.; Taroni, P.; Ruggeri, A.; Tosi, A.; Pifferi, A.; Farina, A. Diffuse optical characterization of collagen absorption from 500 to 1700 nm. J. Biomed. Opt. 2017, 22, 015006. [Google Scholar] [CrossRef] [PubMed] [Green Version]
  160. Tosi, A.; Della Frera, A.; Bahgat Shehata, A.; Scarcella, C. Fully programmable single-photon detection module for InGaAsInP single-photon avalanche diodes with clean and sub-nanosecond gating transitions. Rev. Sci. Instrum. 2012, 83, 013104. [Google Scholar] [CrossRef]
  161. Nachabé, R.; Hendriks, B.H.; Desjardins, A.E.; van der Voort, M.; van der Mark, M.B.; Sterenborg, H.J. Estimation of lipid and water concentrations in scattering media with diffuse optical spectroscopy from 900 to 1600 nm. J. Biomed. Opt. 2010, 15, 037015. [Google Scholar] [CrossRef]
  162. Martinenghi, E.; Di Sieno, L.; Contini, D.; Sanzaro, M.; Pifferi, A.; Dalla Mora, A. Time-resolved single-photon detection module based on silicon photomultiplier: A novel building block for time-correlated measurement systems. Rev. Sci. Instrum. 2016, 87, 073101. [Google Scholar] [CrossRef] [PubMed] [Green Version]
  163. Bruschini, C.; Homulle, H.; Antolovic, I.M.; Burri, S.; Charbon, E. Single-photon avalanche diode imagers in biophotonics: Review and outlook. Light Sci. Appl. 2019, 8, 87. [Google Scholar] [CrossRef] [PubMed]
  164. Hell, S.W.; Wichmann, J. Breaking the diffraction resolution limit by stimulated emission: Stimulated-emission-depletion fluorescence microscopy. Opt. Lett. 1994, 19, 780–782. [Google Scholar] [CrossRef] [PubMed]
  165. Hernández, I.C.; Buttafava, M.; Boso, G.; Diaspro, A.; Tosi, A.; Vicidomini, G. Gated STED microscopy with time-gated single-photon avalanche diode. Biomed. Opt. Express 2015, 6, 2258–2267. [Google Scholar] [CrossRef] [PubMed] [Green Version]
  166. Chan, S.; Halimi, A.; Zhu, F.; Gyongy, I.; Henderson, R.K.; Bowman, R.; McLaughlin, S.; Buller, G.S.; Leach, J. Long-range depth imaging using a single-photon detector array and non-local data fusion. Sci. Rep. 2019, 9, 8075. [Google Scholar] [CrossRef] [Green Version]
  167. Maccarone, A.; McCarthy, A.; Ren, X.; Warburton, R.E.; Wallace, A.M.; Moffat, J.; Petillot, Y.; Buller, G.S. Underwater depth imaging using time-correlated single-photon counting. Opt. Express 2015, 23, 33911–33926. [Google Scholar] [CrossRef]
  168. Buttafava, M.; Zeman, J.; Tosi, A.; Eliceiri, K.; Velten, A. Non-line-of-sight imaging using a time-gated single photon avalanche diode. Opt. Express 2015, 23, 20997–21011. [Google Scholar] [CrossRef] [Green Version]
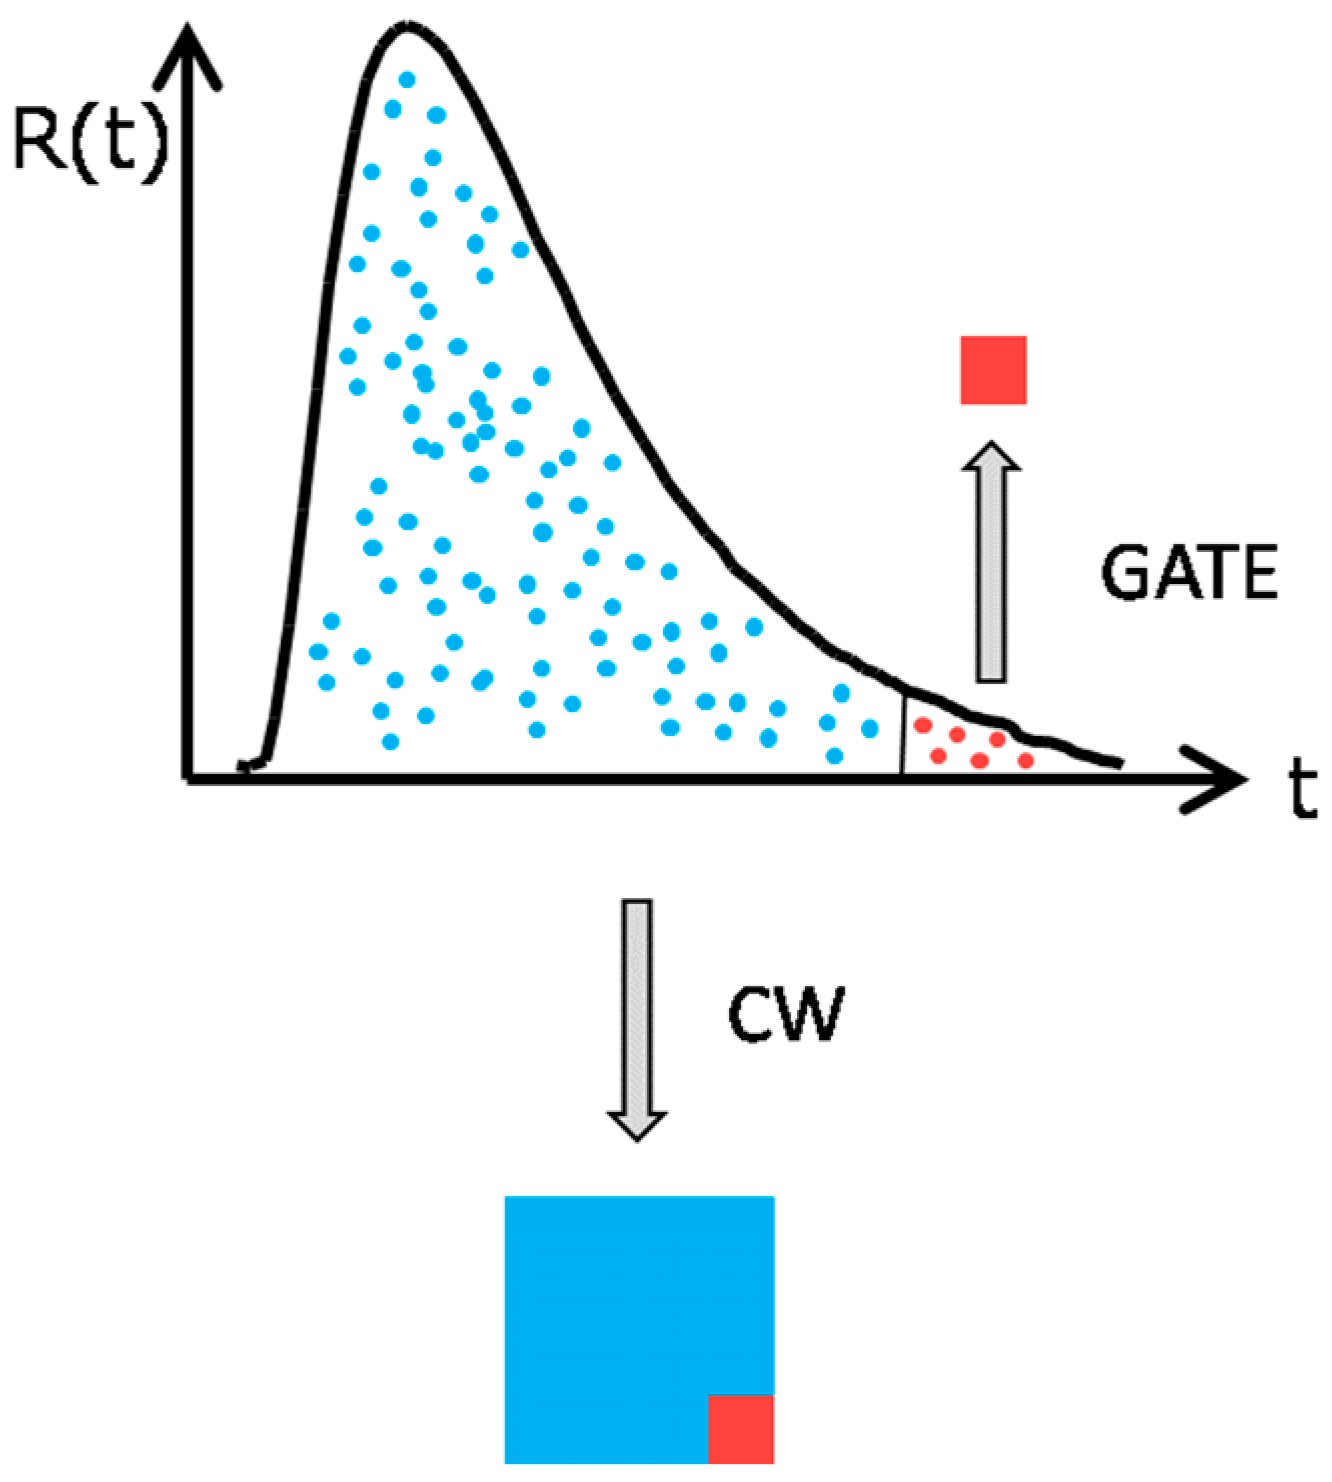
Figure 1. Using time-gating it is possible to extract few late photons (red) carrying information from deeper regions. Conversely, a classical continuous wave (CW) measurement (blue and red) mix all the photons, diluting depth sensitivity.
Applsci 10 01101 g001
Figure 2. The null source-detector distance (ρ) increases the number of collected photons at all times with respect to a larger ρ (modified from [38]).
Applsci 10 01101 g002
Figure 3. The depth sensitivity of a TD reflectance measurements to localized optical perturbations is dependent on the photon arrival time and independent of ρ. The limiting case of ρ = 0 corresponds to the most spatially confined sensitivity map (modified from [38]). The contour lines correspond to time ranging from 0.5 to 4 ns at steps of 0.5 ns.
Applsci 10 01101 g003
Figure 4. The ρ = 0 case improves contrast at all times with respect to a larger ρ (modified from [38]).
Applsci 10 01101 g004
Figure 5. The ρ = 0 case improves spatial resolution at all times with respect to a larger ρ (modified from [38]).
Applsci 10 01101 g005
Figure 6. Simulations of the relative contrast produced by a 1 cm3 optical inhomogeneity as a function of depth z in a tissue-like medium for an ideal time-domain, TD (blue continuous lines) or CW (red dashed lines) system. The detectability region (white zone) is identified by a relative contrast >1% and a quantum noise <1%. Reprinted with permission from [61] ©The Optical Society.
Applsci 10 01101 g006
Figure 7. Basic electrical circuit of a time-gated (TG) single-photon avalanche diodes (SPADs) [31]. The gate pulse is provided by the voltage pulse generator (VG). The SPAD is reversely biased at a voltage-VB. The comparator switches its output (OUT) when the voltage at the positive input exceeds a threshold voltage VT. Supposing that no avalanche occurs during the gate-ON time, the positive input of the comparator is reached by 2 voltage spikes due to the application of fast voltage transition at the cathode side of the SPAD, which can trigger the comparator if exceeding VT.
Applsci 10 01101 g007
Figure 8. Gate voltage signal (blue line) provided to the SPAD front-end circuit of Figure 7 and resulting SPAD voltage signal at the positive input of the comparator (red line) without photon detection (a) and with a single-photon detection (b) [31]. The red arrow indicates the arrival delay of a photon inside the gate. Dummy voltage signal (black line) generated by providing the same gate signal to a capacitor that only mimics the SPAD parasitic behavior, without being able to detect photons. If the dummy signal is provided to the negative input of the comparator of Figure 7: (a) SPAD and dummy signal do not cross, thus avoiding triggering the comparator and the following timing electronics when no avalanche occurs; (b) the SPAD signal exceeds the dummy signal when the photon is detected, thus forcing the comparator to switch, triggering the following timing electronics. A more detailed discussion of these waveforms can be found in [31,66].
Applsci 10 01101 g008
Figure 9. Schematic concept of TG optical waveform acquisition. (a) Optical waveform (red line) and background noise (black line) as detected by a free-running detector; (b) same waveform detected by a TG SPAD: different slices of the signal are acquired at different delays, increasing the signal on the detector through a variable optical attenuator to increase the photon detection rate at delays where the signal is weaker; (c) after normalization for the attenuation introduced, slices are combined to reconstruct the signal over a wide dynamic range. In this way the signal is extracted from background noise at late times, where a standard free-running system could not detect photons in the same acquisition time.
Applsci 10 01101 g009
Figure 10. Contrast (top panel group) and contrast-to-noise ratio (CNR) (bottom panel group) produced by a localized absorption perturbation within a scattering medium (see Ref. [102] for additional details) as a function of the gate-ON delay of the SPAD. In each panel group, the perturbation is set at different depths along the rows, while along the columns different intensities of the memory effect are simulated. Different colors represent different source-detector distances, listed in the legend in mm.
Applsci 10 01101 g010
Figure 11. Relative changes with respect to the baseline of oxy-(O2Hb) and deoxy-hemoglobin (HHB) in the contralateral hemisphere during a finger tapping exercise. On the (a,c) results obtained using the TG approach while on the (b,d) with a standard one (i.e., not gated). Rows represents the ρ (a,b): 6 mm; (c,d): 30 mm [115].
Applsci 10 01101 g011
Figure 12. Retrieved absorption coefficient for measurements done with a single fiber [130].
Applsci 10 01101 g012
Figure 13. 2D maps of an inclusion (Δμa = 0.5 cm−1) buried at different depths (rows) inside a homogeneous medium (optical properties: μa = 0.1 cm−1 and μs = 10 cm−1) obtained using non-gated and gated approaches for both 5 and 15 mm ρ. The red circle represents the true position of the inclusion. Dimensions of the plane are in mm. For more depths and the geometry of the maps, see Ref. [143].
Applsci 10 01101 g013
Figure 14. Reconstructions of inclusion I1 and I2 (set at the same depth, 15 or 25 mm), obtained for 10 and 15 mm ρ. Results obtained in the same conditions (inclusion depth and ρ) are computed both on simulated and experimental curves [144]. In the simulation, spherical perturbations were used while in the measurements cylindrical (almost rectangular) ones were adopted. However, it has been demonstrated for totally absorption inclusion that different shapes (e.g., cylinder or sphere as in this case) yield to comparable optical perturbation provided that the volume is the same [145].
Applsci 10 01101 g014
Figure 15. On the (left), maps of recovered oxy- and deoxy-hemoglobin. On the (right), volume used for reconstruction (top) and the mouse after the flap surgery with indication of source (S) and detector (D) fibers position. Figure modified from [147].
Applsci 10 01101 g015
Figure 16. Relative blood flow index (BFI) during an arterial cuff occlusion recovered from the hardware correlator for both non-gated acquisition and gated one (figure generated with data taken from Ref. [155]).
Applsci 10 01101 g016