Article

A High-Accuracy Mathematical Morphology and Multilayer Perceptron-Based Approach for Melanoma Detection

by
Luz-María Sánchez-Reyes
1,
Juvenal Rodríguez-Reséndiz
1,*,
Sebastián Salazar-Colores
2,
Gloria Nélida Avecilla-Ramírez
3 and
Gerardo Israel Pérez-Soto
1
1
Facultad de Ingeniería, Universidad Autónoma de Querétaro, Querétaro 76010, Mexico
2
Centro de Investigaciones en Óptica, León, Guanajuato 37150, Mexico
3
Facultad de Psicología, Universidad Autónoma de Querétaro, Querétaro 76010, Mexico
*
Author to whom correspondence should be addressed.
Appl. Sci. 2020, 10(3), 1098; https://doi.org/10.3390/app10031098
Submission received: 16 December 2019 / Revised: 25 January 2020 / Accepted: 27 January 2020 / Published: 6 February 2020
(This article belongs to the Special Issue Image Processing Techniques for Biomedical Applications)

Abstract

:
According to the World Health Organization (WHO), melanoma is the most severe type of skin cancer and is the leading cause of death from skin cancer worldwide. Certain features of melanoma include size, shape, color, or texture changes of a mole. In this work, a novel, robust and efficient method for the detection and classification of melanoma in simple and dermatological images is proposed. It is achieved by using HSV (Hue, Saturation, Value) color space along with mathematical morphology and a Gaussian filter to detect the region of interest and estimate four descriptors: symmetry, edge, color, and size. Although these descriptors have been used for several years, the way they are computed for this proposal is one of the things that enhances the results. Subsequently, a multilayer perceptron is employed to classify between malignant and benign melanoma. Three datasets of simple and dermatological images commonly used in the literature were employed to train and evaluate the performance of the proposed method. According to k-fold cross-validation, the method outperforms three state-of-art works, achieving an accuracy of 98.5% and 98.6%, a sensitivity of 96.68% and 98.05%, and a specificity of 98.15%, and 98.01%, in simple and dermatological images, respectively. The results have proven that its use as an assistive device for the detection of melanoma would improve reliability levels compared to conventional methods.

1. Introduction

Malignant melanoma is one of the most lethal skin tumors due to its high metastasis capacity and high chemoresistance. In recent years, skin cancer has become one of the leading causes of death. As of 2014, in the Americas, there were 2.8 million new cases and 1.3 million deaths as a result of skin cancer. Projections indicate that the number of cancer deaths will increase from 1.3 million in 2014 to 2.1 million in 2030. Approximately 47% of cancer deaths in the Americas occurred in Latin America and the Caribbean; research suggests that this cancer rate is due to the amount of sun exposure and solar radiation levels [1].
The International Labor Organization (ILO) reports that 56% of the rural of the world population has no health insurance, compared to 22% of people living in urban areas. Specifically, in Mexico, cutaneous melanoma represents 23% of skin tumors seen at the National Cancer Institute. The number of patients with melanoma corresponding to medium and low socioeconomic strata is 77.1%. According to an analysis of the number of cases of melanoma in recent years, there is an increase of approximately 500%, which indicates an alarming problem [2,3,4].
In medical centers, the conventional tools used to diagnose melanomas are digital dermoscopy analysis. These tools are non-invasive techniques based on the use of incident light to achieve better visualization of the skin used for dermatological imaging. Their accuracy depends on prior training with the method. Since these techniques are not direct methods but are only part of the stage to improve the visualization of the skin, the precision lies in the dermatology specialist who evaluates the image delivered by the device. Therefore, it is essential to develop automated equipment that guarantees a certain level of reliability and efficiency [5,6,7,8,9,10,11,12].
Biomedical image processing has become one of the most advanced fields in computer vision. The fundamental objective of the projects carried out is to improve the medical information obtained, which means an increase in the diagnosis and, therefore, in its reliability. Medical images are mainly characterized by the difficulty of generating valid data to process. The pictures have a large amount of noise and considerable variability in their properties [13,14]. Image processing consists of a process in which the picture attributes are extracted or isolated to enhance image results. The impact of this discipline has been very relevant, and it has been applied in a number of different disciplines, such as medicine, telecommunications, industrial process control, and entertainment [7]. According to the literature, image processing can be a useful tool for melanoma detection [15].
Melanoma is a type of skin cancer formed in cells known as melanocytes, responsible for the production of melanin (a pigment that gives skin its color) [16,17]. The American Academy of Dermatology uses the ABCD rule to identify melanoma. The ABCD rule was introduced in 1985 [18,
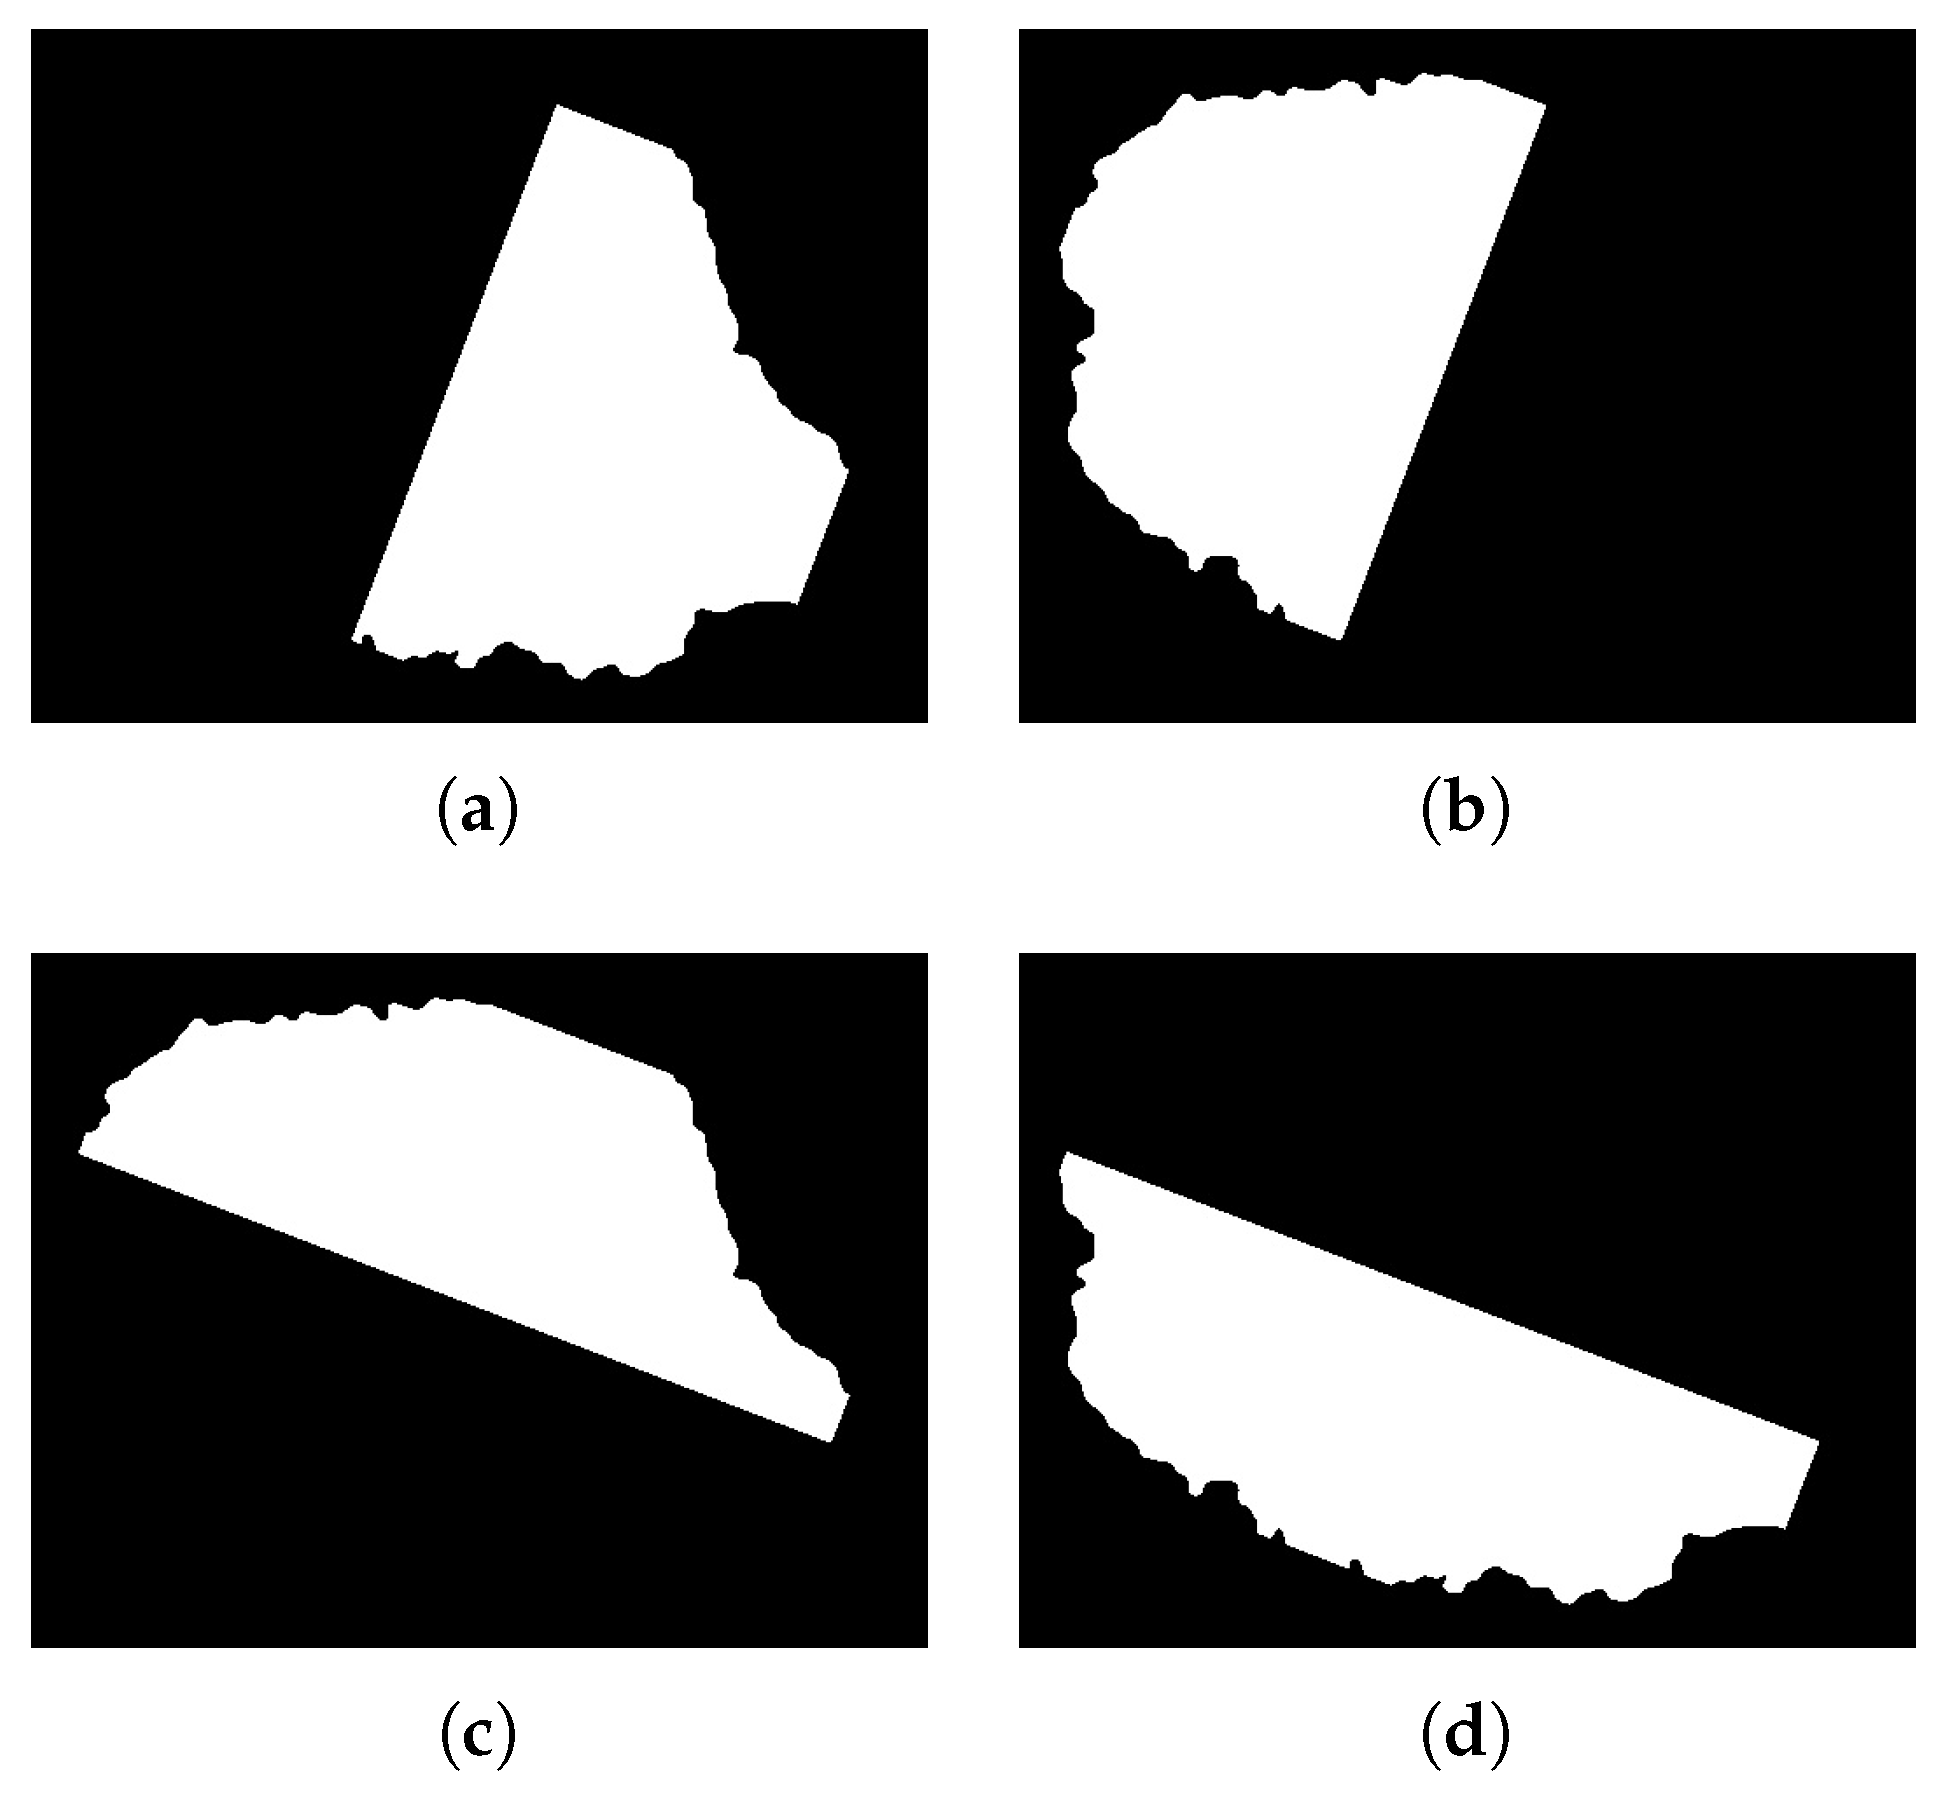
19] and states that the four main descriptors for identification are:
  • A: Symmetry
  • B: Edge
  • C: Color
  • D: Size
Each of the above descriptors are estimated and weighted according to the technique used to classify them. Although throughout the years several methods have been developed to detect melanoma using the evaluation of these descriptors, they differ from each other in the way to estimate them [20,21,22,23,24,25,26].
Kostopoulos et al. [27] present an algorithm which is focused on simple images, evaluates the descriptors of the ABCD rule, and uses probabilistic neural networks for their classification. Symmetry is estimated by identifying the contour and the maximum axis that can be formed considering the center. As for color, the RGB color space is used, and the histogram is determined. The best efficiency was achieved with multi-center images and was around 90%. In the same year, Do et al. [28] designed a mobile system for melanoma detection. The cell phone captures the images with visible light and evaluates the four descriptors of the ABCD rule. A Gaussian model was used to estimate its descriptors; the dataset contained different skin tones. Achieved efficiency average was 85%. The application is designed to detect only one melanoma for each image.
Giotis et al. [29] propose a supporting system for specialists focused on this area. The system works with simple images, performs segmentation, and calculates color (RGB as color space) and texture. The specialists provide a set of visual attributes, and according to the results of the descriptors, a decision is taken, so it can thus be regarded a semi-automatic system. The ranking is obtained by the majority of votes in the predictions. They reported an efficiency of 81%.
Zamani et al. [30] worked with the Daugman Transformation for the extraction of image characteristics and achieved better efficiency in the detection of melanoma. They do not evaluate symmetry; they only estimate the shape, color, and texture. During the evaluation of the different descriptors, the image is processed in both RGB and CIELAB color spaces. The method focused on dermatological images, used Support Vector Machine (SVM) for classification, and achieved an efficiency close to 96%.
Li et al. [31] use a double classification to achieve greater effectiveness using dermatological images. They reached an efficiency between 75% and 92%. Yuan et al. [32] use dermatological images. They use several color spaces to improve the efficiency in the detection of melanoma; some are RGB and CIELAB. The study focuses on contour detection and color dispersion. They achieved a Jaccard Index of 0.765. Table 1 shows relevant research in the literature focused on the detection of melanoma using image processing.
The aforementioned studies have an efficiency between 70% and 96%, and they are only designed for one type of image (dermatological or simple), mostly working with RGB and CIELAB color space, and symmetry evaluation is performed in a similar way or the descriptor is not considered.
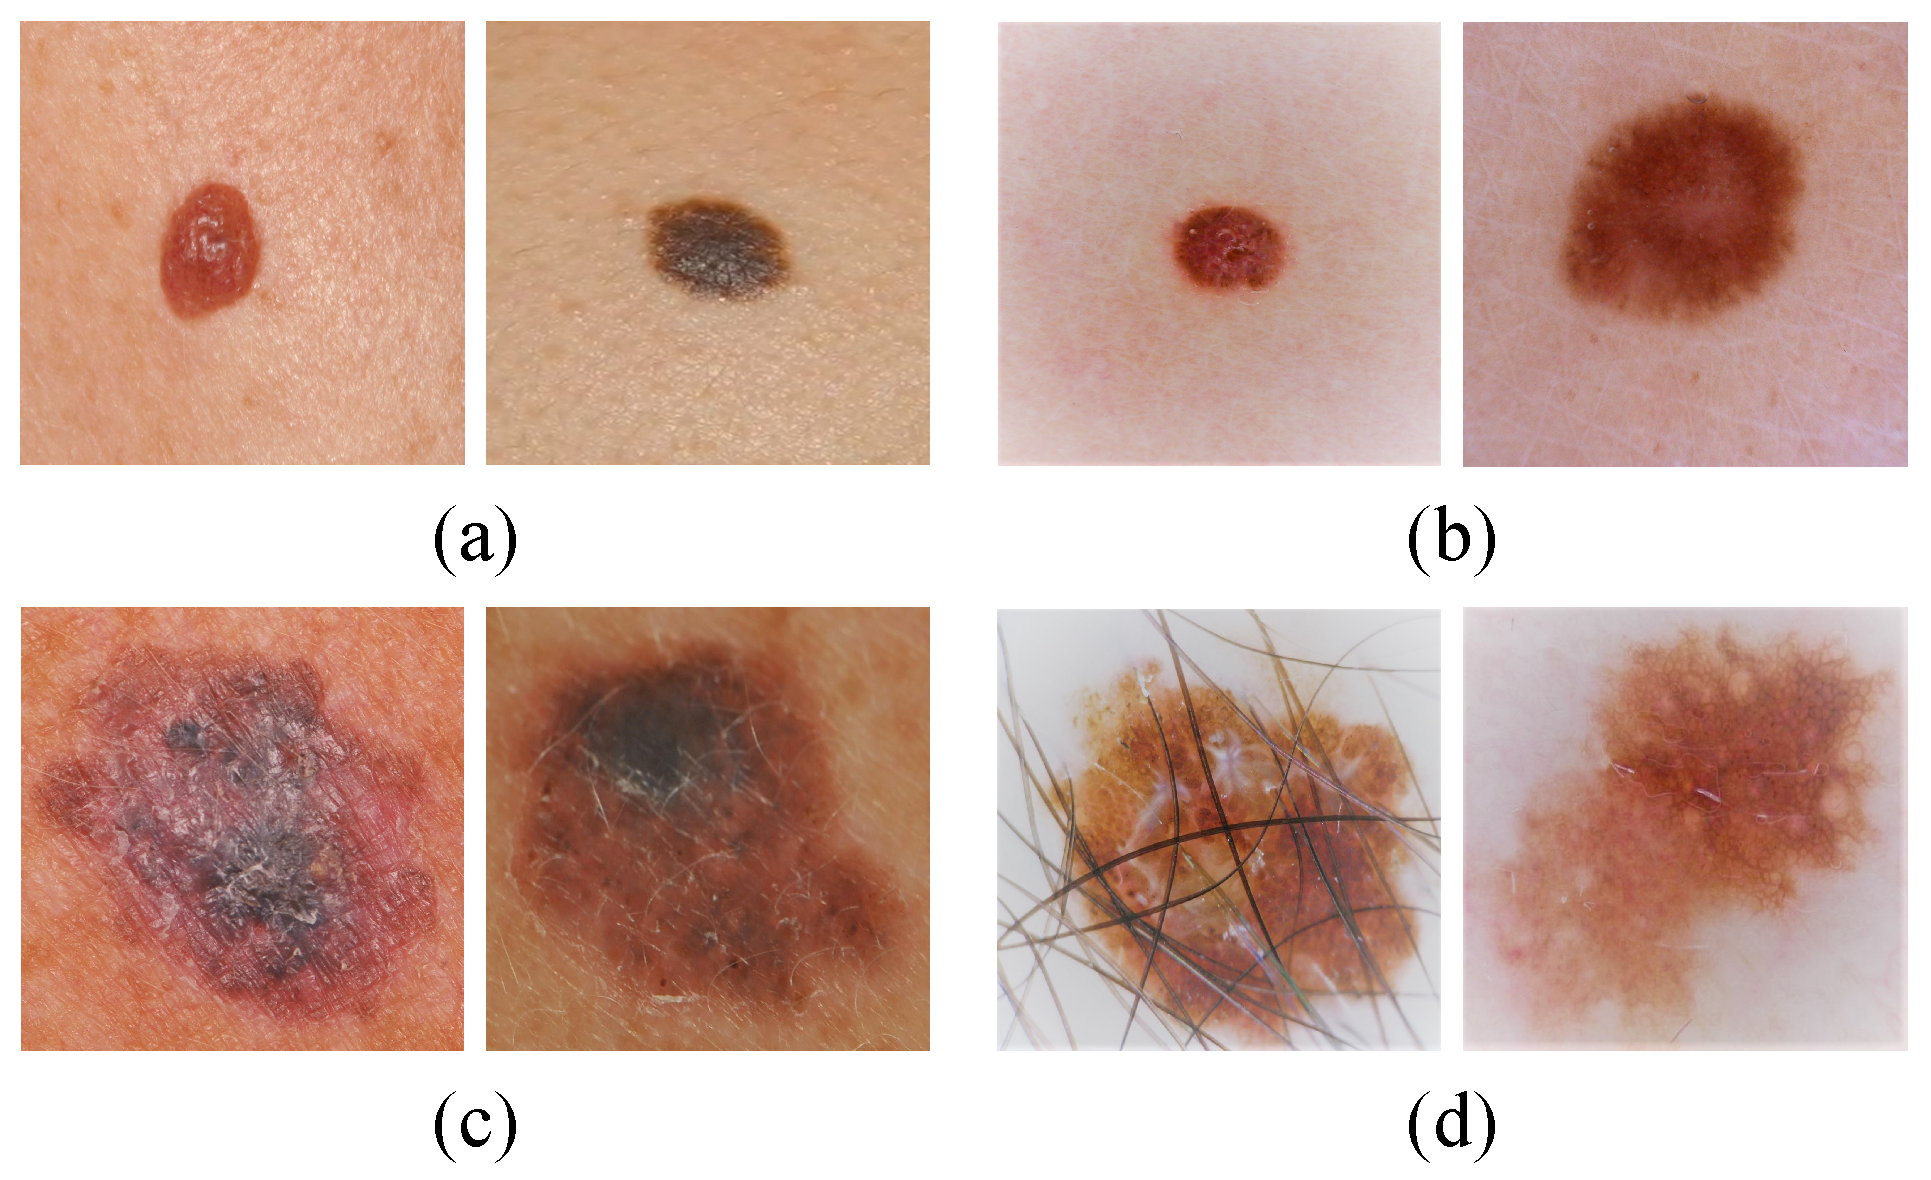
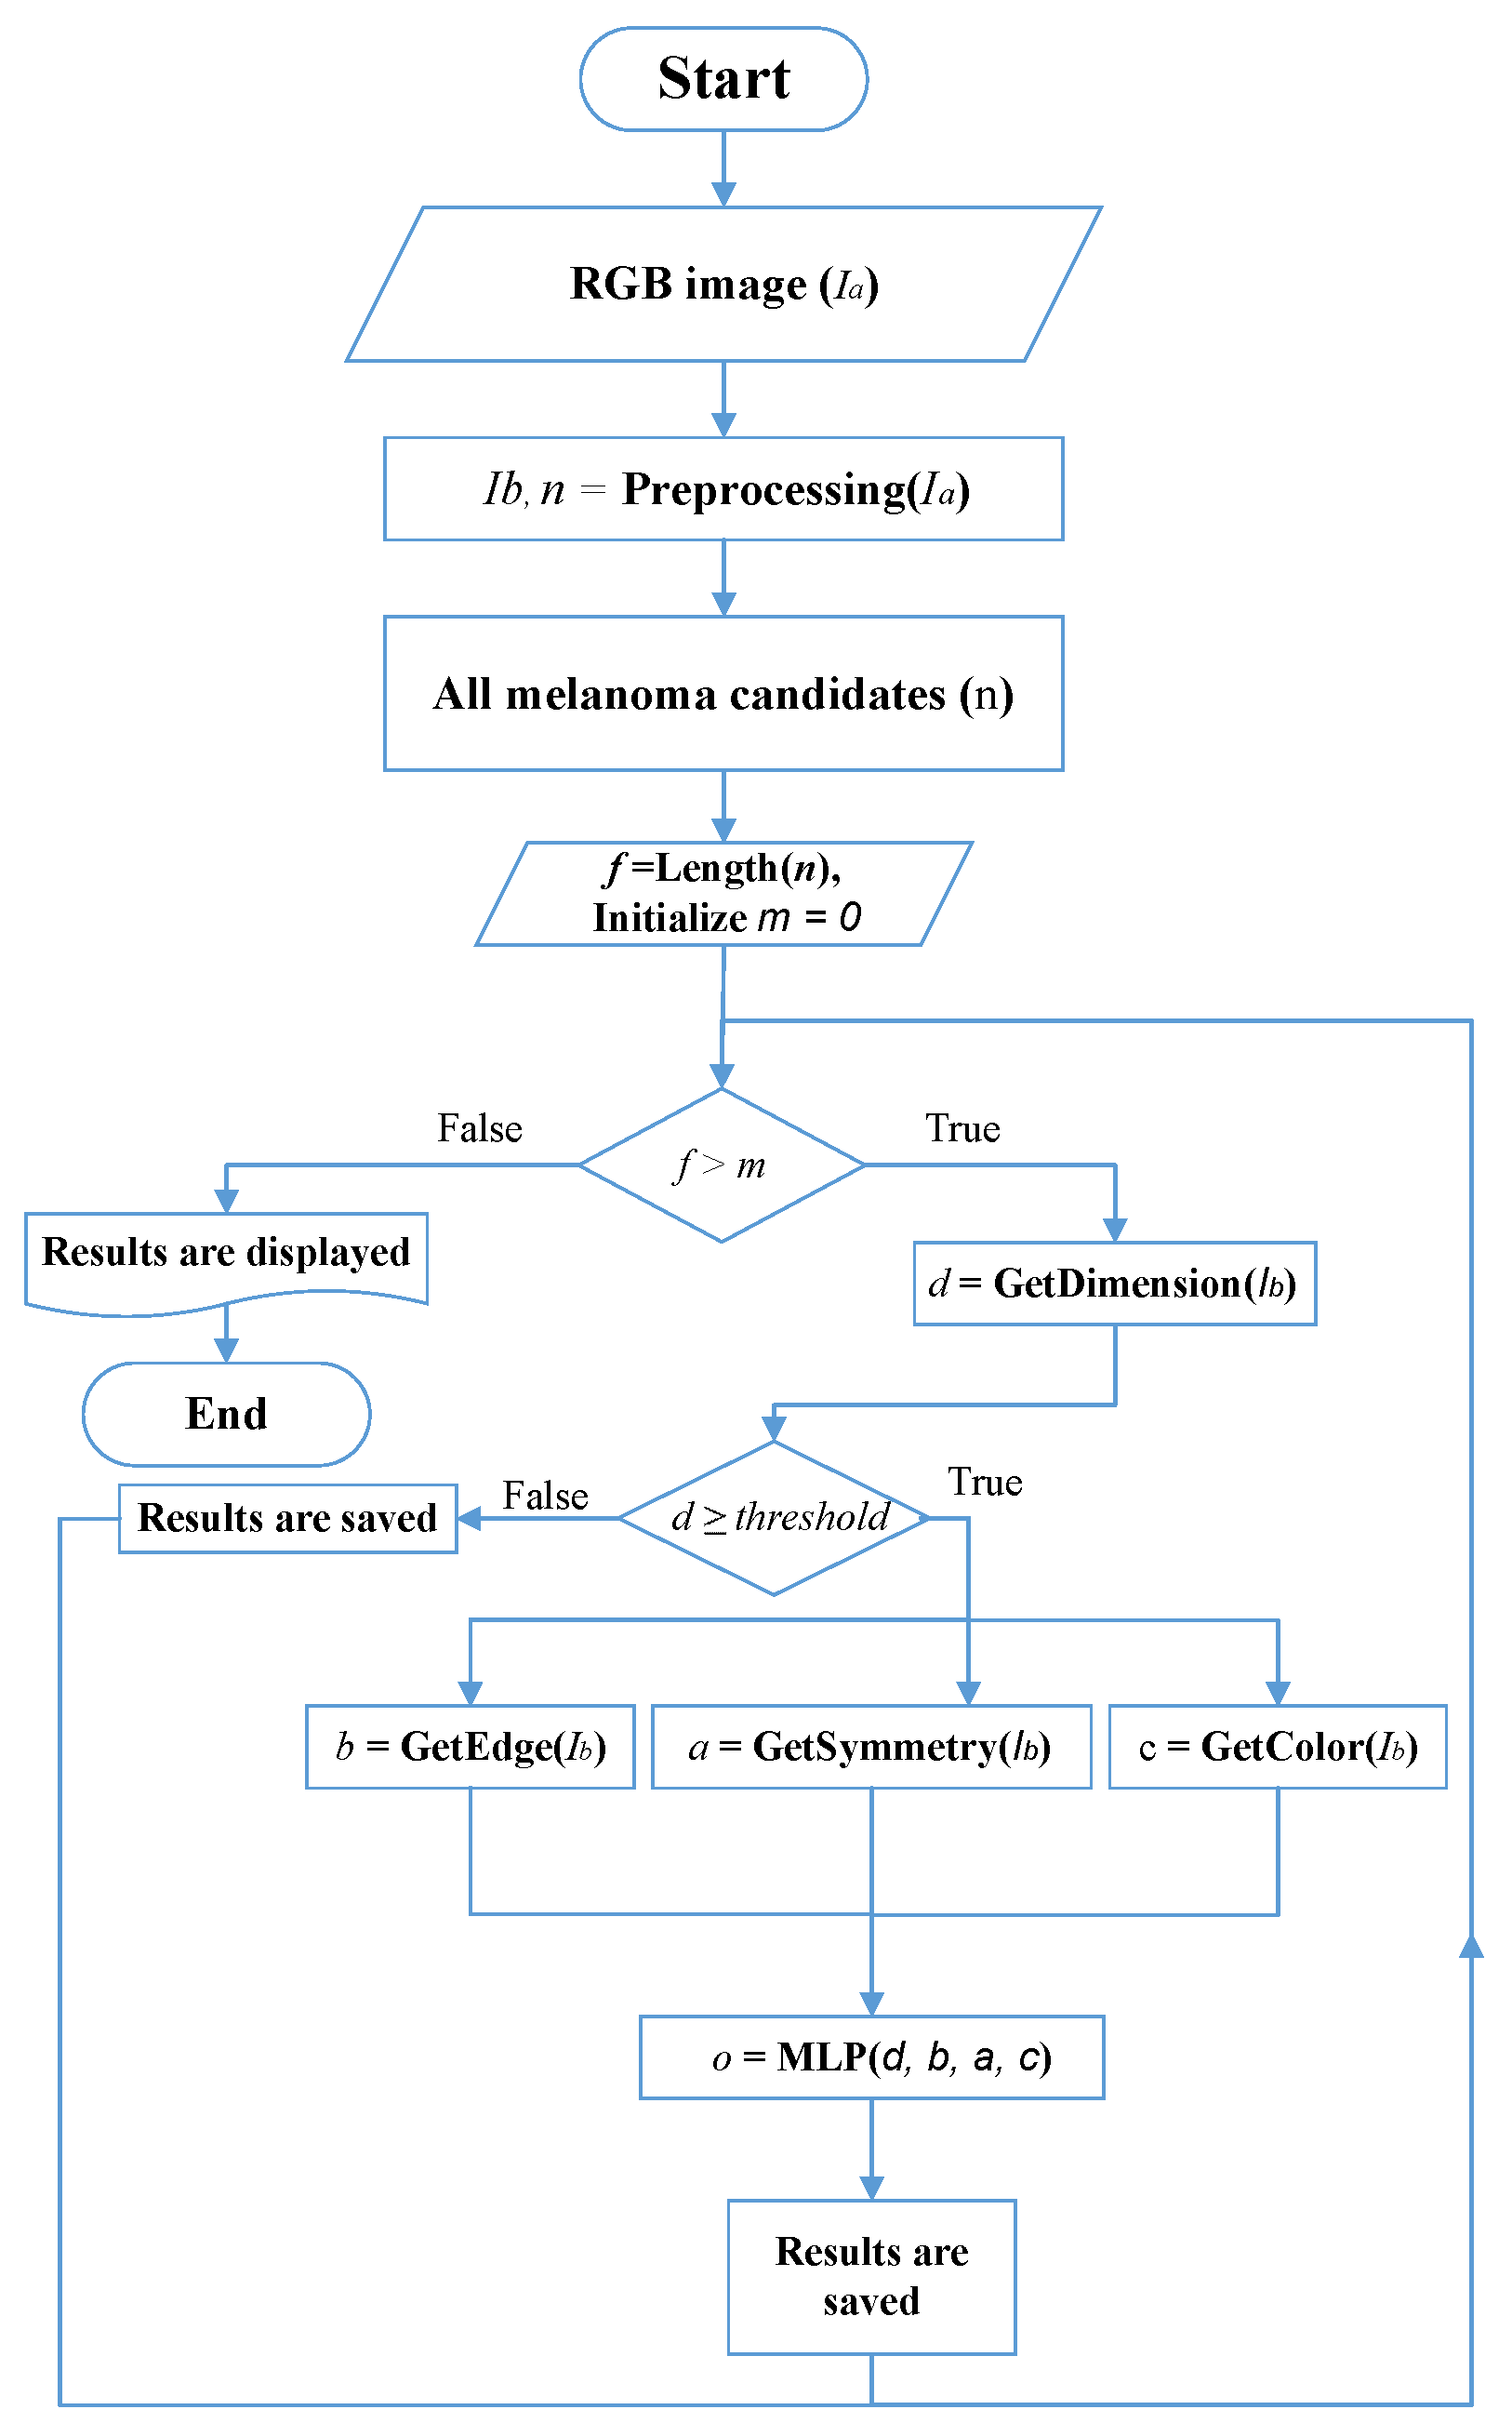
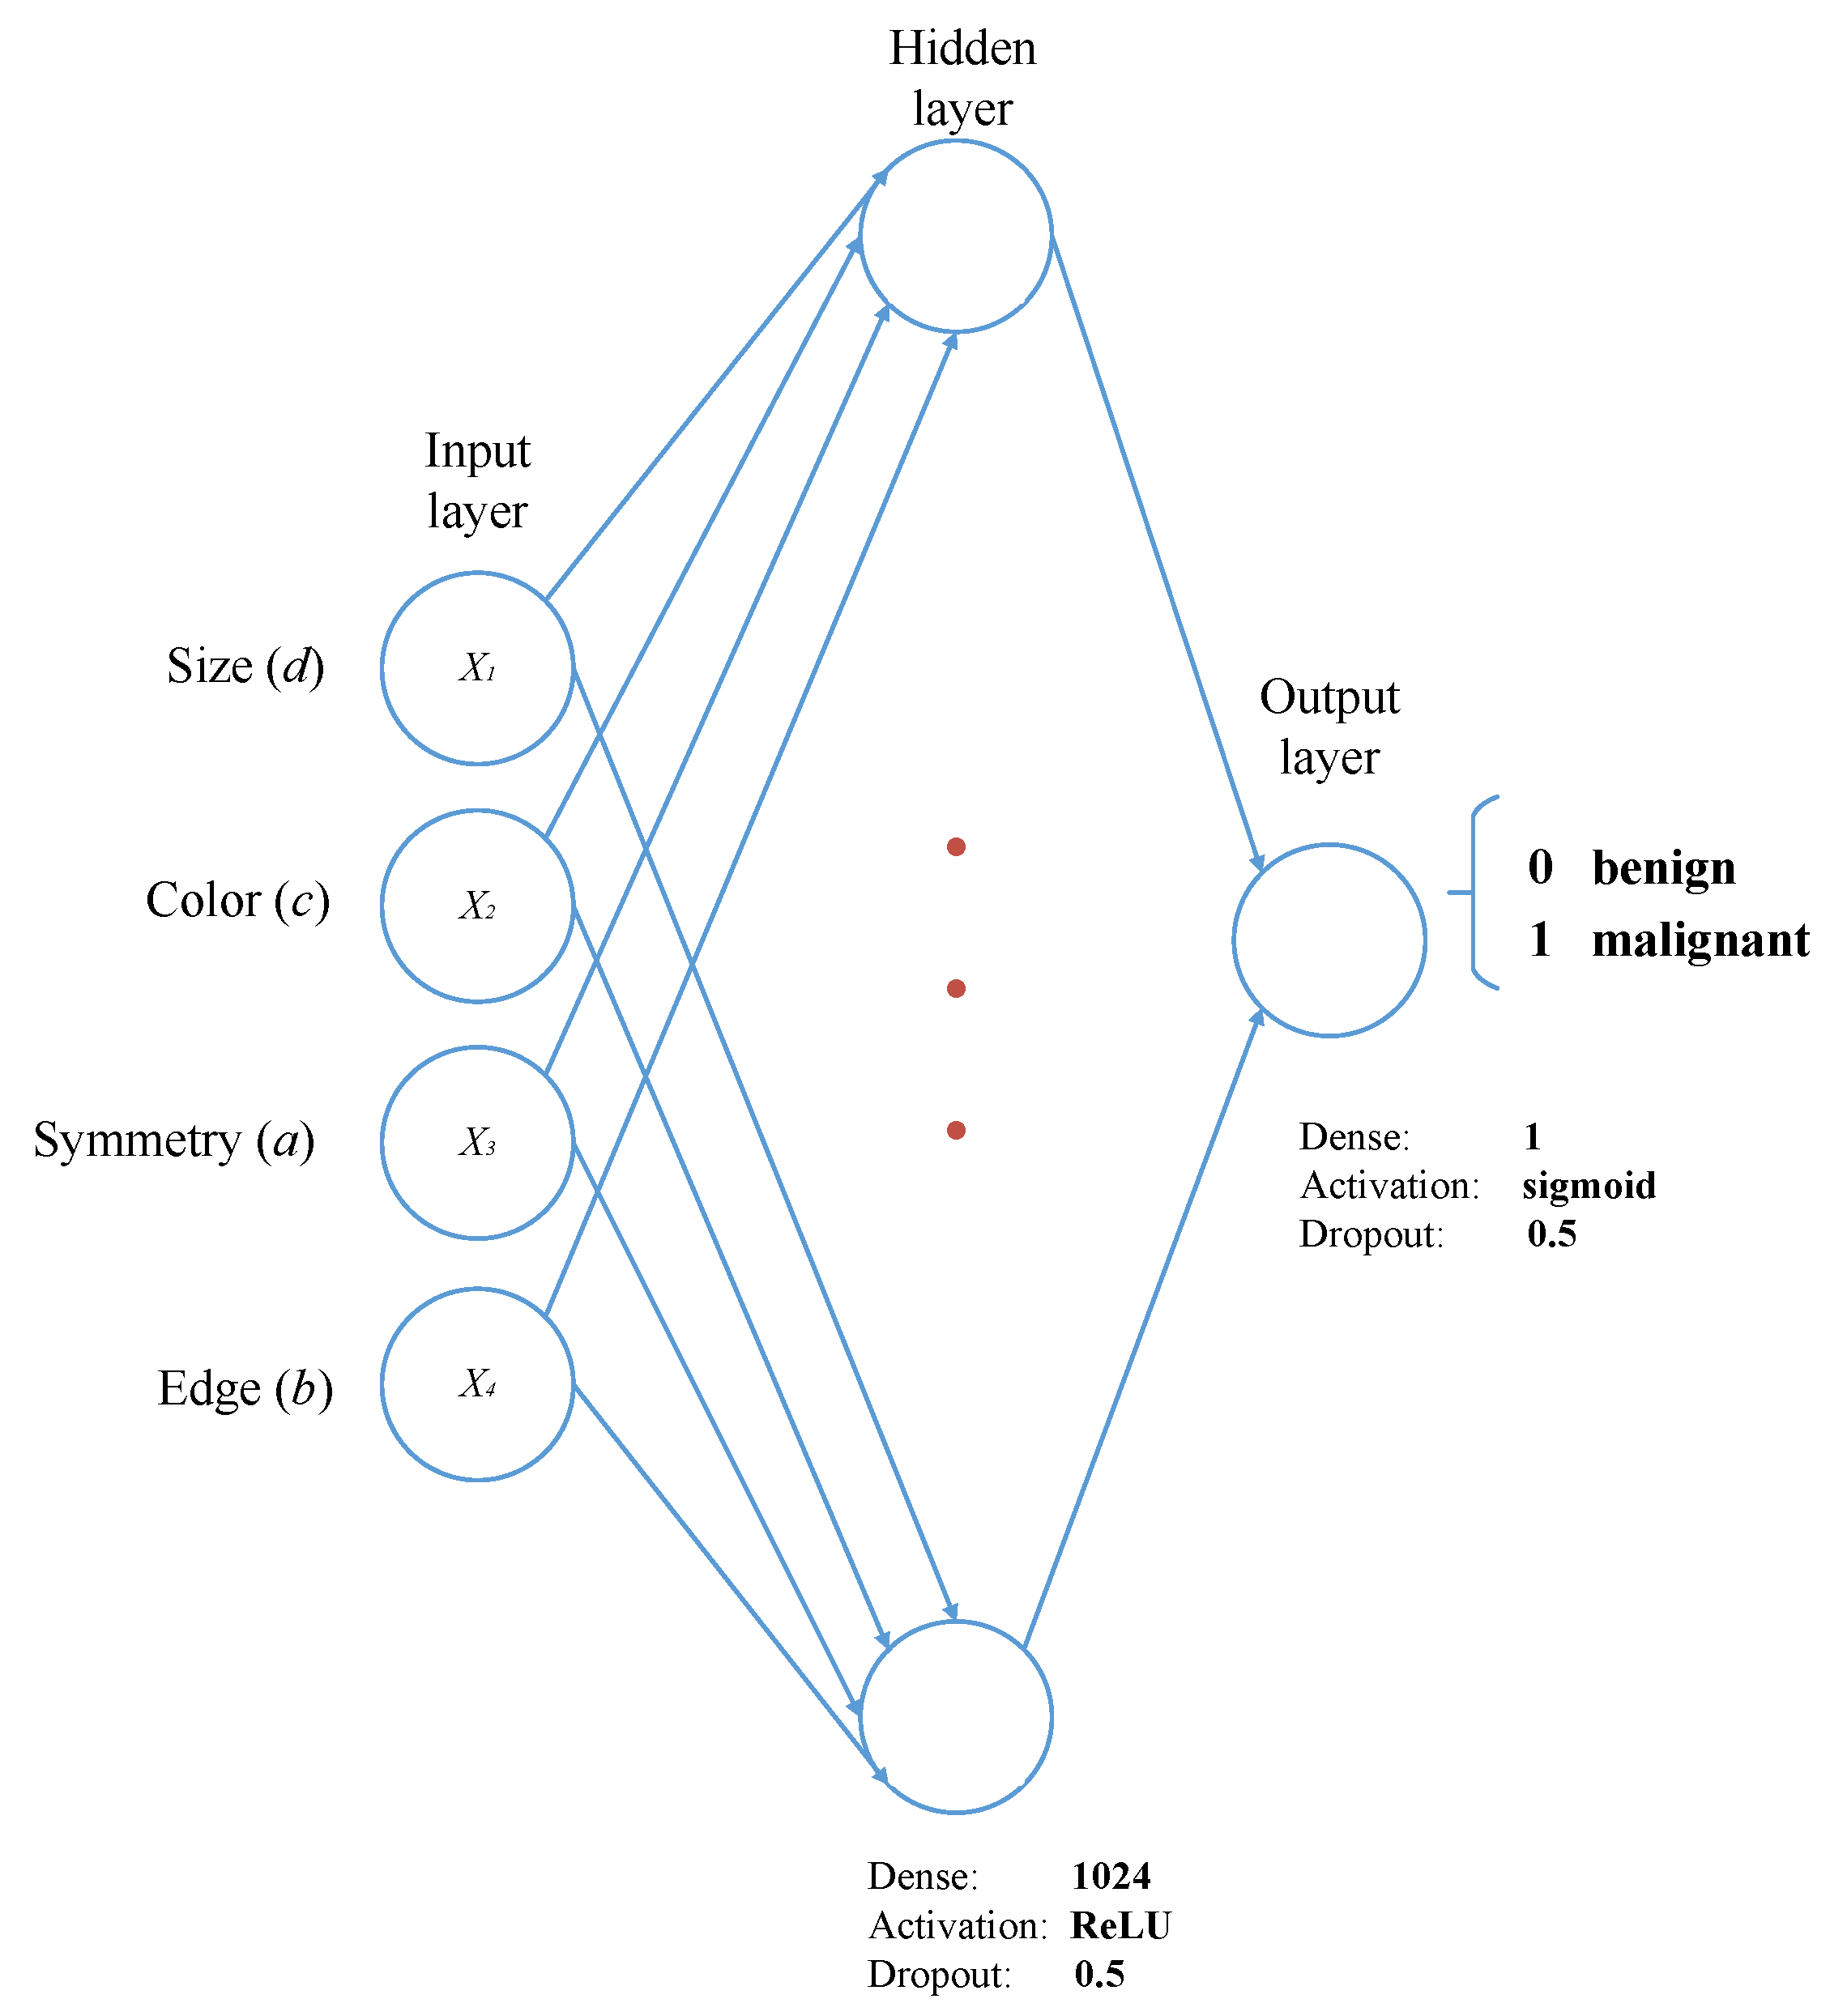
In this research, an efficient and novel method for the detection and classification of melanoma is developed. The algorithm can run using simple images, which are acquired with an RGB camera, as well as dermatological images, which are acquired with professional equipment. It was designed to estimate four descriptors (symmetry, edge, color, size), which are subsequently used as inputs for the classifier. A multilayer perceptron was used to classify between malignant and benign melanoma. Finally, k-fold cross-validation, an analysis of variances and a t-student test were used to validate the robustness and reliability of the method. Moreover, the method developed is capable of detecting more than one case of melanoma in the same image, even if there is some hair present in the picture.
The paper is organized as follows: Section 2 contains the main stages of the proposed method. Section 3 includes the results and discussions. Finally, in Section 4, the conclusions of the article and future work are mentioned.

2. Materials and Methods

2.1. Image Dataset

An image compilation of 1390 images, integrated by the three most used state-of-the-art dataset, was created to train and evaluate the proposal. The simple images dataset (466 images) and dermatological images dataset (924) were created using [29,39,41], respectively. The database was supported by histopathology tests and melanoma specialists ruling [41], skin images were 1022 × 767 pixels, and their labels correspond to cases of melanocytic lesions that were benign and malignant in nature.
The compilation encompasses cases of images with hair in them, with more than one melanoma, without melanoma (only skin), with different skin tones and with varying degrees of severity for malignant melanoma. Figure 1 shows examples of dermatological and simple images obtained from the datasets.

2.2. Proposed Method

The proposed method is defined as follows: conditioning and identification of skin color (pre-processing), feature extraction, and classification. Algorithm 1 shows the pseudocode corresponding to the proposed method. Figure 2 illustrates the flowchart of the proposal.
Algorithm 1 Stages of the proposed method, showing lines 1–8, and annotated with letters (a)–(d), corresponding to the images in Figure 3.
Input: I a , input image.
Output:o, classifier output.
1:procedureProposed Method( I a )▹ (a)
2:     I b , n = P r e p r o c e s s i n g ( I a ) ▹ (b), n all melanoma candidates
3:    for all n do
4:         d = g e t _ S i z e ( I b )
5:         c = g e t _ C o l o r ( I b )
6:         a = g e t _ S y m m e t r y ( I b ) ▹ (c)
7:         b = g e t _ E d g e ( I b ) ▹ (d)
8:         o = s k i n , if M L P ( a , b , c , d ) = 1 b e n i g n , if M L P ( a , b , c , d ) = 0 m a l i g n a n t , otherwise . a,b,c and d are the ABCD descriptors.
Then, each stage of the proposed method is described in detail beginning with the elimination of skin and noise.

2.2.1. Pre-Processing Stage

First, a Gaussian smoothing filter is applied, which is a filter that is widely used in the pre-processing stage in computer vision algorithms because it eliminates noise in the image and generates a uniform smoothing [13]. Gaussian function is defined as
G 0 ( x , y ) = A e ( x μ x ) 2 2 σ x 2 ( y μ y ) 2 2 σ y 2
where μ is the mean (the peak), A is a constant, σ represents the standard deviation (for each of the variables x and y), and (x,y) is the pixel location.
Subsequently, the image is converted to the HSV color space to identify the skin color and remove it from the image. The HSV color space is obtained by a nonlinear transformation of RGB color space into cylindrical coordinates so that each channel is defined by hue, saturation, and brightness (value) [16].
Once the image is converted to this color space, several color samples are taken at the corners of the image to identify the skin color. These values are compared until the ranges are determined and the threshold levels are identified. Skin color is detected for each image evaluated. Therefore, the threshold range changes for each one. Since the skin color is established automatically, the algorithm works for all skin tones.
When the color ranges are identified and the thresholding is applied, the skin is black, and the possible cases of melanoma are white. Then, a series of filters are applied: Gaussian, morphological erosion, and dilation to remove image noise. Equation (2) corresponds to erosion where X is a set that represents the binary image, A the structuring element, ε A ( X ) the erosion of X with structuring element A, and x the points belonging to the set X such that A, transferred in x, is fully included in X [22]. Equation (3) corresponds to dilatation where X is a set that represents the binary image, A the structuring element, δ A ( X ) the expansion of X with structuring element A, and p points such that A intersects X when the reference point of the structuring element is transferred to p [16]:
ε A ( X ) = { x : A x X }
δ A ( X ) = { p : A p X 0 }
Algorithm 2 shows the corresponding pseudocode for image conditioning, skin removal, and identification of possible cases of melanoma. Figure 4 shows four examples of conditioning and identification of potential cases of melanoma.
Algorithm 2 Proposed method for skin removal, showing lines 1–13, corresponding to the images in Figure 3b.
Input: I a , input image.
Output: I f , skinless and denoised image.
1:procedurePreprocessing( I a )
2:     I b = G a u s s i a n B l u r ( I a )
3:     I c = c o n v e r t _ R G B t o H S V ( I b )
4:     h , s , v = g e t _ S p l i t ( I c )
5:     h m i n , h m a x = g e t _ R a n g e s C o r n e r s ( h )
6:     s m i n , s m a x = g e t _ R a n g e s C o r n e r s ( s )
7:     v m i n , v m a x = g e t _ R a n g e s C o r n e r s ( v )
8:     I d =zeros(size(h))
9:    for ( x , y ) h do
10:         I d ( x , y ) = 1 , if h m i n < h ( x , y ) < h m a x   & s m i n < s ( x , y ) < s m a x   & v m i n < v ( x , y ) < v m a x 0 , otherwise .
11:     I e = E r o s i o n ( I d , K 1 )
12:     I f = D i l a t i o n ( I e , K 2 ) K 1 , K 2 are the kernel
13:    return I f

2.2.2. Feature Extraction Stage

∂ Size (d)
At the end of the conditioning stage, the image contains all possible cases of melanoma, these cases are quantified, and, for each possible case, the four descriptors of the ABCD rule are estimated.
The first descriptor to be estimated is size (d). The contour is marked, the area is calculated, and the quotient is calculated to assess the size. The value obtained is compared with the range determined during training and, if it is a case of melanoma, the evaluation of the other descriptors is continued. Otherwise, the next possible case of melanoma is passed. Algorithm 3 shows the corresponding pseudocode for size evaluation. The threshold determined for the size is defined according to the relationship between the original dimensions, the equivalent pixels in the quantification of the area, and the data reported by the World Health Organization (WHO).
Algorithm 3 Proposed method to evaluate size (d), showing lines 1–7.
Input: I a , input image.
Output:d, estimated value for edge.
1:procedureget_Size( I a )
2:     I b = c o n v e r t _ R G B t o G R A Y ( I a )
3:     I c = g e t _ C o n t o u r s ( I b )
4:     I d = g e t _ A r e a ( I c )
5:     I e = g e t _ A r e a ( I a )
6:     d = I d I e
7:    return d▹ The recovered value.
∂ Color (c)
The color dispersion (c) is estimated with the histogram of the h channel. The difference between our descriptor and those reported in the literature [16] is the color space used in combination with the channel. Algorithm 4 shows the corresponding pseudocode for color evaluation.
Algorithm 4 Proposed method to evaluate color dispersion (c), showing lines 1–9.
Input: I a , input image.
Output:c, estimated value for color.
1:procedureget_color( I a )
2:     I b = c o n v e r t _ R G B t o H S V ( I a )
3:     h , s , v = g e t _ S p l i t ( I b )
4:     h i s t = g e t _ H i s t o g r a m ( h )
5:     c = 0
6:    for each i = 0 to 255 do
7:        if h i s t ( i ) 0 then
8:            c = c + 1
9:    return c▹ The recovered value.
∂ Symmetry (a)
The contour of the possible case of melanoma is identified, then an ellipse is placed, and then it is inscribed in the identified contour to estimate the symmetry. A rectangle is established in such a way that the ellipse is inscribed in the rectangle. Once the rectangle is drawn, the midpoints of the sides are determined, and the axes are placed at these points. The semiplanes formed by the axes are compared to assign a weighting. First, the longest axis is used to divide the image into two, and these semi-planes are compared. Then, the other axis is used to do the same. The two scores obtained are compared, and the highest value is chosen, with a maximum value of 1 and a minimum of 0. The final value is added as input of the multilayer perceptron as well as the size, color, and edge. An example of symmetry verification is shown in Figure 5 and Figure 6. Algorithm 5 shows the corresponding pseudocode for the evaluation of symmetry.
Algorithm 5 Proposed method to evaluate symmetry ( a ) , showing lines 1–14, corresponding to the images in Figure 3c.
Input: I a , input image.
Output:a, estimated value for symmetry.
1:procedureget_symmetry( I a )
2:     I b = c o n v e r t _ R G B t o G R A Y ( I a )
3:     I c = g e t _ C o n t o u r s ( I b )
4:     I d = c i r c u m s c r i b e d _ E l l i p s e ( I c )
5:     I e = c i r c u m s c r i b e d _ R e c t a n g l e ( I d )
6:     p = g e t _ C o r n e r s ( I e )
7:    for all s e m i p l a n e ( 1 , 2 , 3 , 4 ) do
8:         m p x 0 = p [ 0 , 0 ] + p [ 1 , 0 ] 2
9:         m p y 0 = p [ 0 , 1 ] + p [ 1 , 1 ] 2
10:         m p x 2 = p [ 2 , 0 ] + p [ 3 , 0 ] 2
11:         m p y 2 = p [ 2 , 1 ] + p [ 3 , 1 ] 2
12:         S e m i P 1 = s e m i p l a n e ( I c , [ p [ 0 , 0 ] , p [ 0 , 1 ] ] , [ m p x 0 , m p y 0 ] , [ m p x 2 , m p y 2 ] , p [ 3 , 0 ] , p [ 3 , 1 ] )
13:     a 1 = s i m i l a r i t y ( S e m i P 1 , s e m i P 2 )
14:     a 2 = s i m i l a r i t y ( S e m i P 2 , s e m i P 3 )
15:     a = g e t _ H i g h e s t ( a 1 , a 2 )
16:    return a▹ The recovered value.
∂ Edge (b)
Finally, the border is checked, the contour is identified again, the area is quantified, and the polygon that best fits the shape is entered. A comparison is made between the area of the polygon and the area of the contour, and the result of the quotient is scaled according to the information obtained from the training. Algorithm 6 shows the corresponding pseudocode for contour estimation.
Once the four descriptors are estimated, they serve as inputs for the classifier. It has three outputs, corresponding to malignant melanoma, benign melanoma, and images that are only skin. In the case of malignant melanoma, the degree of evolution is also identified, and the contour is colored according to the computed level. There are four levels to determine severity, where the highest level corresponds to the descriptor with maximum score.
Algorithm 6 Proposed method to evaluate the edge, showing lines 1–7, Figure 3d.
Input: I a , input image.
Output:b, estimated value for edge.
1:procedureget_edge( I a )
2:     I b = c o n v e r t _ R G B t o G R A Y ( I a ) ▹ Convert RGB image to GRAY.
3:     I c , a r e a 1 = g e t _ C o n t o u r s ( I b ) ▹ Identify the contour and calculate the area of the melanoma case.
4:     I d = S i m i l a r _ P o l y g o n ( I c ) ▹ Identify the polygon that best fits the contour identified in line 3.
5:     a r e a 2 = g e t _ A r e a ( I d ) ▹ Calculate the area of the polygon.
6:     b = a r e a 1 a r e a 2 ▹ Calculate the coefficient of relationship between the two areas.
7:    return b▹ The recovered value.

2.2.3. Multilayer Perceptron Design

After the image is conditioned, and the four descriptors are estimated, a training and classification stage is continued. For this stage, a multilayer perceptron is used. This is a neural network formed by multiple layers that can solve problems that are not linearly separable, and it is mainly used for image segmentation and pattern association [19].
The multilayer perceptron consists of an input layer, an output layer, and n hidden layers (where n 1 ). A multilayer perceptron is characterized by having different inputs that are related to each other. The main hyperparameters of the neural network are the activation function such as: softmax, rectifier, tanh and sigmoid; the number of layers, the number of neurons in each layer, the learning rate, and learning function such as: Stochastic Gradient Descent(SGD), RMSprop, and Adam [19]. To obtain the best architecture, as is shown in Table 2, different multilayer perceptron models configurations were tested. The first number represents the input layer formed by four scalars representing the descriptors of the ABCD rule, the last number represents the output layer, and the intermediate numbers represent the configuration of the hidden layers. The best result, on average, is obtained by the architecture 4-1024-1. Therefore, in this work, the architecture shown in Figure 7 is proposed, which consists of three layers: the input layer is formed by four neurons, a neuron for each descriptor of the ABCD rule, the intermediate layer with 1024 neurons, and a final layer with only one neuron. In the hidden layer, a ReLu (Rectified Linear Units) activation function is used, and, in the last layer, the Sigmoid function. The ReLU function is a simple function that is zero for any input value below zero and the same amount for values greater than zero. A dropout of 0.5 is used in the last two layers of the model, setting a fraction of inputs to zero to reduce excessive adjustment. Finally, a size batch of 64, a learning function Adam, and a learning rate of 0.01 were used.

2.2.4. Descriptors’ Importance Analysis

The ABCD rule, which uses Symmetry (a), Edge (b), Color (c), and Dimension (d) as descriptors to discriminate between benign and malignant melanoma, [18] has been widely used in the literature due to its excellent results [19]. However, it is interesting to analyze the importance of each descriptor in our designed multilayer perceptron. Table 3 displays a comparison with different descriptor setup, where it can be observed: when just one descriptor is used, the more relevant descriptor is color followed by symmetry. When two descriptors are used, the best combination is symmetry and dimension. Finally, the best setup when three descriptors are used is the edge, color, and size.

2.2.5. Performance Evaluation

The metrics to evaluate the performance of the algorithm are two. The first is the cross-validation to obtain the best results regarding the evaluation of the quality of the prediction of the model (classification between malignant and benign melanoma). The k-fold cross-validation or cross-validation consisted of taking the dataset and creating two separate sets: a training set and a validation set.
Subsequently, the training set is divided into ten subsets, and, at the time of training, each subset is taken as a test set of the model, while the rest of the data are considered as a training set.
This process is repeated ten times, and, in each iteration, a different test set is selected, while the remaining data are used as a training set. During each iteration, a quantification of false positive and false negative cases, from these values precision (4), specificity (5), sensitivity (6), and efficiency (7) are calculated, where TN are true-negative cases, FN false-negative cases, TP true-positive cases, and FP false-positive cases:
A c c u r a c y = T P + T N T P + T N + F P + F N
S p e c i f i c i t y = T P T P + F N
S e n s i t i v i t y = T N T N + F P
E f f i c i e n c y = S e n s i t i v i t y + S p e c i f i c i t y + A c c u r a c y 3
Once the iterations are completed, the efficiency and error for each of the models produced are calculated. To obtain the efficiency, and the final error, the average of the 10-trained models is calculated. Figure 8 illustrates the Cross-Validation process used.
The second metric is a statistical analysis by considering severity classification for cases of malignant melanoma; first, a mean analysis is performed with t-Student distribution, which is the most used to compare different treatments, since one of the objectives was to demonstrate that the means are statistically different among levels (severity levels for cases of malignant melanoma). An analysis of variance is also performed to determine the range where the differences between the treatments fall with a degree of reliability of 97%. Finally, an estimation of the detection ranges for each level is done, maintaining the previous reliability.

3. Results and Discussion

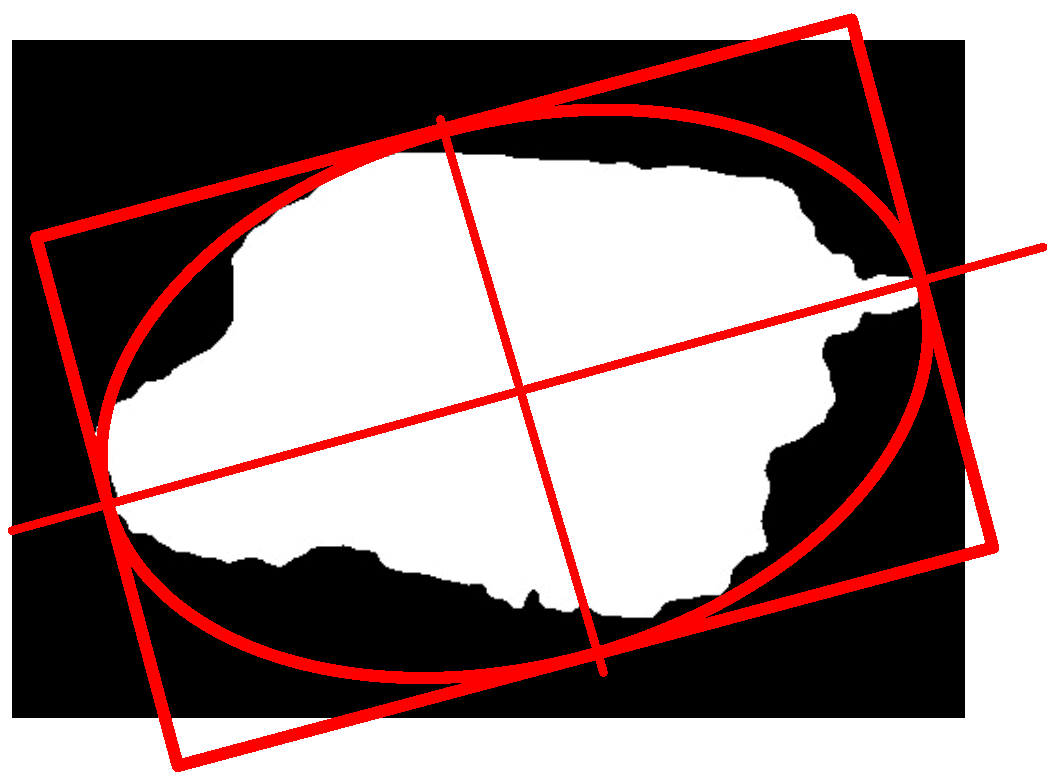
The main aim of this research was to develop an efficient and robust method for the detection and classification of melanomas in simple and dermatological images using image processing and a multilayer perceptron. The algorithm estimates the descriptors of the ABCD rule and uses the values as input for the multilayer perceptron. It is responsible for the training and classification of malignant and benign melanoma.
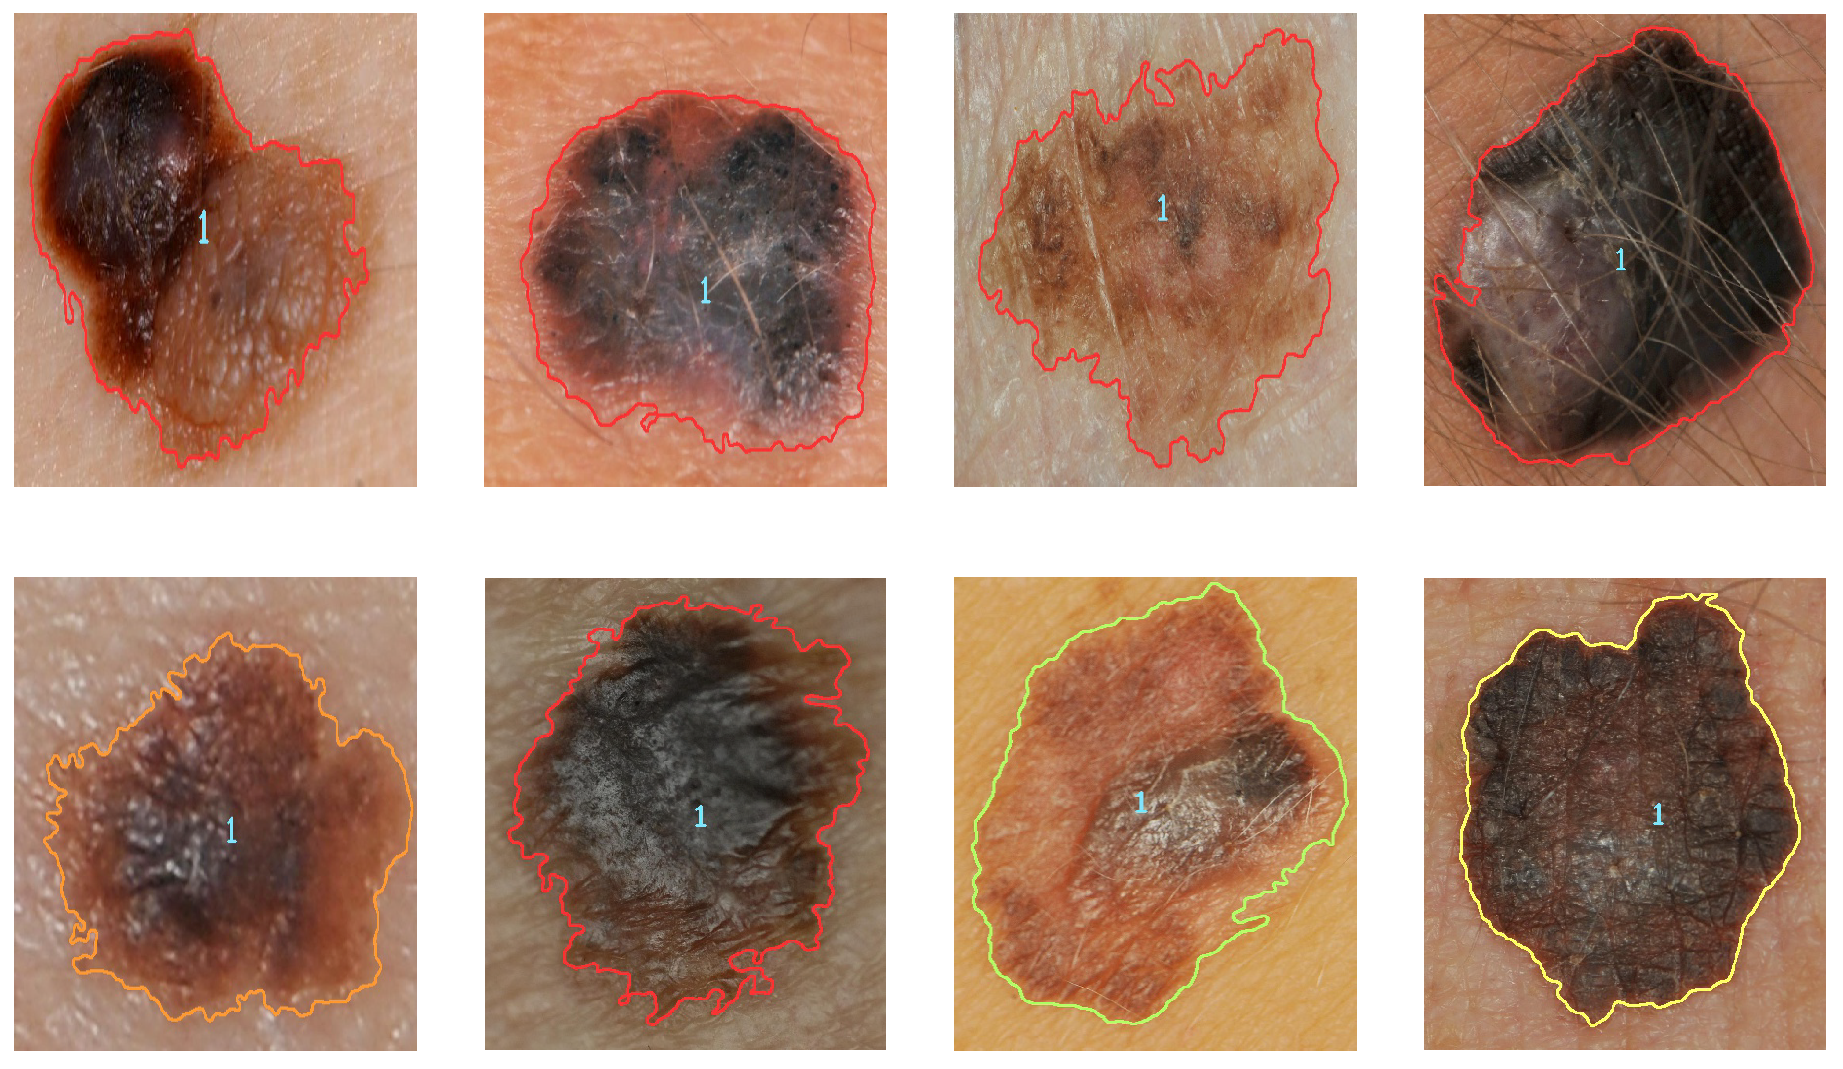
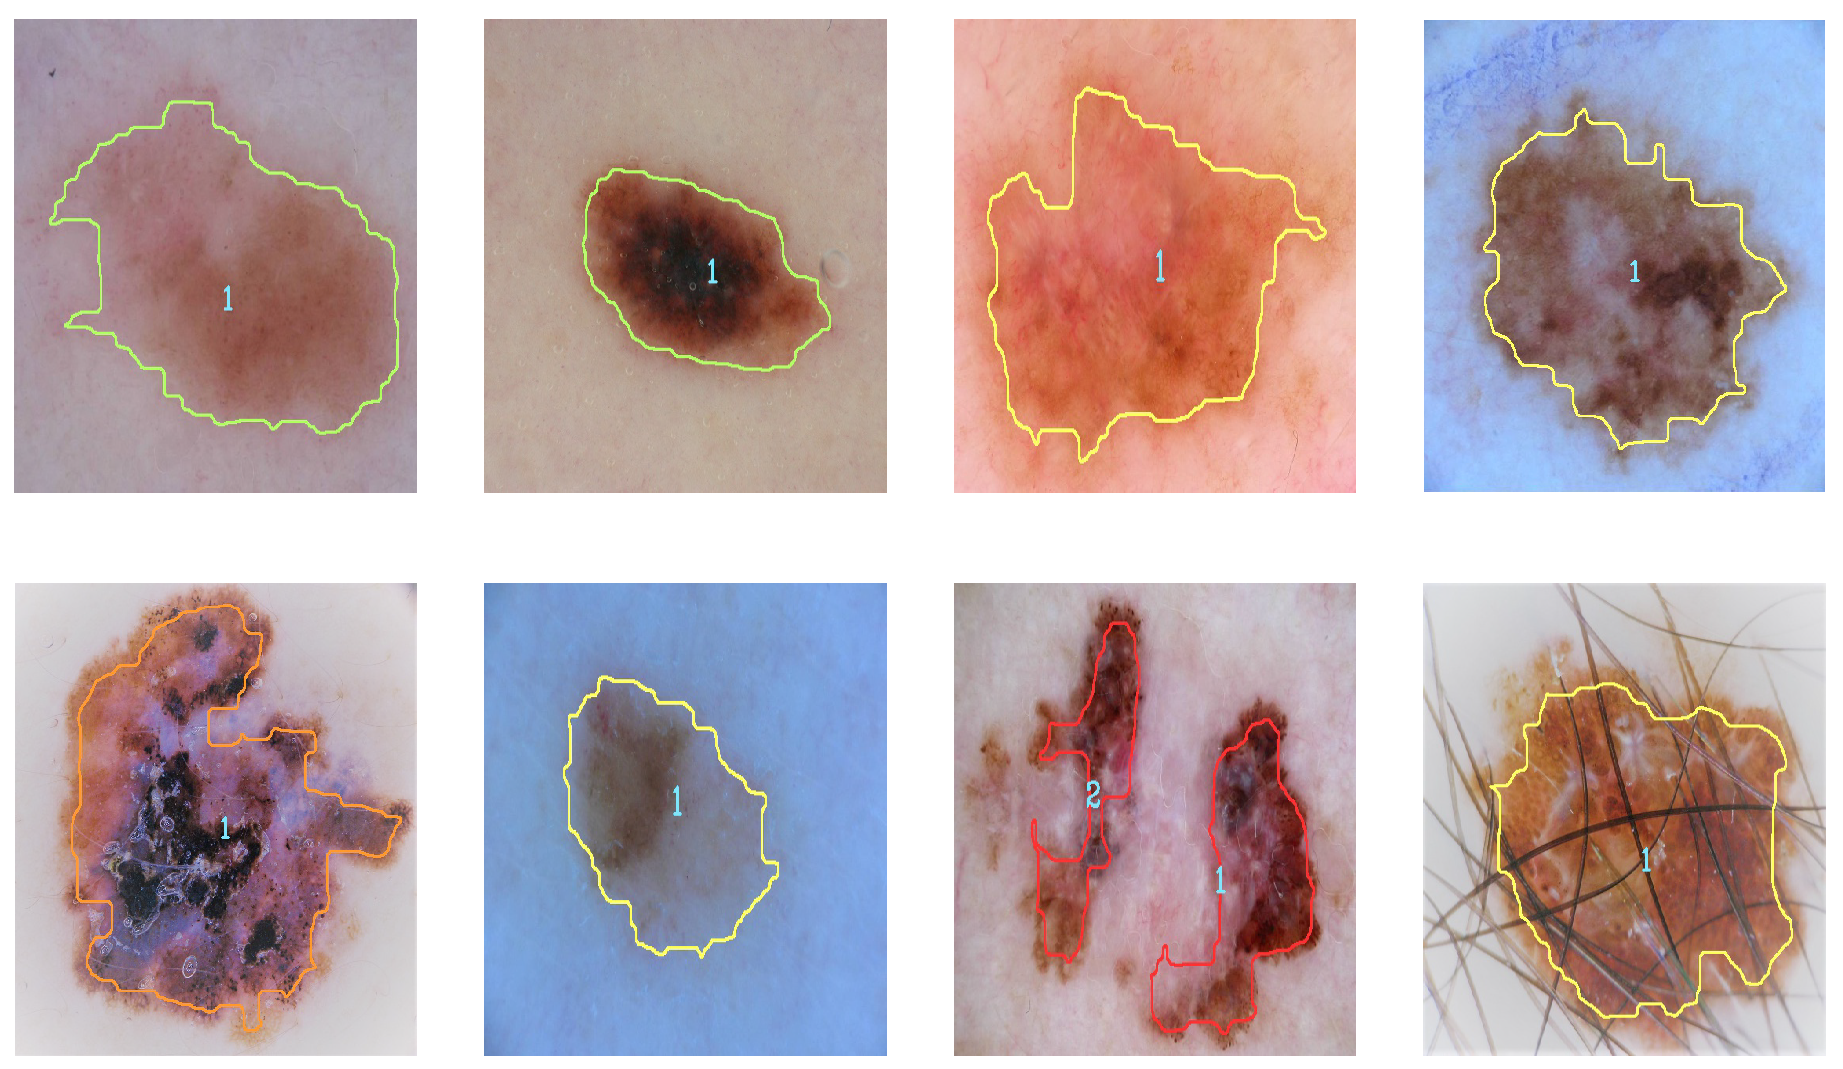
Figure 9 and Figure 10 illustrate the identification of the contour and the type of melanoma according to the analysis of the results (contour color indicates severity). Severity levels are an additional classification of malignant cases of melanoma.
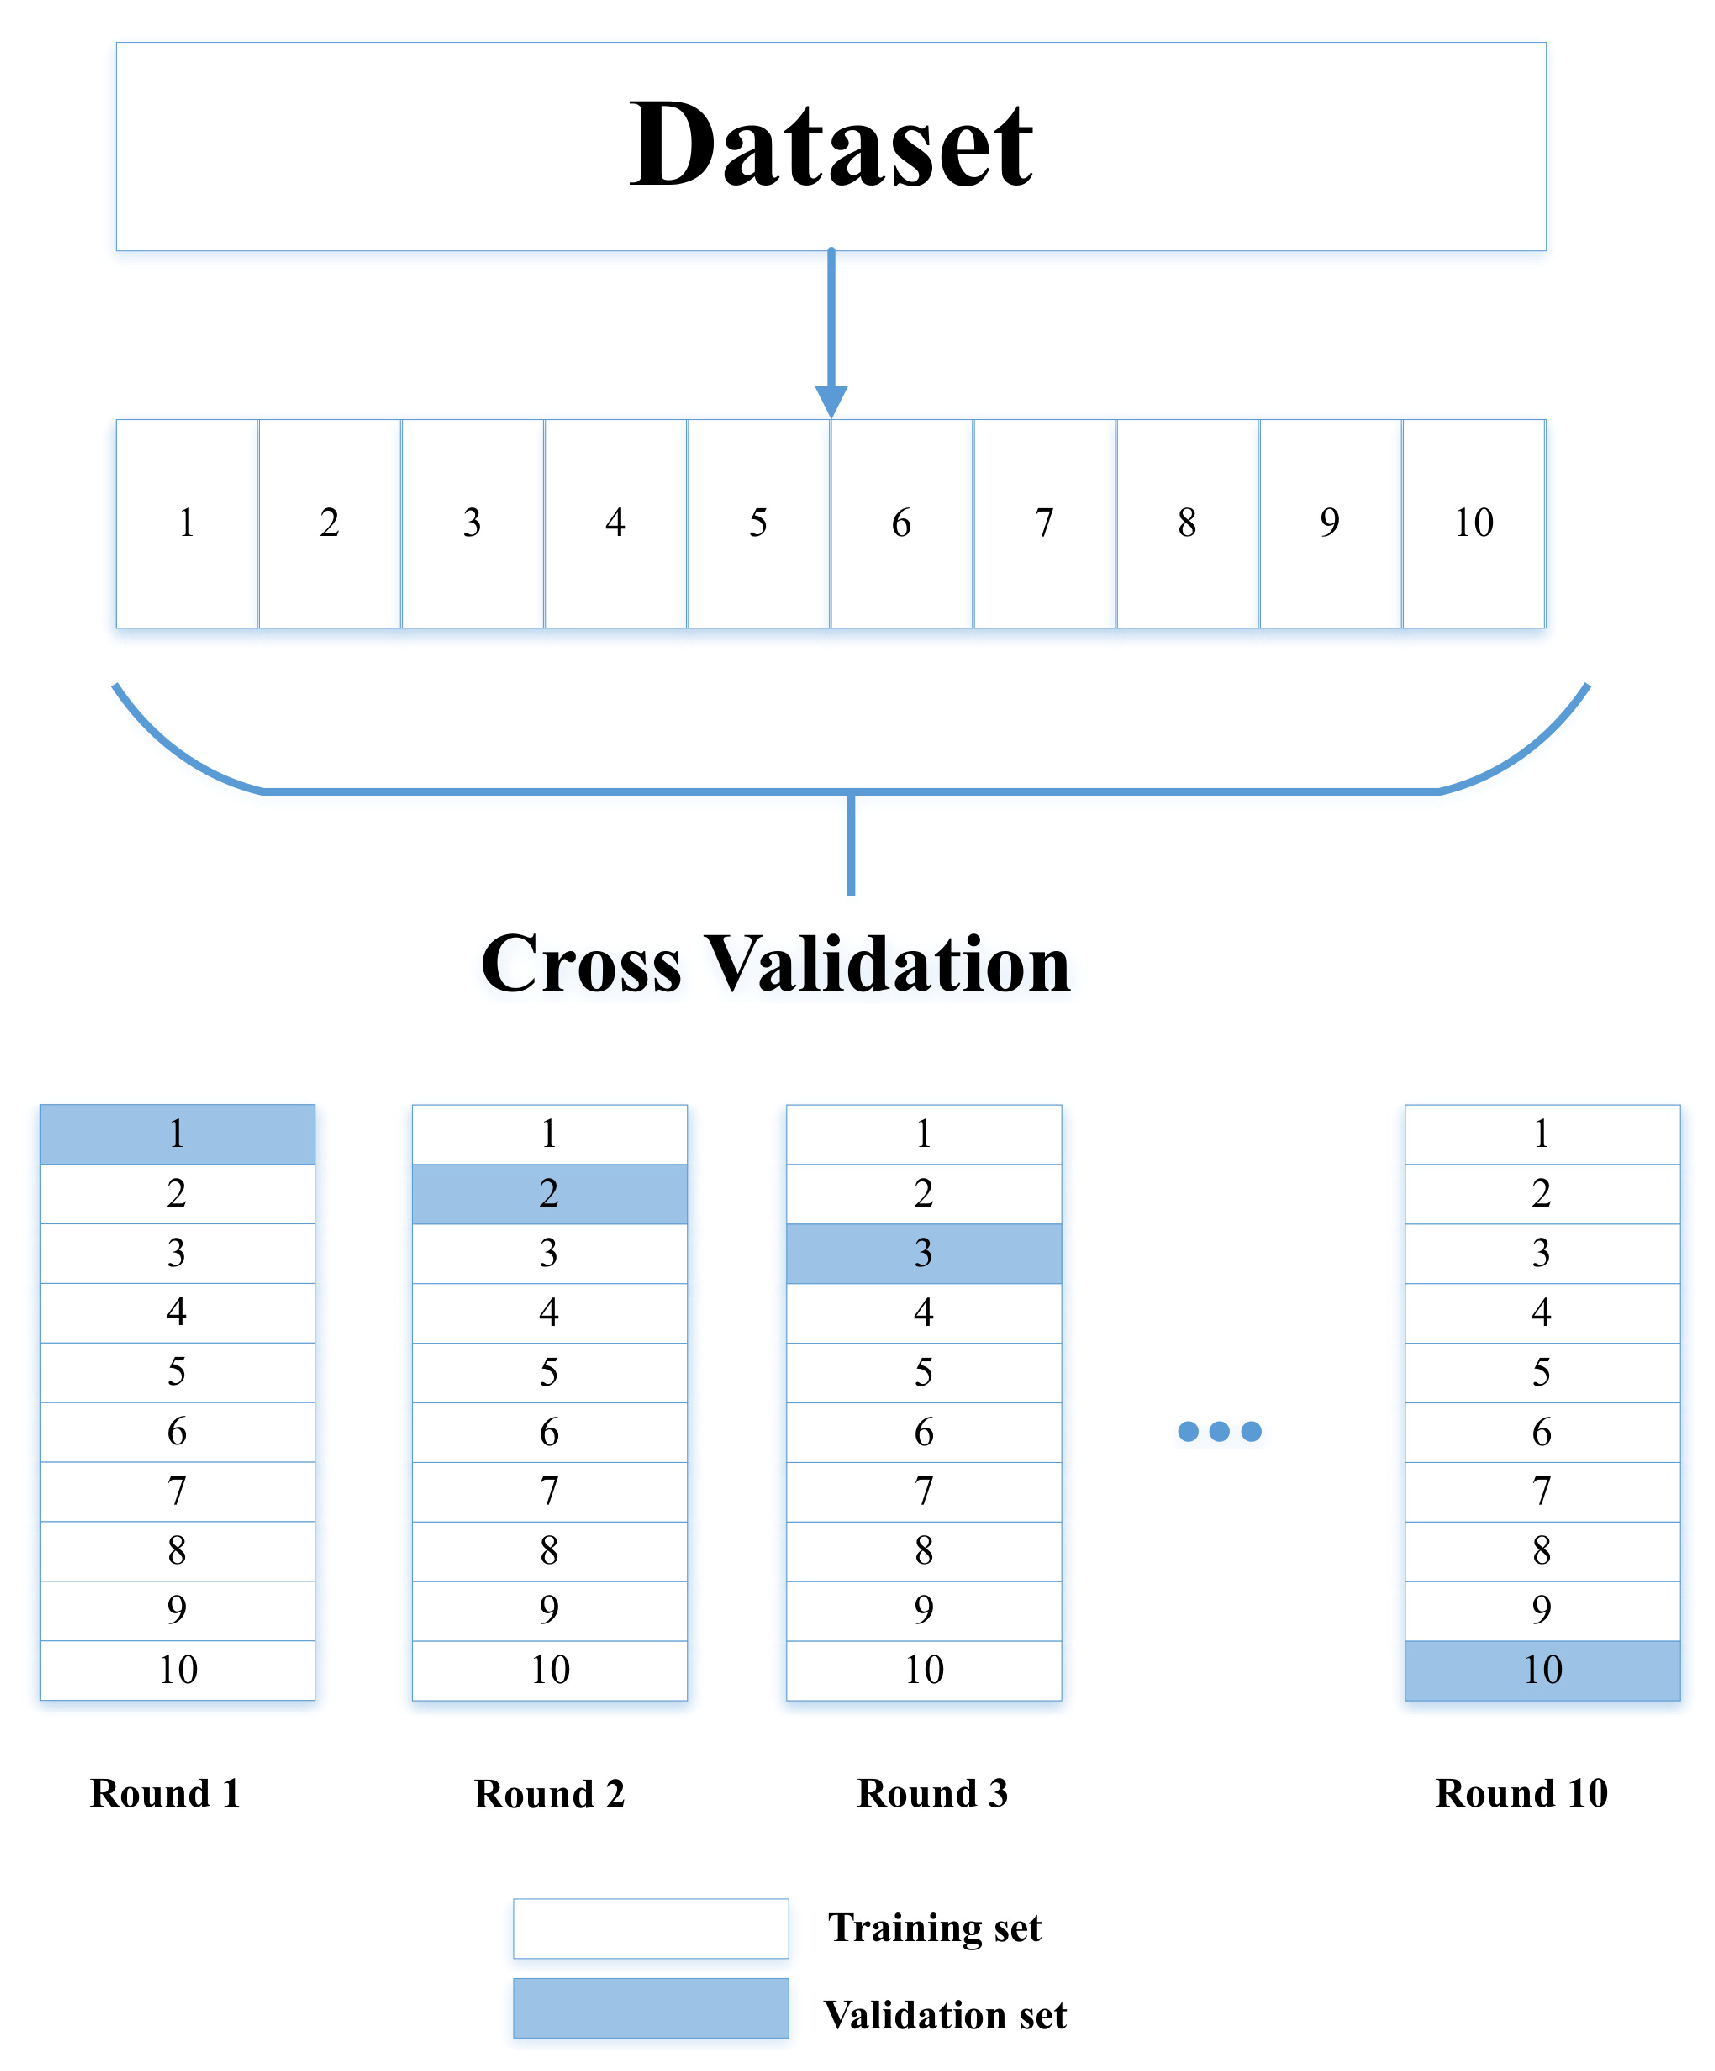
The validation was divided into two stages; the first was the cross-validation using Equations (4)–(7), and the second was statistical analysis. According to the results, the method has better efficiency than conventional methods since, after applying the equations, an efficiency of 97.78% for simple images and 98.22% for dermatological images was obtained. Table 4 shows the precision values obtained in the iterations for both simple and dermatological images. 
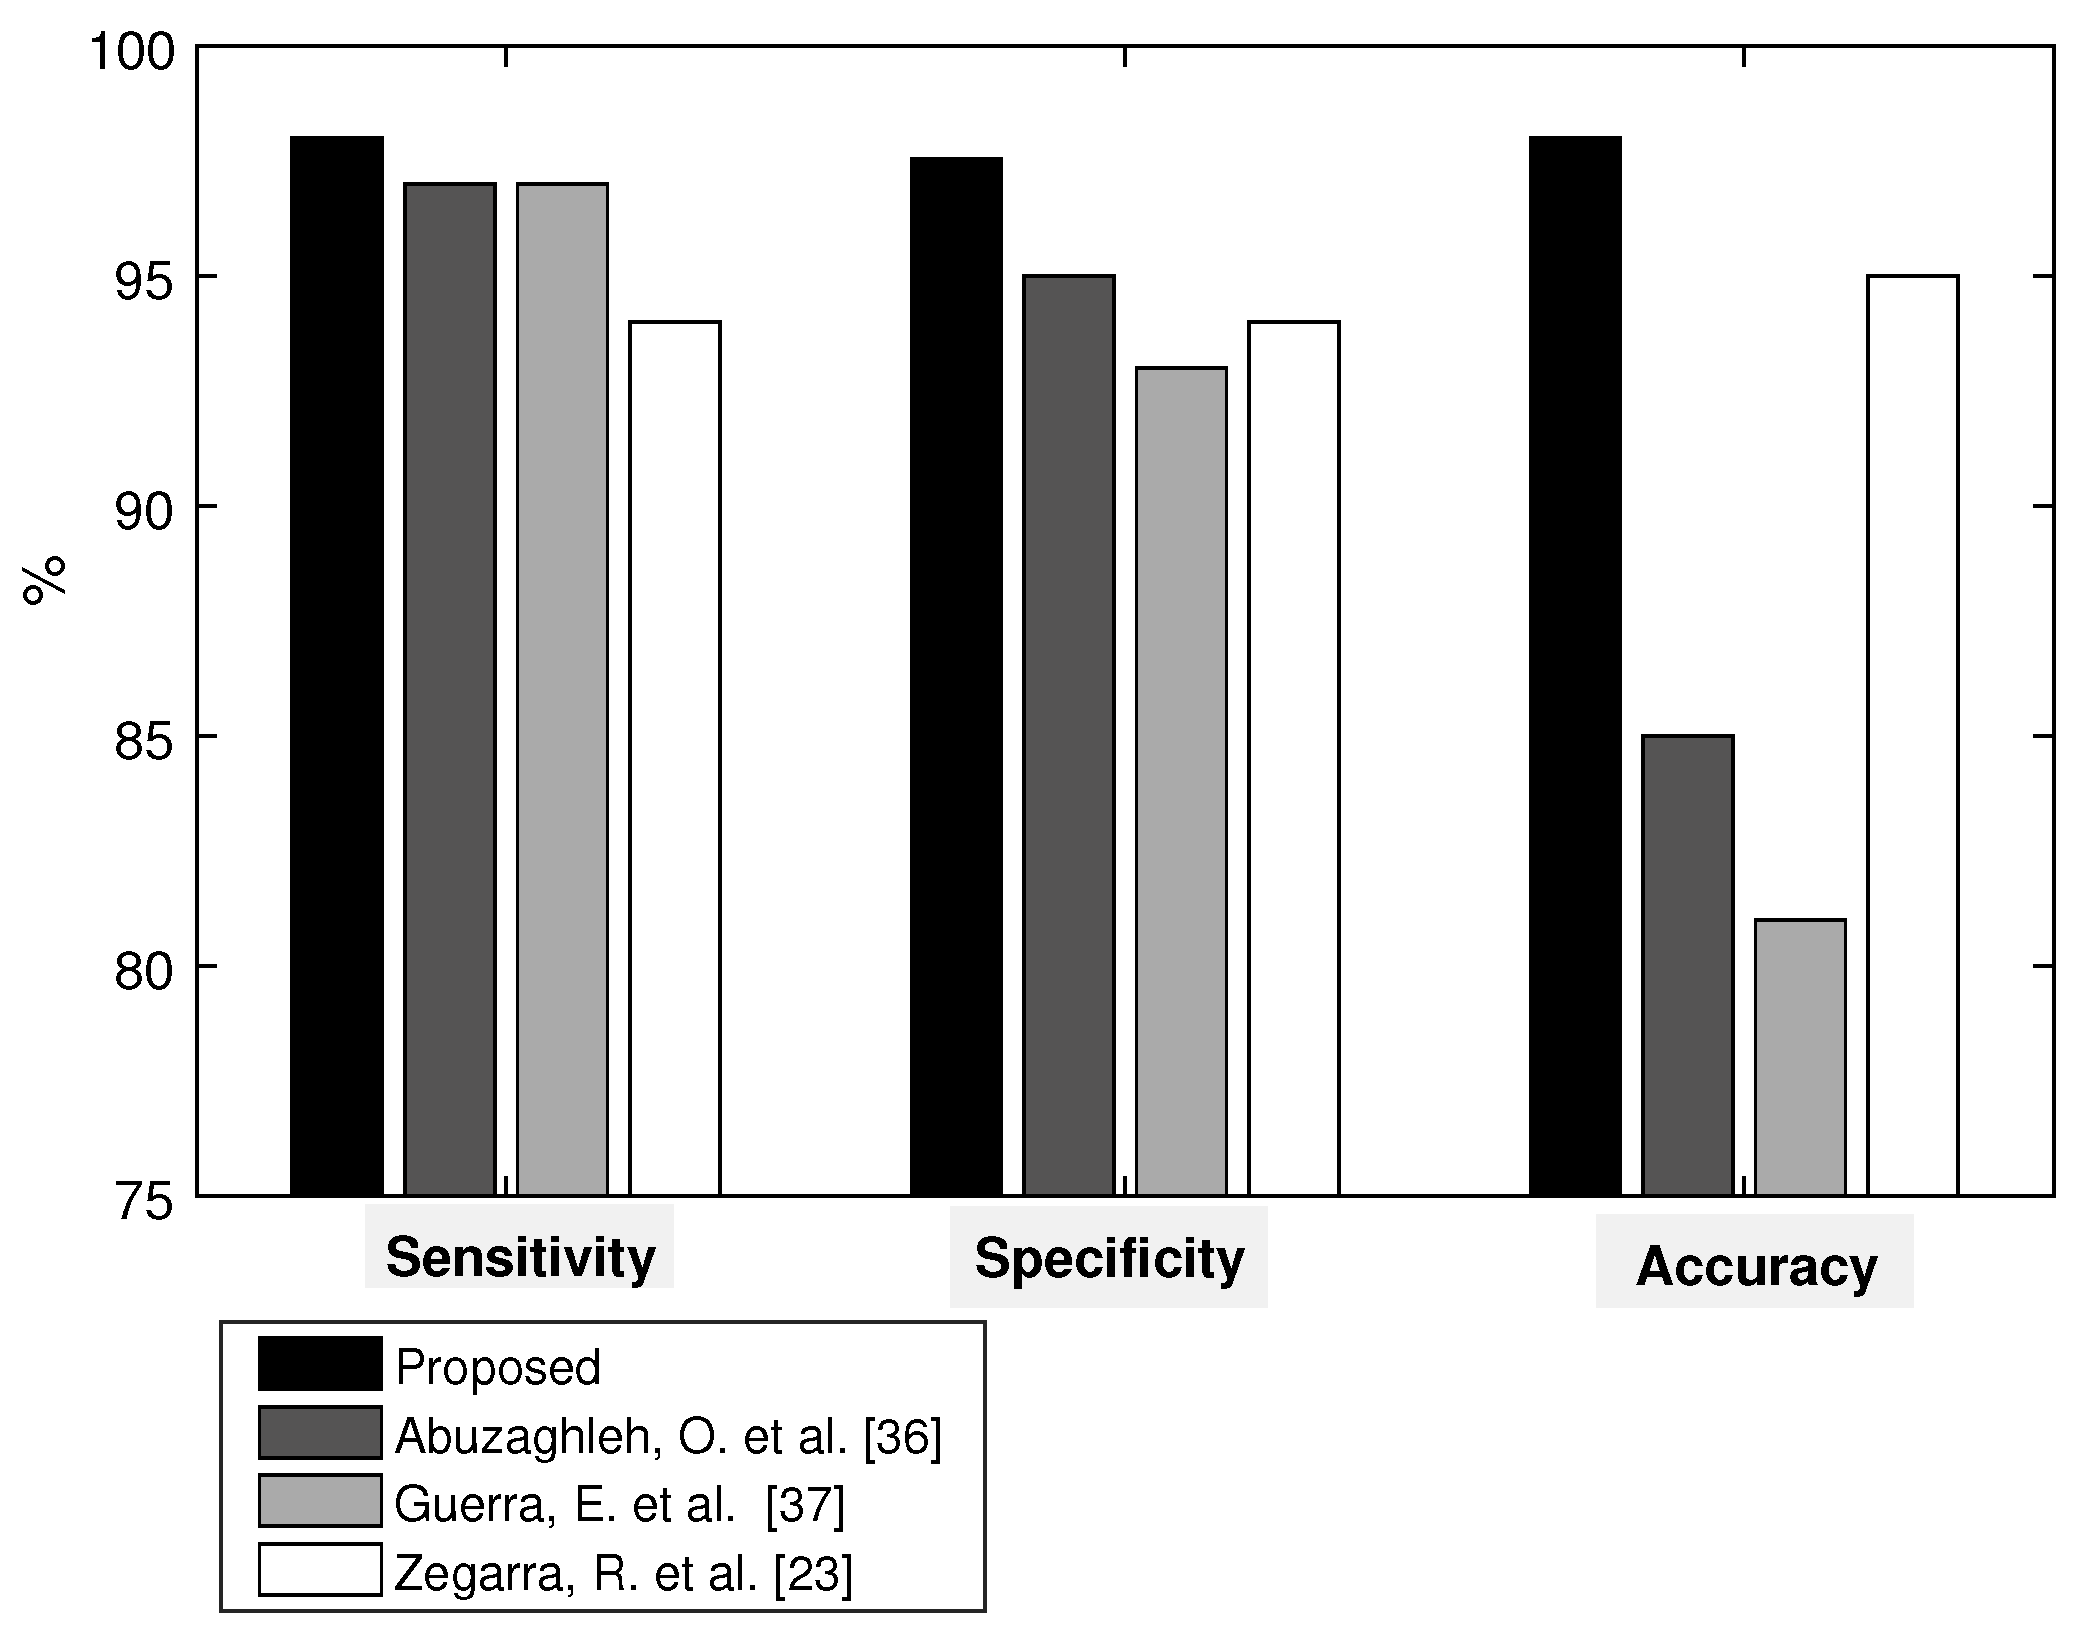
Figure 11 illustrates the comparison of the efficiency levels of the development method with studies that used the same type of images and datasets.
The second classification is responsible for categorizing the severity of the malignant melanoma once it has been diagnosed. The maximum and minimum obtained from the estimation of each descriptor are used for the classification. The analysis of the results for the second metric indicates that the levels for cases of malignant melanoma correspond to level 1 when they are less than 0.35 (green color), level two when they are less than 0.65 (yellow color), level three when they are less than 0.85 (orange), and level four when they are greater than 0.85 (red); Figure 9 and Figure 10 show examples of malignant melanoma with different levels of severity.
Subsequently, the confidence levels of the mean were determined; according to the results, it is said that the average of the cases will fall 97% of the time. It was observed that there is a slight overlap in the ranges of the means. However, the reliability for which it was calculated is high. Thus, it can be said that the range of confidence is high. It is concluded that the means are statistically different among the groups considering a reliability level of 97%.
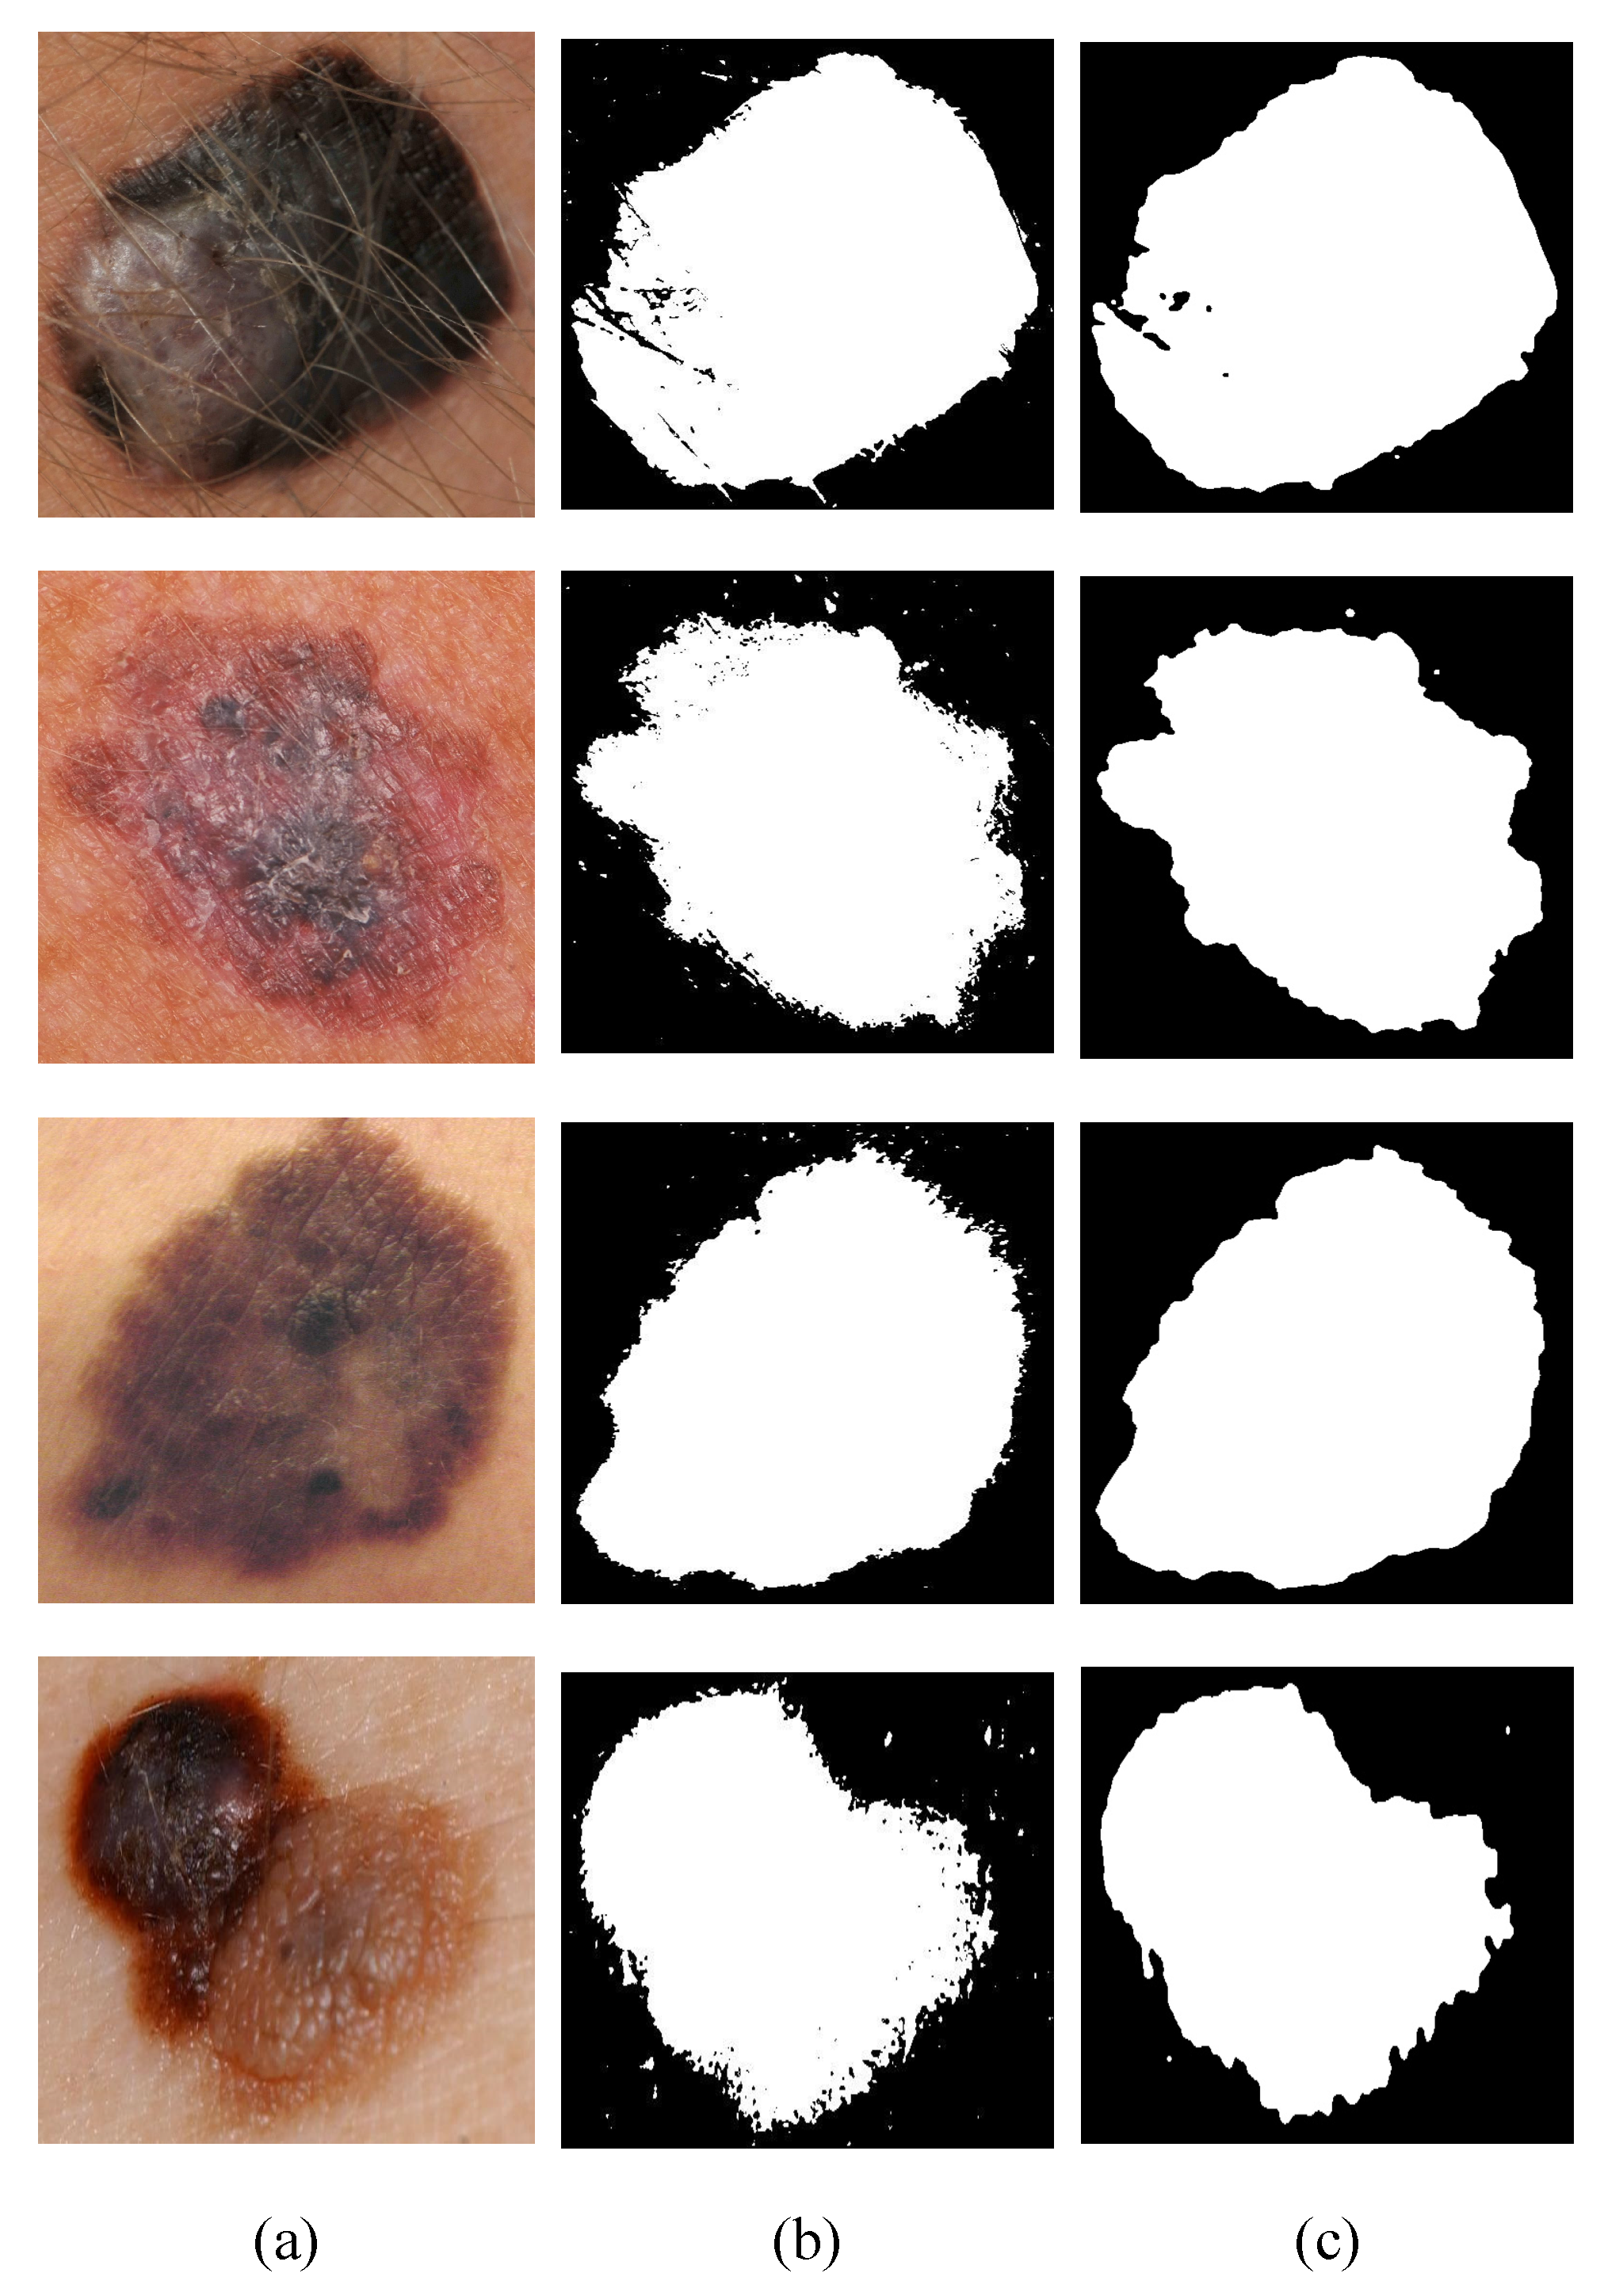
In addition to detecting and classifying cases of malignant and benign melanoma, and detecting level severity, the proposed method offers other advantages such as detecting several cases of melanoma in the same image, identifying images that show skin only and cases of melanoma where the image has hair in it. When the image contains more than one melanoma, a diagnosis is provided for each.

4. Conclusions

In this paper, a method for detection and classification of melanoma in simple and dermatological images was proposed. It uses mathematical morphology, Gaussian filters, HSV color space, and a multilayer perceptron for rating. Four descriptors—symmetry, size, color, and edge—were estimated. The multilayer perceptron is in charge of classification. Several tests of the classifier with different parameters were performed. The best result was achieved using 1024 neurons in the hidden layer and a sigmoidal activation function.
The experimental results achieved a superior performance than three state-of-the-art methods in terms of efficiency. According to cross-validation, a high level of reliability was achieved, with an efficiency value equal to 97.78% for simple images and 98.22% for dermatological images.
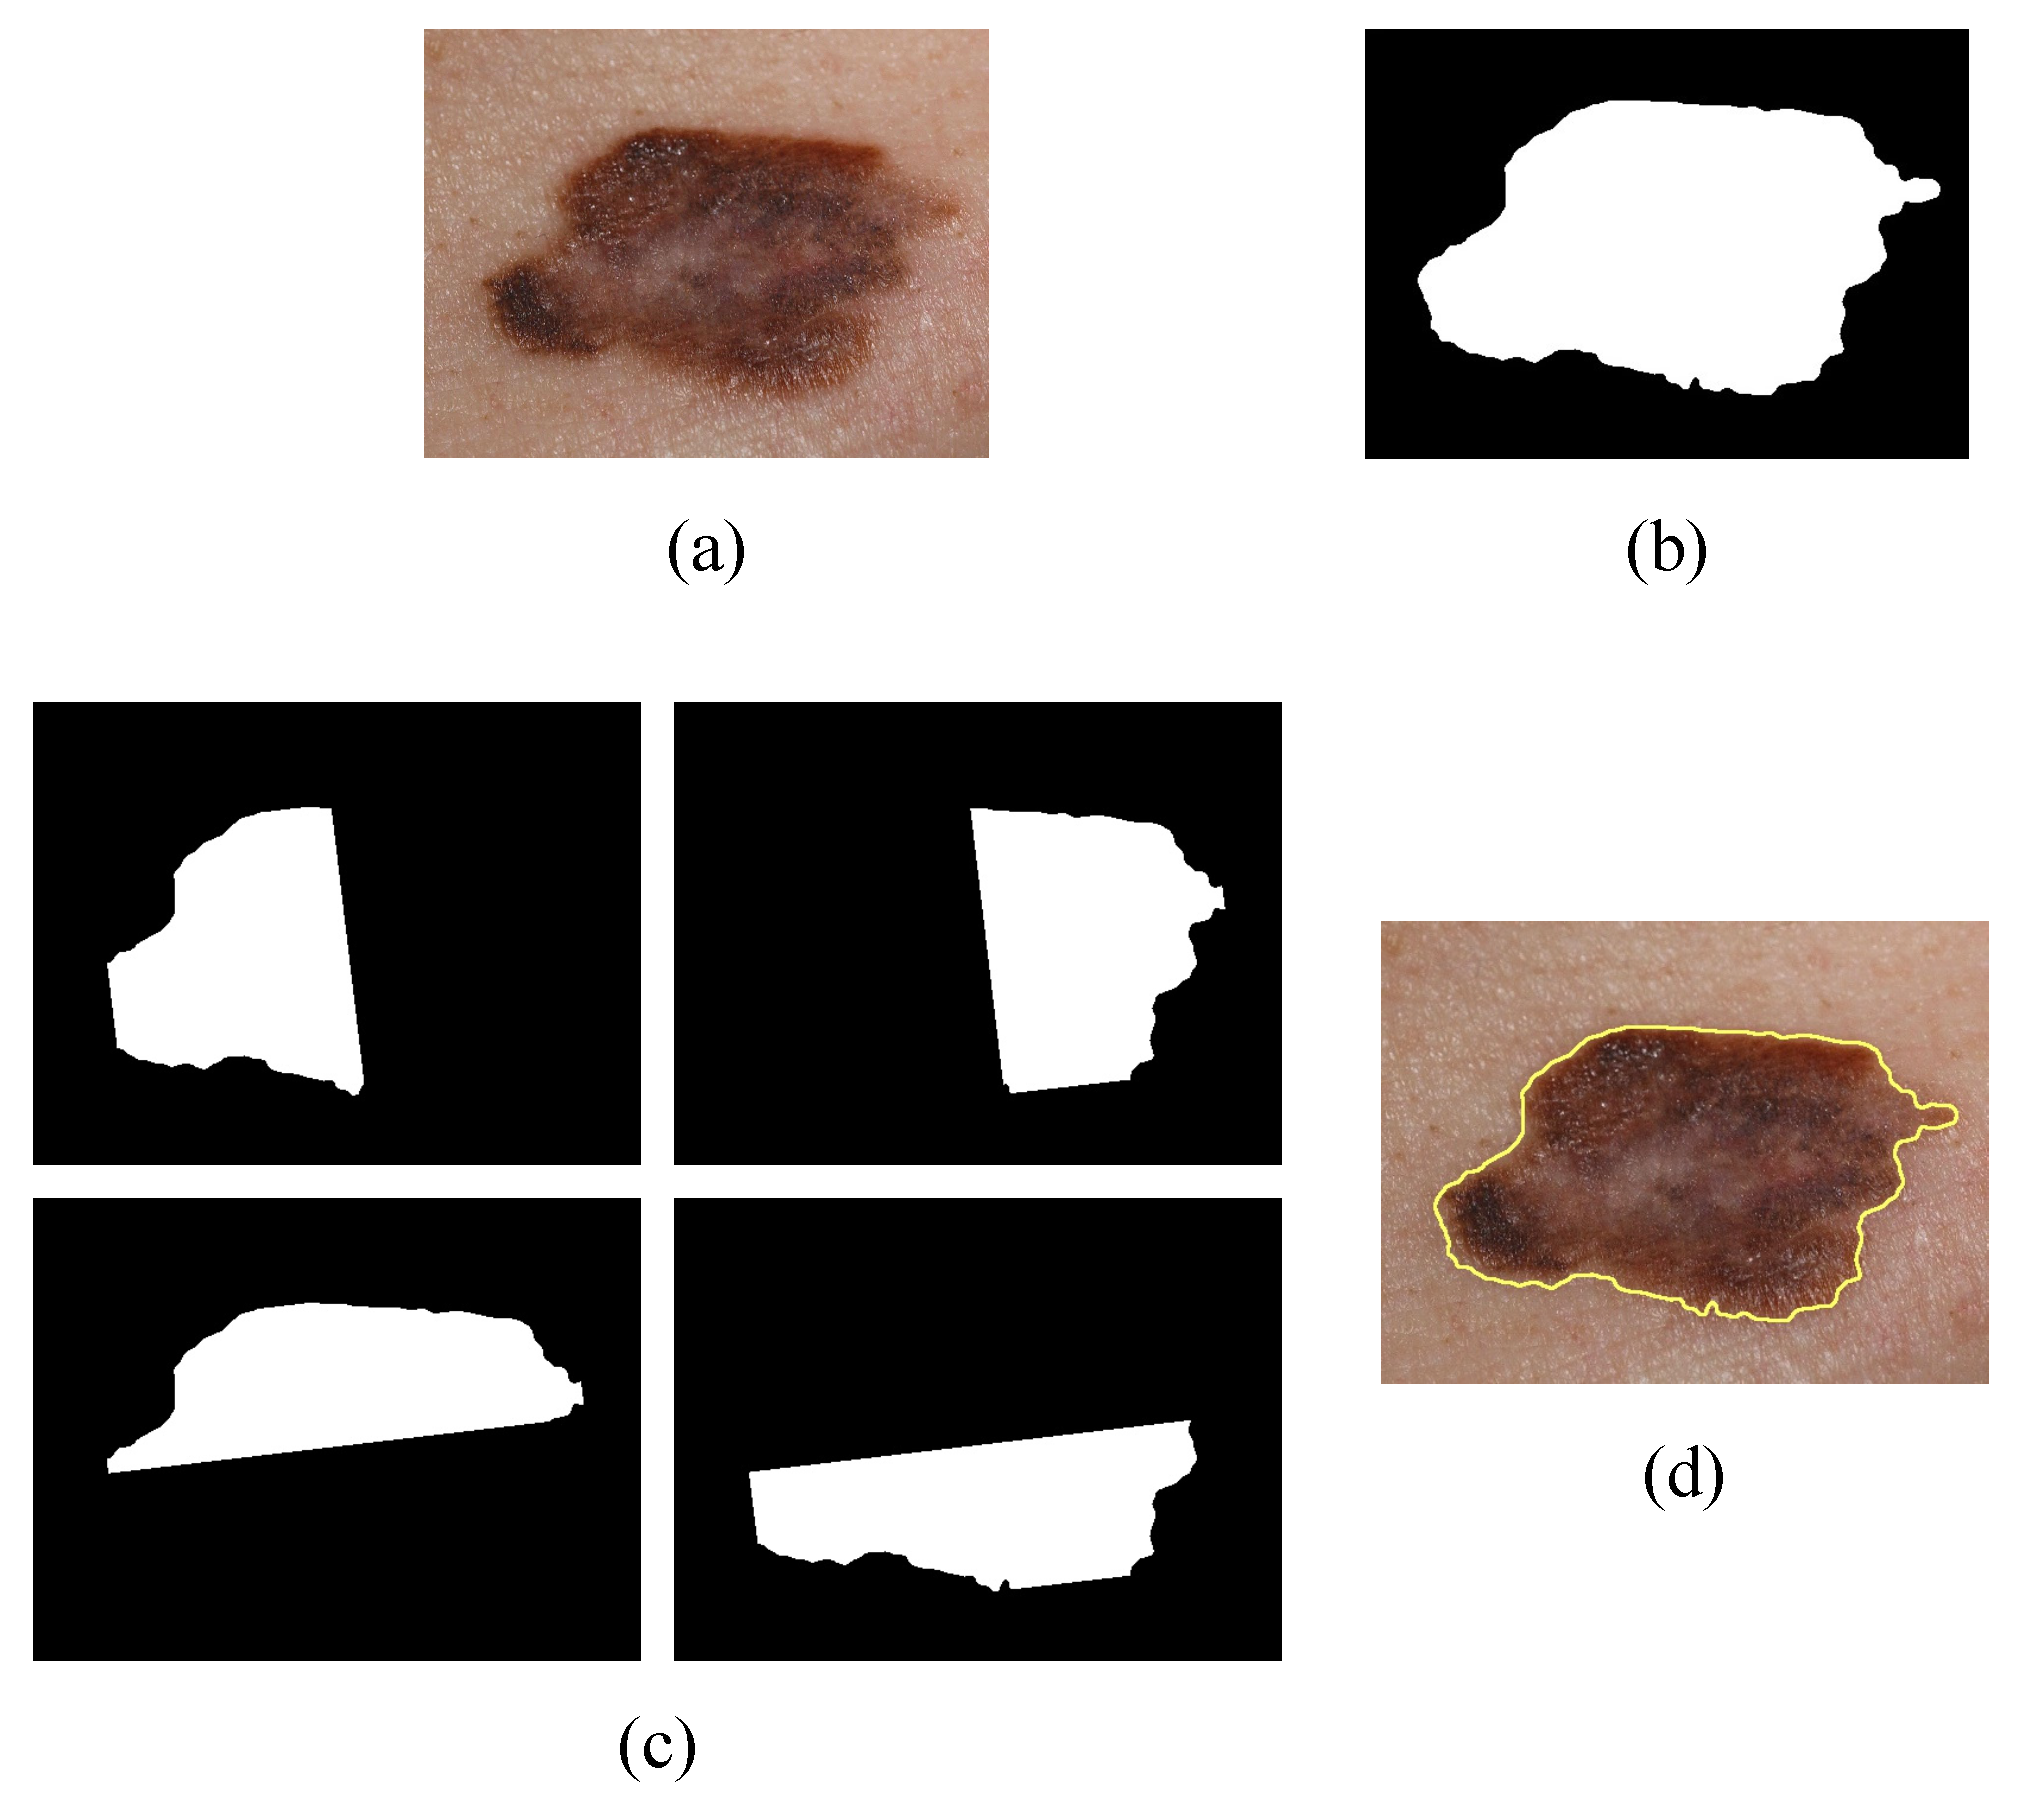
The analysis of the results indicates that the values in the ABCD rule measurements increase significantly in the cases of malignant melanoma, and the most significant descriptor of the four being symmetry.
This work derives certain future activities; one of them is the implementation of the proposed method in an embedded system since, due to its high levels of efficiency, it is inferred that it will increase the levels of reliability in the detection of melanoma in comparison with the applications reported. If this is the case, we can expect to have a portable and low-cost melanoma detector device at some point in the future.

Author Contributions

Conceptualization, L.-M.S.-R.; Methodology, L.-M.S.-R., J.R.-R., and S.S.-C.; Writing—original draft preparation, L.-M.S.-R., J.R.-R., S.S.-C., and G.N.A.-R.; Writing—review and editing, L.-M.S.-R. and G.I.P.-S.; Supervision, S.S.-C., J.R.-R., and G.N.A.-R. All authors have read and agreed to the published version of the manuscript.

Funding

This research received no external funding.

Acknowledgments

This research was supported by the Universidad Autónoma de Querétaro (UAQ), the Consejo Nacional de Ciencia y Tecnología (CONACYT) and PRODEP.

Conflicts of Interest

The authors declare no conflict of interest.

References

  1. OPS. El cáncer en la región de las américas. 2014. Available online: http://www.paho.org/hq/dmdocuments (accessed on 9 September 2018).
  2. De Cancerología, I.N. Epidemiología del melanoma de piel en México. 1998. Available online: http://www.imbiomed.com.mx (accessed on 9 September 2018).
  3. De Especialidades Médico-Quirúrgicas, R. El melanoma en México. 2010. Available online: http://www.redalyc.org/47316054010.pdf (accessed on 9 September 2018).
  4. Takruri, M.; American, A. Bayesian decision for enhancing melanoma recognition accuracy. In Proceedings of the 2017 International Conference on Electrical and Computing Technologies and Applications (ICECTA), Ras Al Khaimah, UAE, 21–23 November 2017; pp. 1–4. [Google Scholar]
  5. Adjed, F.; Safdar, J.; Abadsa, F.; Faye, I.; Chandra, S. Fusion of structural and textural features for melanoma recognition. IET Comput. Vis. 2018, 12, 185–195. [Google Scholar] [CrossRef]
  6. Rey, L.; Burgos, F.; Delpueyo, X.; Ares, M.; Royo, S.; Malvehy, J.; Puig, S.; Vilaseca, M. Visible and Extended Near-Infrared Multispectral Imaging for Skin Cancer Diagnosis. Sensors 2018, 18, 1441. [Google Scholar] [CrossRef] [Green Version]
  7. Lingala, M.; Joe, R.; Rader, K.; Hagerty, J.; Rabinovitz, S.; Oliviero, M.; Choudhry, I.; Stoecker, V. Fuzzy logic color detection: Blue areas in melanoma dermoscopy images. Comput. Med. Imaging Graph. 2014, 38. [Google Scholar] [CrossRef] [PubMed] [Green Version]
  8. Pennisi, A.; Bloisi, D.; Nardi, D.; Giampetruzzi, R.; Mondino, C.; Facchiano, A. Skin lesion image segmentation using Delaunay Triangulation for melanoma detection. Comput. Med. Imaging Graph. 2016, 52. [Google Scholar] [CrossRef] [Green Version]
  9. Xu, H.; Lu, C.; Berendt, R.; Jha, N.; Mandal, M. Automated analysis and classification of melanocytic tumor on skin whole slide images. Comput. Med. Imaging Graph. 2018, 66. [Google Scholar] [CrossRef]
  10. Okur, E.; Turkan, M. A survey on automated melanoma detection. Eng. Appl. Artif. Intell. 2018, 73, 50–56. [Google Scholar] [CrossRef]
  11. Rubegni, P.; Feci, L.; Nami, N.; Burroni, M.; Taddeucci, P.; Miracco, C.; Munezero, B.; Fimiani, M.; Cevenini, G. Computer-assisted melanoma diagnosis: A new integrated system. Melanoma Res. 2015, 6, 537–542. [Google Scholar] [CrossRef]
  12. Dubois, A.; Levecq, O.; Azimani, H.; Siret, D.; Barut, A.; Suppa, M.; Marmol, V.; Malvehy, J.; Cinotti, E.; Rubegni, P.; et al. Line-field confocal optical coherence tomography for high-resolution noninvasive imaging of skin tumors. J. Biomed. Opt. 2018, 10, 1–9. [Google Scholar] [CrossRef] [Green Version]
  13. Alquran, H.; Abu, I.; Mohammad, A.; Alhammouri, S.; Alawneh, E.; Abughazaleh, A.; Hasayen, F. The melanoma skin cancer detection and classification using support vector machine. In Proceedings of the 2017 IEEE Jordan Conference on Applied Electrical Engineering and Computing Technologies (AEECT), Aqaba, Jordan, 11–13 October 2017; pp. 1–5. [Google Scholar]
  14. Daeschlein, G.; Hillmann, A.; Gumbel, D.; Sicher, C.; Podewils, S.; Matthias, B.; Junger, M. Enhanced Anticancer Efficacy by Drug Chemotherapy and Cold Atmospheric Plasma Against Melanoma and Glioblastoma Cell Lines In Vitro. IEEE Trans. Radiat. Plasma Med. Sci. 2018, 2, 153–159. [Google Scholar] [CrossRef]
  15. Abu, A.; Al-Marzouqi, H. Melanoma detection using regular convolutional neural networks. In Proceedings of the 2017 International Conference on Electrical and Computing Technologies and Applications (ICECTA), Ras Al Khaimah, UAE, 21–23 November 2017; pp. 1–5. [Google Scholar]
  16. Fioravanti, V.; Brandhoff, L.; Driesche, S.; Breiteneder, H.; Melitta, K.; Hafner, C.; Vellekoop, M. An Infrared Absorbance Sensor for the Detection of Melanoma in Skin Biopsies. Sensors 2016, 16, 1659. [Google Scholar] [CrossRef] [Green Version]
  17. WHO. Control del cáncer. 2011. Available online: http://www.who.int/uv/faq/skincancer/en/index1.html (accessed on 5 May 2018).
  18. Nidaa, N.; Irtazab, A.; Javedc, A.; Haroon, M.; Mahmood, M. Melanoma Lesion Detection and Segmentation using Deep Region based Convolutional Neural Network and Fuzzy C-Means Clustering. Int. J. Med. Inform. 2019, 42, 1–24. [Google Scholar] [CrossRef] [PubMed]
  19. Yang, W.; DiCaudo, J. Effects of curettage after shave biopsy of unexpected melanoma: A retrospective review. Am. Acad. Dermatol. 2018, 78, 1000–1002. [Google Scholar] [CrossRef] [PubMed]
  20. Programming, R.P.C.V. P. Ashwin, 1st ed.; Packt: Birmingham, UK, 2015; pp. 7–93. [Google Scholar]
  21. Zegarra, R. Situación del Melanoma Maligno Cutáneo en el Hospital Militar Central Lima 1985–2007. Dermatología Peruana 2007, 18, 267–283. [Google Scholar]
  22. Pedro, B.; Andrea, L. Non-melanoma skincancer. Revista Médica Clínica las Condes. Revista Médica Clínica Las Condes 2011, 22, 737–748. [Google Scholar] [CrossRef] [Green Version]
  23. Zhang, B.; Kuang, D.; Tang, X.; Mi, Y.; Luo, Q.; Song, G. Effect of Low-field High-frequency nsPEFs on the Biological Behaviors of Human A375 Melanoma Cells. IEEE Trans. Biomed. Eng. 2017, 65, 2093–2100. [Google Scholar] [CrossRef] [PubMed]
  24. Francisco, G. Melanoma: Fundamentos del diagnóstico y la terapéutica. 2012. Available online: http://www.medigraphic.com/pdfs/actmed/am-2012/am124h.pdf (accessed on 20 March 2018).
  25. Swetter, M.; Tsao, H.; Bichakjian, K.; Lewandrowski, C.; Elder, E.; Gershenwald, E.; Grant-Kels, M.; Halpern, C.; Johnson, M.; Sober, J.; et al. Guidelines of care for the management of primary cutaneous melanoma. Am. Acad. Dermatol. 2018, 42, 208–250. [Google Scholar] [CrossRef] [Green Version]
  26. Iljaza, J.; Wrobelb, C.; Hriberseka, M.; Marna, J. The use of Design of Experiments for steady-state and transient inverse melanoma detection problems. Int. J. Therm. Sci. 2019, 135, 256–275. [Google Scholar] [CrossRef]
  27. Kostopoulosa, A.; Asvestasa, A.; Kalatzisa, K.; Sakellaropoulosb, C.; Sakkisb, H.; Cavourasa, A.; Glotsosa, T. Adaptable pattern recognition system for discriminating Melanocytic Nevi from Malignant Melanomas using plain photography images from different image databases. Int. J. Med. Inform. 2017, 105, 1–10. [Google Scholar] [CrossRef]
  28. Do, T.; Hoang, T.; Pomponiu, V.; Zhou, Y.; Zhao, C.; Cheung, N.; Koh, D.; Tan, A.; Hoon, T. Accessible Melanoma Detection using Smartphones and Mobile Image Analysis. IEEE Trans. Multimed. 2018, 20, 2849–2864. [Google Scholar] [CrossRef] [Green Version]
  29. Giotis, I.; Molders, N.; Land, S.; Biehl, M.; Jonkman, F.; Petkov, N. MED-NODE: A computer-assisted melanoma diagnosis system using non-dermoscopic images. Expert Syst. Appl. 2015, 42, 6578–6585. [Google Scholar] [CrossRef]
  30. Zamani, N.; Mohammadsadeh, B. Melanoma recognition in dermoscopy images using lesions peripheral region information. Comput. Methods Programs Biomed. 2018, 163, 143–153. [Google Scholar]
  31. Li, Y.; She, L. Skin Lesion Analysis towards Melanoma Detection Using Deep Learning Network. Sensors 2018, 18, 556. [Google Scholar] [CrossRef] [PubMed] [Green Version]
  32. Yuan, Y.; Lo, Y. Improving Dermoscopic Image Segmentation With Enhanced Convolutional-Deconvolutional Networks. IEEE J. Biomed. Health Inform. 2019, 23, 519–526. [Google Scholar] [CrossRef] [PubMed] [Green Version]
  33. Elbaum, M.; Kopf, A.; Rabinovitz, H.; Langley, R.; Kamino, H.; Mihm, M.; Sober, A.; Peck, G.; Bogdan, A.; Gutkowicz-Krusin, D.; et al. Automatic differentiation of melanoma from melanocytic nevi with multispectral digital dermoscopy: A feasibility study. J. Am. Acad. Dermatol. 2001, 2, 207–218. [Google Scholar] [CrossRef]
  34. Abbas, Q.; Celebi, M.; Fondon, I. Skin tumor area extraction using an improved dynamic programming approach. Skin Res. Technol. 2011, 18, 133–142. [Google Scholar] [CrossRef]
  35. Abuzaghleh, O.; Barkana, D.; Faezipour, M. Noninvasive Real-Time Automated Skin Lesion Analysis System for Melanoma Early Detection and Prevention. IEEE J. Transl. Eng. Health Med. 2015, 3, 1–12. [Google Scholar] [CrossRef]
  36. Guerra, E.; Alvarez, J. Methodology for diagnosing of skin cancer on images of dermatologic spots by spectral analysis. Biomed. Opt. Express 2015, 6, 1–16. [Google Scholar]
  37. Amoabedini, A.; Saffari, M.; Saberkari, H.; Aminian, E. Employing the Local Radon Transform for Melanoma Segmentation in Dermoscopic Images. J. Med. Signals Sens. 2018, 18, 184–194. [Google Scholar] [CrossRef]
  38. Lee, D.; Mendes, I.; Spolaora, N.; Tales, J.; Rafael, A.; Chung, F.; Fonseca, R. Dermoscopic assisted diagnosis in melanoma: Reviewing results, optimizing methodologies and quantifying empirical guidelines. Knowl.-Based Syst. 2018, 158, 9–24. [Google Scholar] [CrossRef]
  39. Mendonca, T.; Ferreira, M.; Marcal, R.; Rozeira, J. A dermoscopic image database for research and benchmarking. Int. Conf. IEEE Eng. Med. Biol. Soc. 2013, 35, 1–4. [Google Scholar]
  40. Qasim, M.; Hussain, A.; Rehman, S.; Khan, U.; Maqsood, M.; Mehmood, K.; Khan, M. Classification of Melanoma and Nevus in Digital Images for Diagnosis of Skin Cancer. IEEE Access 2019, 7, 90132–90144. [Google Scholar]
  41. ISIC. A. Cummings and A. Kalloo. 2015. Available online: https://www.isic-archive.com/#!/topWithHeader/wideContentTop/main (accessed on 9 September 2018).
Figure 1. Melanoma images. (a,c) simple images and (b,d) dermatological images. (a,b) benign melanoma cases, and (c,d) malignant melanoma cases.
Applsci 10 01098 g001
Figure 2. Flowchart of the proposed method.
Applsci 10 01098 g002
Figure 3. Example of the detection and classification of melanoma corresponding to Algorithm 1. (a) the input image I ( a ) ; (b) corresponds to the identification of possible cases of melanoma after noise and skin removal I ( b ) ; (c) shows the semiplanes formed for the evaluation of symmetry a; (d) the edge identified d.
Applsci 10 01098 g003
Figure 4. Removal of skin and noise from the original image. (a) original image, (b) results obtained after applying the Gaussian filter, (c) final results obtained after applying mathematical morphology.
Applsci 10 01098 g004
Figure 5. Symmetry and shape identification test. (c,d) comparison using the largest axis, (a,b) comparison using the smallest axis.
Applsci 10 01098 g005
Figure 6. Example of symmetry estimation. Ellipse and rectangle inscribed in the outline of the possible case of melanoma, identification of midpoints, and semiplanes.
Applsci 10 01098 g006
Figure 7. Proposed multilayer perceptron, four input data, and one output data.
Applsci 10 01098 g007
Figure 8. Cross-Validation, the 10 subsets are randomly selected.
Applsci 10 01098 g008
Figure 9. Examples of identification and classification of malignant melanoma cases in simple images.
Applsci 10 01098 g009
Figure 10. Examples of identification and classification of malignant melanoma cases in dermatological images.
Applsci 10 01098 g010
Figure 11. Comparison of efficiency between reported literature and the proposed approach.
Applsci 10 01098 g011
Table 1. Relevant research in the detection of melanoma using dermatological image.
YearReferenceEfficiencySample of Images
2001[33]92.5%63
2011[34]96.3%100
2014[7]82.7%866
2015[35]96.5%200
2015[36]95.4%332
2018[37]96.7%76
2018[38]79.9%104
2018[37]94.8%206
2018[30]96.0%undefined [39]
2019[40]96%397
2019[18]95.5%undefined [41]
Table 2. Accuracy obtained using different MLP (Multilayer Perceptron) architectures.
MLP ArchitecturesSimple ImagesDermatological ImagesAverage
4-8-197.0797.9397.50
4-16-197.1897.4097.32
4-32-197.8697.5797.66
4-64-197.7597.7797.76
4-128-197.8997.9997.95
4-256-198.0898.0998.09
4-1024-198.5798.6598.62
4-16-16-198.2998.7798.60
4-32-32-198.1897.9998.05
4-64-64-198.0798.1798.13
4-128-128-198.1897.4097.66
4-256-256-197.9998.1698.10
4-1024-1024-197.9998.1998.12
4-16-16-16-198.3397.4097.71
4-256-256-256-198.1098.1098.10
Table 3. Accuracy obtained with different descriptors setup.
DescriptorAccuracy
Symmetry (a)Edge (b)Color (c)Dimension (d)Simple ImagesDermatological Images
xxxx98.5798.65
xxx 94.0690.38
xxx95.7494.80
x xx93.0393.40
xx x94.0992.38
xx 91.0490.24
xx 90.5487.24
xx90.3188.63
x x91.0992.08
x x 93.1489.94
x x84.9691.34
x 76.0386.38
x 72.4883.67
x 88.1785.29
x70.8584.74
Table 4. 10-fold cross-validation accuracy.
Type of Imagek = 1k = 2k = 3k = 4k = 5k = 6k = 7k = 8k = 9k = 10Average
Dermatological97.8998.1510097.2310097.910098.4197.8699.1198.65
Simple98.2799.0196.8999.3010097.9898.7799.3498.1698.0298.57

