1. Introduction
With the rapid growth of wireless multimedia traffic, there is an urgent need to develop new techniques that transmit diverse data types to realize information exchange among various types of devices. Device-to-device (D2D) communication permits mobile terminals to communicate directly with each other in a licensed spectrum under the control of evolved Node B (eNB) [
1,
2]. In the last few years, D2D communication has been regarded as a key technology in 5G cellular networks, which could provide higher data rates and quality of service (QoS) provisioning [
3,
4]. Furthermore, D2D communication has been extensively studied in sensor networks [
5,
6], ad-hoc networks [
7], and mobile health systems [
8]. D2D communication in cellular networks can significantly strengthen the network architecture and the reliability of transmission among devices. However, the advantages of D2D communication are based on several challenges, including device discovery, mode selection, interference management, and so on. In contrast to traditional cellular networks, D2D heterogeneous networks have overlay and underlay scenarios. In overlay D2D communications, there is no interference between D2D and cellular users (CUs) because parts of the cellular channel spectrum are dedicated to D2D users. In D2D underlay cellular networks, more complex interferences are introduced by D2D links reusing cellular spectrum resources. Thus, addressing the co-channel interference issue by developing a reasonable interference management scheme is crucial for maintaining the QoS of D2D underlay cellular networks.
Stochastic geometry has been proven to be a powerful mathematical tool to model randomly distributed devices and numerically analyze the network performances [
9]. It was used to solve various problems for D2D networks in [
10,
11,
12,
13]. The common point of these works is that D2D transmitters (DTs) are modeled as a Poisson point process (PPP). However, these works were not concerned with random data generation and the queuing behavior of users. In that way, some substantive performance parameters were ignored, such as the overflow dropping caused by a saturated buffer and delays caused by an empty buffer.
Several studies on performance analysis of D2D communications using the queuing model have been reported in the literature [
14,
15,
16]. Existing works have also built the spatiotemporal model simultaneously based on the queuing theory and stochastic geometry (e.g., [
17,
18,
19]). However, in these works, the transmitter sends packet in order; if the packet is not correctly received due to interference and an intrinsically unreliable channel, it is dropped. The dropping probability would rise significantly in a severe interference scenario. The authors did not consider retransmission schemes to improve the transmission reliability and lower the dropping probability.
As we all know, when digital data need to be transmitted from a transmitter to a receiver, some packets may be corrupted or even lost entirely because of the time-varying characteristics of the channel and the indeterminacy of the communication distance. Automatic repeat request (ARQ) is a well-known protocol used to cope with this problem, which has been extensively employed in next-generation wireless packet data networks to provide reliable communication [
20]. Stop-and-wait (SW-ARQ) is one of the classic ARQ schemes [
21]. In SW-ARQ, the transmitter waits for feedback acknowledgment after it sends a data packet to the corresponding receiver. According to the error detection results, if the packet is received correctly (ACK), the transmitter sends the next packet in the queue. Otherwise, the transmitter receives a negative acknowledgment (NACK), and the same packet is scheduled and retransmitted immediately. This process continues until the packet is positively acknowledged. SW-ARQ is easily implemented and ensures that packets are received in the same order, so no resequencing is needed. Furthermore, in several works addressing the queuing model for D2D communications with retransmission schemes [
22,
23], the authors did not describe the packet retransmission process by the feedback queuing model.
In this paper, we construct a spatiotemporal traffic model with a retransmission strategy to evaluate the performance of D2D underlay cellular networks, where the data packets’ arrival is initiated randomly and the departure is governed by the received signal-to-interference-plus-noise ratio (SINR). The main contributions of this paper include three parts: Firstly, from the perspective of spatial distribution, we employ the tools of stochastic geometry to derive the coverage probability of D2D user. Secondly, from the temporal domain perspective, the exact queueing behavior of D2D users with the retransmission mechanism in D2D underlay cellular networks is developed by queuing theory, in which sporadic data generation instead of saturated traffic affect the interference state and further network QoS performance evaluation. Third, an embedded Markov chain is used to model the queue length state transition. The steady-state probability distribution is computed using an iterative solution, and the expressions of performance metrics are obtained.
The main contributions and outcomes of this paper are as follows:
We develop a stochastic traffic model to model a retransmission mechanism for D2D underlay communication. By using the stochastic geometry model for a user’s position, interference levels experienced by D2D users are also quantified, and simple formulas of coverage probability are derived. A queuing model with feedback is adopted to analyze the performance of dynamic traffic for a D2D underlay cellular network.
The retransmission strategy is modeled as feedback queuing to explore the effects of the number of retransmission attempts on key system parameters. In order to analyze the queuing behavior in the buffer, we formulate it as an embedded Markov chain and compute its steady-state distribution by the iterative solution. The closed-form expressions of performance metrics, namely the average queue length, mean throughput, average packet delay, and packet dropping probability, are obtained.
Simulation results indicate that the dropping probability and average throughput are affected by setting an appropriate number of retransmission attempts. The dropping probability gradually decreases as the retransmission attempts increase. However, when the arrival rate is comparatively high, the optimal throughput is reached after fewer retransmission attempts because of the limited buffer. Simulation results show the validity and rationality of the theoretical analysis.
The remainder of this paper is structured as follows.
Section 2 reviews related works, and
Section 3 describes the system model.
Section 4 gives the details and transmission strategy of the feedback queuing model applied to D2D communication and the transition probability matrix of the embedded Markov chain.
Section 5 introduces the solving process of the steady-state probability distribution in detail. Expressions of the performance metrics, namely average queue length, average throughput, average packet delay, and packet dropping probability, are derived. In
Section 6, the simulation results are reported, and they demonstrate the validity and rationality of the theoretical analysis. Finally, a brief conclusion and possible future work are presented in
Section 7.
2. Related Work
D2D underlay cellular networks can be subject to interference among cellular users and D2D users because of the spectrum-sharing mechanism. A proper interference management scheme is crucial for maintaining the QoS of D2D and cellular links. The authors in [
24] proposed centralized and distributed power control algorithms to improve the coverage probability of cellular users and maximize the sum rate of D2D links in D2D underlay cellular networks. In [
25], joint power control and radio resource allocation techniques were adopted to maximize the number of D2D users allowed in the network. The authors in [
26] specified accessible regions for D2D users and reusable regions for cellular users. In their approach, once the cellular users entered the reusable region, D2D users in the accessible region were capable of reusing the radio resource. The results showed that both cellular and D2D users could achieve a higher SINR compared with the result in [
27]. A resource management and power control scheme was proposed in [
28] to mitigate the co-channel interference from D2D users to cellular users.
It is well known that mathematical methods play a significant role in system modeling and optimization analysis [
29,
30,
31]. To get the probability that a typical mobile user is able to achieve some threshold SINR, the random spatial positions of mobile users need to be modeled by stochastic geometry rather than Monte Carlo methods. In [
29], the authors introduced the service success probability to capture the mobility of users and the activeness of communication links in a cache-enabled D2D cellular network. Simulation results revealed the influence of file size distributions on performance metrics. The authors in [
30] analyzed the performance of network-assisted D2D discovery in random spatial networks and derived useful guidelines. The Poisson point process was used to model the base station (BS) position, and approximate expressions for the distribution of the distance between two D2D users were derived. The study in [
31] focused on a distributed caching device-to-device network in which the contents were cached as several portions in the buffer of other devices. By using the stochastic geometry model, the mobility patterns of D2D users were evaluated. The results demonstrated that user mobility improved the coverage probability.
The system models in the aforementioned works were developed for saturated traffic with infinite wireless data generation, which affected the interference state and further network QoS performance evaluation. It is important to establish a dynamic traffic model to describe sporadic wireless data generation instead of saturated traffic. There are some literature works related to performance analysis on D2D communications using the queuing model [
15,
32,
33]. In [
15], the authors investigated the performance of resource allocation schemes in D2D communications by formulating a queuing model with a resource allocation strategy. In [
32], the authors investigated the stability region for overlay D2D communication in which a user-to-user communication and user-to-BS communication coexisted. A new transmission strategy was proposed in [
33], which modeled the characteristics of dynamic interference and system behavior as an M/G/1queuing model.
In the existing works, the authors considered both the spatial distribution and unsaturated traffic model by combining the tools from stochastic geometry and queueing theory, such as [
17,
18]. The analysis in these works considered the traffic generated at random spatial regions. However, packet retransmissions on each link were not taken into account. For example, in the work in [
17], the authors investigated a distributed D2D power allocation framework, in which D2D pairs reused the channel of interior cellular users. By using stochastic geometry, an individual interference budget that each D2D pair may not exceed toward the CUs was derived. D2D queueing stability was one of the constraint conditions of the proposed distributed flow control and power allocation strategies. In [
18], the notion of delay outage was proposed to evaluate the effect of different scheduling policies in multi-point-to-multi-point communications.
However, in some literature works about D2D communications with retransmission schemes [
22,
23], they did not construct the spatiotemporal arrival of the traffic model. For example, the work of [
22] addressed the impact of retransmission protocols on the total energy efficiency of the D2D system. The goal was to minimize the average total transmission power, but it did not consider the impact of unsaturated traffic to some substantive performance parameters. Furthermore, the authors of [
23] considered the end-to-end queuing model for relay-assisted D2D communications, in which each user maintained a fixed-size buffer for storing the arrived packets. A relay selection scheme was proposed.
As for the works in [
34,
35], the authors built a queuing model to describe the influence of retransmission schemes on D2D users. They discussed the influence of channel time-variant characteristic on the probability of an erroneous transmission, but they assumed an error-prone channel model without interference. The assumption was quite unpractical in an actual communication network. We try to further take into account the impact of interference caused by other active users sharing the same frequency spectrum.
3. System Model and Assumptions
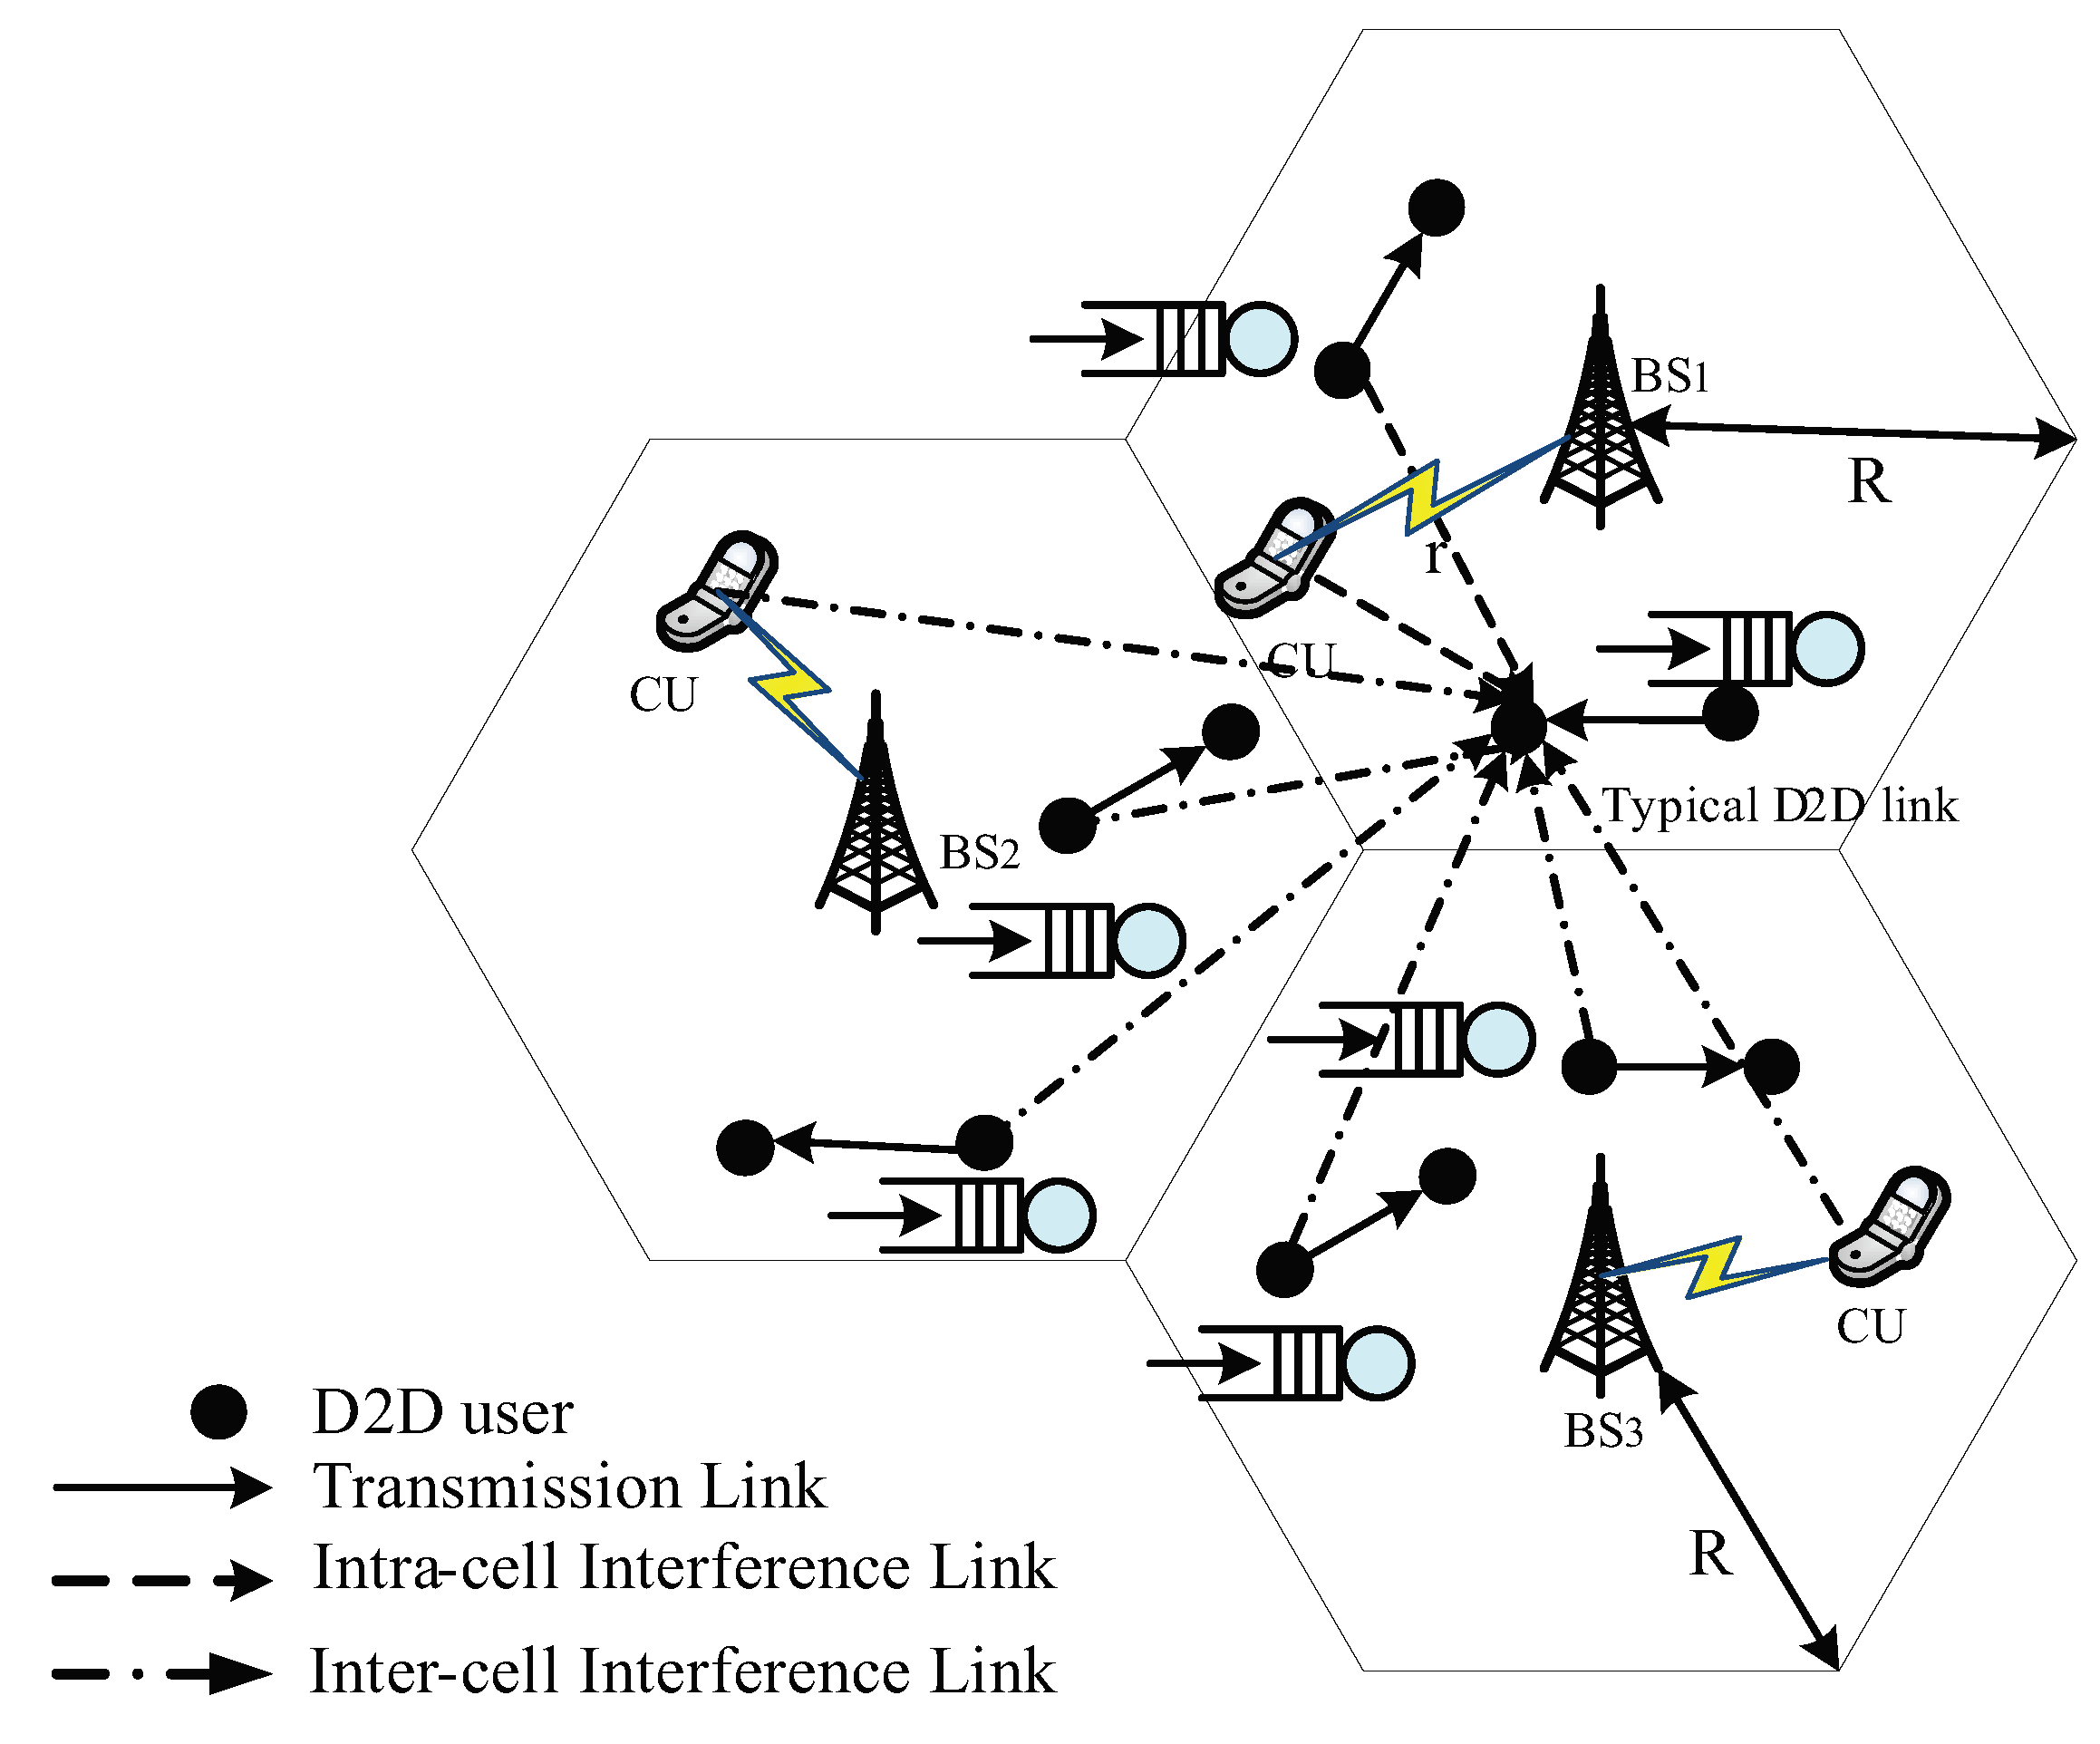
In this section, we give the system model and some key network assumptions. As shown in
Figure 1, we studied a D2D underlying cellular network, in which uplink spectrum resources were orthogonally assigned to different cellular users and reused by D2D links within a cell. The coverage region of a BS was assumed to be a disk
A with radius
[
36], in which
is the BS density per unit area. BS is at the center of a cell. The distance from the CU to its serving base station is defined as
. The probability density function (PDF) of
r is
.
Cellular users formed a PPP
with intensity
and were uniformly distributed in one cell. The locations of D2D transmitters were assumed to follow a 2D homogeneous PPP distribution
with density
. The distance from a D2D transmitter to its corresponding receiver was fixed [
36]. Further, each D2D transmitter was assumed to be equipped with finite buffers for storing the sporadic arriving packets, in which only the non-empty queues caused interferences with other links. As for D2D users with data to be transmitted, they formed a thinned PPP
with intensity
, in which
indicates the probability of non-empty queue status.
Based on the above-mentioned assumptions, the SINR at D2D receiver
m can be written as:
where
represents the interference from cellular users and
is the interference from the D2D transmitters with non-empty data queues. The expressions of
and
are
,
.
and
represent the D2D user and CU transmission power.
and
represent small-scale fading from D2D transmitter
m to D2D receiver
n and from D2D transmitter
m to cellular user
l, respectively. We assumed the distance-dependent path-loss model, i.e.,
and
, in which
and
are the distance between D2D transmitter
m and D2D receiver
n and cellular user
l, respectively.
and
are denoted as the path loss attenuation factor of the cellular link and the D2D link, respectively.
denotes the power of the additive white Gaussian noise.
4. Queuing Model and Feedback Strategy
In this section, with consideration of sporadic wireless data generation and a limited buffer, we adopted the feedback queuing model to capture the characteristic of the retransmission mechanism. This paper adopted the feedback priority strategy and gave precedence to the feedback data. This was suitable to model the behavior of data transmission under the SW-ARQ protocol. Then, the SW-ARQ protocol avoided the reorder operation in the receiver buffer. Modeling SW-ARQ by using feedback queuing theory provided fundamental research of further dynamic modeling for the complex ARQ protocol. In the derivation, the embedded Markov chain was used to obtain the key parameters of D2D underlay cellular networks. The general queuing model with feedback is described in detail in this section.
4.1. Analysis Model of the Feedback Queuing Model
To show the impact of buffering at the D2D transmitter, queuing theory was modeled to approximate the traffic state of the D2D data-link. We modeled the packet arrival by a Bernoulli process with probability
q, while modeling the server system as a queuing model with feedback [
37]. Let
be the transmission success probability of data packets, which depends on the received SINR of the D2D user across time slots.
With the SAW-ARQ protocol, the transmitter received a status report from the receiver after the transmission and then started the next transmission round. We defined one slot as the duration time, which included the time to send the preceding packet at the front of the queue, the arrival of one new packet, and the acknowledgment of the feedback delay. As a matter of fact, some existing studies [
37,
38] assumed that error detection and the transmission of acknowledgment packets used no time at the receiver.
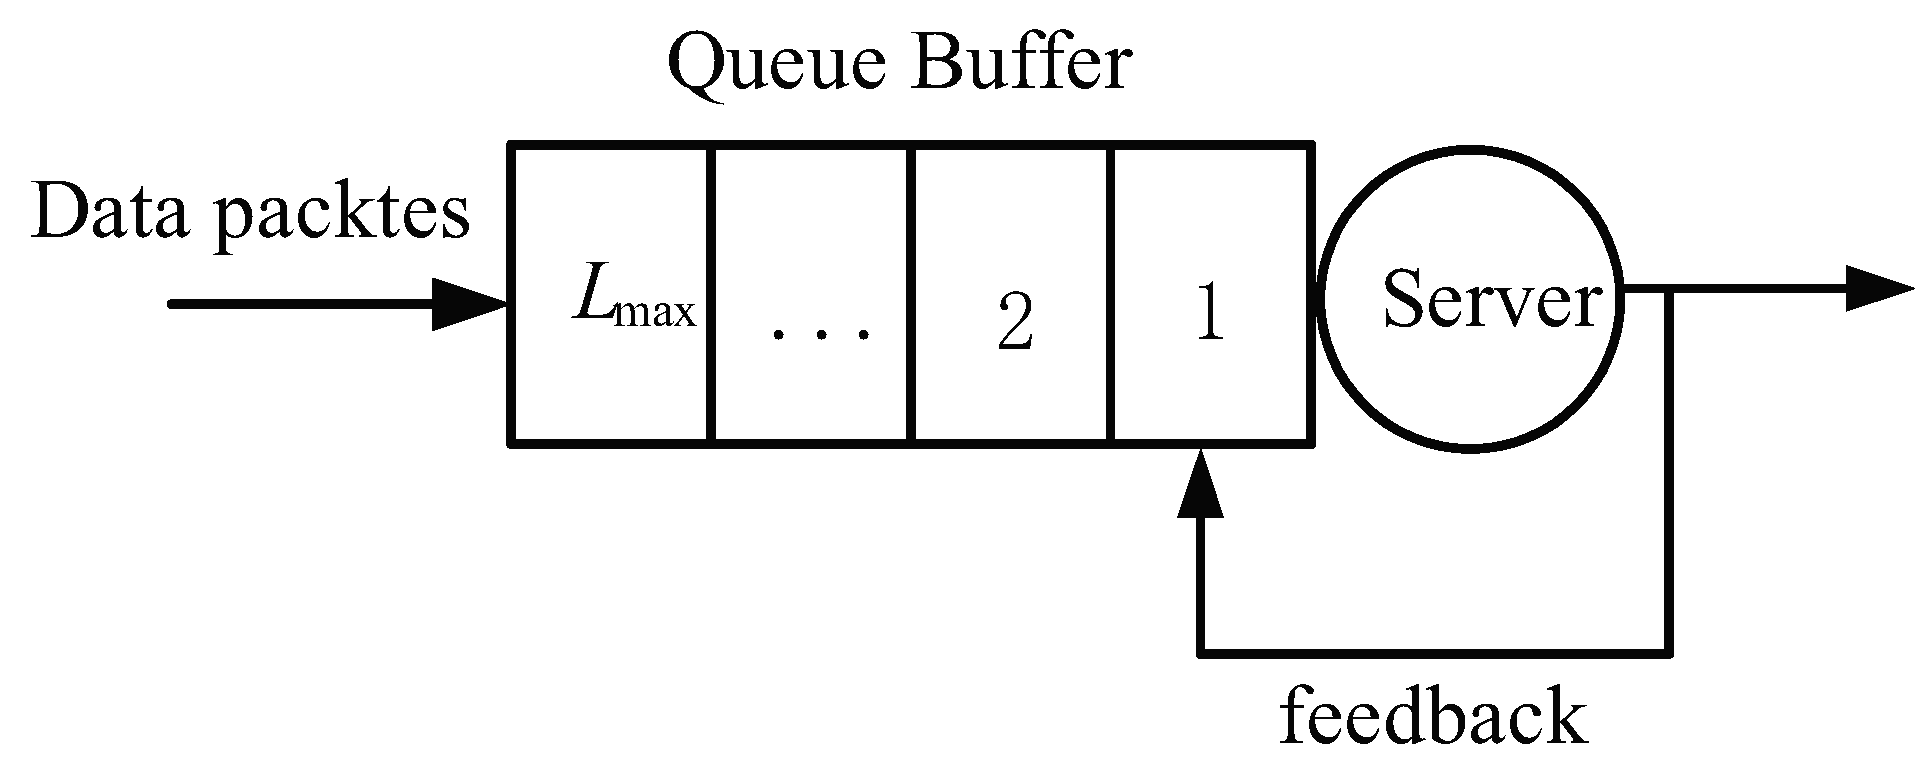
In this study, both were completed at the end of the slot, and the transmission was scheduled for the next time slot. If packet transmission was successful, the next packets were sent; otherwise, the packet for retransmission had a preemptive priority and occupied the front of the queue. That means that the feedback packet was sent first at the beginning of the next round of transmission. We set the D2D transmitter (D2D-TX) to be equipped with a finite buffer of
packets, which was the same assumption as that applied in [
39,
40]. If the queue length reached the buffer capacity, subsequent arriving packets were dropped; this approximation was also used in previous research [
41]. Without loss of generality,
Figure 2 shows the feedback queuing model.
Furthermore, considering the timeliness of data transmission, we set the maximum number of retransmission attempts at K, after which the failed packets were dropped. In other words, a packet had k chances to be successfully sent, where . The packet transmission failure had a probability of , in which case it returned to the head of the queue for retransmission during the next time slot . A retransmission attempt counted only if the packet was successfully sent. It was sent again if a sending failure occurred, and that cycle repeated until the packet was retransmitted K times. It was necessary to account for the queuing length in the buffer when checking the state of the sent packet. We defined the probability set of the packet transmission state as .
As mentioned above, when , the current processing packet was in its first sending state in two cases:
Case 1: The previous packet was sent successfully, provided it was in any state j, .
Case 2: When the previous packet reached the upper bound of the number of retransmission attempts, this packet dropped from the queue. We obtained the probability of the packet transmission state as follows:
4.2. Stochastic Geometry Analysis for Service Probability
While maintaining a minimum level of quality of service, the servers’ probability of the D2D data queue was defined as the probability of the received SINR above a certain threshold , which also accounted for the interference between the backlogged links. Using stochastic geometry, the transmission success probability was characterized via the following lemma.
Lemma 1. In the depicted underlying D2D network, the transmission success probability was the complementary cumulative distribution function (CCDF) of the SINR of D2D links, which is expressed as: where and are the Laplace transforms of and given by:and: Proof of Lemma 1. Following [
9], we can denote the Laplace transform of the total interference
I measured at the origin, as for the benefit of the QoS performance of D2D communications, the servers’ probability is defined as the probability of the received SINR above a certain threshold, which also accounts for the interference between the backlogged links. The successful transmission probability is expressed as:
where
is the PDF of the distance from the typical D2D user to the served BS, which is equal to
. Because
, by following the same derivation given in [
40], the coverage probability is expressed as:
and:
where
is true based on the i.i.d. distribution of
and
is from the probability generating functional (PGFL) of the PPP. By the same way, the derivation of
:
By substituting (
7)–(
9) into (
6), the closed-form expression of successful transmission probability is obtained, which shows that establishing a D2D link needs to meet the lower bound of SINR. □
4.3. Embedded Markov Chain Approach
The queuing process was represented by a single dimension discrete time Markov chain, and the state set was denoted as
. We adopted the embedded Markov chain to analyze the packet state of the D2D buffer. The corresponding probability transition matrix is expressed as:
where
denotes the transition probability of the queue length state from
i to
j.
For the diagonal of matrix
, when
, the transition from state
i to
occurred only when the data were successfully transmitted and there was no data packet arrival. If the packet was sent for the
time, it left the queue regardless (that is, whether successfully transmitted or not).
When
, the transition from state
i to
i occurred in two conditions: First, the packet failed to be sent, and there was no data arrival with the probability
. Second, a packet was successful sent, while a new packet arrived with the probability
q. The transition probability is described as follows:
Specifically, when
, the transition occurred as long as the packet in the sending state from State 1 to
failed to be sent because of the limited buffer.
When
, the transition of the queue length from
i to
occurred only if the packet failed to be sent and a packet arrived with probability
q.
6. Numerical and Simulation Results
In this section, we present the MATLAB simulations that were used to verify the validity of the above analytical results. The extensive simulation results are given to illustrate the behavior of the system with respect to the change in its loading parameters. The performances under different D2D density and packet arrival rates are investigated using the results of simulations and theoretical analysis. Further, we present the dropping probability of the D2D link with and without the retransmission strategy, and the optimal retransmission time was obtained by maximizing the average throughput. The major parameters in our simulation are listed in
Table 1. In the following numerical results, unless otherwise stated, we considered a simulation area of 20 km × 20 km. D2D transmitters were spatially distributed according to a homogeneous PPP with the density parameter
. Independent and identically distributed Rayleigh fading with unit variance was considered for all links. To validate our derived results, the simulation results were carried out and repeated for over 10,000 iterations. The simulation parameters that were based on the Monte Carlo simulation method are shown in
Table 1.
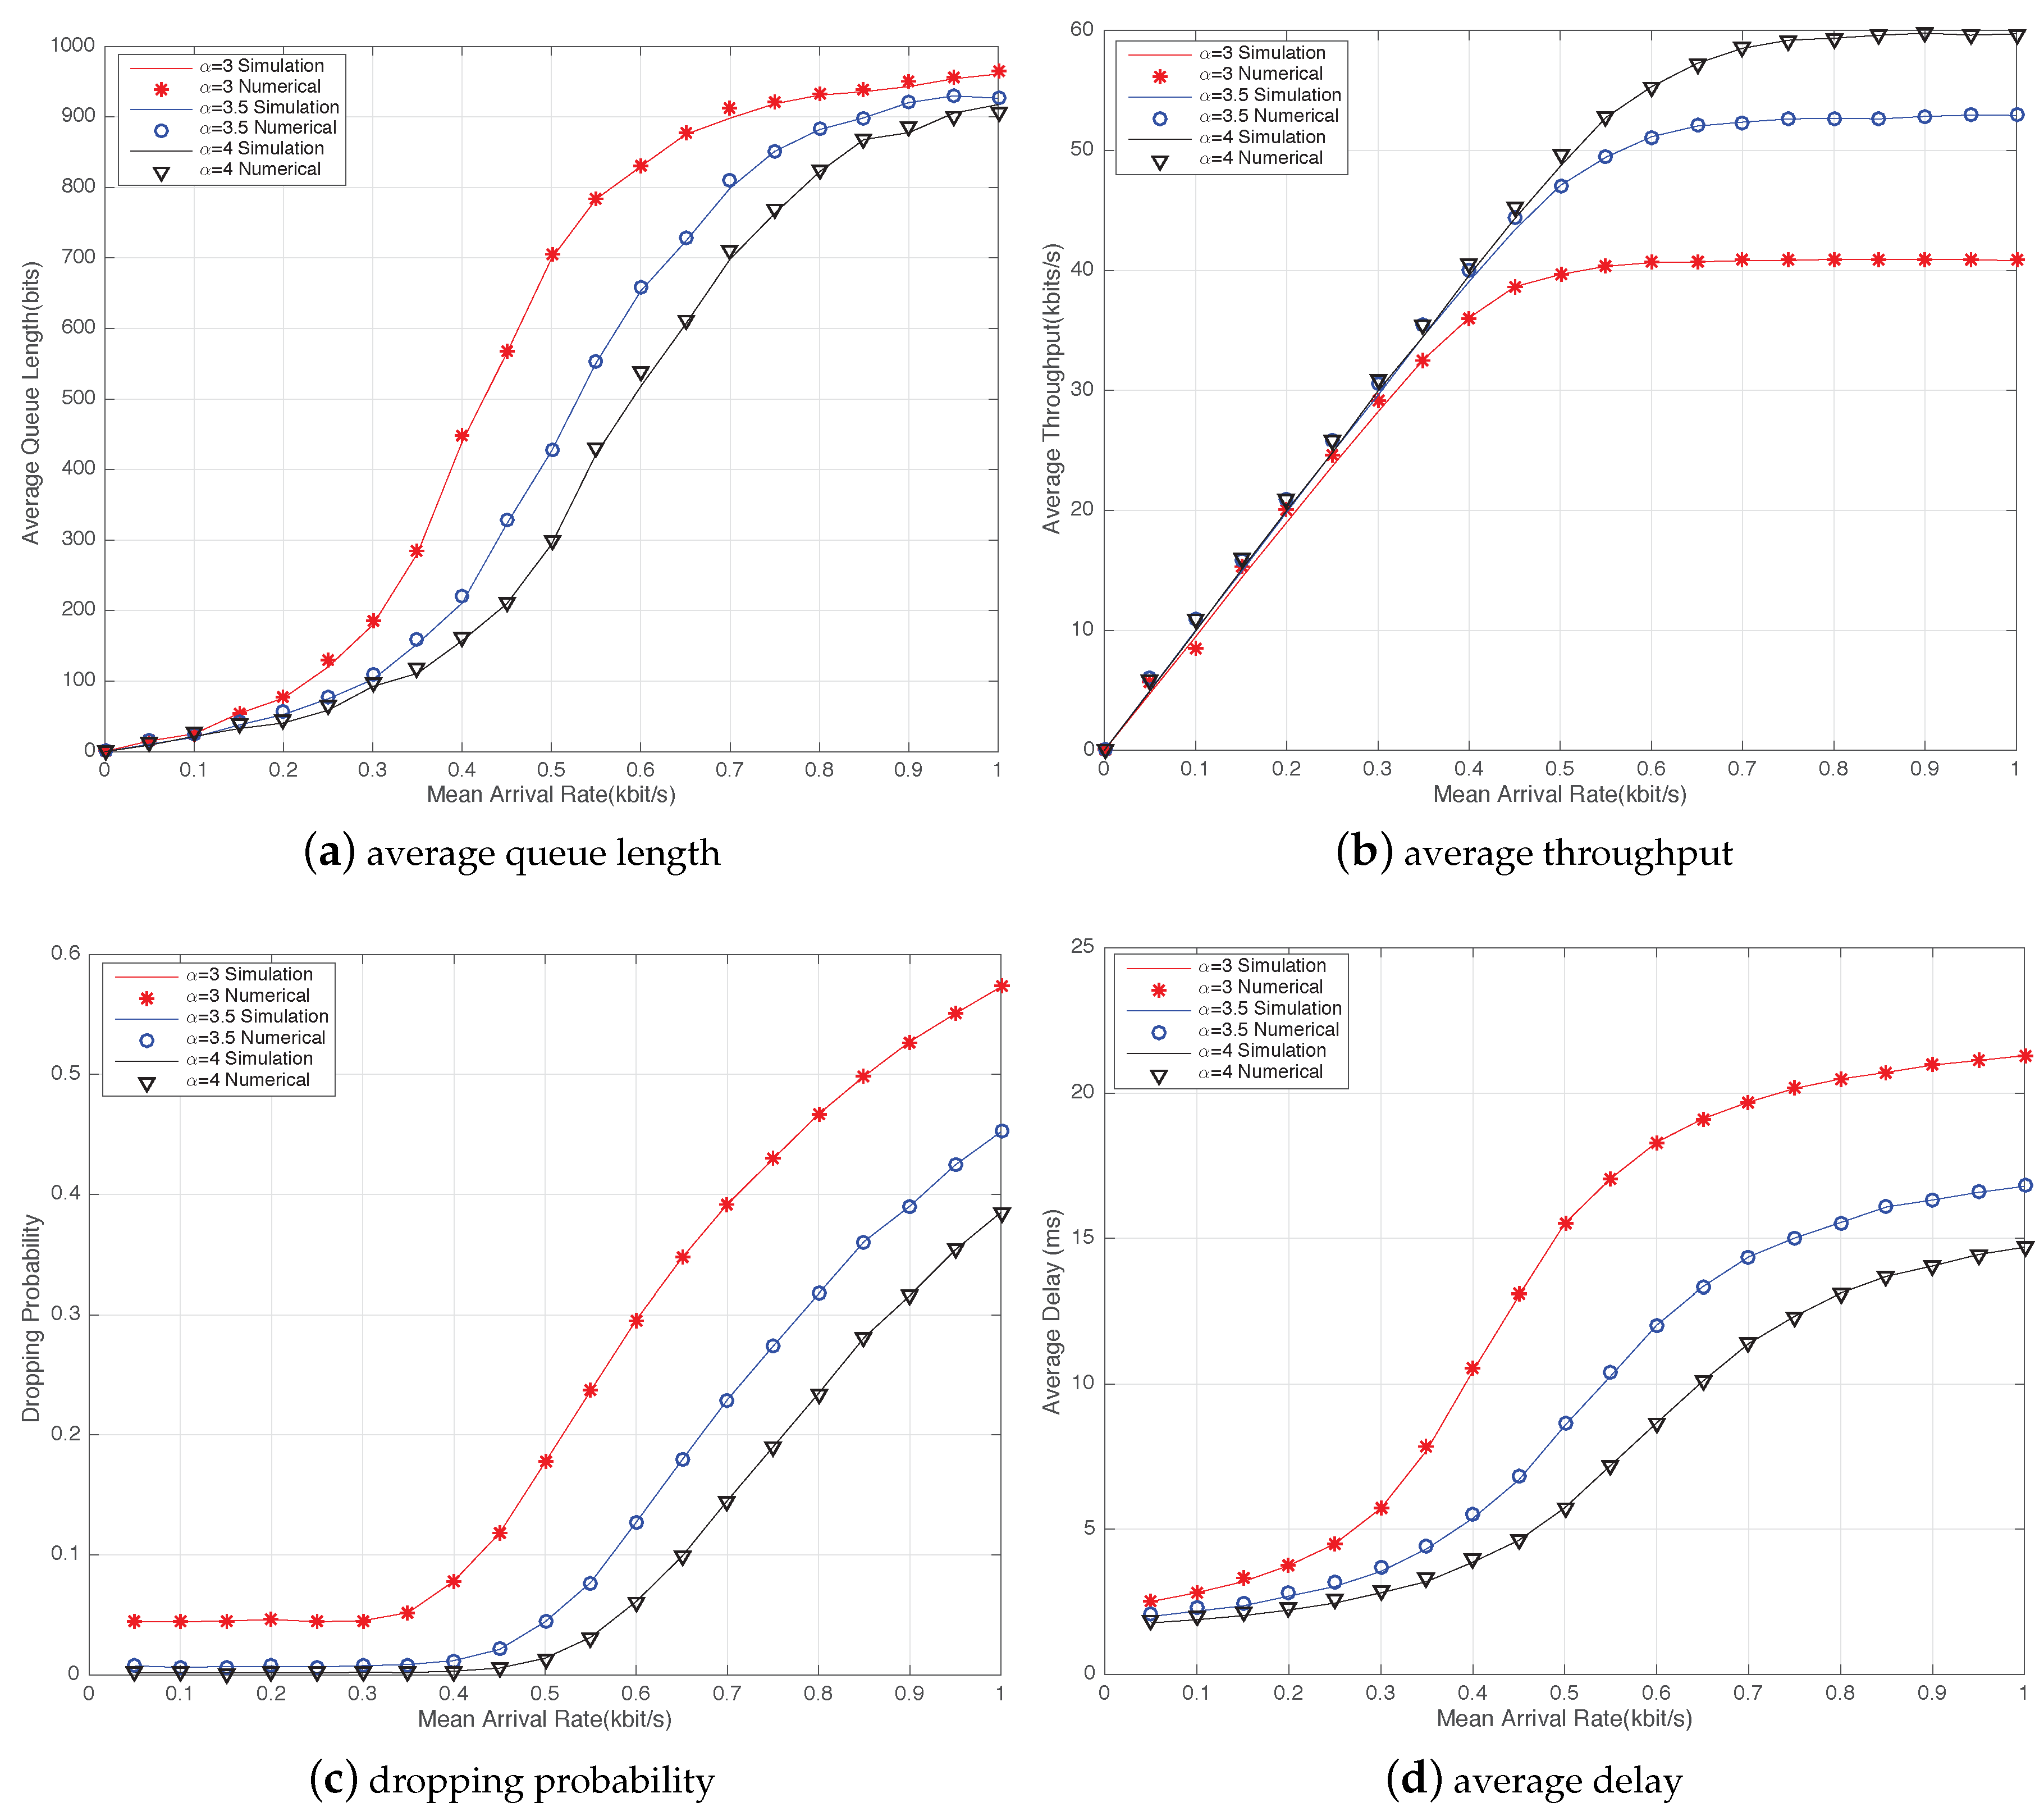
Figure 3 compares the numerical and simulation results in terms of the average queue length, average throughput, average delay, and dropping probability with varying data arrival rates and different path loss factors in D2D communications. The values of the path loss factor
were 3, 3.5, and 4. Without loss of generality, we set the number of D2D links as 30 in a single cell and the maximum number of retransmission attempts
. It can be seen that the numerical results closely coincided with the simulation results.
Figure 3a shows that the average queue length increased with the mean packet arrival rate, and
influenced the steepness of the curves. With the increase in the arrival rate, the average queue length increased and then reached the maximum buffer size. This means that the transmission ability of the D2D user was insufficient to send the packets within a time slot because of the high arrival rate. The average throughput varied with the mean arrival rate, and the path loss exponent is displayed in
Figure 3b. When the arrival rate was not more than the successful transmission probability, the average throughput increased with the arrival rate. The reason was that lightly loaded D2D sent data packets without blocking the queue. When the arrival rate exceeded the transmission ability, the average throughput reached saturation, and the dropping probability sharply increased, as shown in
Figure 3c, which was caused by increasing overflow dropping packets.
Figure 3d is the curve of the average delay. Take
for example: the average delay tended to be relatively flat after
. The reason was that the fixed sending capability slowed the growth rate of the average delay when the queue buffer was full.
Figure 3 also shows the influence of the path loss factor. Compared with
and
, the average queue length for
reached saturation more quickly. Note that the average performance had a gradually decreasing trend with a lower path loss exponent, and more packets were left in the queue. As a result, the average throughput was even lower, and the average delay and dropping probability were much higher. The results indicated that higher path loss reduced the influence of interference links to the D2D receiver and improved the probability of successful transmission.
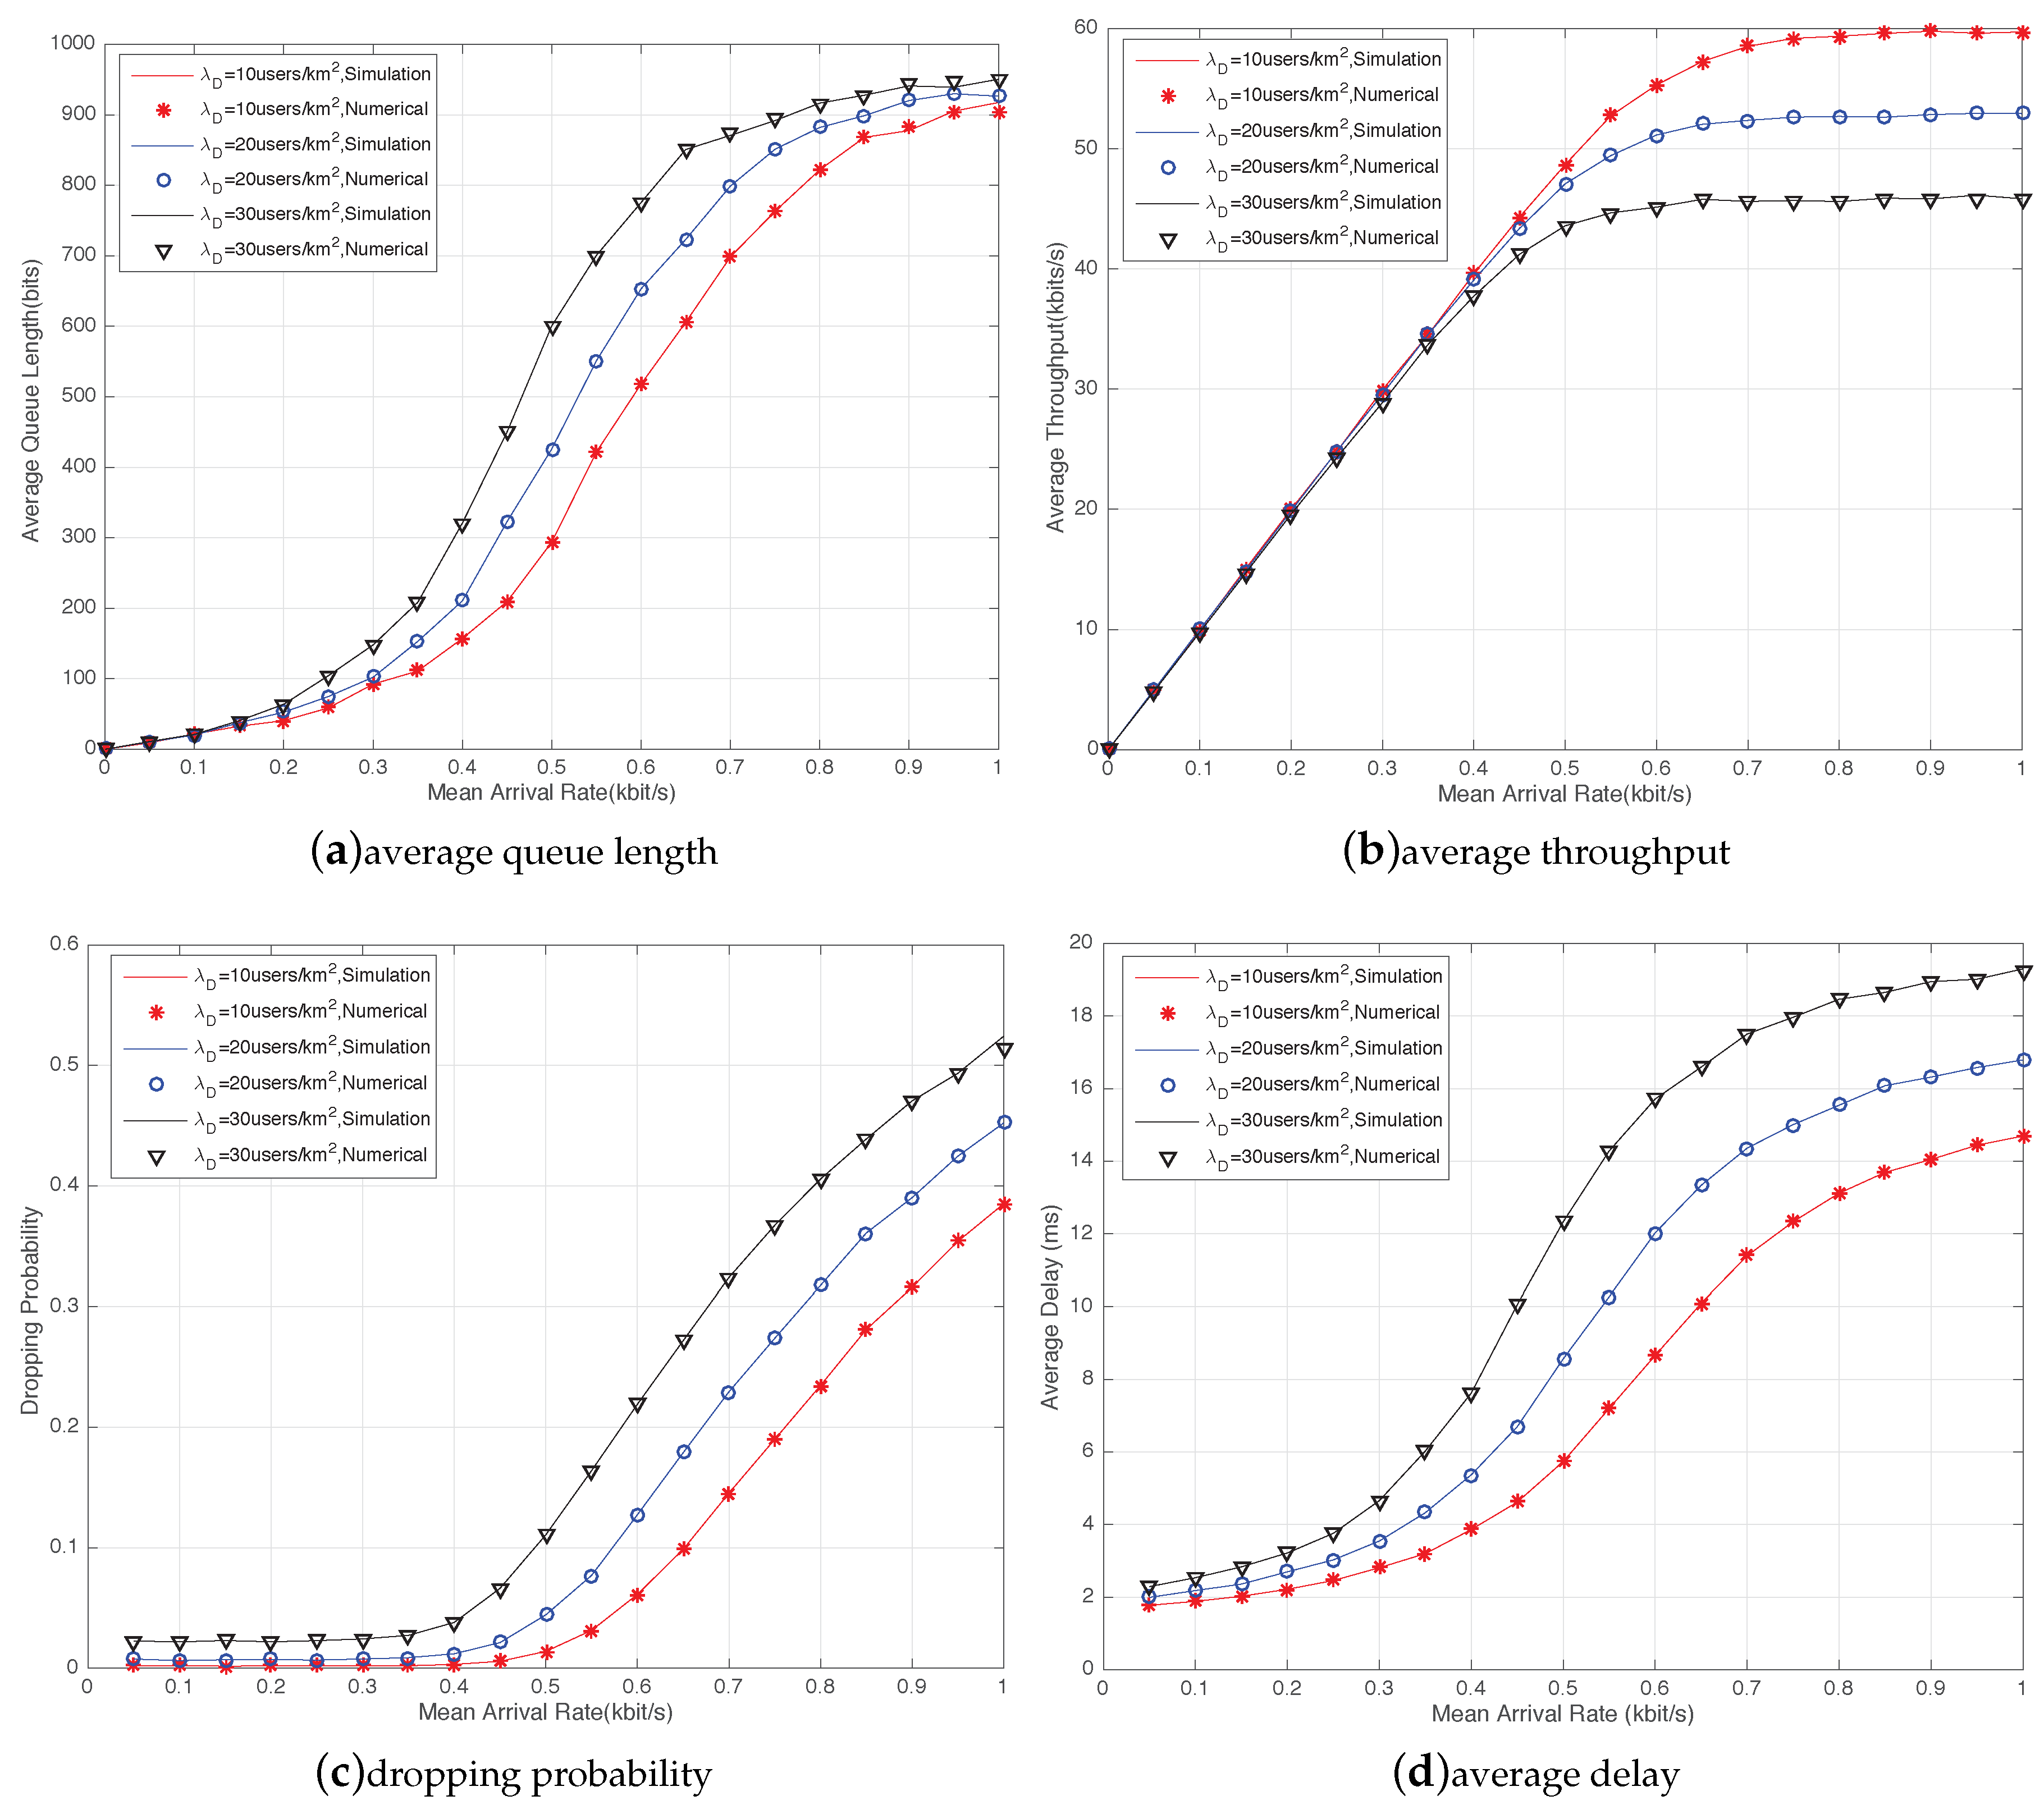
Then, we evaluated the impact of D2D density on the performance parameters in
Figure 4. We set
. We can see that the analytical and simulation results basically matched. In
Figure 4a, with the increase in the mean arrival rate, the average queue length was much quicker to reach the maximum capacity as more D2D links accessed the network. This was because when the received interference increased, more packets returned to the queue for retransmission.
Figure 4b,d shows that a high D2D density
resulted in lower average throughput and higher average delay compared with the performance for
and
. The reason was that higher interference received by the D2D transmitter resulted in a longer waiting time for the packets. The throughput became lower, and packets needed to wait longer to be transmitted.
Figure 4c illustrates the dropping probability as the packet arrival rate varied for different D2D density. As discussed below, the dropping probability included two parts: (1) the arrival of packets caused by the overflow, which was related to the mean arrival rate and buffer size; (2) according to the retransmission strategy, the dropping probability was generated by the failure of data transmission in the
sending attempt. When the arrival rate was comparatively low, the number of packets in the buffer was quite small. Thus, the dropped packets were mainly caused by unsuccessful sending, which was determined by the instantaneous channel situation. When the arrival rate increased, the dropping probability increased markedly and continued to grow. The dropping probability was mainly influenced by a heavy traffic load.
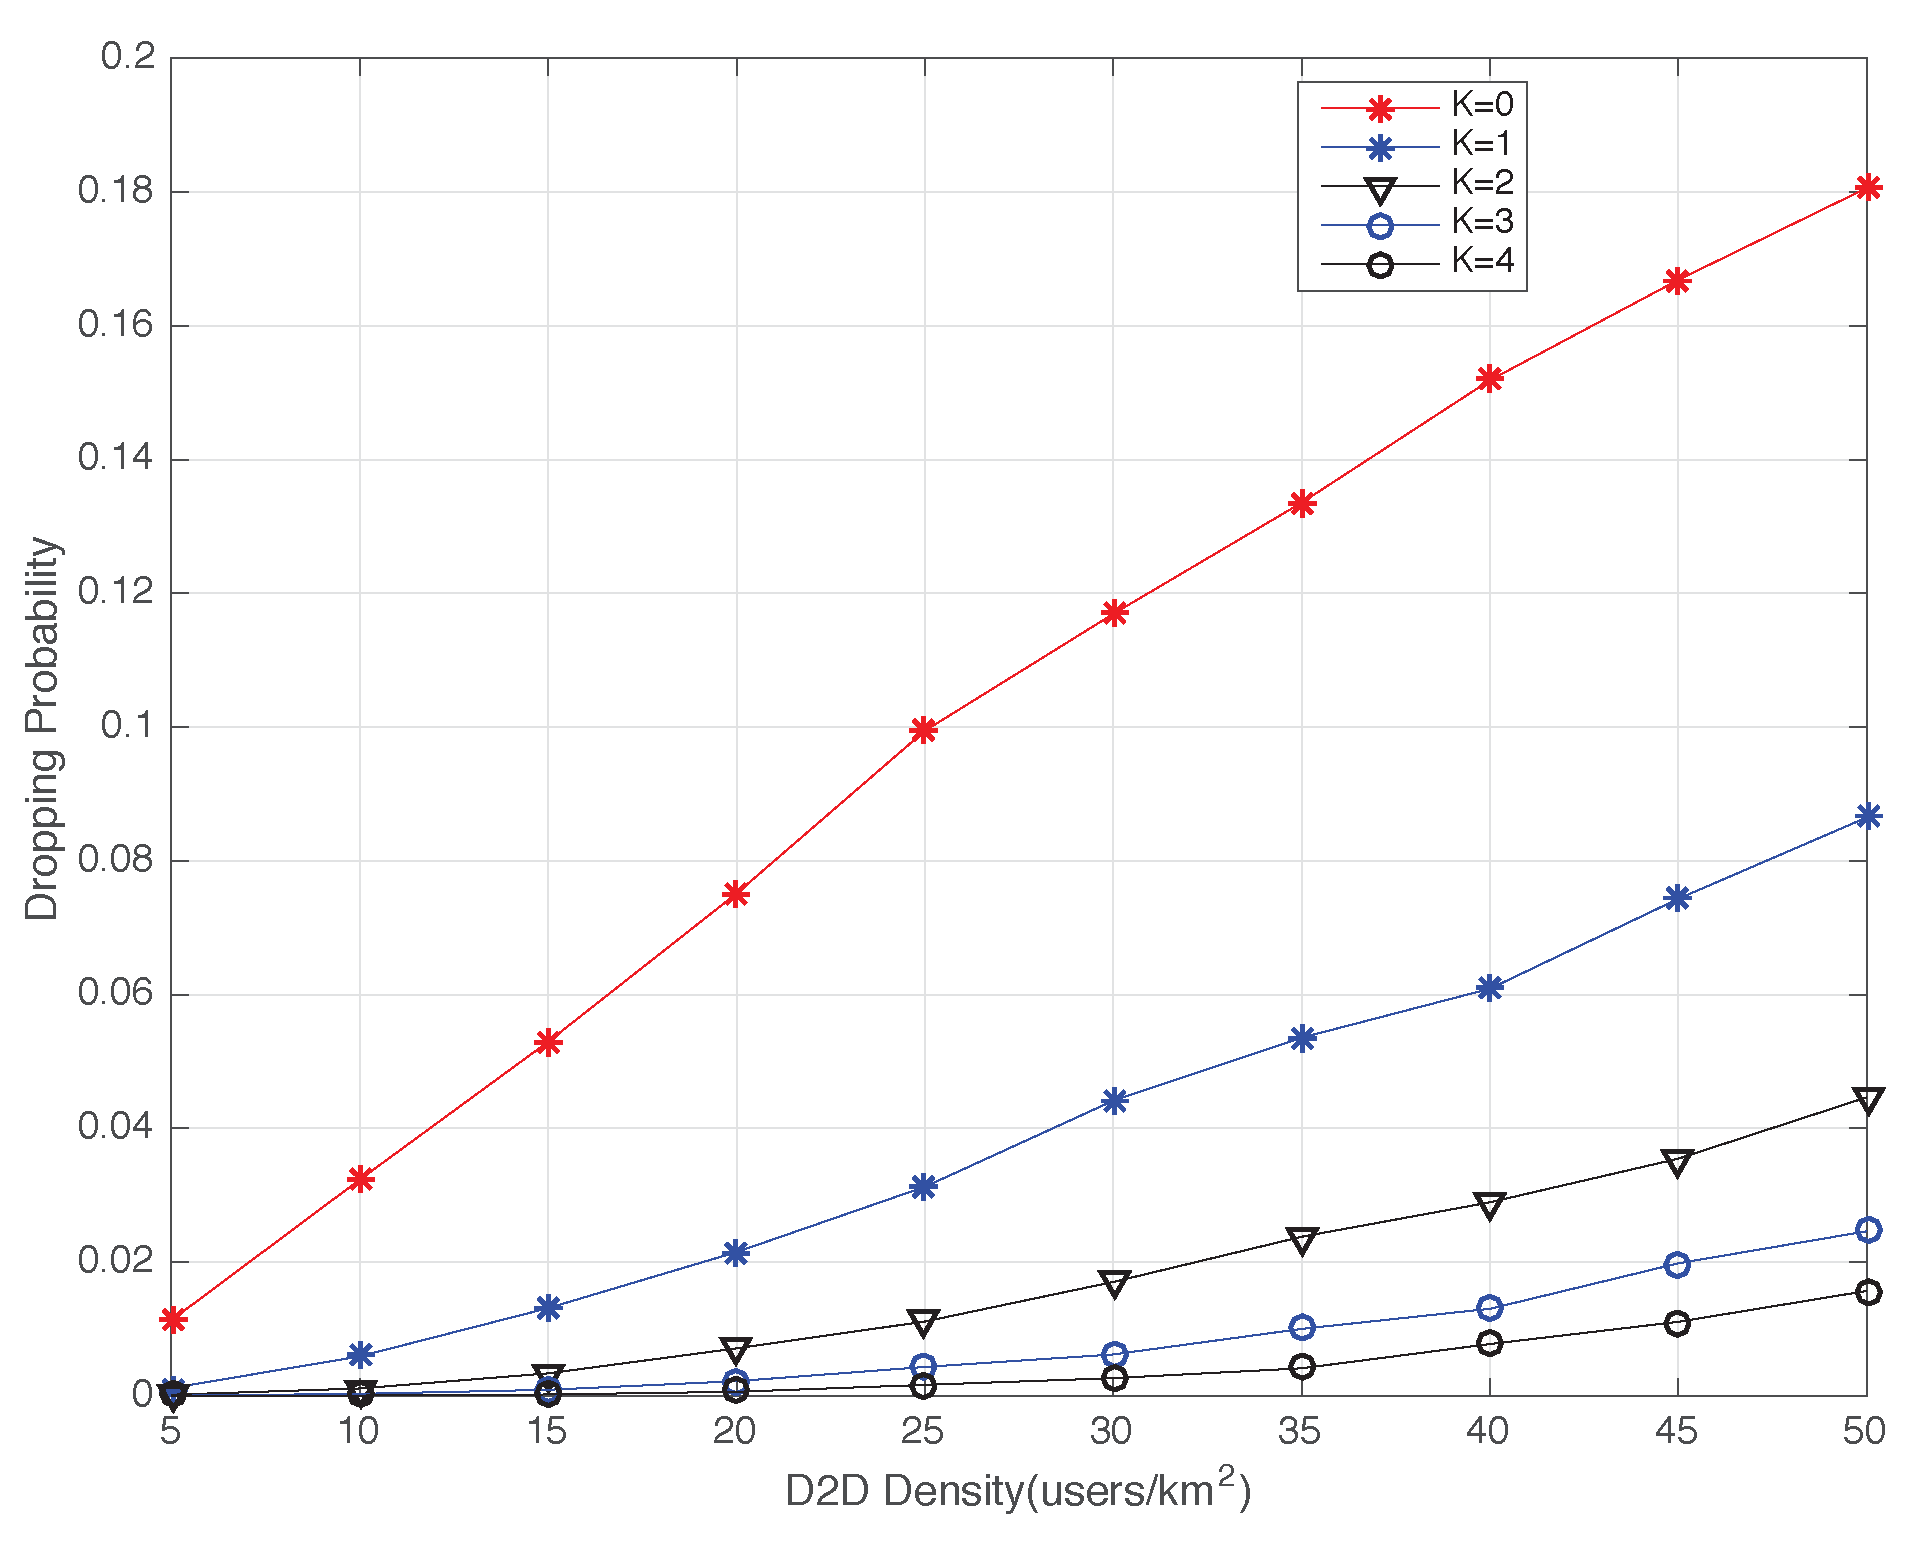
Figure 5 illustrates the dropping probability of a D2D user with and without the retransmission strategy for a varying D2D density. We set
,
. The dropping probability curves showed a rising trend that corresponded to the increase of D2D density. It was obvious that the dropping probability gradually decreased with the increase in the number of retransmission attempts. This was because there was no overflow in a lightly loaded queue, and the retransmission strategy provided failed packets with more than one chance for transmission: the greater the number of retransmission times, the lower the number of dropped packets.
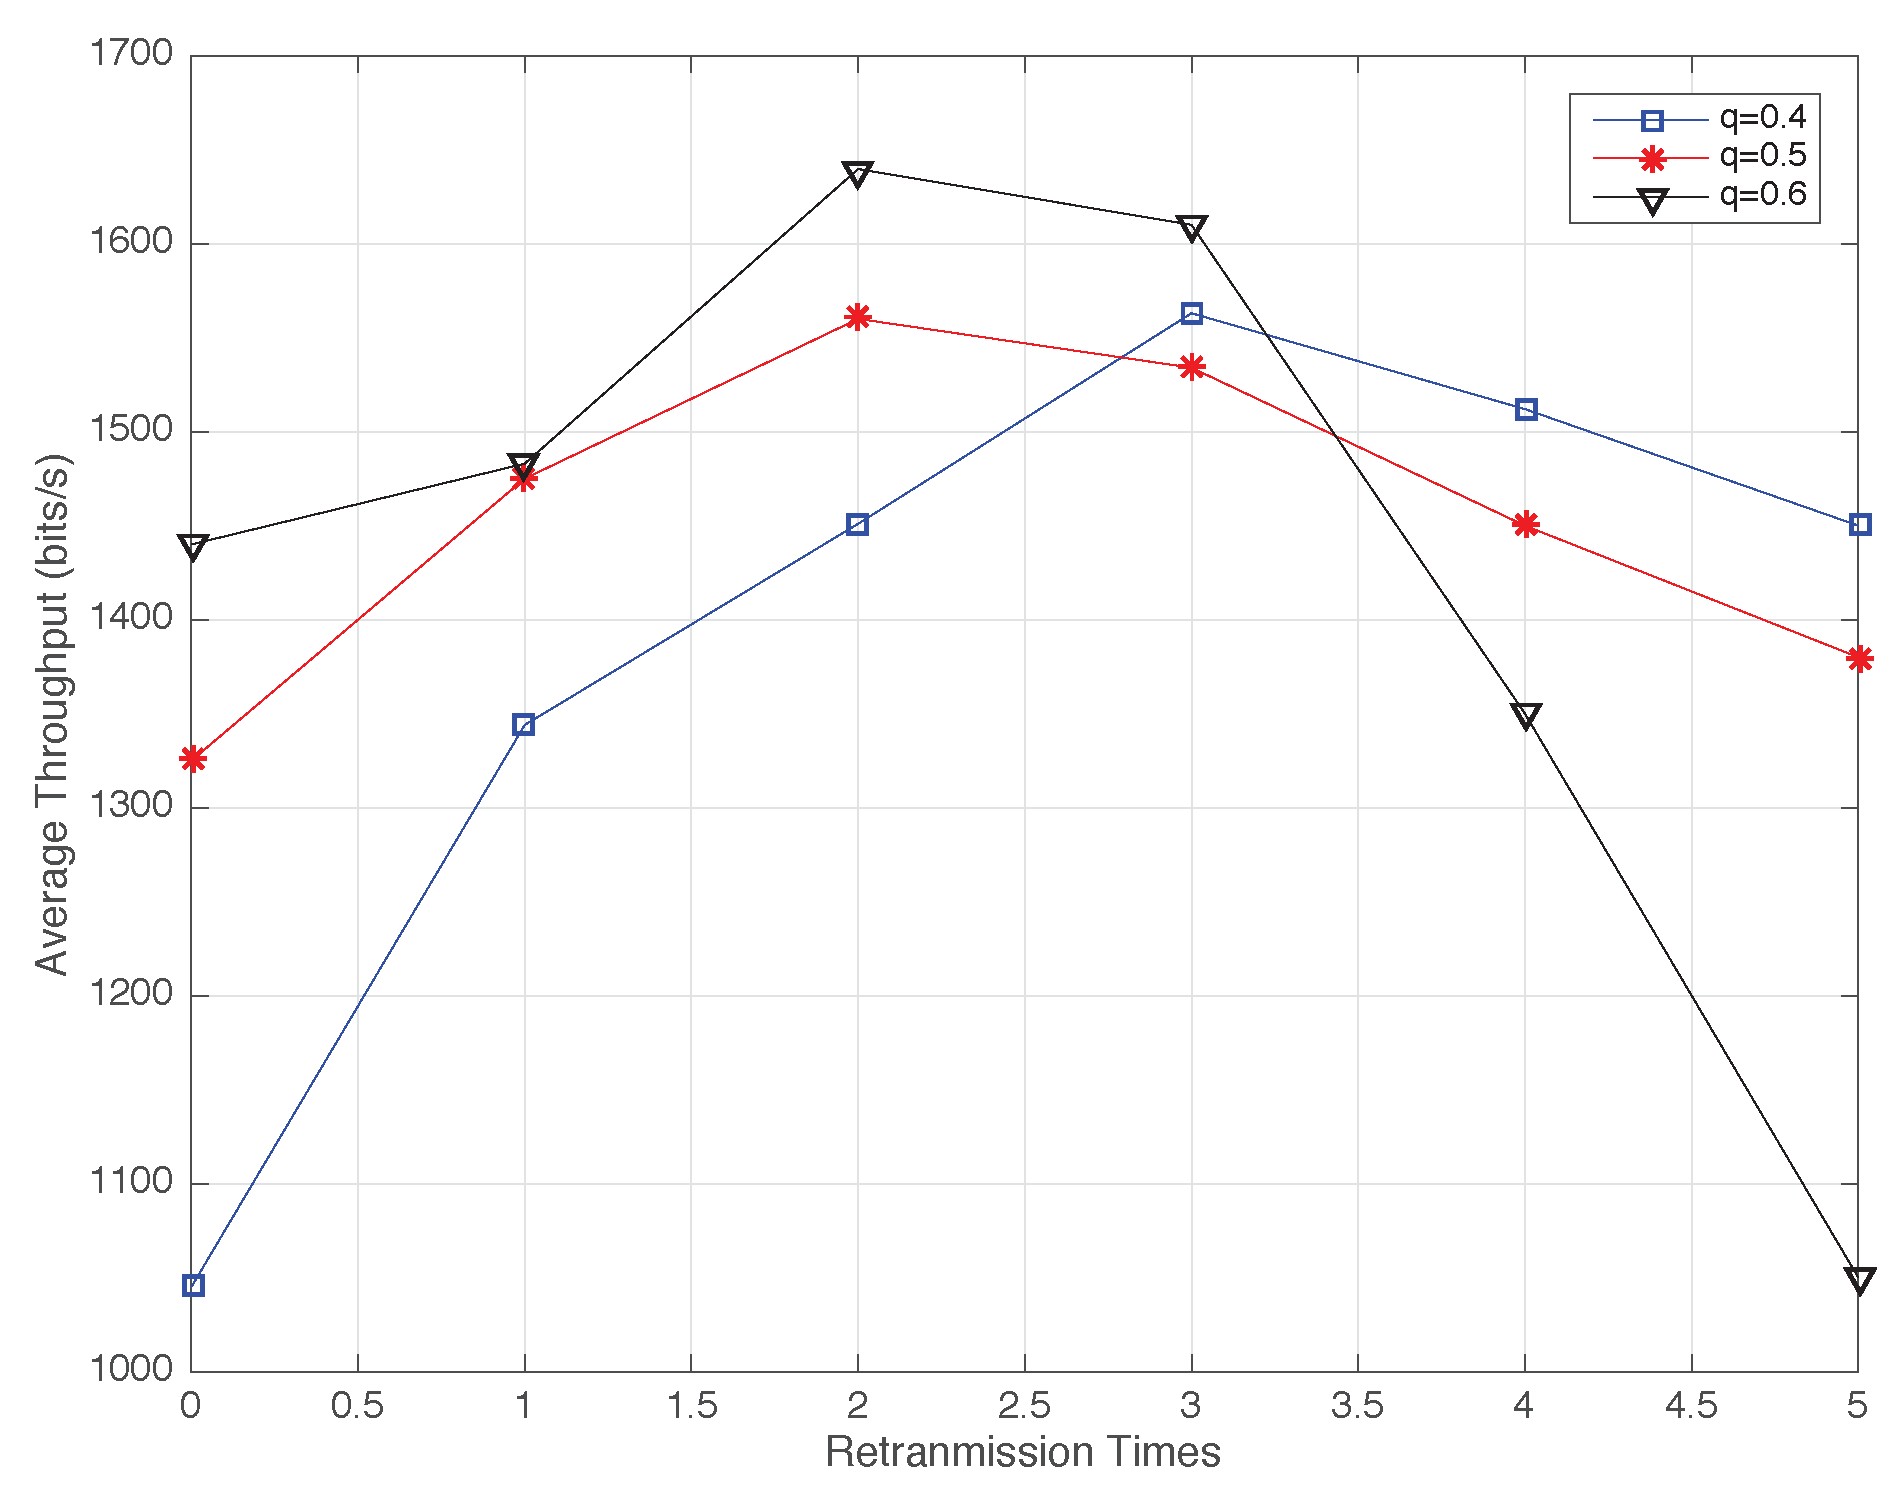
Figure 6 shows that average throughput versus the number of retransmission attempts for the mean arrival rate that varied from 0.4 to 0.6. The curves of the average throughput first rose and then declined with the increase in retransmission times. The throughput values for
and
reached their peak at
, while the throughput for
reached its maximum at
. In other words, as the mean arrival rate grew, the optimal throughput was reached after fewer retransmission attempts. Furthermore, when
, the average throughput decreased with the increase in the arrival rate. The reason was that too many retransmission attempts caused packets to overflow significantly as they increased because of the high arrival rate and full buffer.
7. Conclusions
This paper focused on the performance analysis of D2D communication in underlay mode in cellular networks. Firstly, by adopting queuing theory and stochastic geometry, we developed a spatiotemporal traffic model to model a retransmission mechanism for D2D underlay communication. Considering the influence of interference among D2D links and the channel condition, we described the dynamic traffic model of a D2D receiver as a queuing model with dynamic data arrival and a finite buffer. Following the SW-ARQ protocol, we modeled the D2D communication model with a retransmission strategy as a feedback queuing model and formulated it as a Markov chain to analyze the D2D queue length state of the packets in the buffer, and the closed-form expression of the steady-state distribution was obtained. Then, the expressions of the performance metrics, namely the average queue length, mean throughput, average packet delay, and packet dropping probability, were obtained. Simulation results showed the validity and rationality of the theoretical analysis. Moreover, simulation results indicated that the performance evaluation method using the feedback queuing model had practical significance in D2D heterogeneous networks. In future work, we can apply the queuing model and analytical approach presented in this paper to conducting performance studies on D2D-assisted wireless caching networks. By employing the queuing theory and stochastic geometry, we can build a spatiotemporal model to analyze the delay and obtain the probability in caching networks simultaneously. We can also study the performance of the go-back-N (GBN-ARQ) and selective-repeat (SR-ARQ) protocols in multi-hop communication. Specially, we will concentrate on using more realistic assumptions to build a dynamic model in further research. We hope our work can provide a more accurate theoretical basis for the design of the actual system.


