Article

A Study on the Friction Stir Welding Experiment and Simulation of the Fillet Joint of Extruded Aluminum Material of Electric Vehicle Frame

1
Department of Mechanical Engineering, Gyeongsang National University, Jinju 52828, Korea
2
Carbon Materials Application R&D Group, Korea Institute of Industrial Technology, Jeonju 54853, Korea
3
Smart Mobility Materials and Components R&D Group, Korea Institute of Industrial Technology, Gwangju 61012, Korea
4
Technical Center: Daejoo Kores Co., LTD., Wanju 55316, Korea
5
Dongnam Division, Korea Institute of Industrial Technology, Busan 46938, Korea
6
Precision Mechanical Process and Control R&D Group, Korea Institute of Industrial Technology, Jinju 52845, Korea
*
Author to whom correspondence should be addressed.
Appl. Sci. 2020, 10(24), 9103; https://doi.org/10.3390/app10249103
Submission received: 26 November 2020 / Revised: 14 December 2020 / Accepted: 16 December 2020 / Published: 19 December 2020
(This article belongs to the Section Mechanical Engineering)

Abstract

:
In the existing automobile manufacturing process, metal inert gas (MIG) and tungsten inert gas (TIG) welding are mainly used. These welding methods are fusion welding, and the heat input in the welding area is very high. Therefore, the deformation of the base material is large, and the residual stress in the vicinity of the welded area is high, resulting in the problem of reduced mechanical strength. In this study, friction stir welding (FSW) was applied to the welding process of the structure constituting the battery frame of a newly developing electric vehicle to compensate for this problem. The welded part is the fillet joint of the side frame and the bottom frame, and experiments and numerical analysis were performed on the welding deformation and residual stress of the full frame structure. A specially manufactured angle head was used for friction stir welding of the fillet joint of extruded type aluminum, not the existing solid type. The optimum process was derived through experiments, and the temperature of the welding center was derived through test correlation between the value of measured temperature and the finite element model. The final deformation result was verified by comparing it with the measured value using a dial indicator. It is expected that the proposed thermal elasto-plastic analysis method will reduce the testing period and the cost of the manufacturing process and increase productivity.

1. Introduction

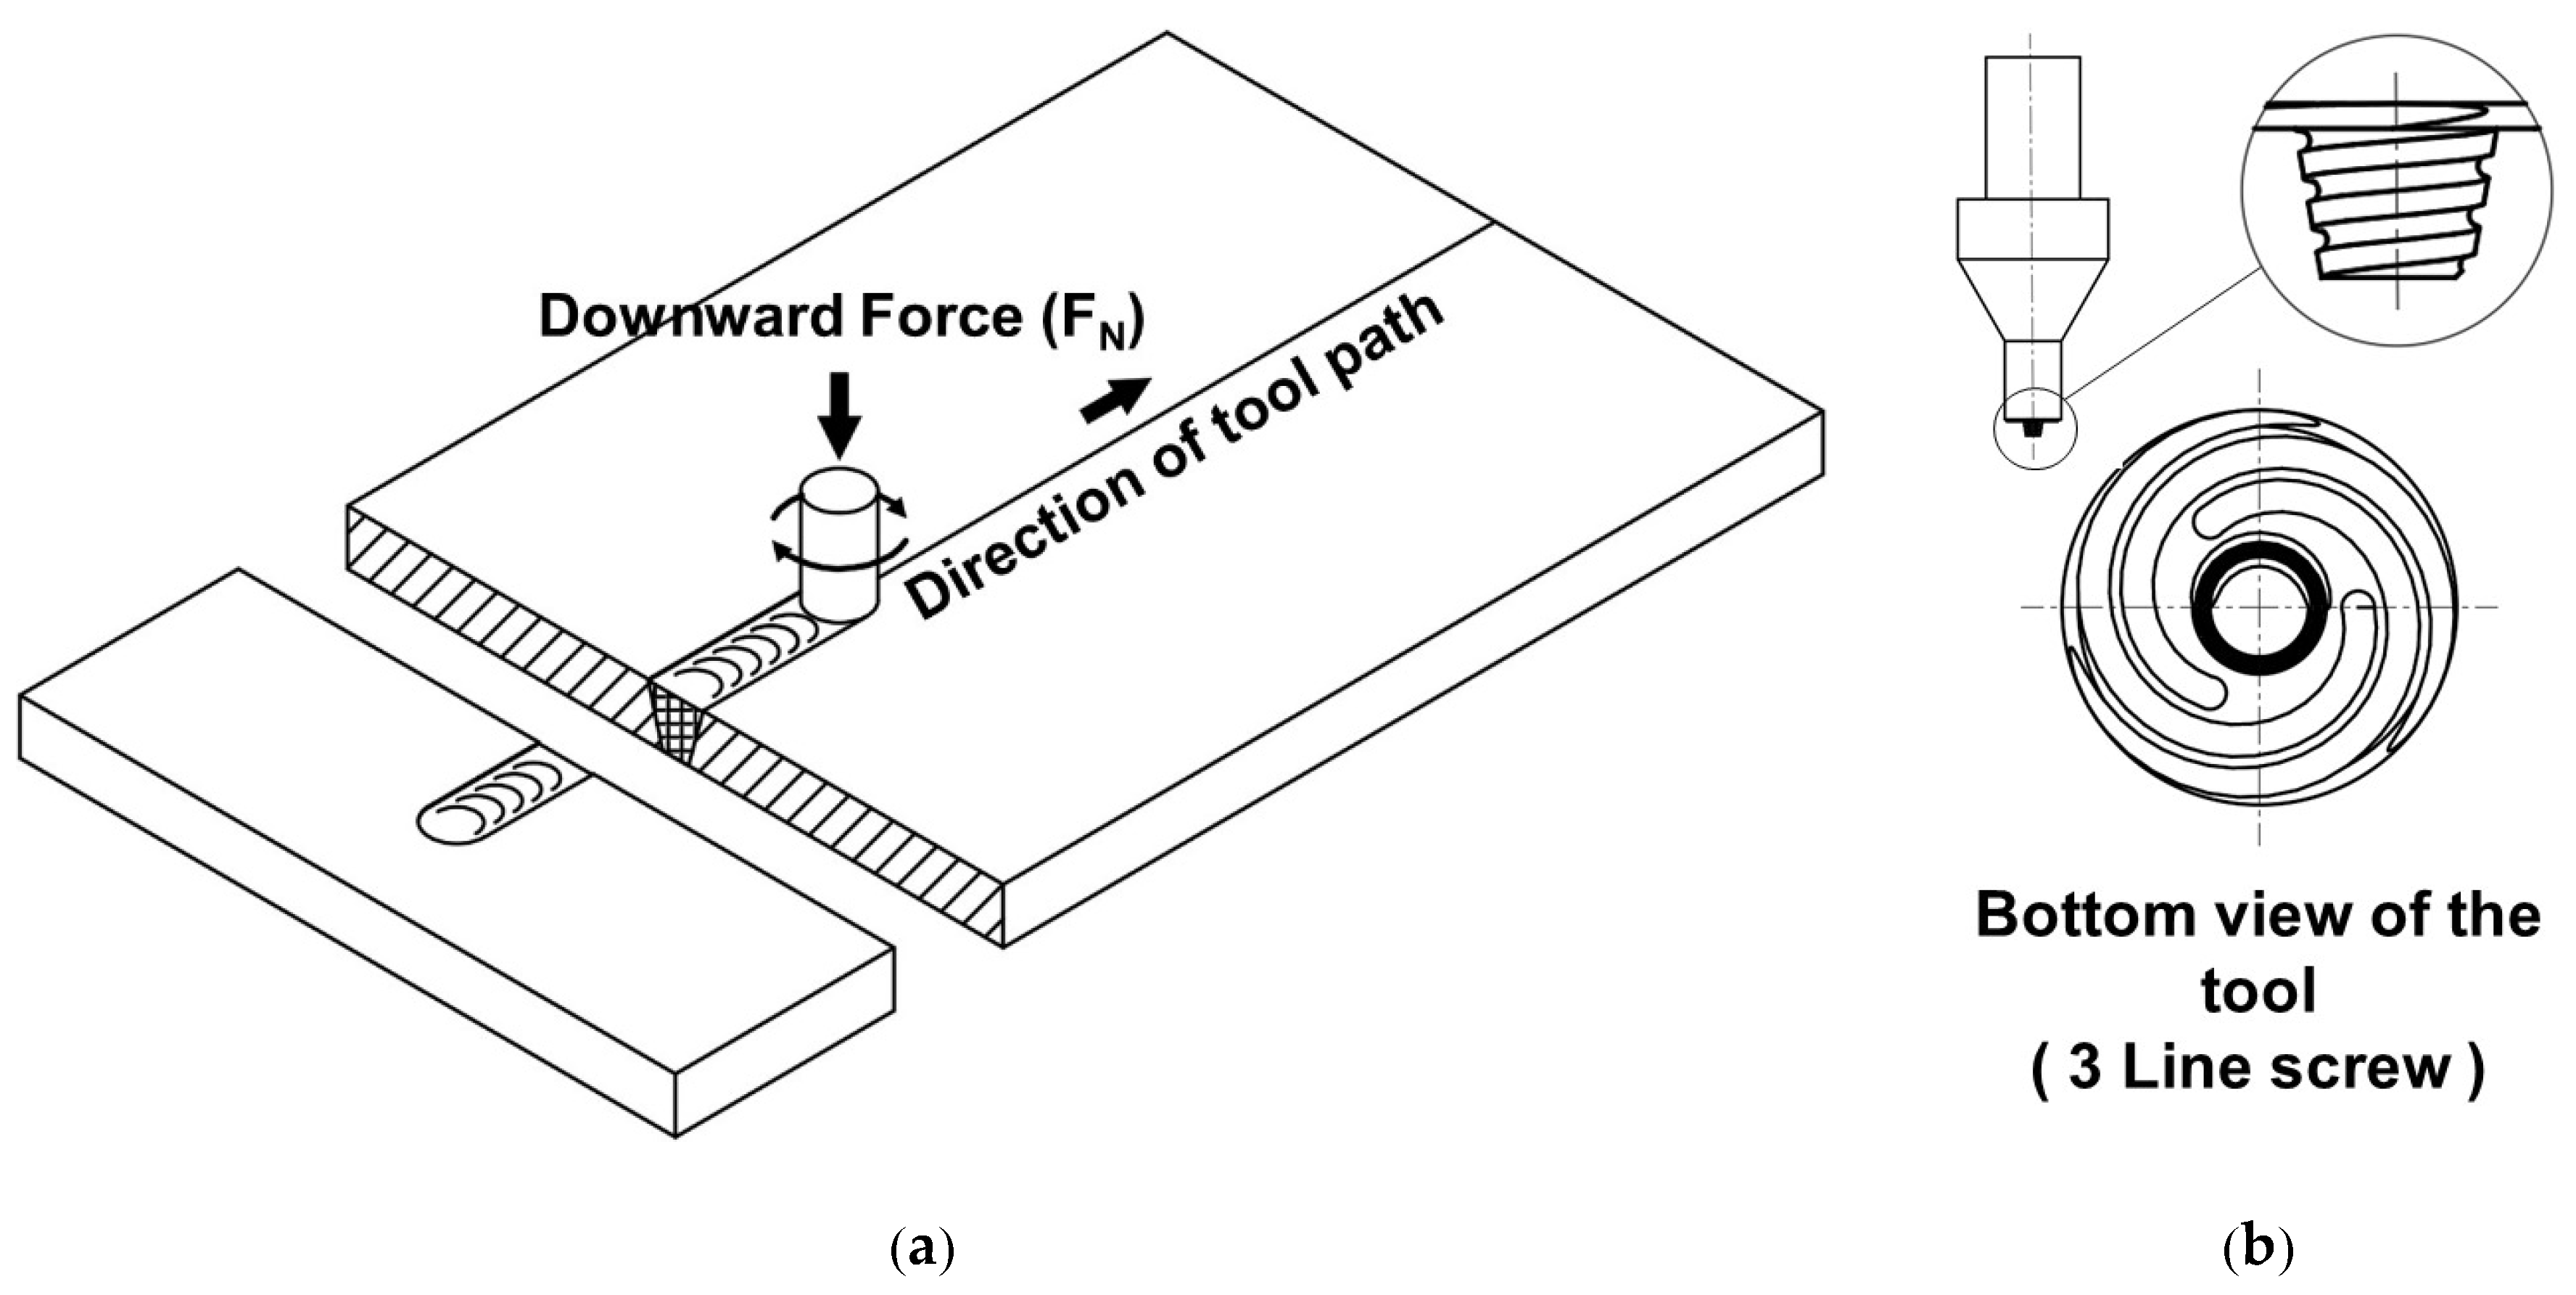
Friction stir welding (FSW) is a solid-state welding method developed by the Welding Institute (TWI) in the UK in 1991 that uses frictional heat to join two workpieces at temperatures below the base material’s melting point. The basic principle is as shown in Figure 1. FSW is performed by pressing a cylindrical tool with a spiral pin rotated at high speed on the joint between the two fixed base materials. Heat is generated by friction between the rotating tool and the base material, which leads to a softened region around the joint, and the plastic flow caused by the rotating tool forcibly stirs the base materials on both sides of the interface to join the two base materials [1].
The benefits and advantages of FSW include high mechanical strength (around 90% of the base material) due to low distortion and residual stress as a result of welding with a lower heat input compared to conventional fusion welding and high-quality joints without defects such as pores and cracks [2]. FSW is also used to join lightweight alloys (Al, Mg, and Ti alloys), dissimilar materials, and materials that are difficult to join using conventional welding techniques. FSW is economical because it does not require consumable equipment such as filler metals and inert gas and it is eco-friendly because it does not emit harmful rays or substances, and the process can be standardized and automated by reducing the need for skilled welders. The disadvantages of FSW include exit holes after withdrawing the rotating tool, difficulties in joining complex 3D curved shapes, and need for backing plates to withstand the frictional pressure at the back of the joint. In addition, FSW is only used to join light metals or low melting metals due to the limitation of tool materials. Because of these characteristics, FSW has been mainly applied to the automotive industry in the past, but as its limitations have been supplemented through continuous research and development, FSW is now applied to a wide variety of other fields such as railways, military, aerospace/aviation, and shipbuilding [3].
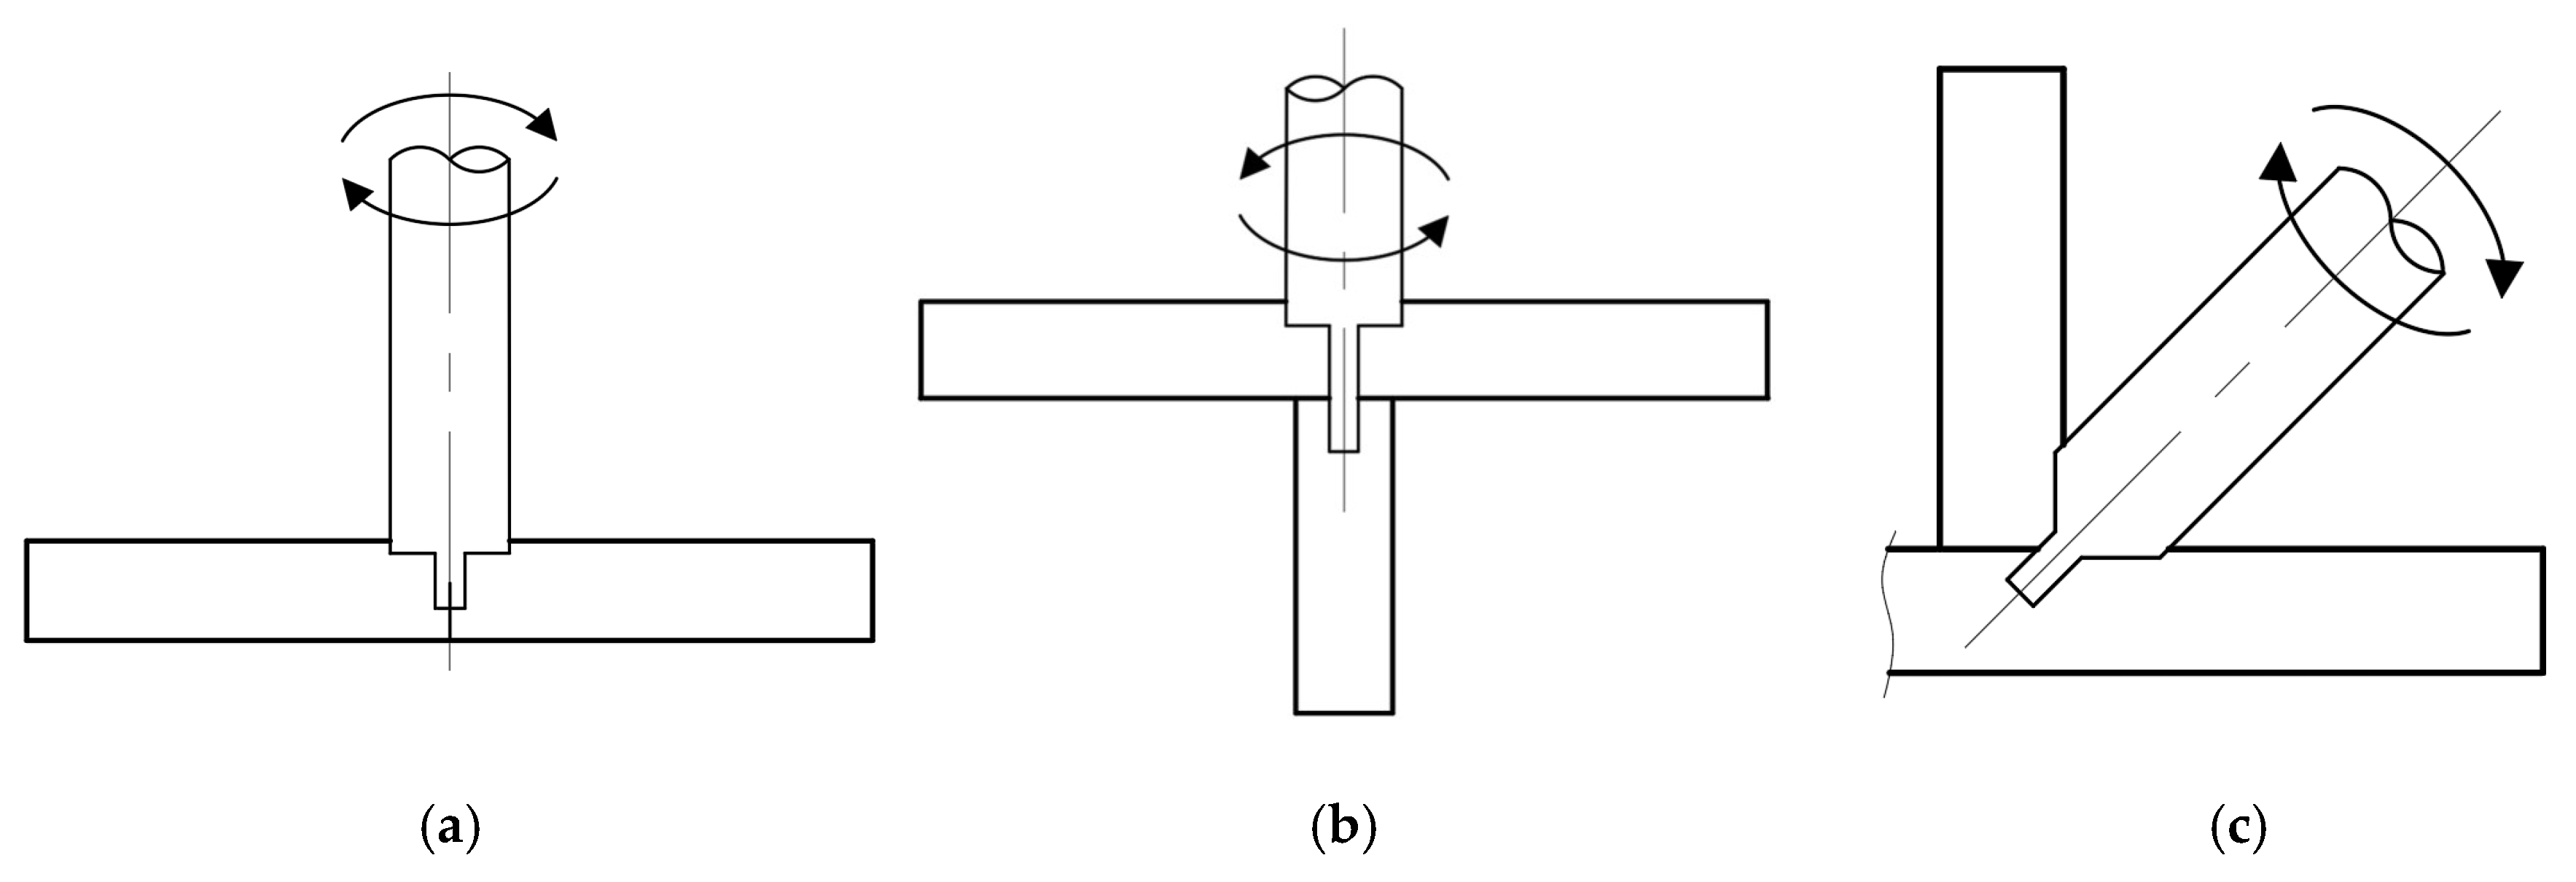
Friction stir welding has generally been limited to butt welding, as shown in Figure 2a. This is because the welding area between the tool and the materials to be joined is the widest, and when the rotating tool presses the base material with a constant force during the welding process, it is easy to obtain a fixing force to prevent the base material from bending on the opposite side of the welding surface. Frictional heat is generated on the tool’s shoulder side, pin lateral side, and the area where the pin bottom side meets the base material, and the frictional heat generated from the shoulder side accounts for 90% of the frictional heat generated by the tool. However, in the case of fillet joint FSW, the frictional heat decreases as the friction area between the tool shoulder and the base material decreases, as shown in Figure 2c. Therefore, several studies related to fillet joints have been performed in the past by conducting FWS on T-joint specimens to solve this problem, as shown in Figure 2b, but it is difficult to find cases applied to actual structures [4,5,6,7,8]. Even in the automotive industry, the application of FSW is limited to butt welding processes in general, but conventional fusion welding techniques such as metal inert gas (MIG) welding, tungsten inert gas (TIG) welding, and laser welding are used for fillet joint processes. These fusion welding techniques cause excessive welding deformation and residual stress in addition to the phase change of the base material around the weld because the heat input is very high. Welding deformation can cause problems in the manufacturing process and the assembly with other structures, and reduce the mechanical strength due to high residual stress. It can also cause frequent quality issues such as welding defects (pores and cracks) in the welds due to process problems.
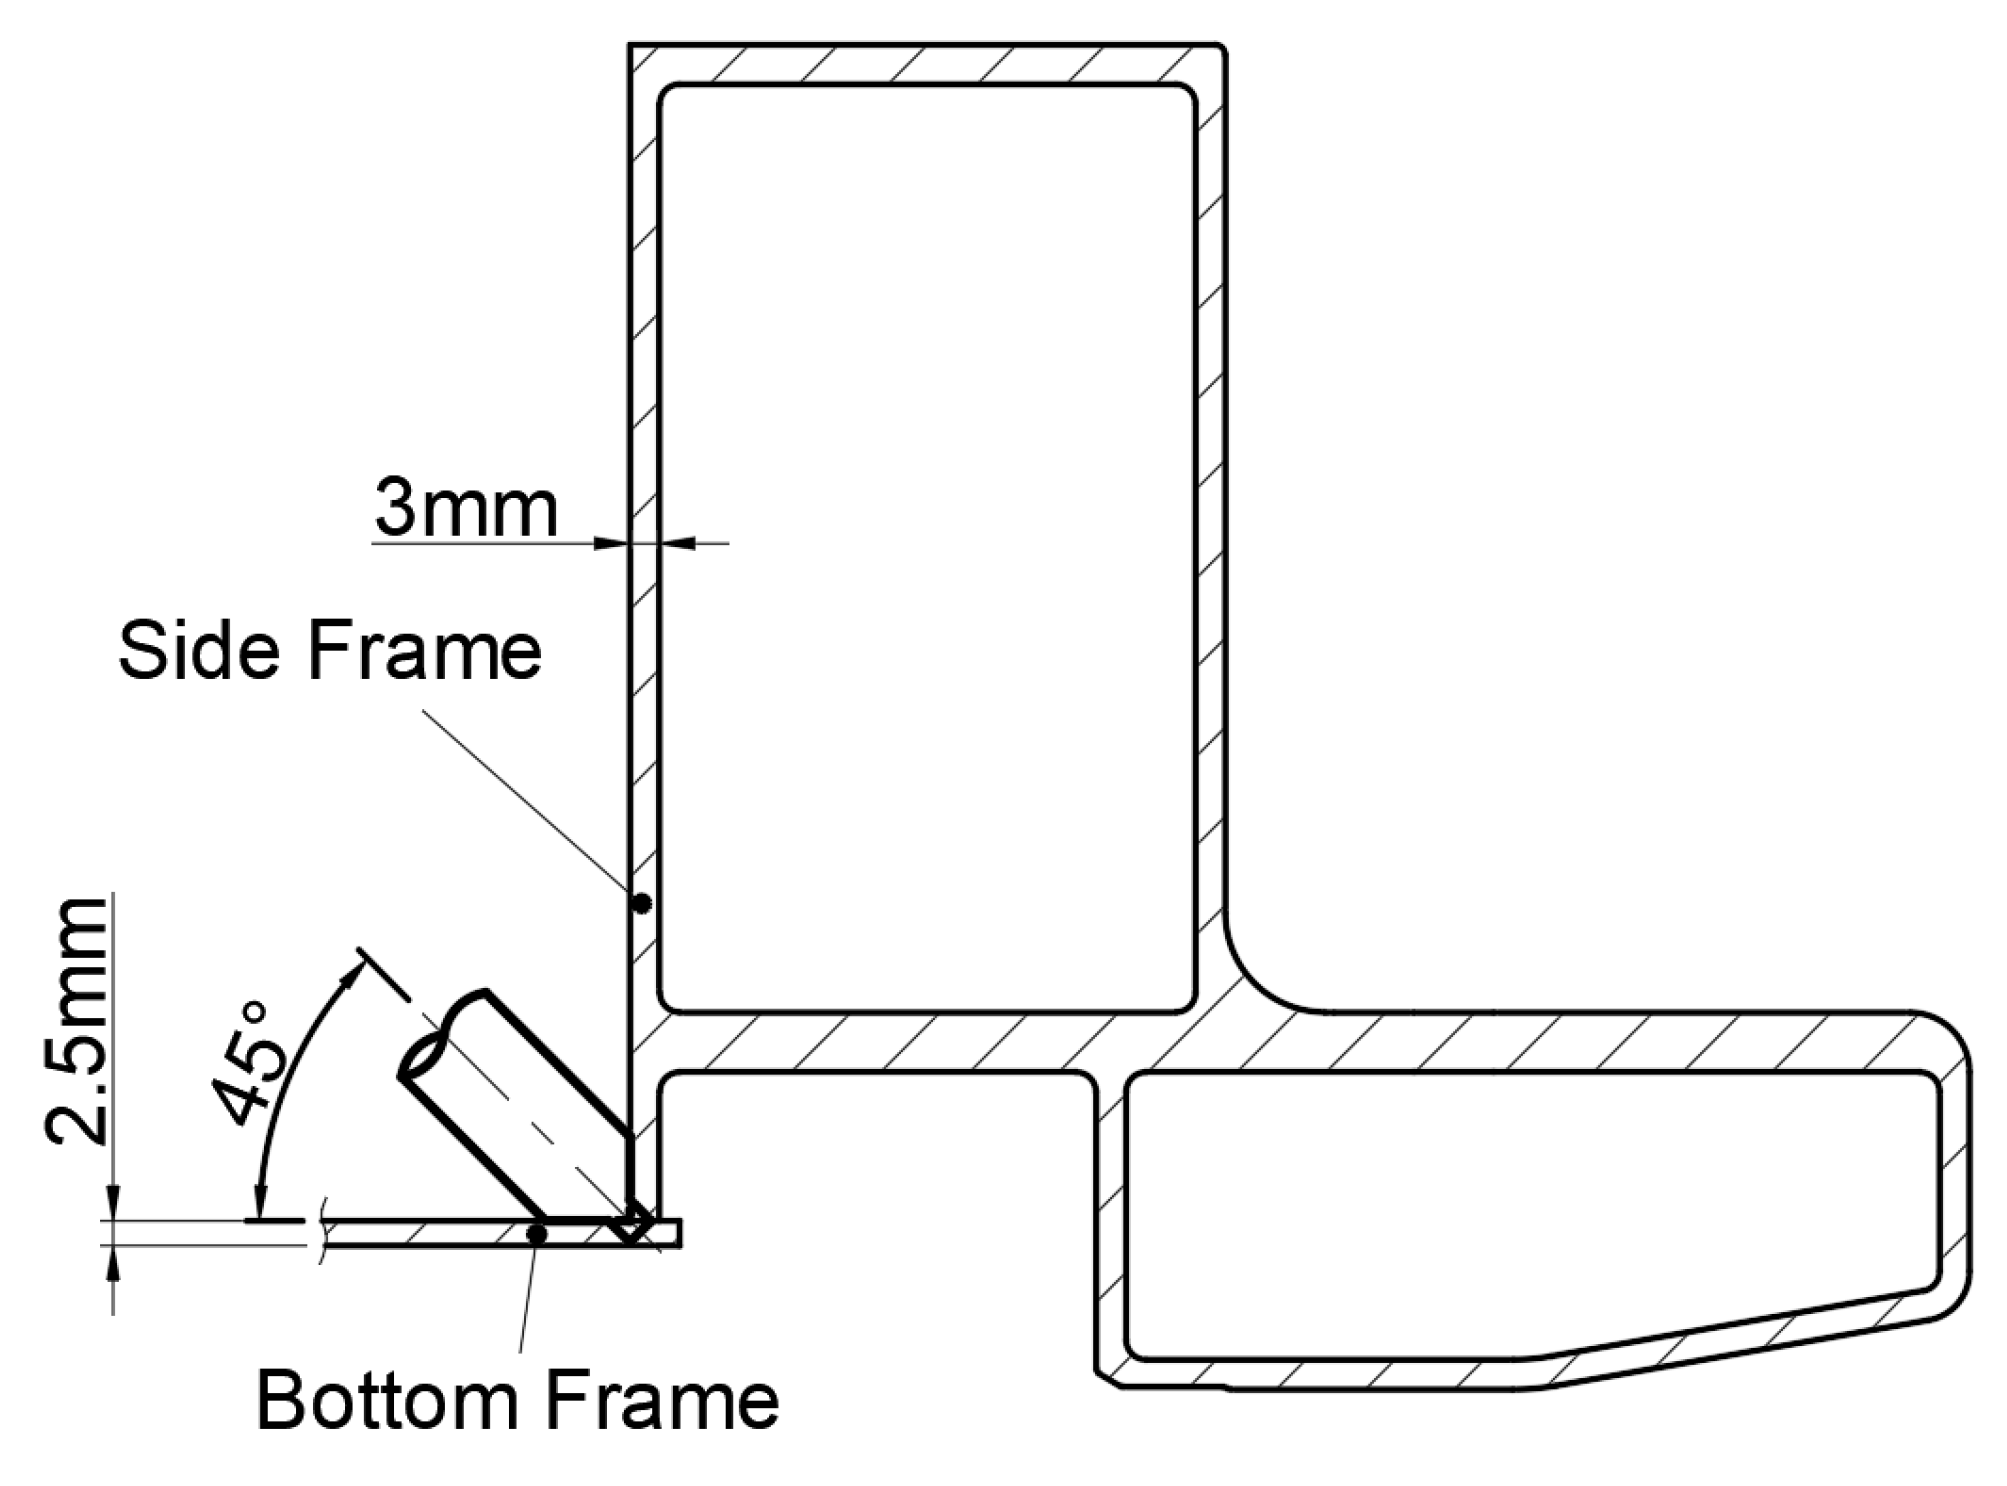
The type of joint applied in this study is a fillet joint where the side frame and the bottom frame meet, as shown in Figure 3. The side frame is made of extruded aluminum material with a hollow cross-sectional structure. As it is structurally impossible to insert the tool from the opposite side of the joint as shown in Figure 2b, FSW is performed on the fillet joint by tilting the tool at a 45° angle as shown in Figure 2c. The hollow cross-sectional structure of the side frame is a structure in which the inside of the base material is not full of solids. In this case, backing plates cannot be installed on the opposite side of the joint to support the downward force of the tool when performing FSW. Therefore, it is much more difficult to perform fillet joint FSW welding on hollow cross-sectional structures compared to specimen units.
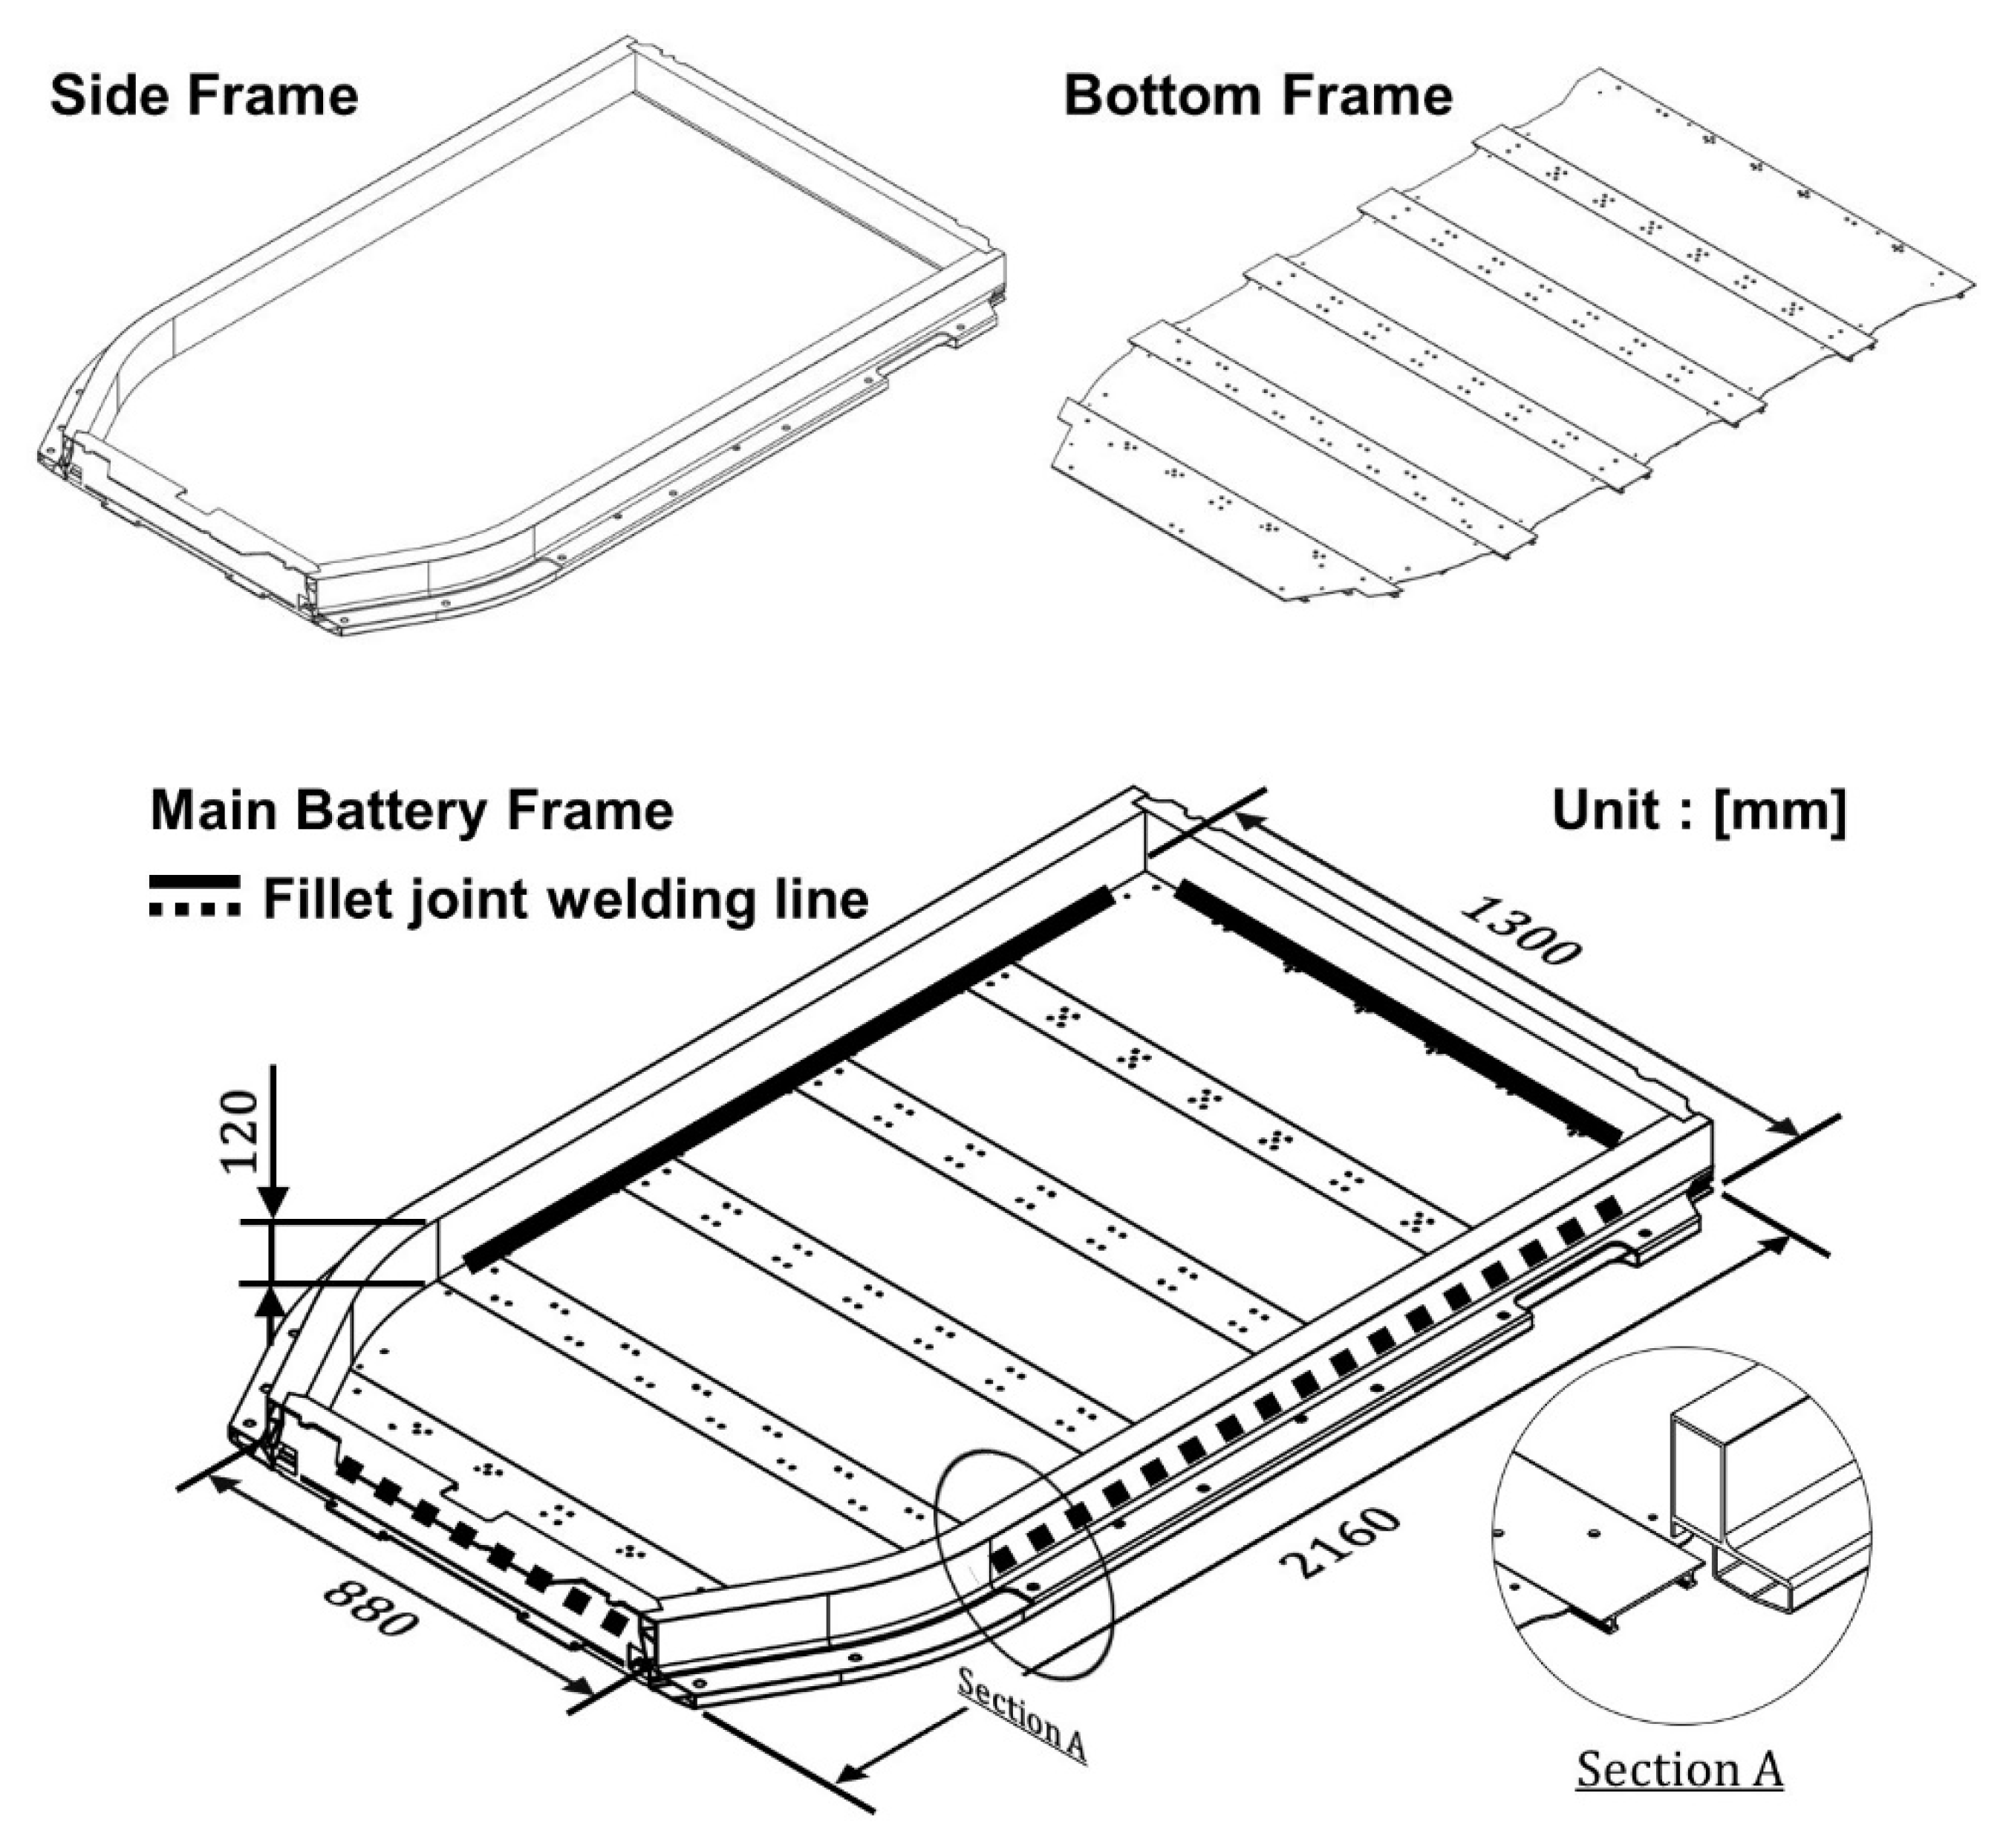
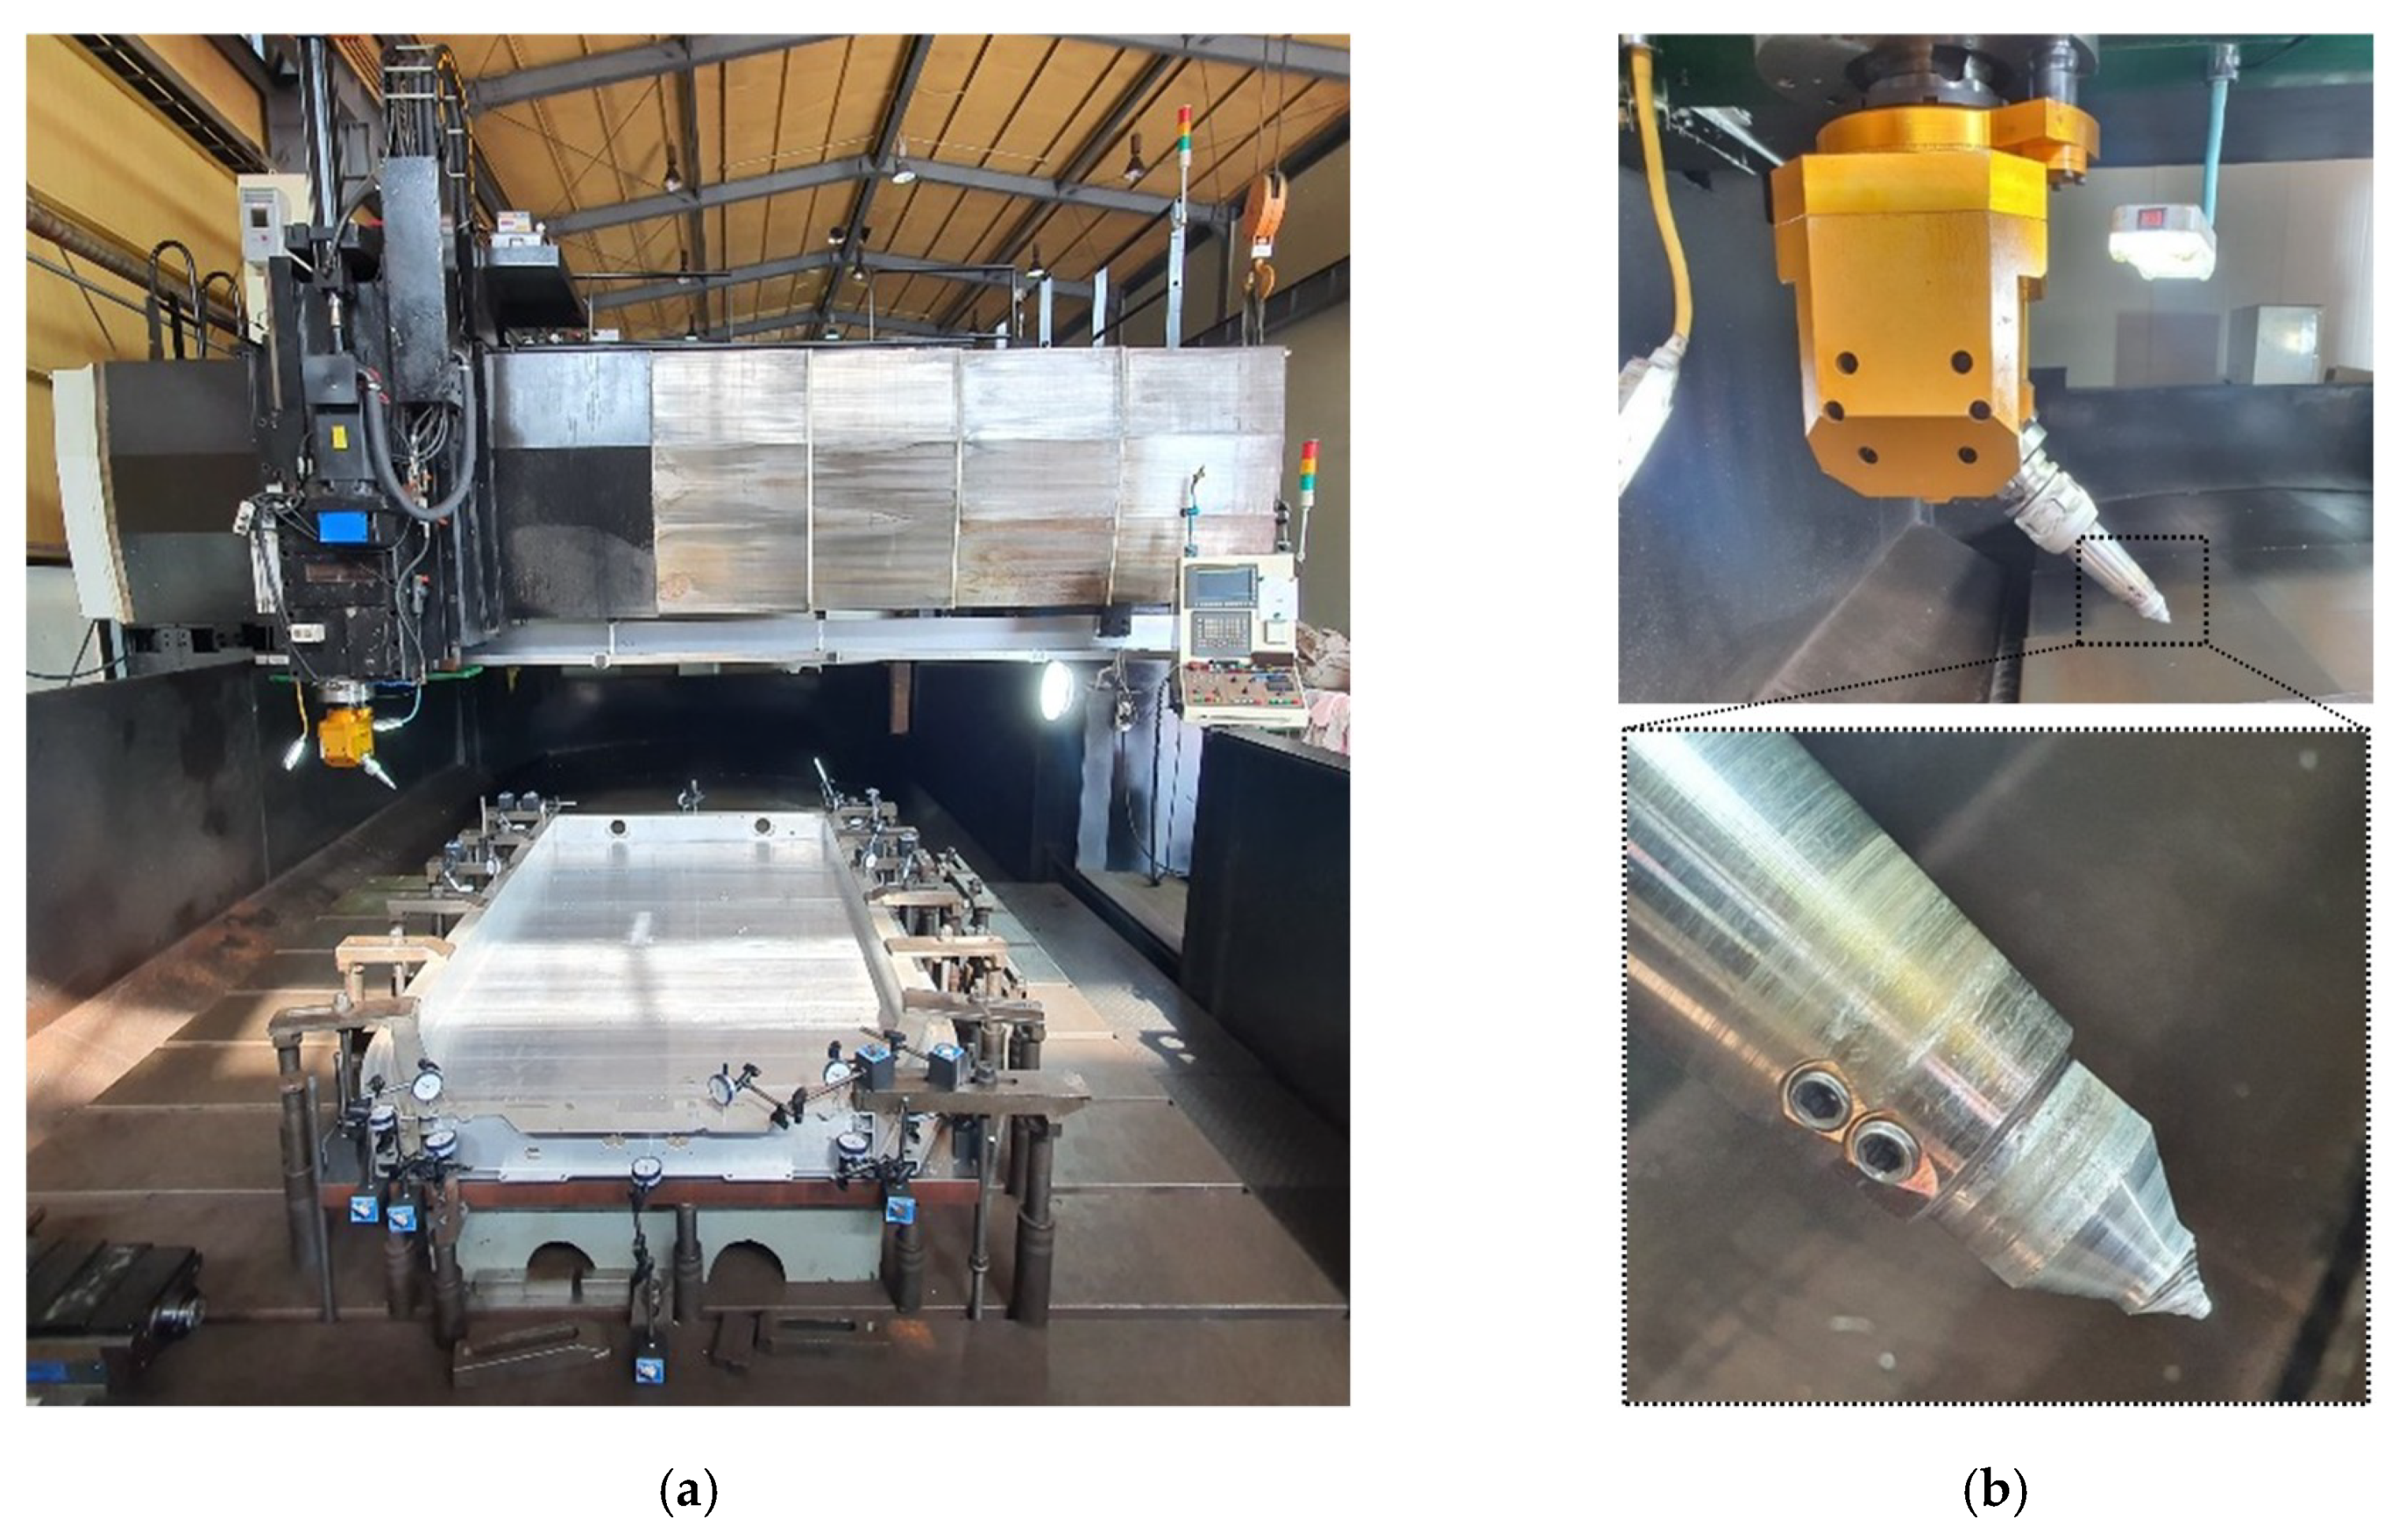
As shown in Figure 3 and Figure 4, the structure is the main frame of the electric vehicle where the heavy battery packs will be assembled. It is designed with a hollow cross section to secure the rigidity of the vehicle body and a thin aluminum extrusion material is applied to reduce weight. Therefore, FSW should be used for this structure because applying MIG welding, which has been mainly used for fillet joints in conventional automotive manufacturing processes, causes deformations beyond the design specifications and quality defects such as pores. As mentioned above, although studies on T-joint specimens have been performed in the past, it cannot be applied to the cross-sectional shape of the actual structure designed in this study. Moreover, data to predict the structural behavior are insufficient. Therefore, this study performed FSW by tilting the tool at an angle of 45 degrees for four fillet joints where the bottom frame and the side frame were in contact, as shown in the solid line and the dotted line in Figure 4. The full frame structure and equipment were set as shown in Figure 5a, and the welding was performed with the optimum process derived through the specimen unit experiment using a specially manufactured angle head as shown in Figure 5b. In addition, finite element analysis was performed using the commercial analysis program Ansys Mechanical to predict the deformation and residual stress occurring in the entire frame structure. Finally, the accuracy of the analysis was verified by measuring the welding deformation of the actual structure and comparing it with the analysis result.

2. Theoretical Background

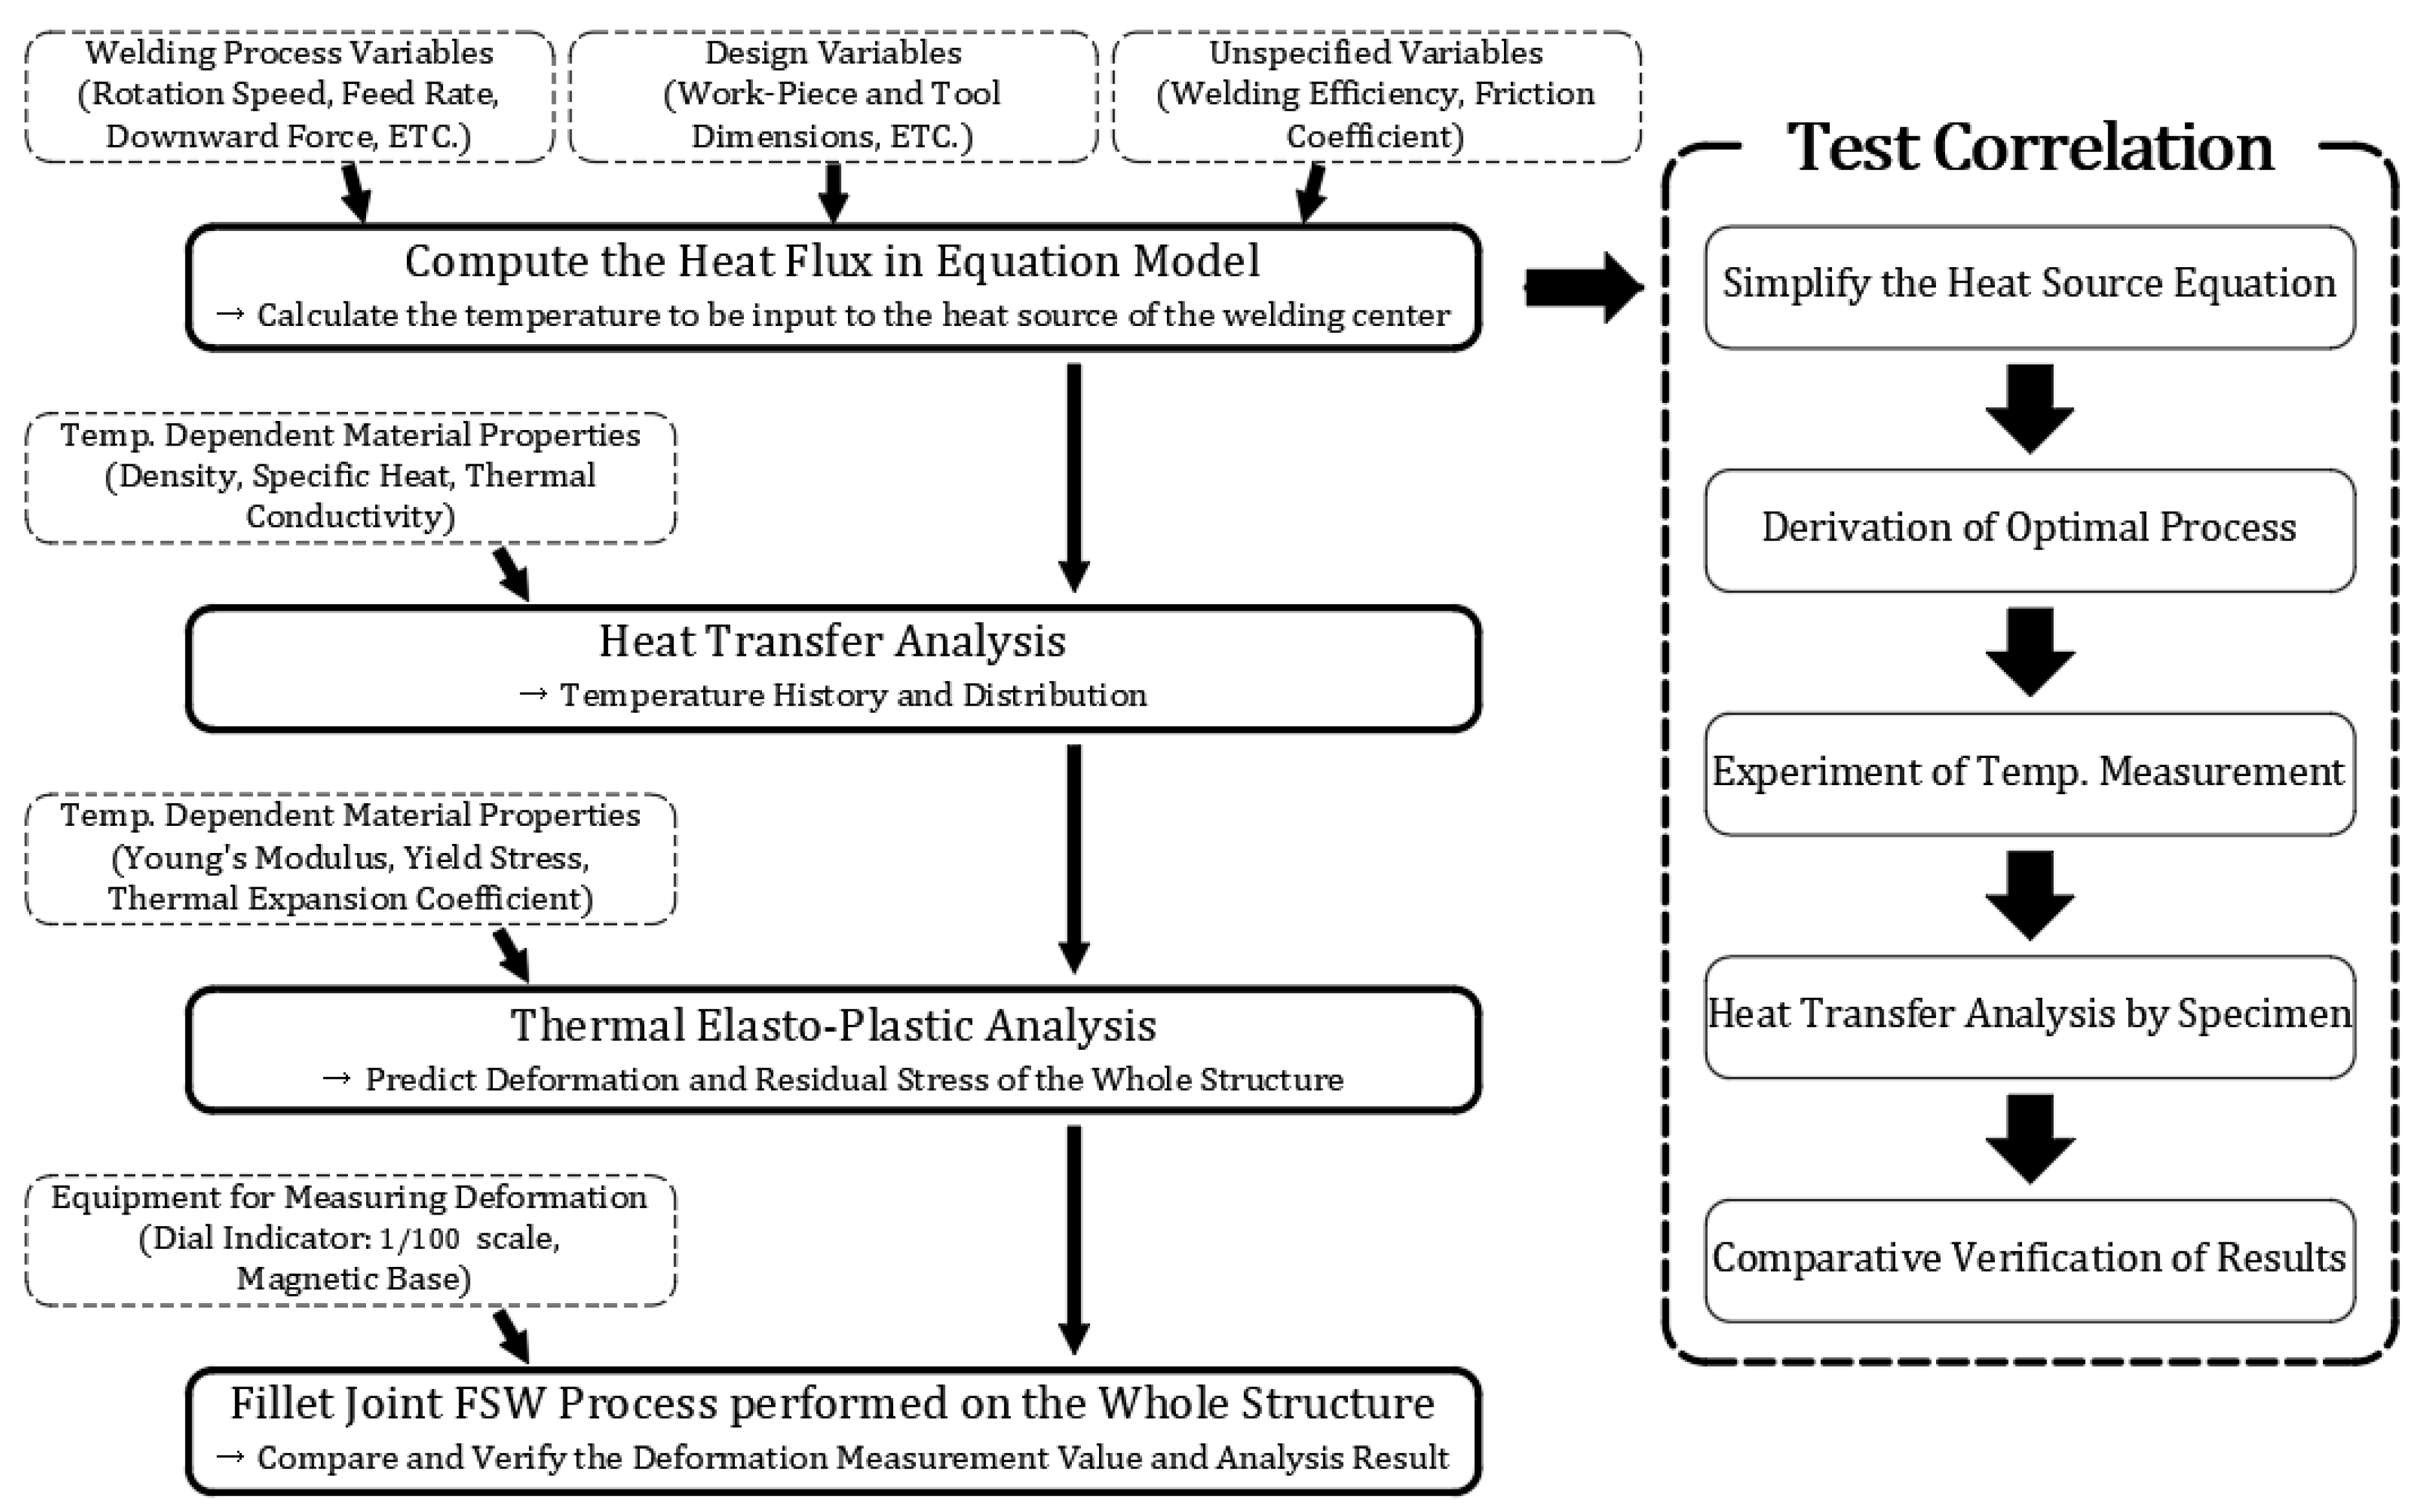
This study was performed according to the flow chart in Figure 6. First, a theoretical model for estimating the heat source was developed to specify the temperature of the welding center. The heat source was calculated by a relational expression of process variables (rotation speed, welding speed, and the tool’s downward force), design variables (workpiece and tool dimensions), and unspecified variables that are difficult to calculate theoretically or experimentally (welding efficiency and friction coefficient).
The optimal process was derived by performing FSW on the fillet joint specimen units according to each process condition to derive the process variables for calculating the numerical model. Then, heat transfer analysis was performed by using this numerical model after inputting the optimal process condition variables. In addition, temperature measurement experiments were conducted for the optimal process conditions, and the errors in the numerical model were reduced through test correlation by comparing the two results and adjusting the heat flux of the heat source. Heat transfer analysis was performed after deriving the temperature of the heat source at the welding center of the fillet joint, and the full-frame structure’s behavior was predicted by conducting thermal elasto-plastic analysis based on the heat transfer analysis results.
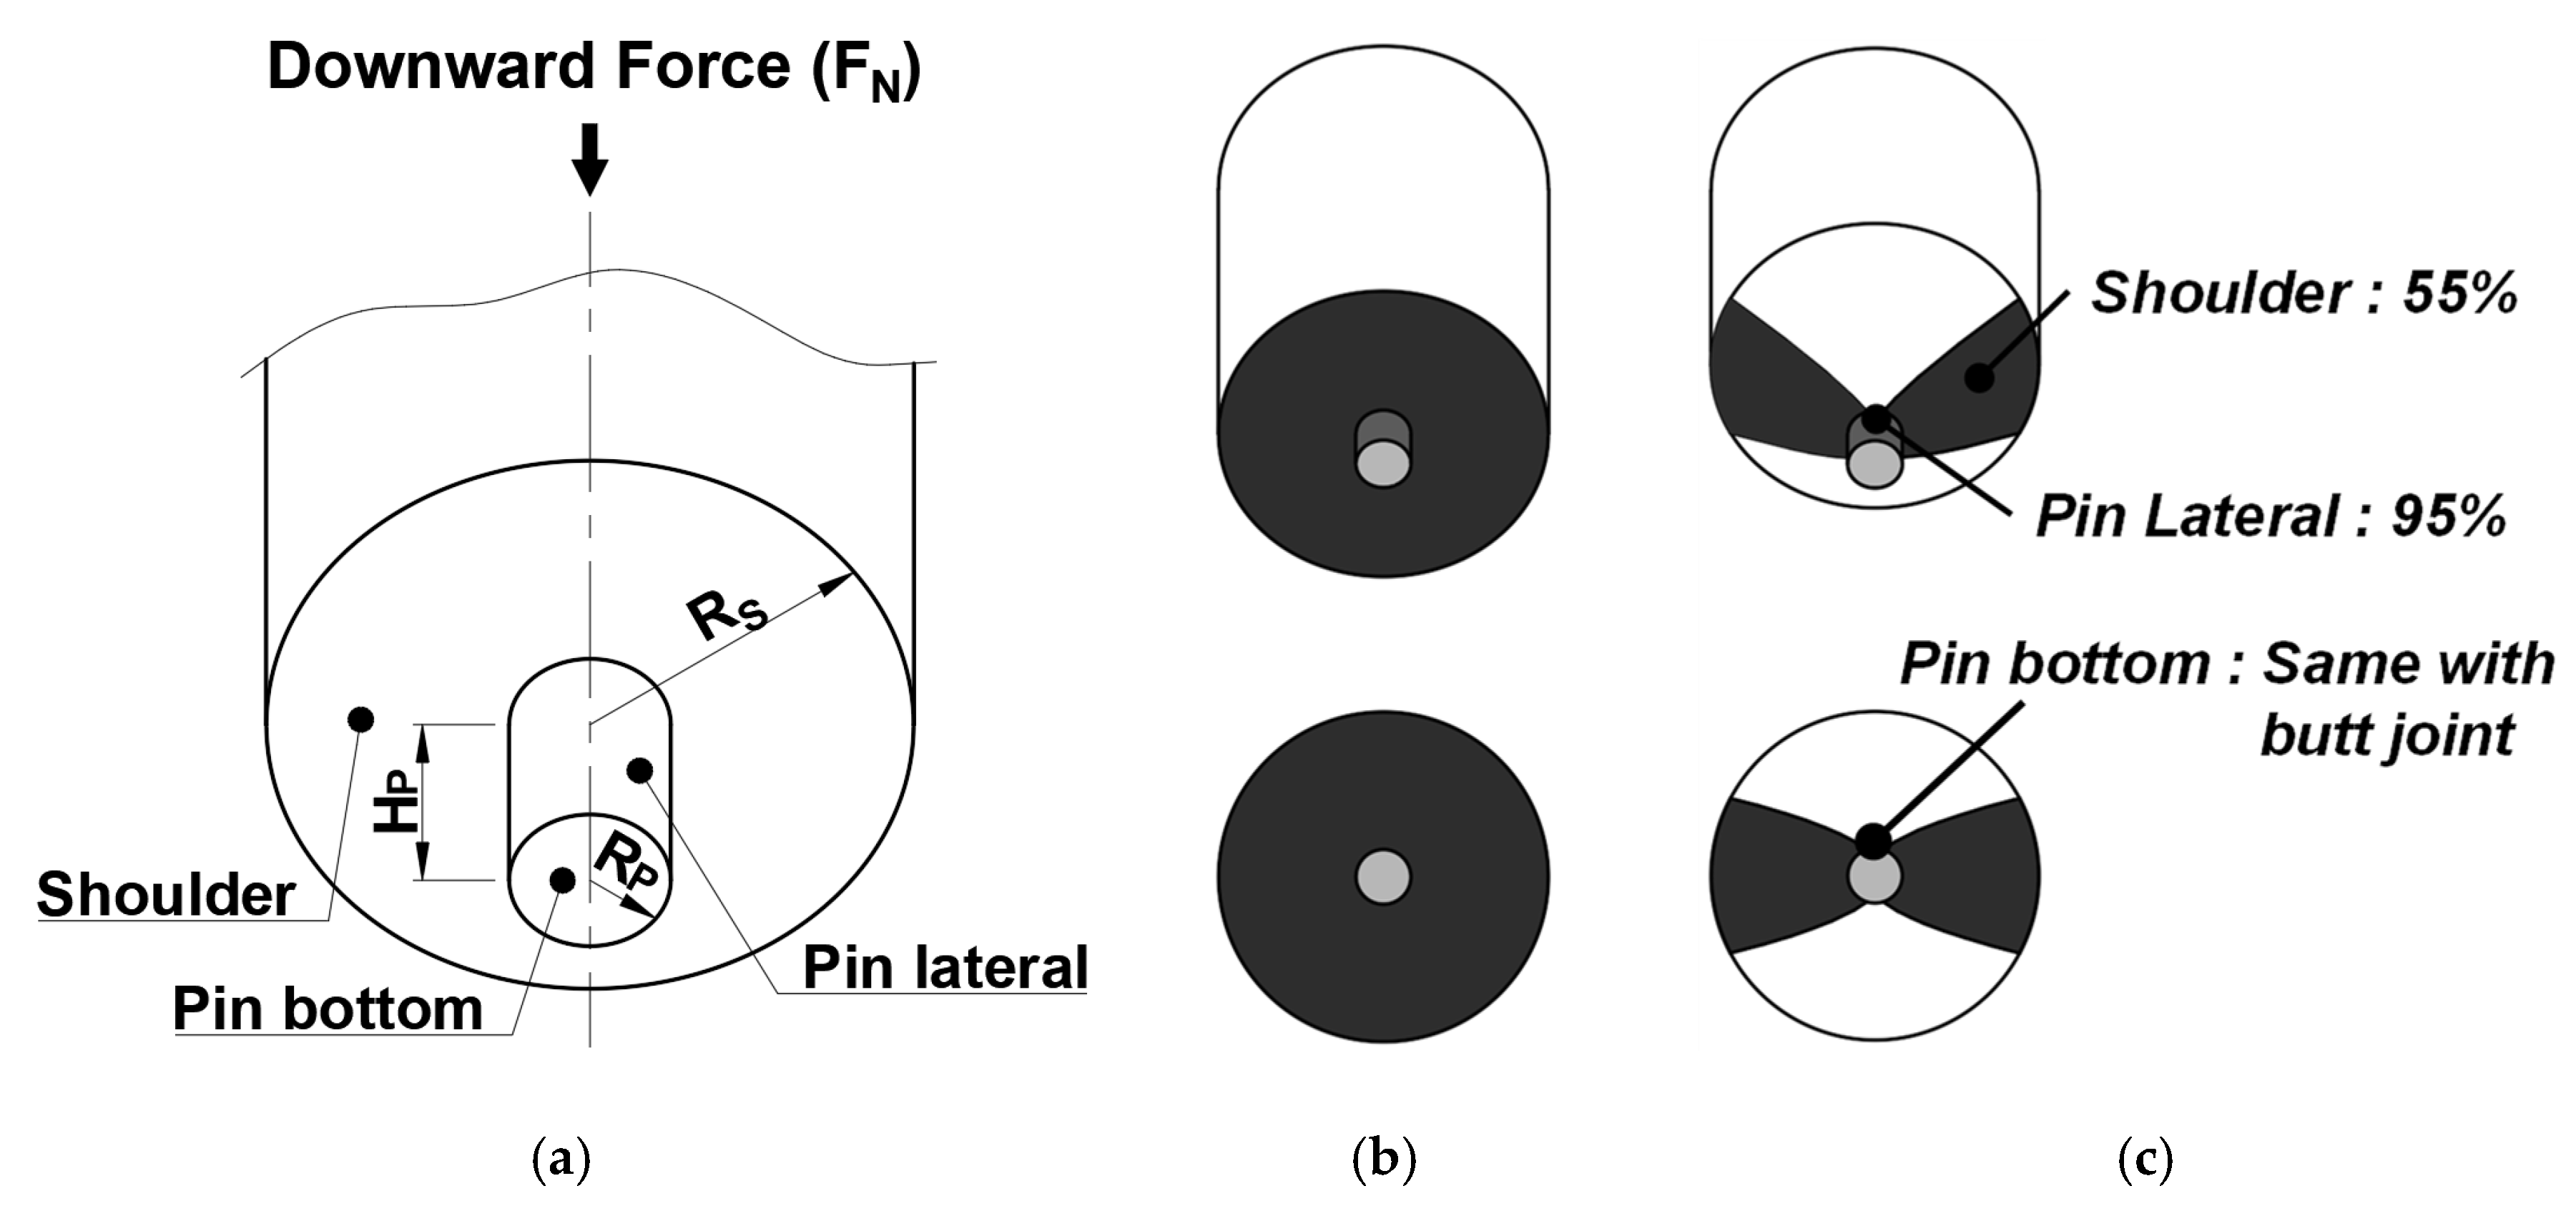
The frictional heat generated between the tool and the base material is the heat source of the welding center when performing FSW and this is a significant factor in determining the strength of the weld joint. Therefore, conventional methods used to predict the heat source of the weld usually attempted to calculate the total heat source by combining the frictional heat generated from each part of the tool [9,10]. As shown in Figure 7a, frictional heat is generated from three areas where the tool meets the material: Shoulder, pin lateral, and pin bottom. In the case of butt welding, the contact surface where the tool meets the base metal is the entire bottom of the tool as shown in Figure 7b. However, in this study, the fillet joint of the base material and the shoulder of the tool make partial contact, so the tool’s overall friction area is 66% (shoulder 55% and pin lateral 95%) compared to the butt joint. Figure 7 describes the friction area of the butt joint tool and the fillet joint tool, and detailed contact areas are summarized in Table 1.
This study applied the heat source estimation model proposed by Reynolds in 2003, assuming that the heat source is a constant heat flux generated from the friction surface [11]. This model is defined as shown in Equation (1), and considers all of the heat sources generated from the tool’s shoulder, pin lateral, and pin bottom. The Reynolds model shows similar calculations to the actual results under full sliding conditions, so this study assumed that the shoulder inclined at a 45° angle was flat, and in terms of the reduced friction area and unspecified variables such as the welding efficiency and friction coefficient, the errors of the heat transfer simulation results were reduced by test correlation with the temperature measurement experiment results for the optimal process. Table 2 shows the tool’s design variables for heat source calculation.
Qt = QShoulder_bottom + QPin_lateral + QPin_bottom = η·[2πωτ(Rs3 − Rp3)/3 + 2πωτRp3/3 + 2πωRp3Hp]
τ = μP = μFN/(π Rs2)

3. Derivation of Optimal Fillet FSW Process

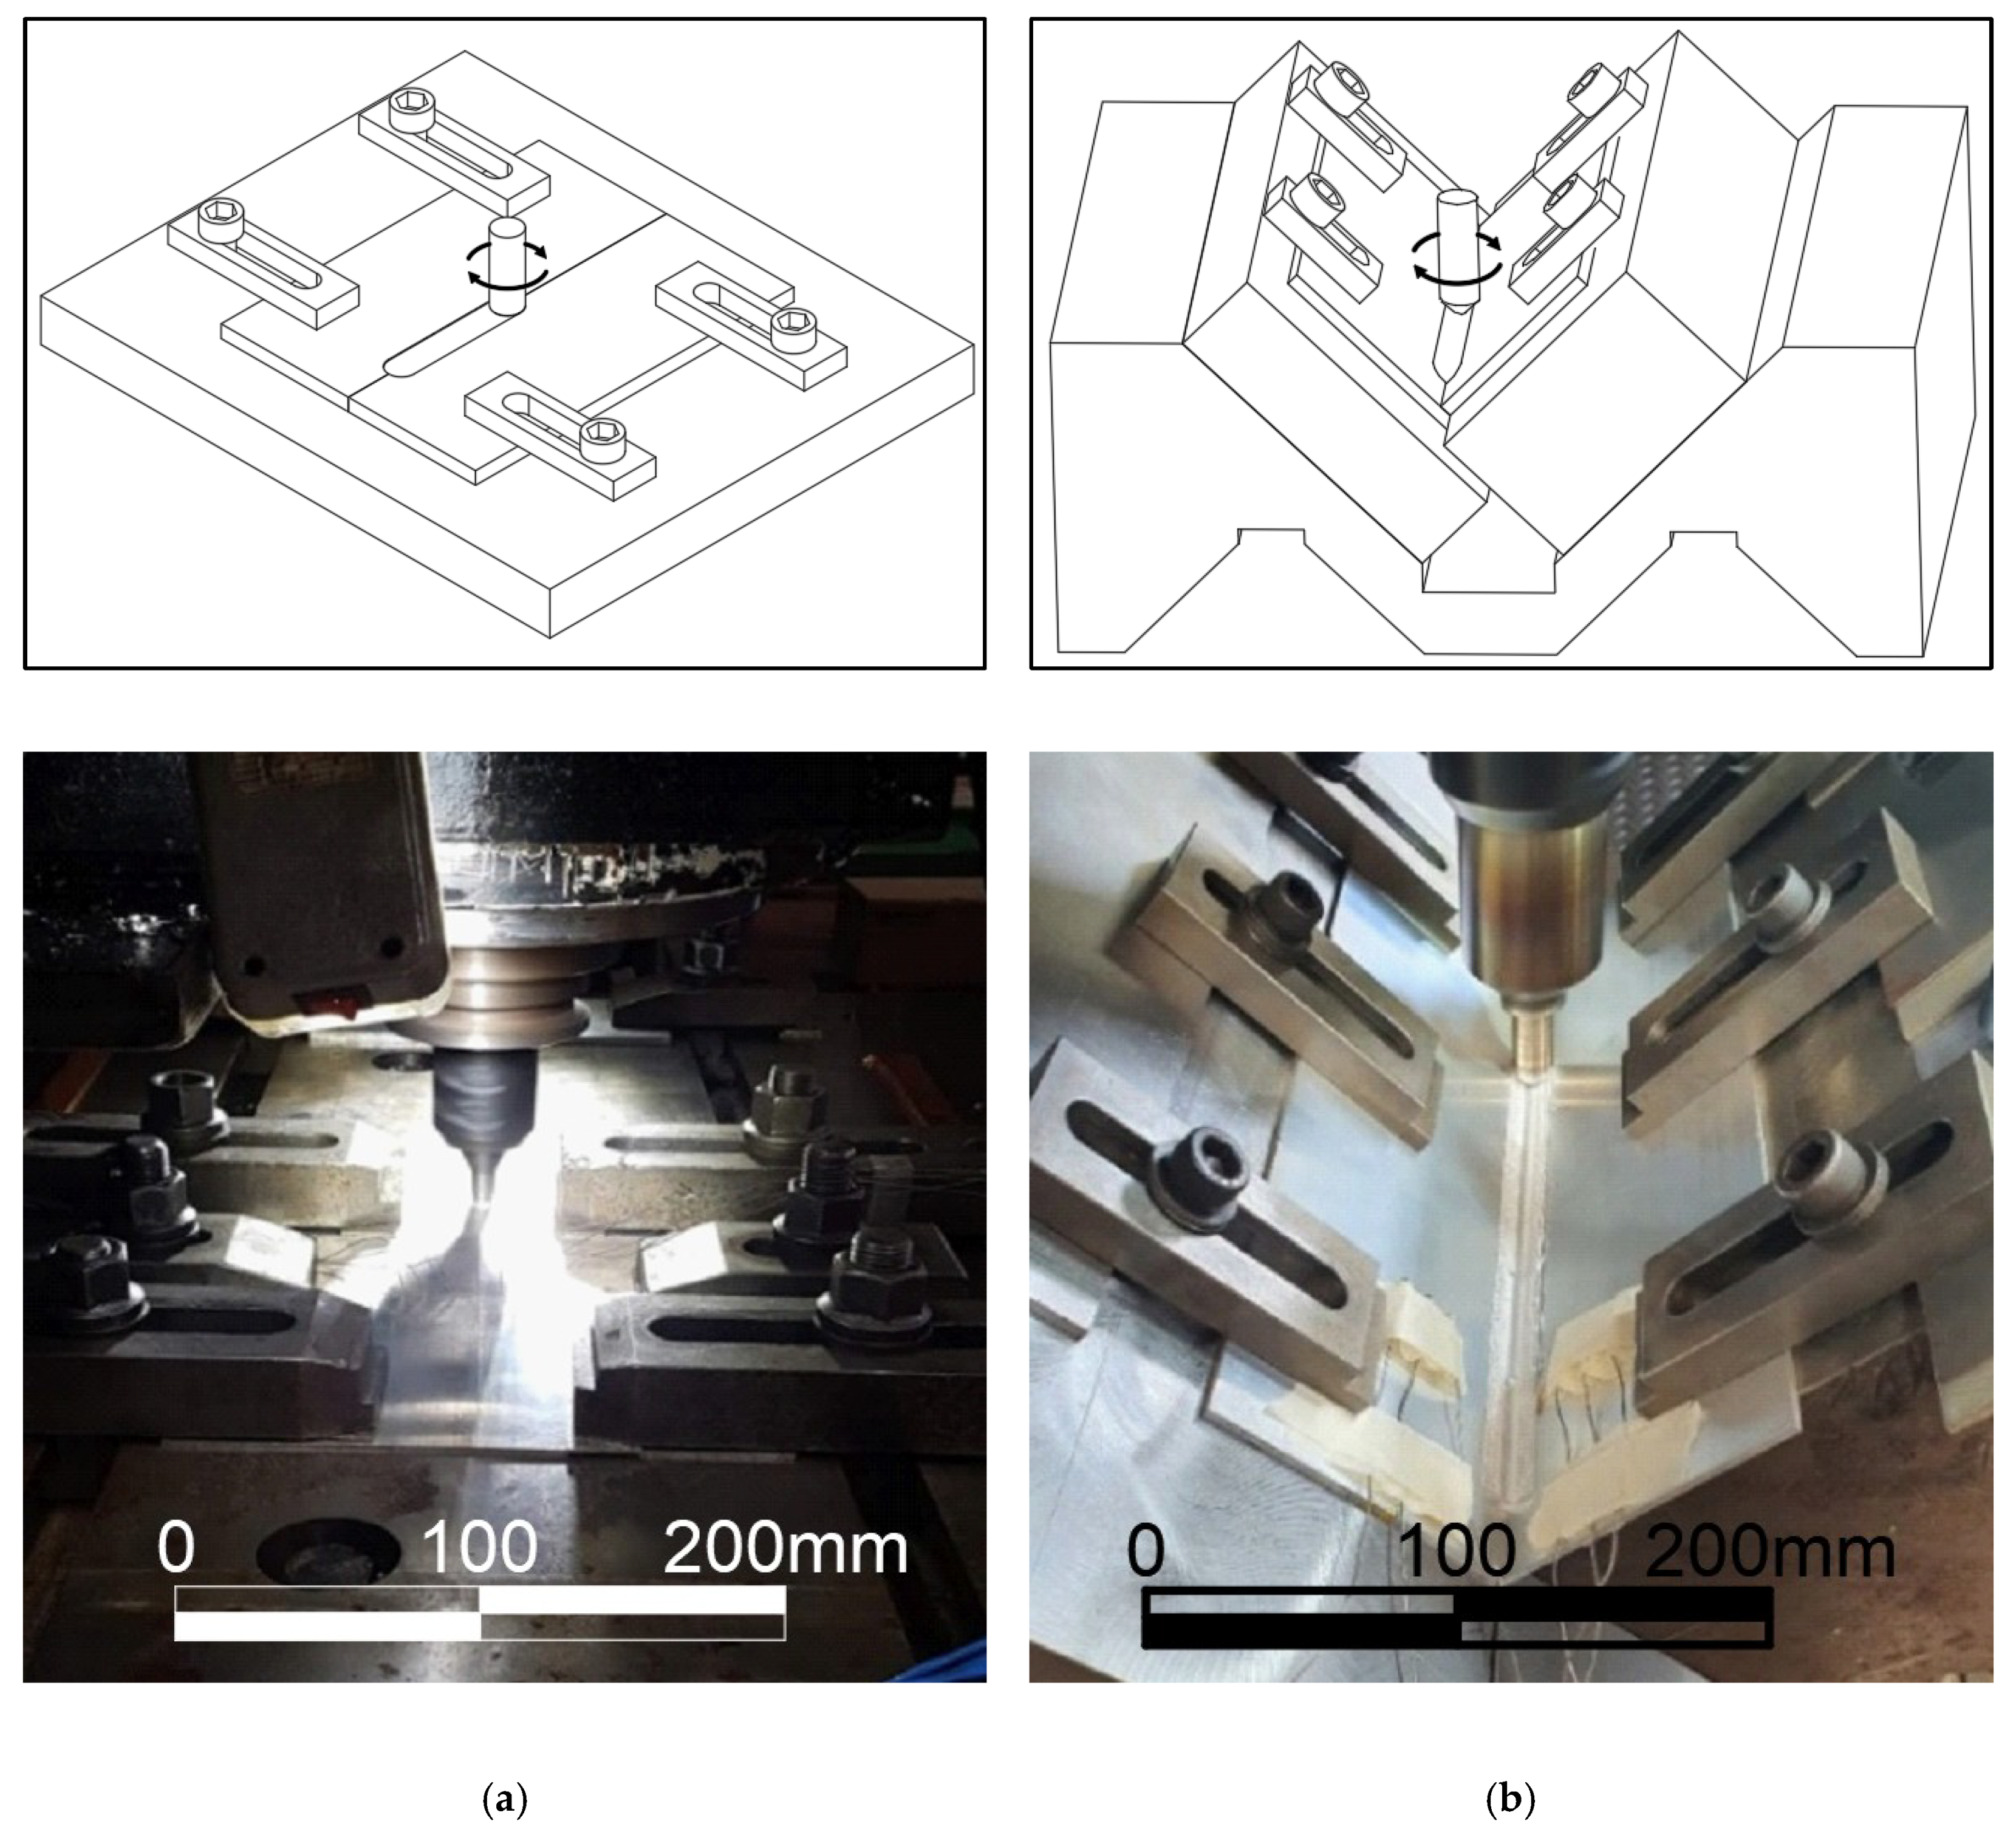
First, FSW was performed on specimen units for process conditions such as rotation speed and welding speed to find the optimal process conditions for friction stir welding. To investigate the tendency of each welding method, this study performing basic butt FSW and fillet joint FSW using jigs and compared the conditions of the two processes, as shown in Figure 8.
Table 3 and Table 4 show the process conditions for each specimen according to the welding methods. In the case of butt joint FSW, there is a process map for each aluminum material, and based on this, an optimal process derivation experiment was performed for a total of 25 specimens in the range of tool rotation speed 1600–2400 and welding speed 600–1000 [12,13]. In the case of fillet joint FSW, the range was specified through an experiment in units of specimens, and the optimum process was derived for a total of 9 specimens in the range of tool rotation speed 1000–1400 and welding speed 40–80. In order to reduce the processing time, the specimens under the condition of increasing the welding speed did not generate sufficient frictional heat. As a result, the surface of the base metal was scratched as if it was processed, and was excluded from the range of consideration. Each specimen was derived based on the tensile strength of the welded surface by performing tensile tests, and specimens #15 and #9 were derived for butt FSW and the fillet joint FSW, respectively. Table 5 shows the optimal process conditions for each welding method.
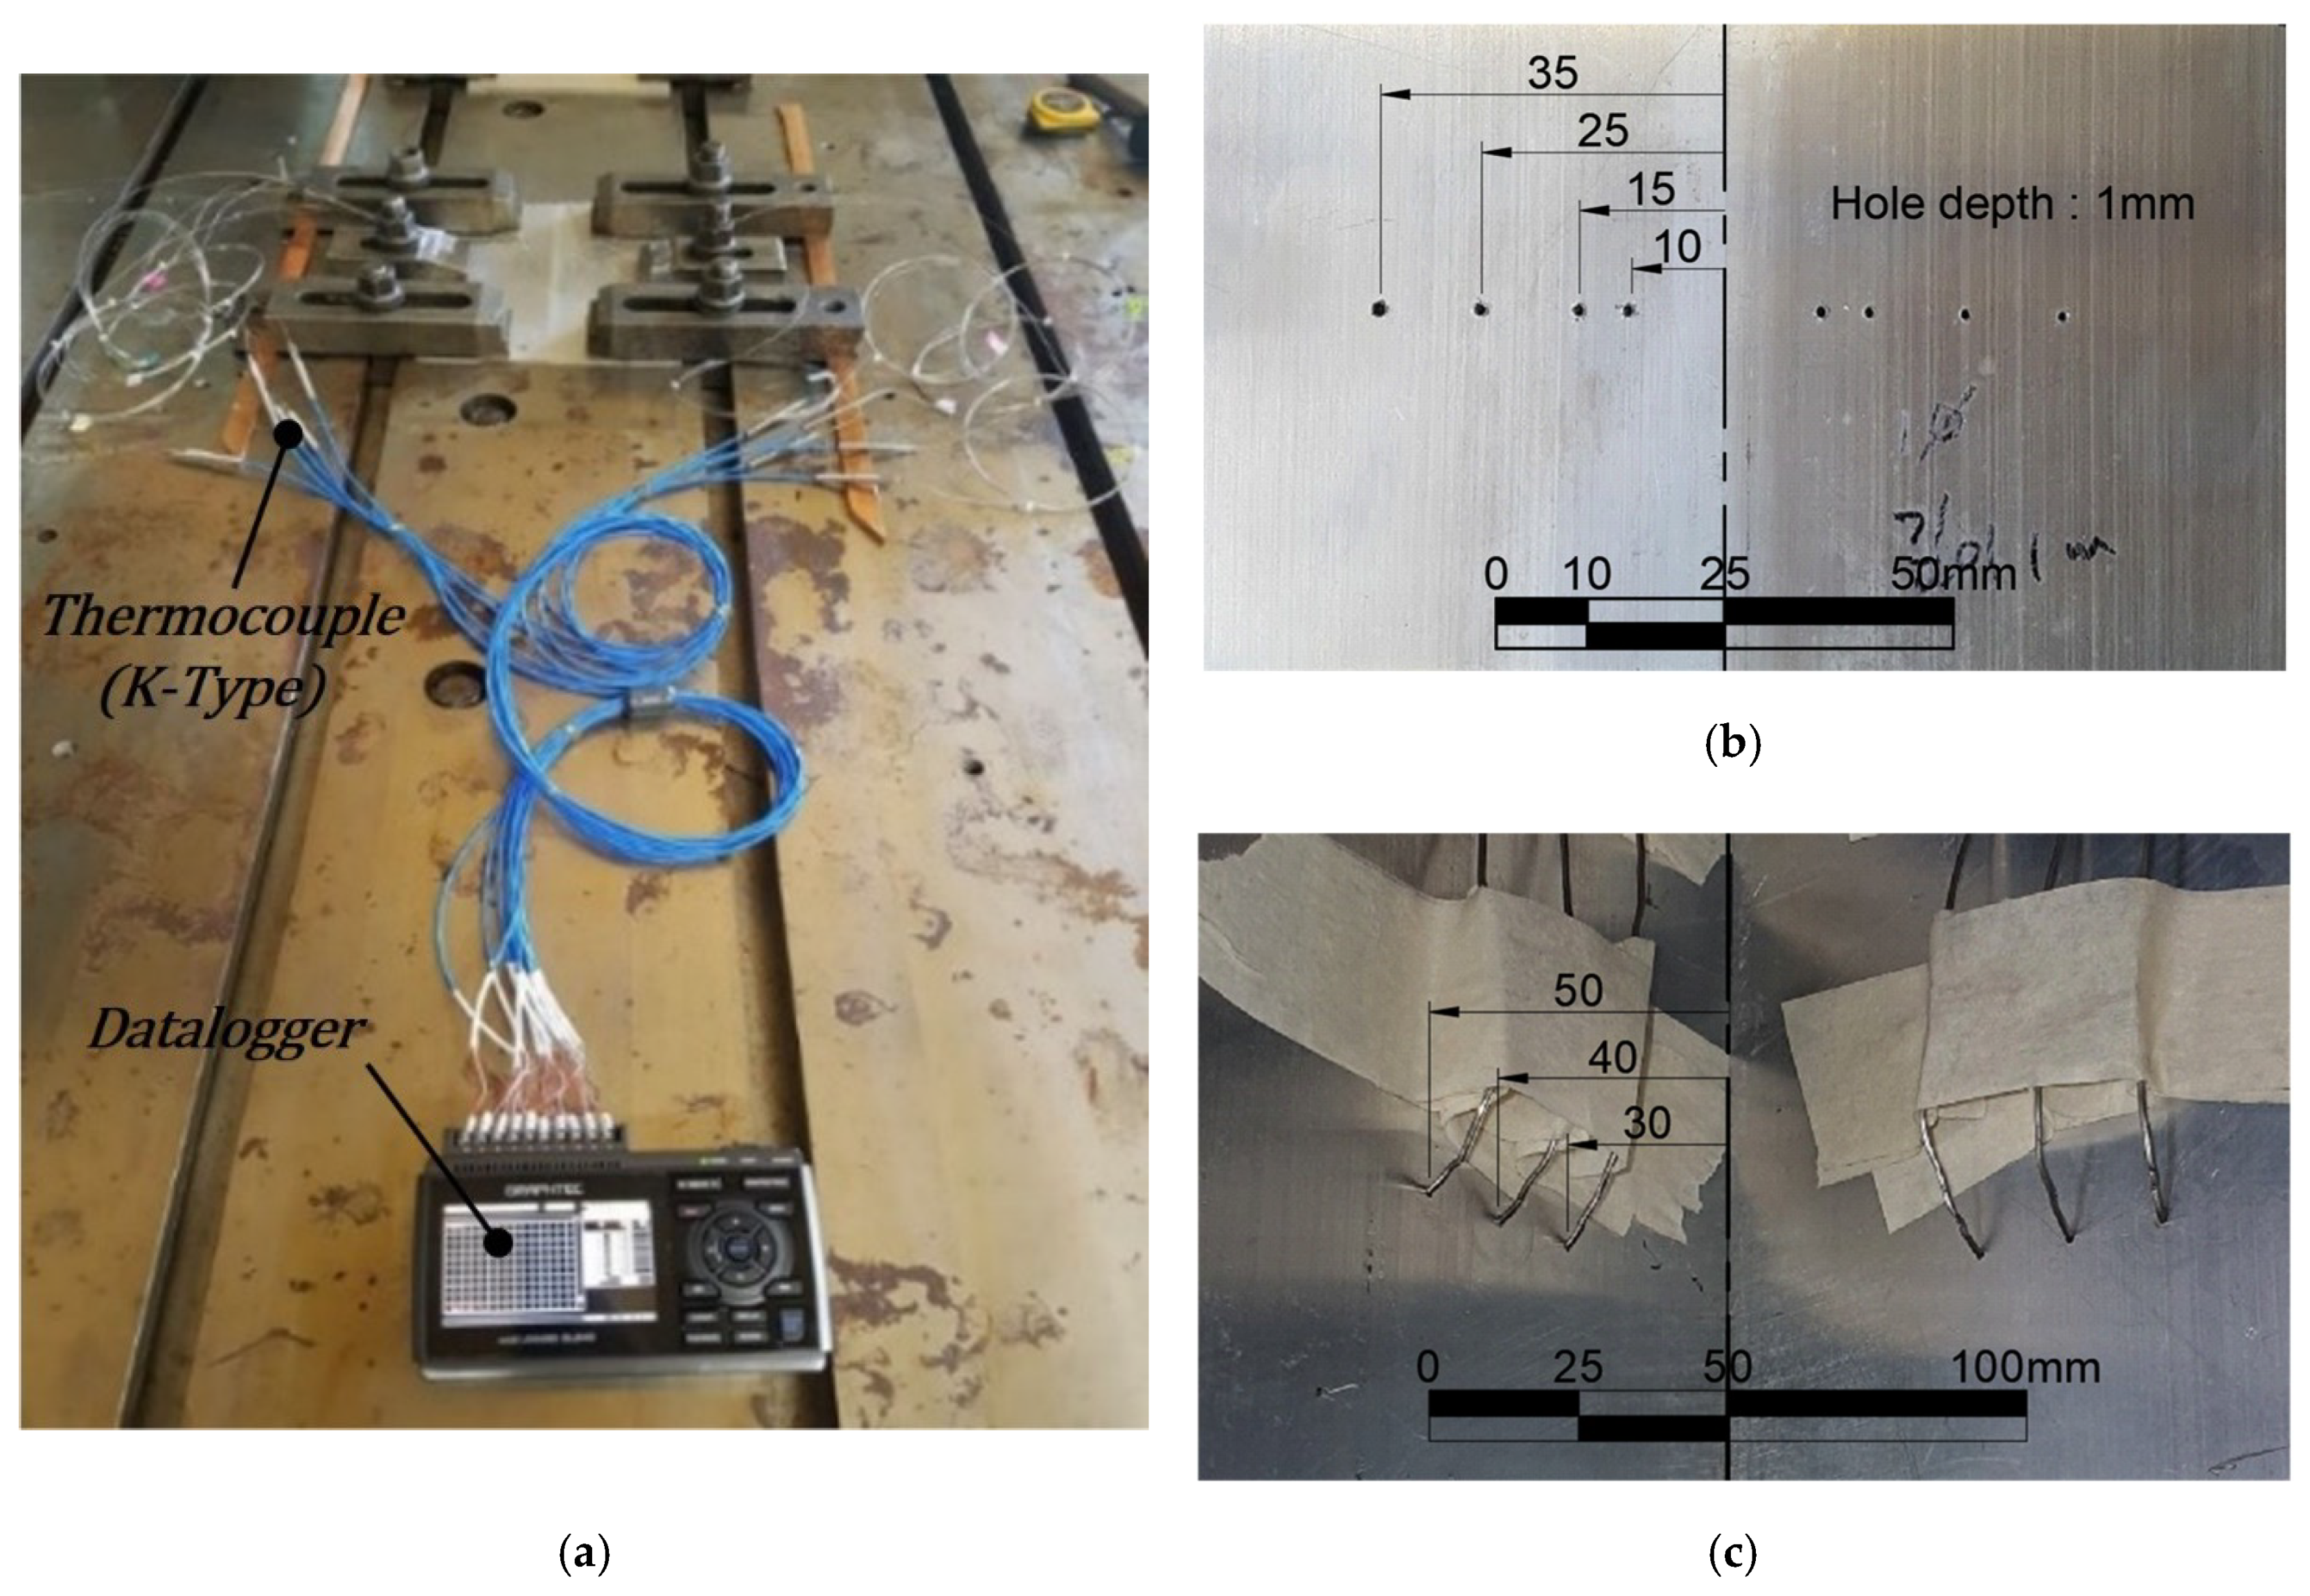
Next, temperature measurement experiments were performed under the optimal process conditions. Temperature measurements were made with a thermocouple and data logger, as shown in Figure 9a. The thermocouple was inserted at a certain distance from the welding center line, as shown in Figure 9b,c for butt FSW and fillet joint FSW to measure the temperatures.
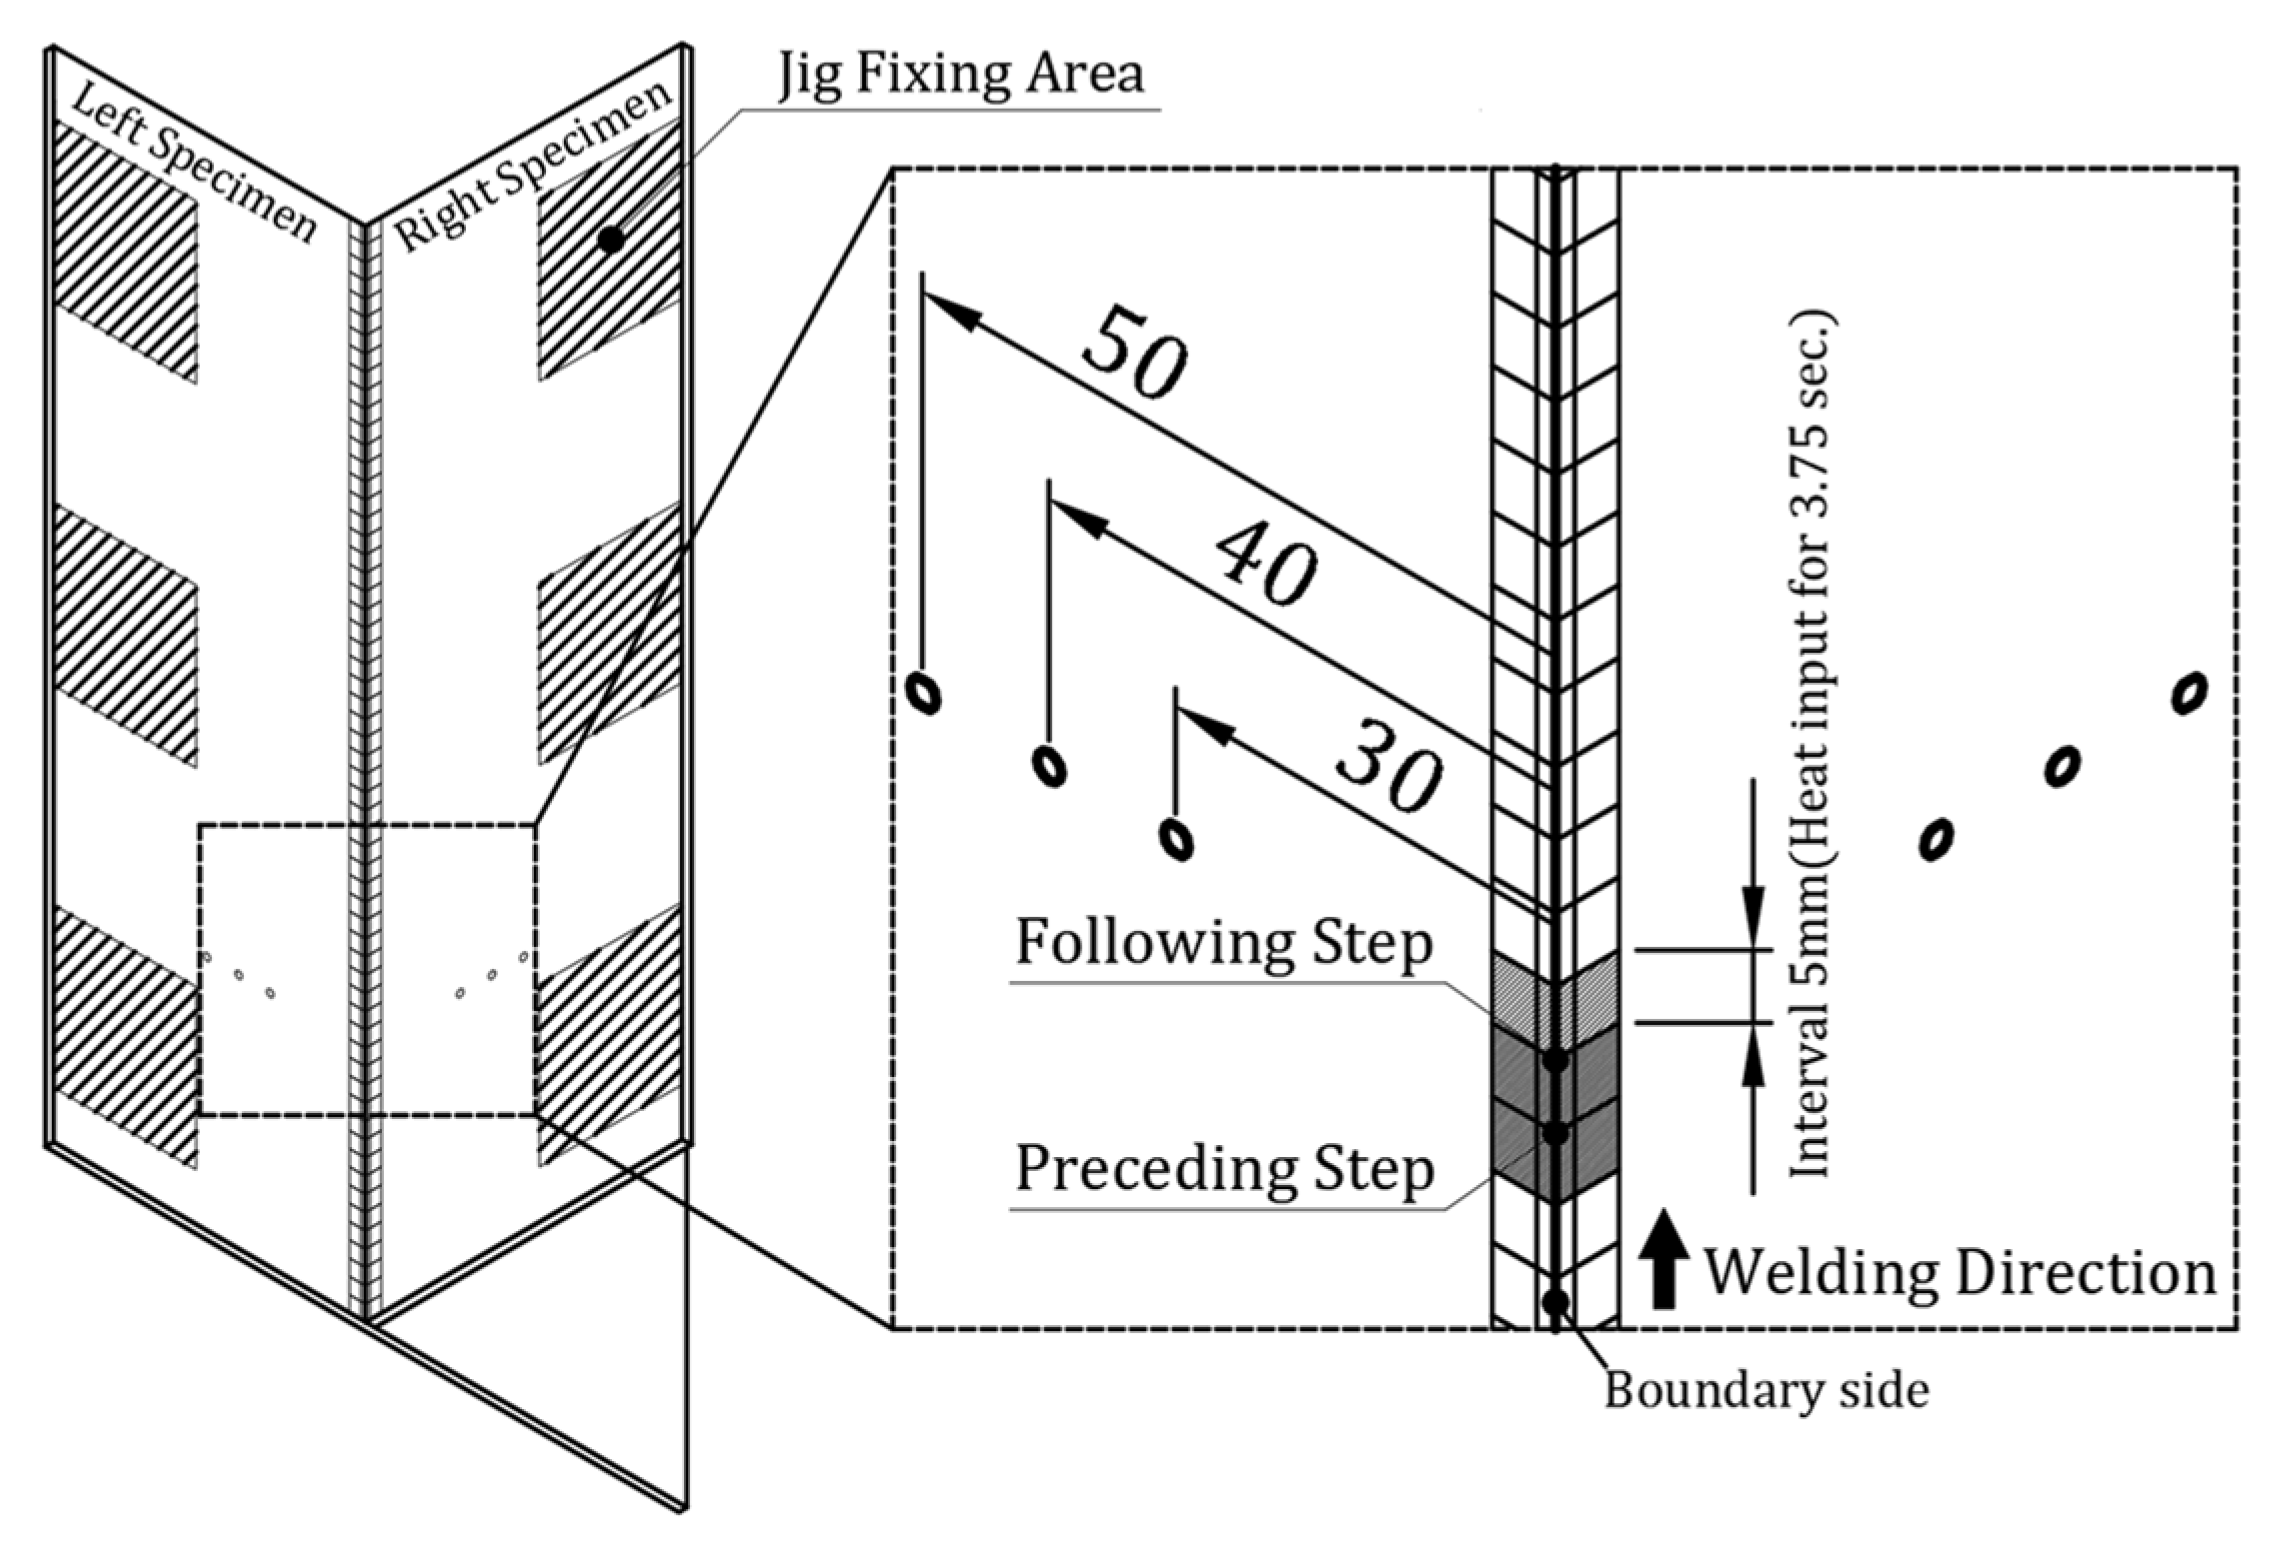
Heat transfer simulation was performed under the same conditions as the optimal process conditions derived from the specimen units. As shown in Figure 10, the heat flux calculated using the Reynolds heat source model was entered into the welding center to implement the heat source movement according to the welding speed.
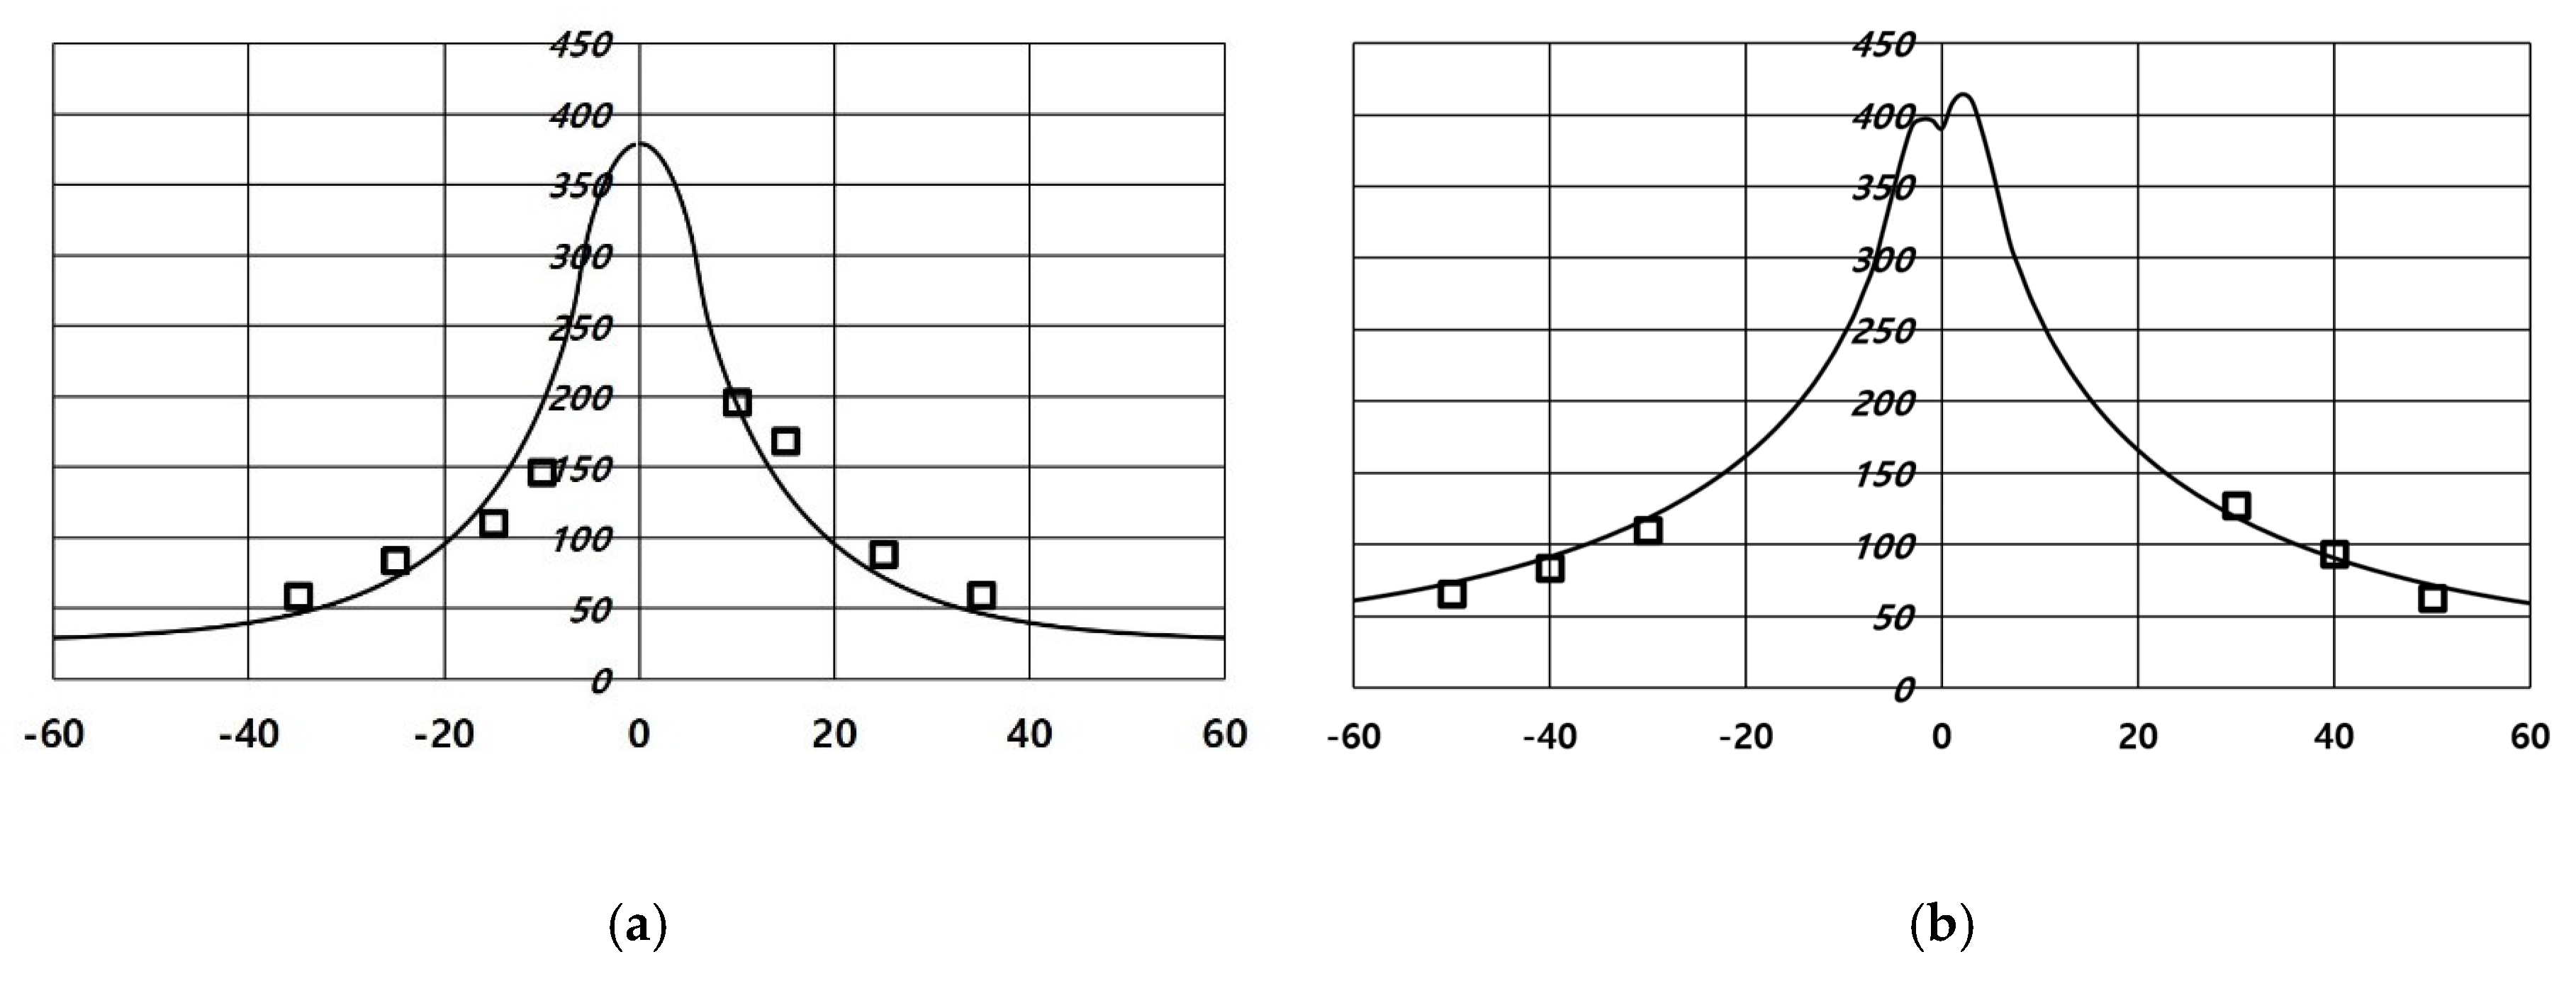
In terms of optimal process, the results of the FSW temperature measurement experiments performed on butt and fillet joint specimen units and the heat transfer simulation results were adjusted through test correlation to minimize the errors, as shown in Figure 11. In the graph, the square box is the experiment result, and the solid line is the simulation result. Table 6 and Table 7 show the details for each welding method, and the mean error was 5.3% in butt FSW and -6% in fillet joint FSW. The temperature of the welding center derived through this process was entered as the thermal load in the heat transfer analysis of the full-frame structure.

4. Heat Transfer Analysis for the Full-Frame Structure

The material properties of AL6063-T5 (the main material of the structure) such as density, specific heat, and thermal conductivity are required for heat transfer analysis. This study used material properties including nonlinear temperature history information, as shown in Figure 12, to conduct the analysis more accurately [14]. As shown in Figure 13, the 3D design geometry of the full-frame structure was also simplified before performing the simulation. The overall shape was simplified by removing negligible geometric elements such as the chamfer and round of corners, the holes for inserting bolts and positioning pins, and the protrusions on the bottom frame to improve the mesh quality.
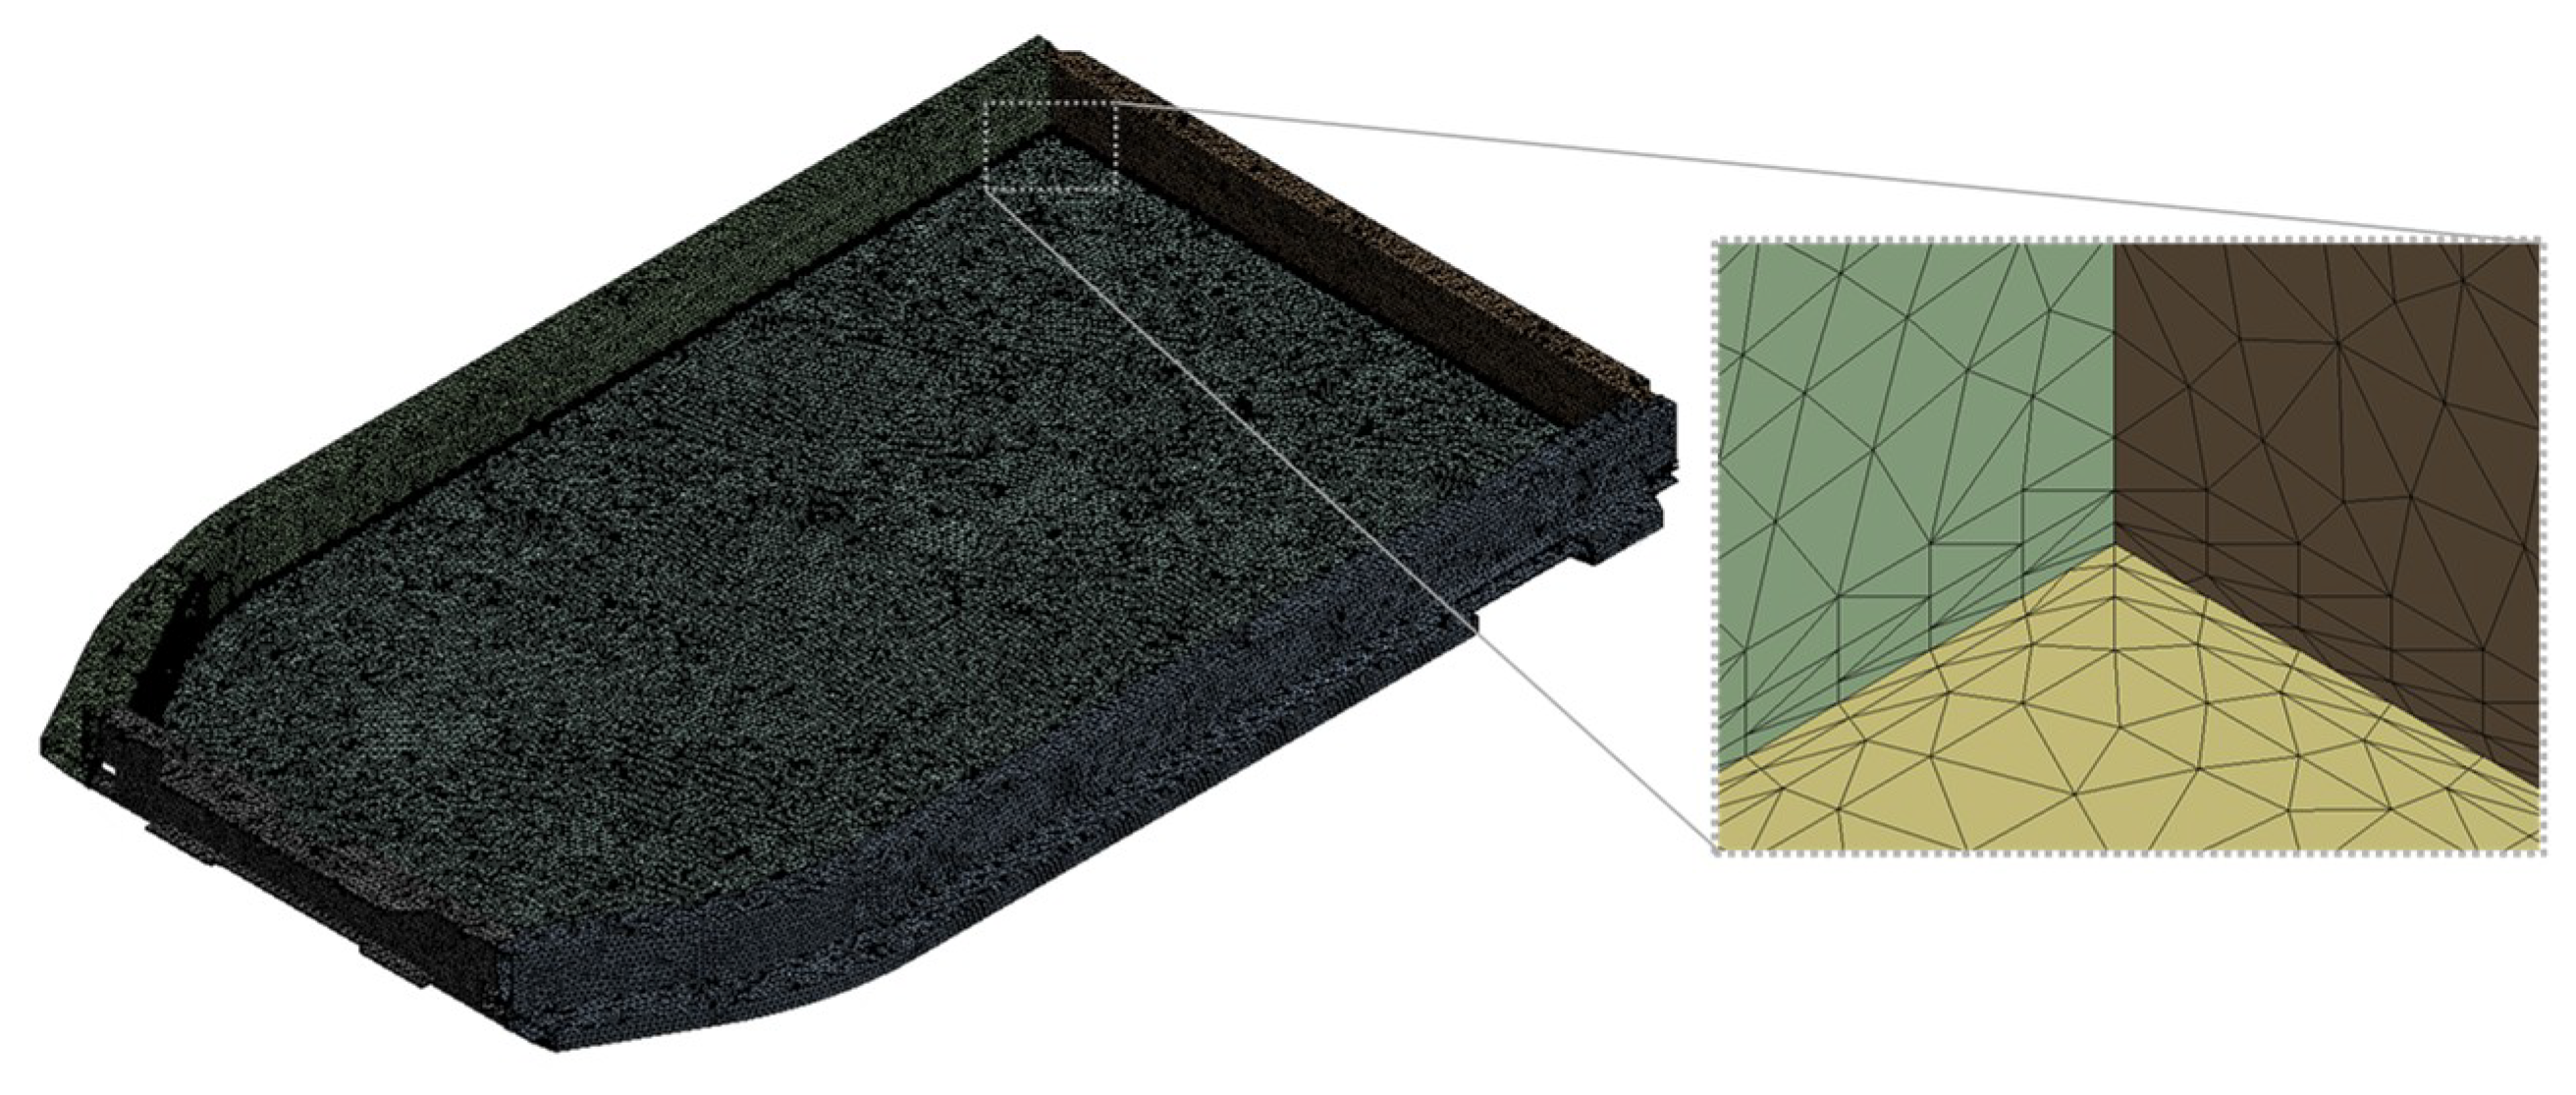
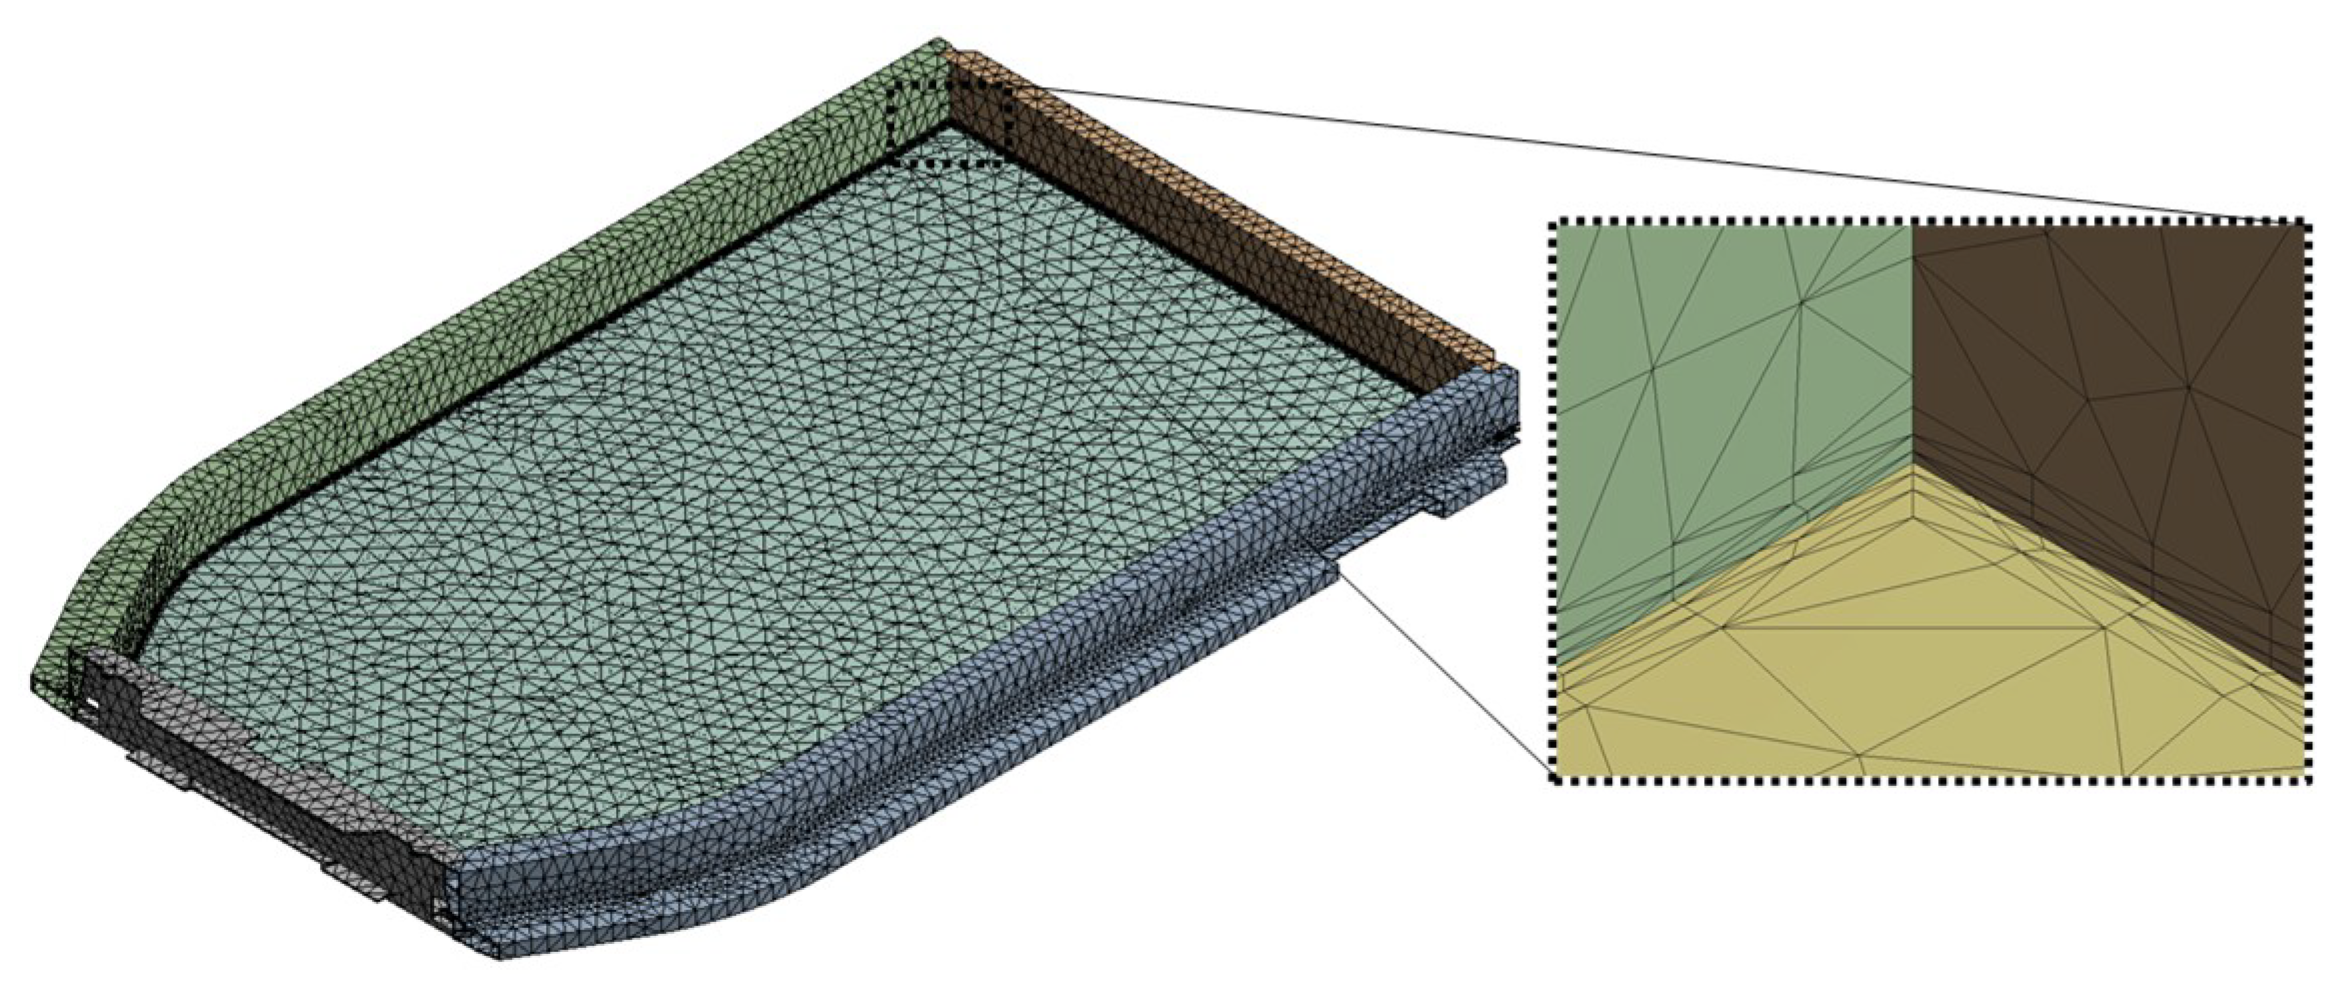
As shown in Figure 12, the 3D design geometry of the full-frame structure was simplified before conducting the simulation. The overall shape was simplified by removing negligible geometric elements such as the chamfer and round of corners, the holes for inserting bolts and positioning pins, and the protrusions on the bottom frame to improve the mesh quality. Figure 14 shows mesh for heat transfer analysis consisting of triangular elements, and Table 8 shows the mesh properties such as the conditions, method, size, quality, and the number of nodes and elements.
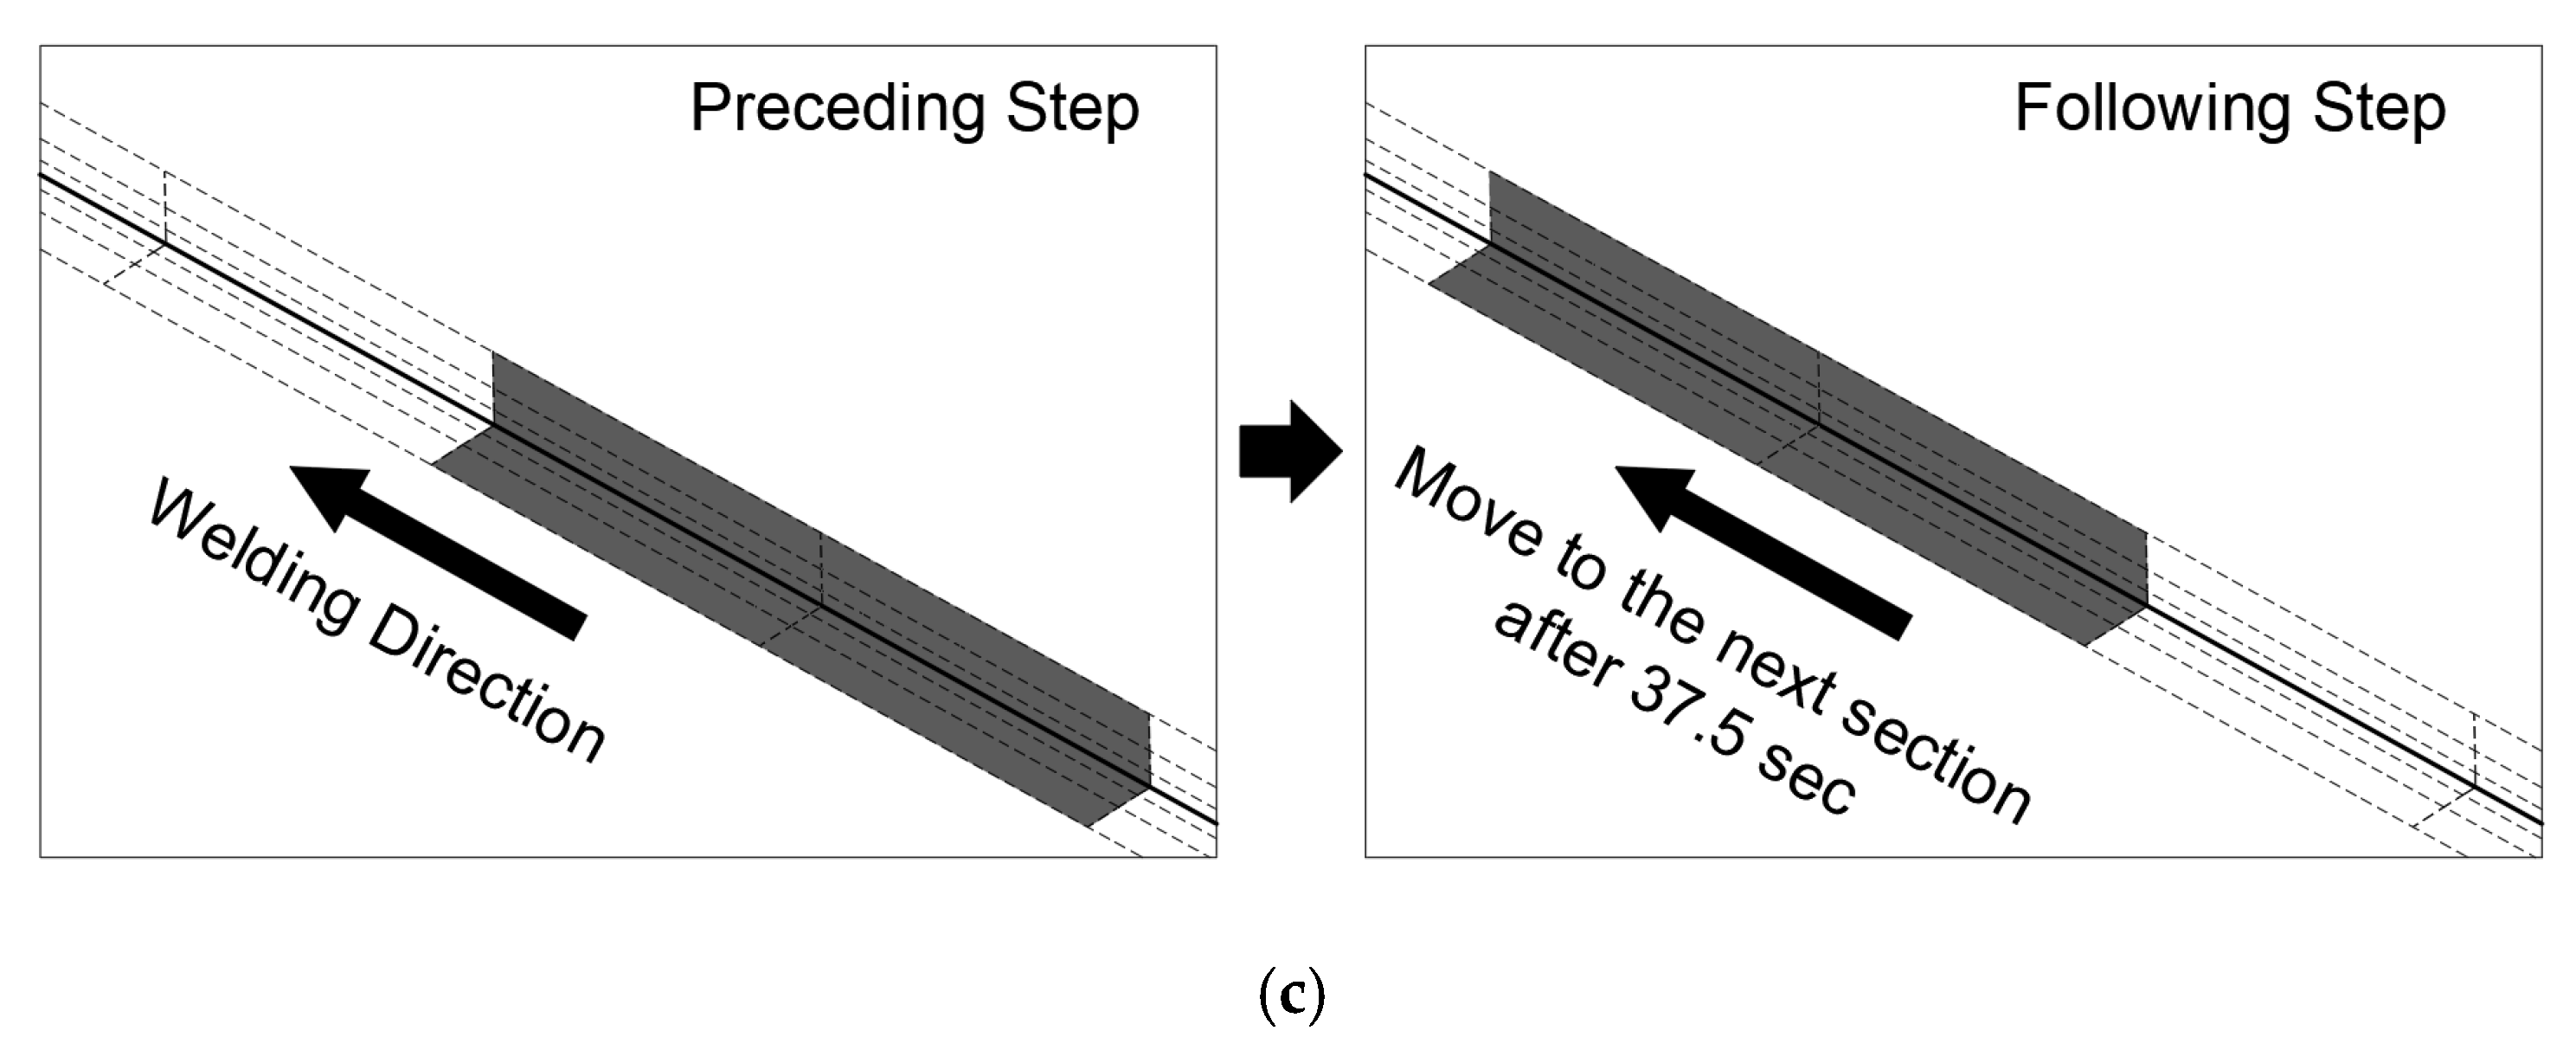
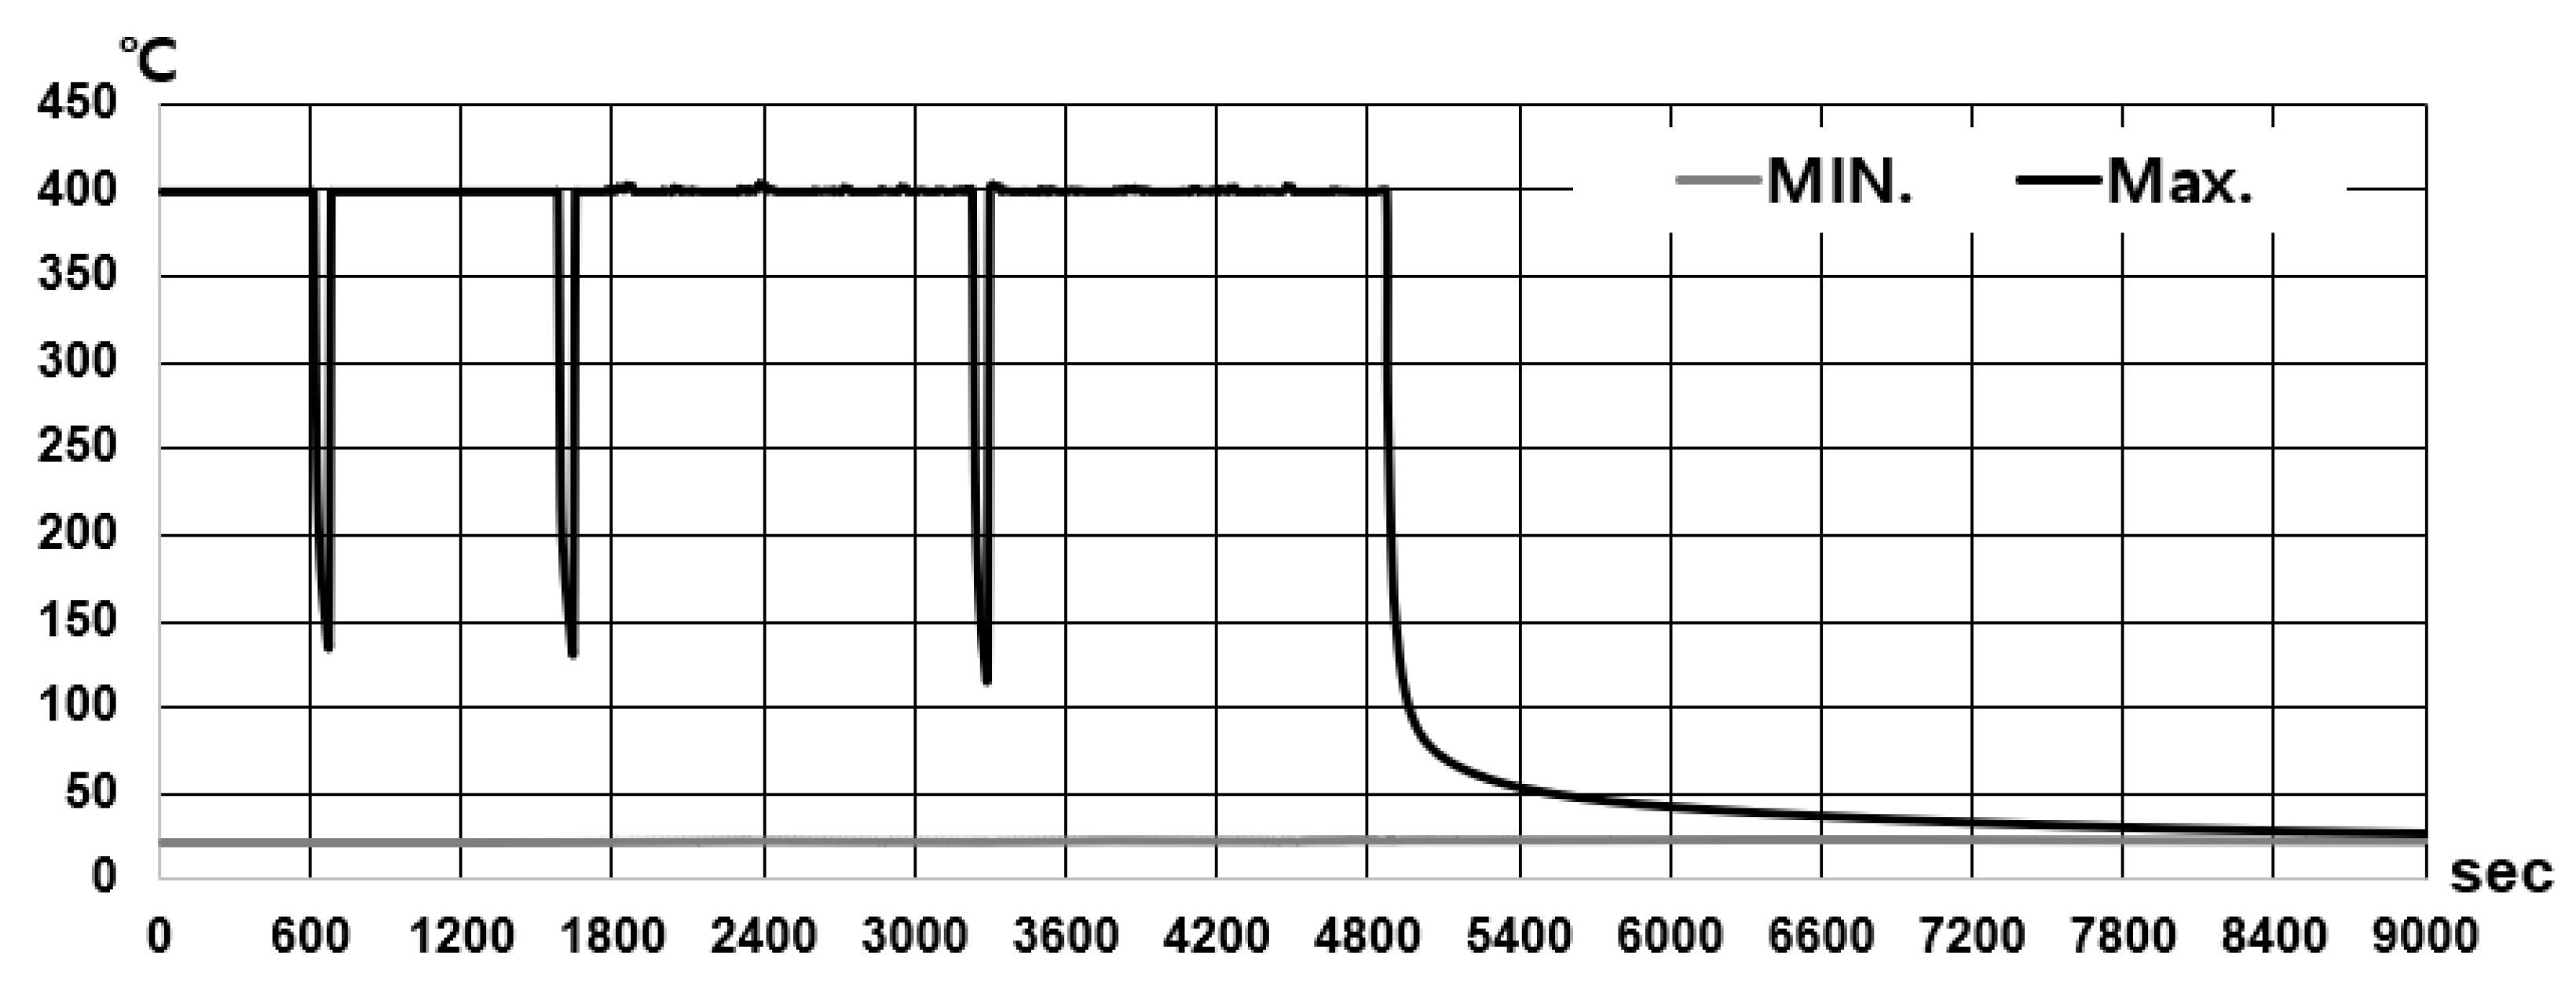
The simulation was performed by transient analysis to investigate the history of temperature according to time. The welding process sequence was in the order of front, rear, right, and left, as shown in Figure 15a, to conduct the pre-process of heat transfer analysis. To enter the temperature of the heat source derived through test correlation into the center of the weld, this study created an area to enter the heat source in the welding direction of the 3D model as shown in Figure 15b. The area to enter the heat source was divided into 50 mm sections from 2, 5, and 10 mm from the welding center line. The temperature entered in this range was determined by averaging the temperatures derived through the specimen unit test correlation as shown in Table 9. The movement of the heat source under optimal process conditions (80 mm/min welding speed) was implemented by configuring time steps to enter temperatures every 37.5 s in the temperature input area divided into 50 mm sections. The heat source application time (welding time) was 1 h, 21 min, and 40 s, and the cooling time to lower the temperature of the structure to room temperature was 1 h, so the total time step was set to 2 h, 21 min, and 40 s. In terms of the convection heat transfer coefficient, which is a factor that affects the cooling of the structure, this study applied 20 for areas in contact with air and 200 W/m2·°C for areas in contact with metal by jigs [15,16].
Figure 16 shows the temperature distribution history of the full-frame structure as the result of heat transfer analysis. The figure shows the distribution of temperature drops as the tool moves from the previous weld zone to the next weld zone and the temperature distribution for a total of 2 h and 30 min including the welding time around 1 h and 30 min and the time it takes to cool down the structure to room temperature. The series of temperature distribution histories were applied as thermal loads in the subsequent thermal elasto-plastic analysis.

5. Thermal Elasto-Plastic Analysis and Deformation Measurement for the Full-Frame Structure

Thermal elasto-plastic analysis requires material properties such as the coefficient of thermal expansion, Young’s modulus, and yield stress. Therefore, as shown in Figure 17, this study used material properties including nonlinear temperature history information [14]. Figure 18 shows mesh for thermal elasto-plastic analysis, and Table 10 shows the mesh properties.
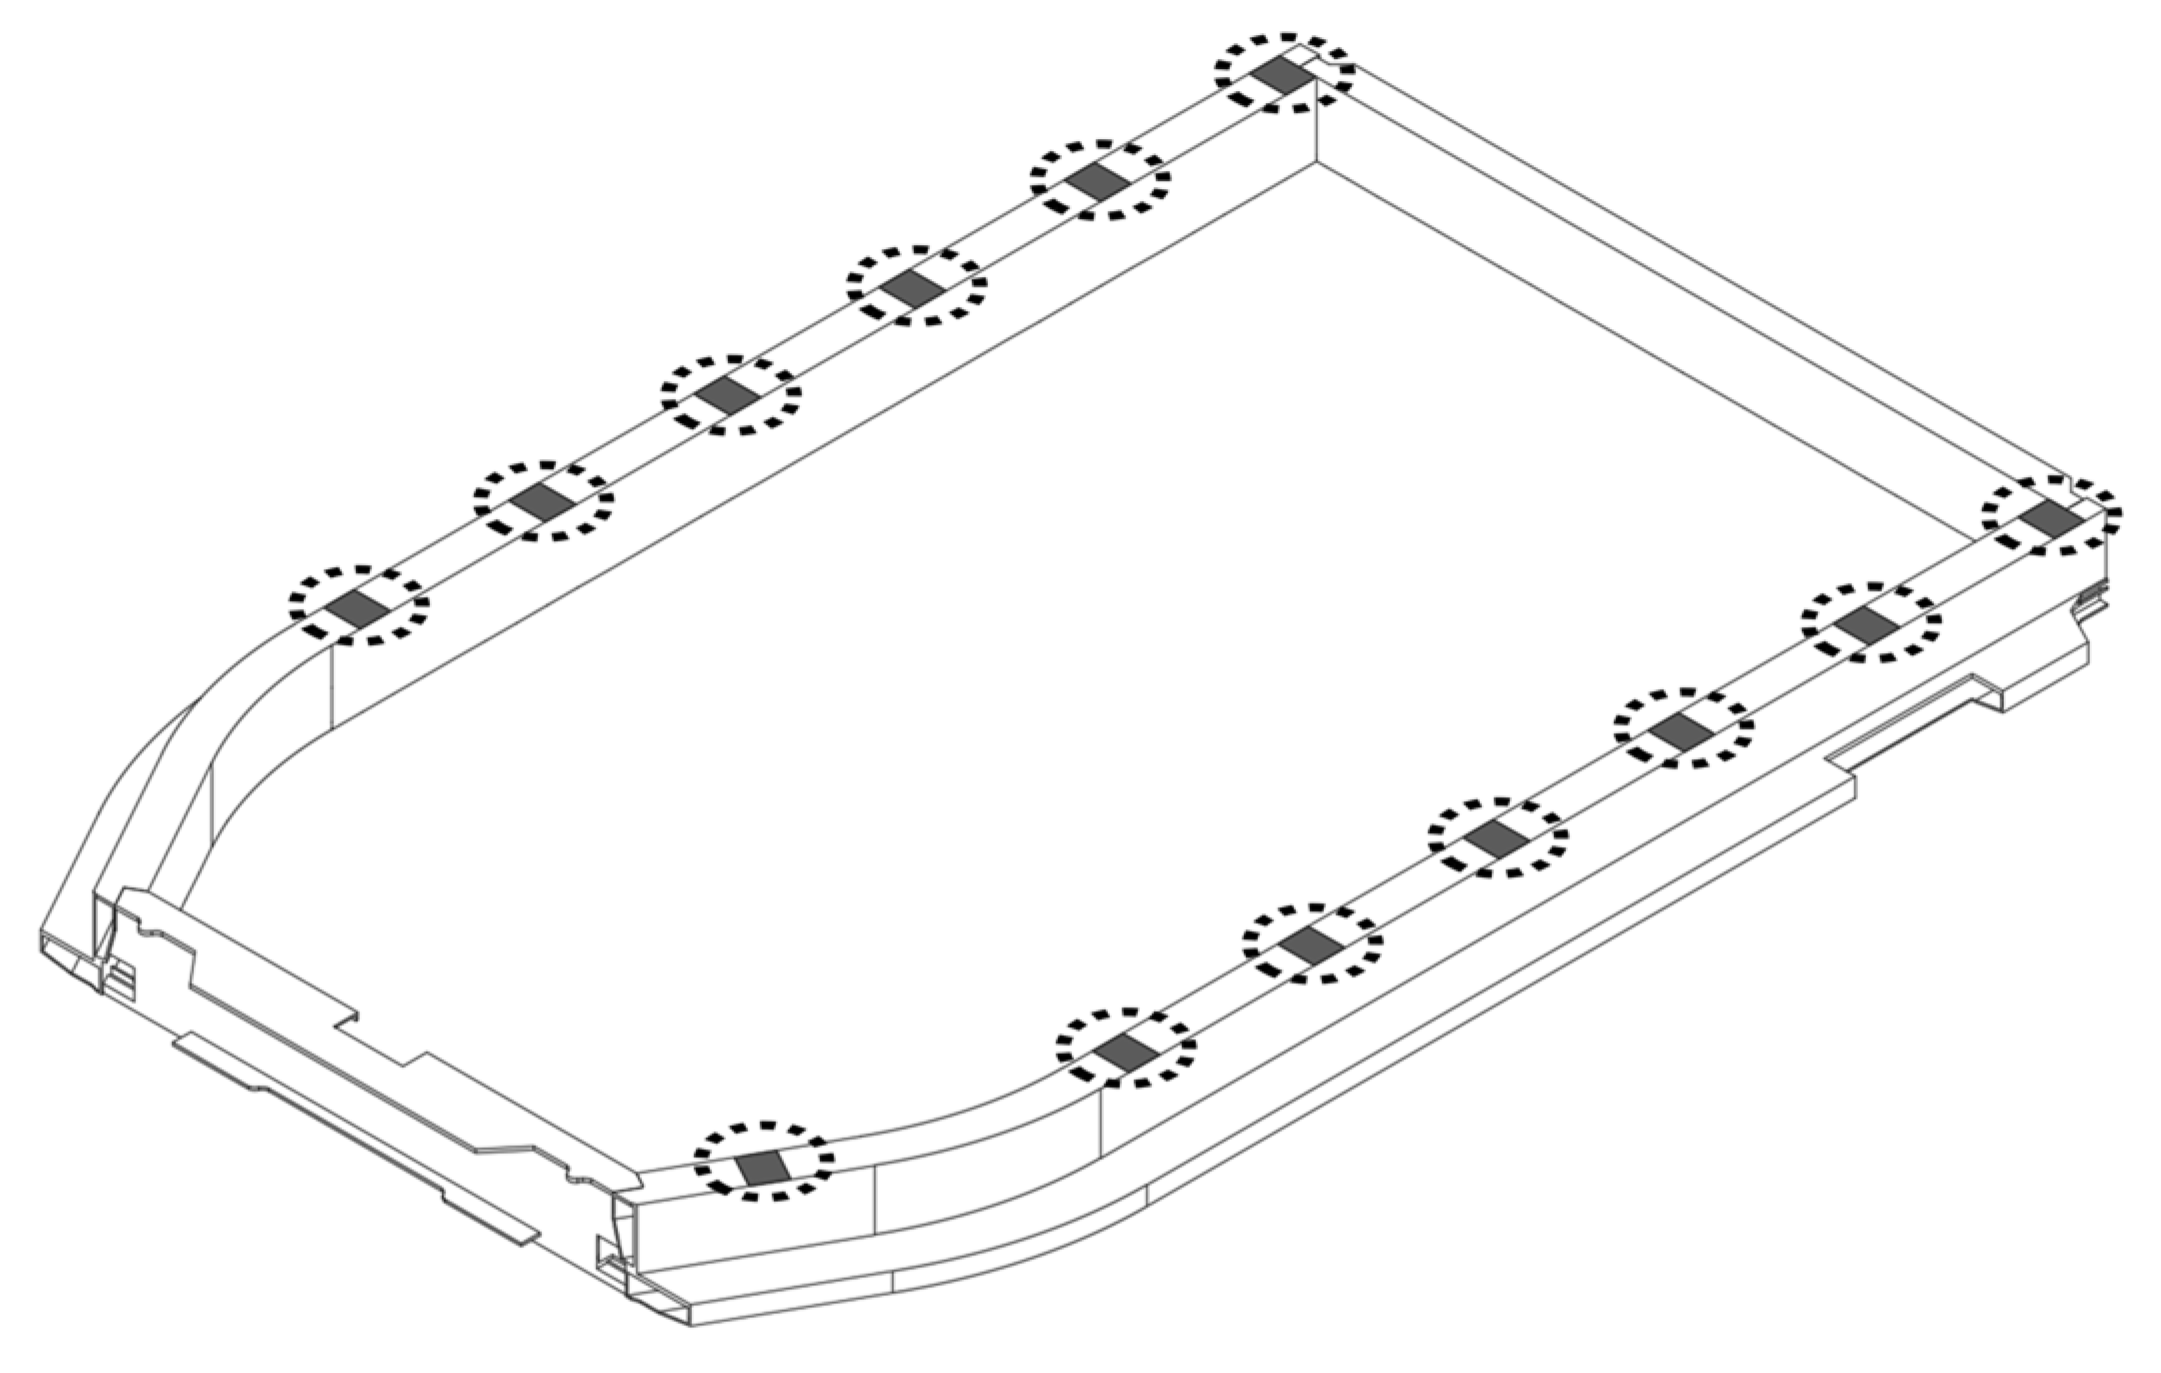
In terms of load, the thermal analysis result data was applied to the time steps and geometry. In terms of boundary conditions, geometric constraints were applied in the X (length), Y (width), and Z (height) directions in 13 areas constrained by jigs as shown in Figure 19. Constraints were only applied in the Z direction for the bottom surface, and the X and Y directions were free of constraints.
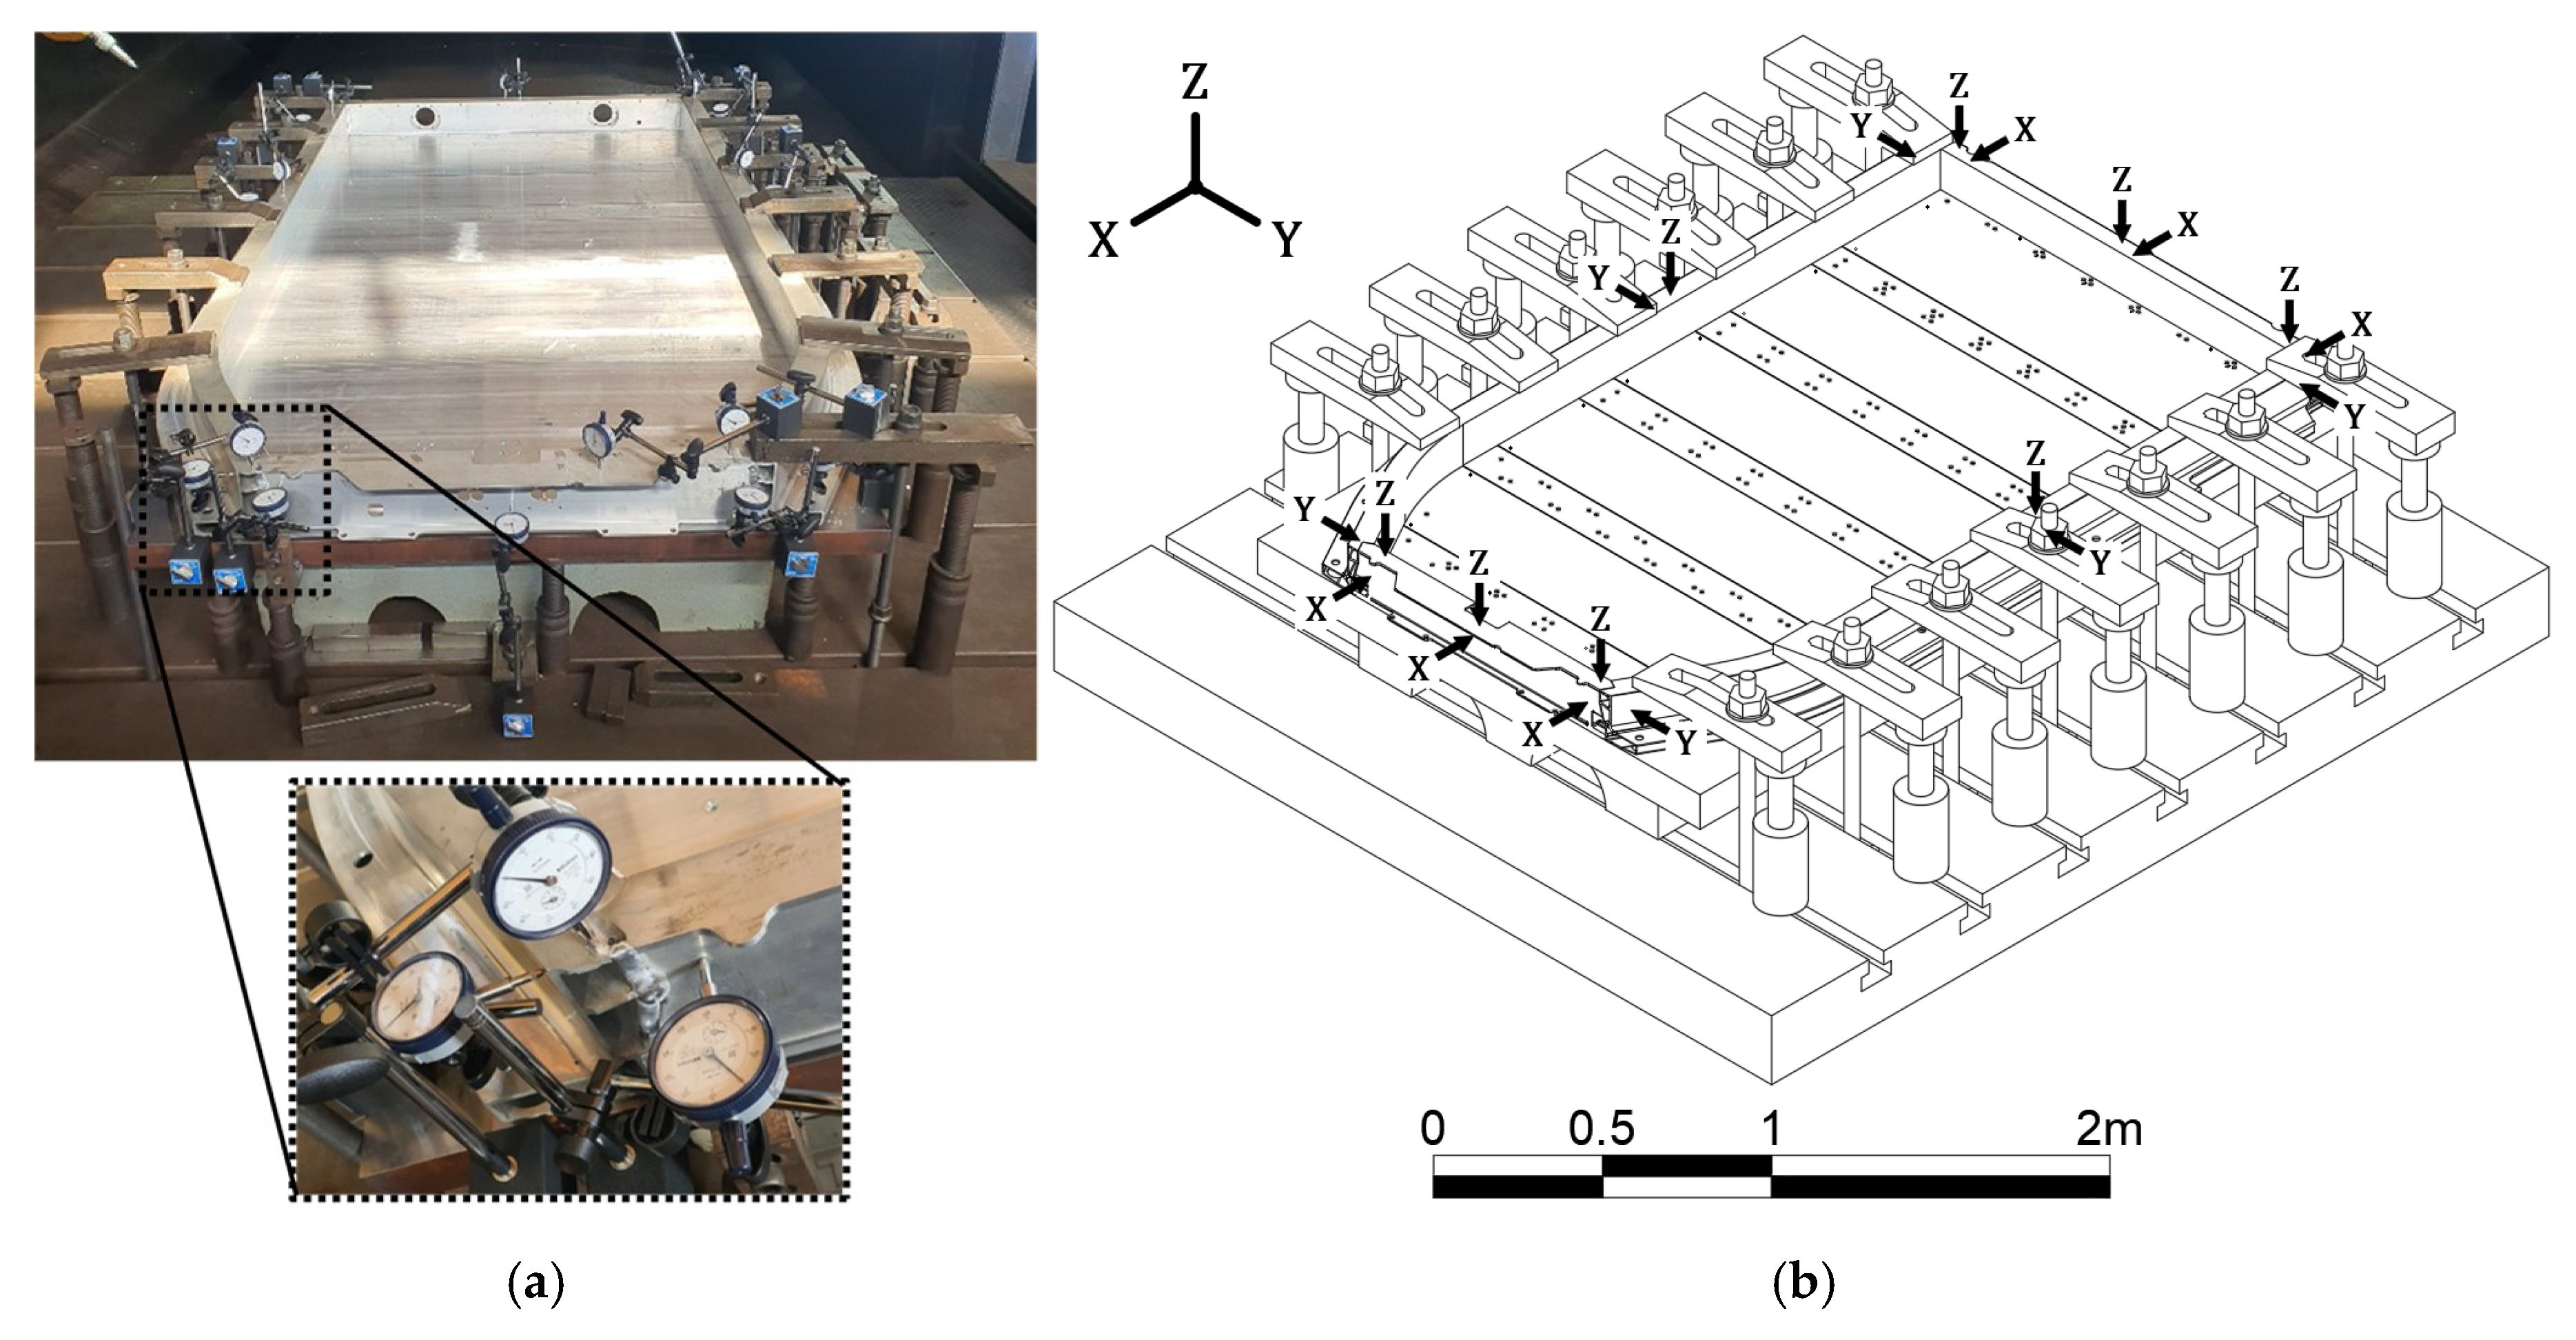
Finally, fillet joint FSW was performed on the actual full-frame structure under the same conditions as the analysis to measure the deformation, as shown in Figure 20a. The measurement was performed by using a 1/100 scale dial indicator and magnetic base at a total of 20 locations for each direction at 8 points as shown in Figure 20b.

6. Analysis Results and Verification

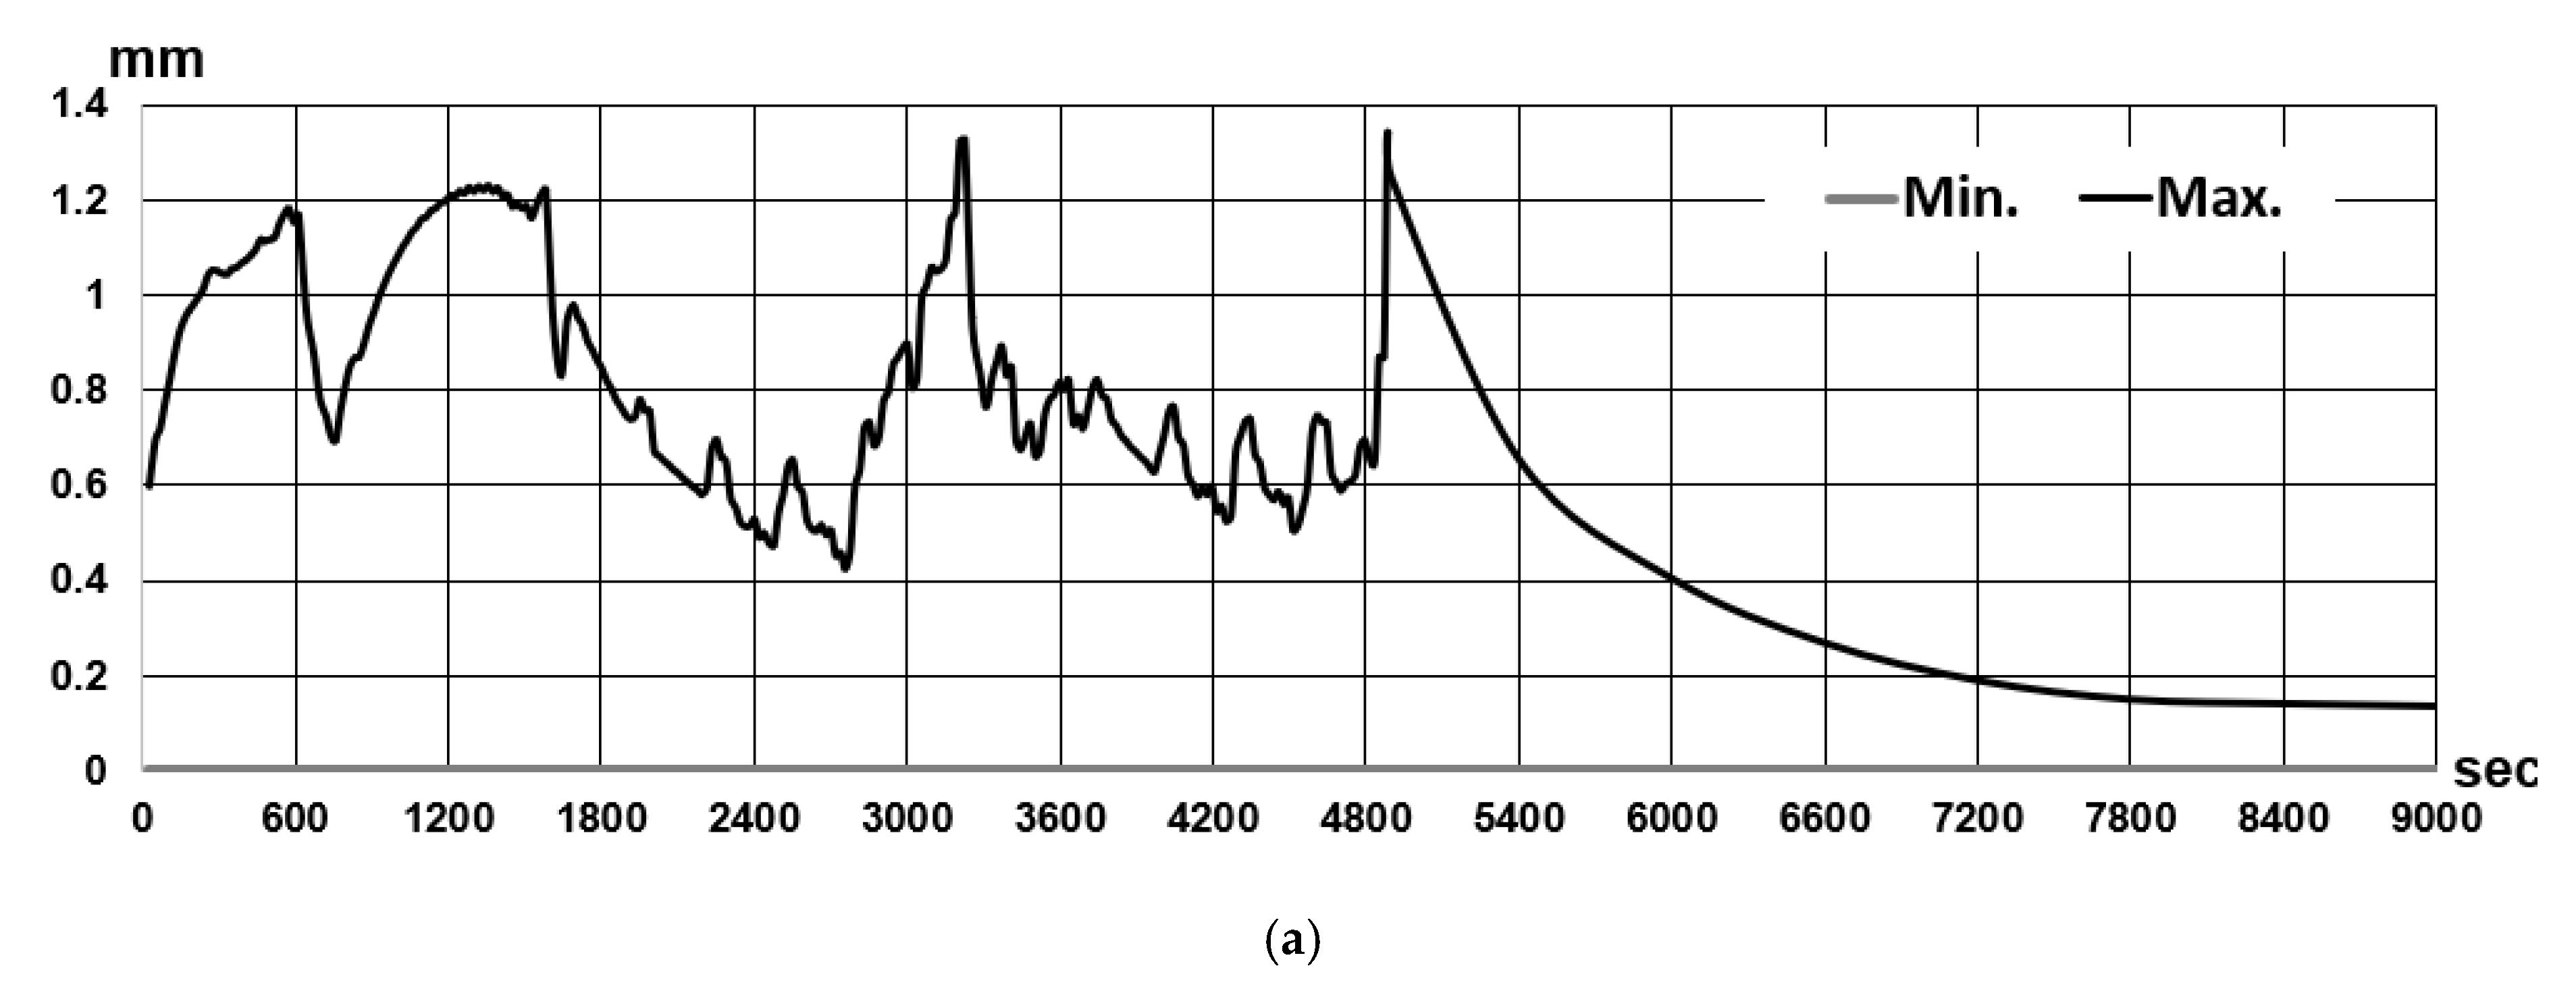
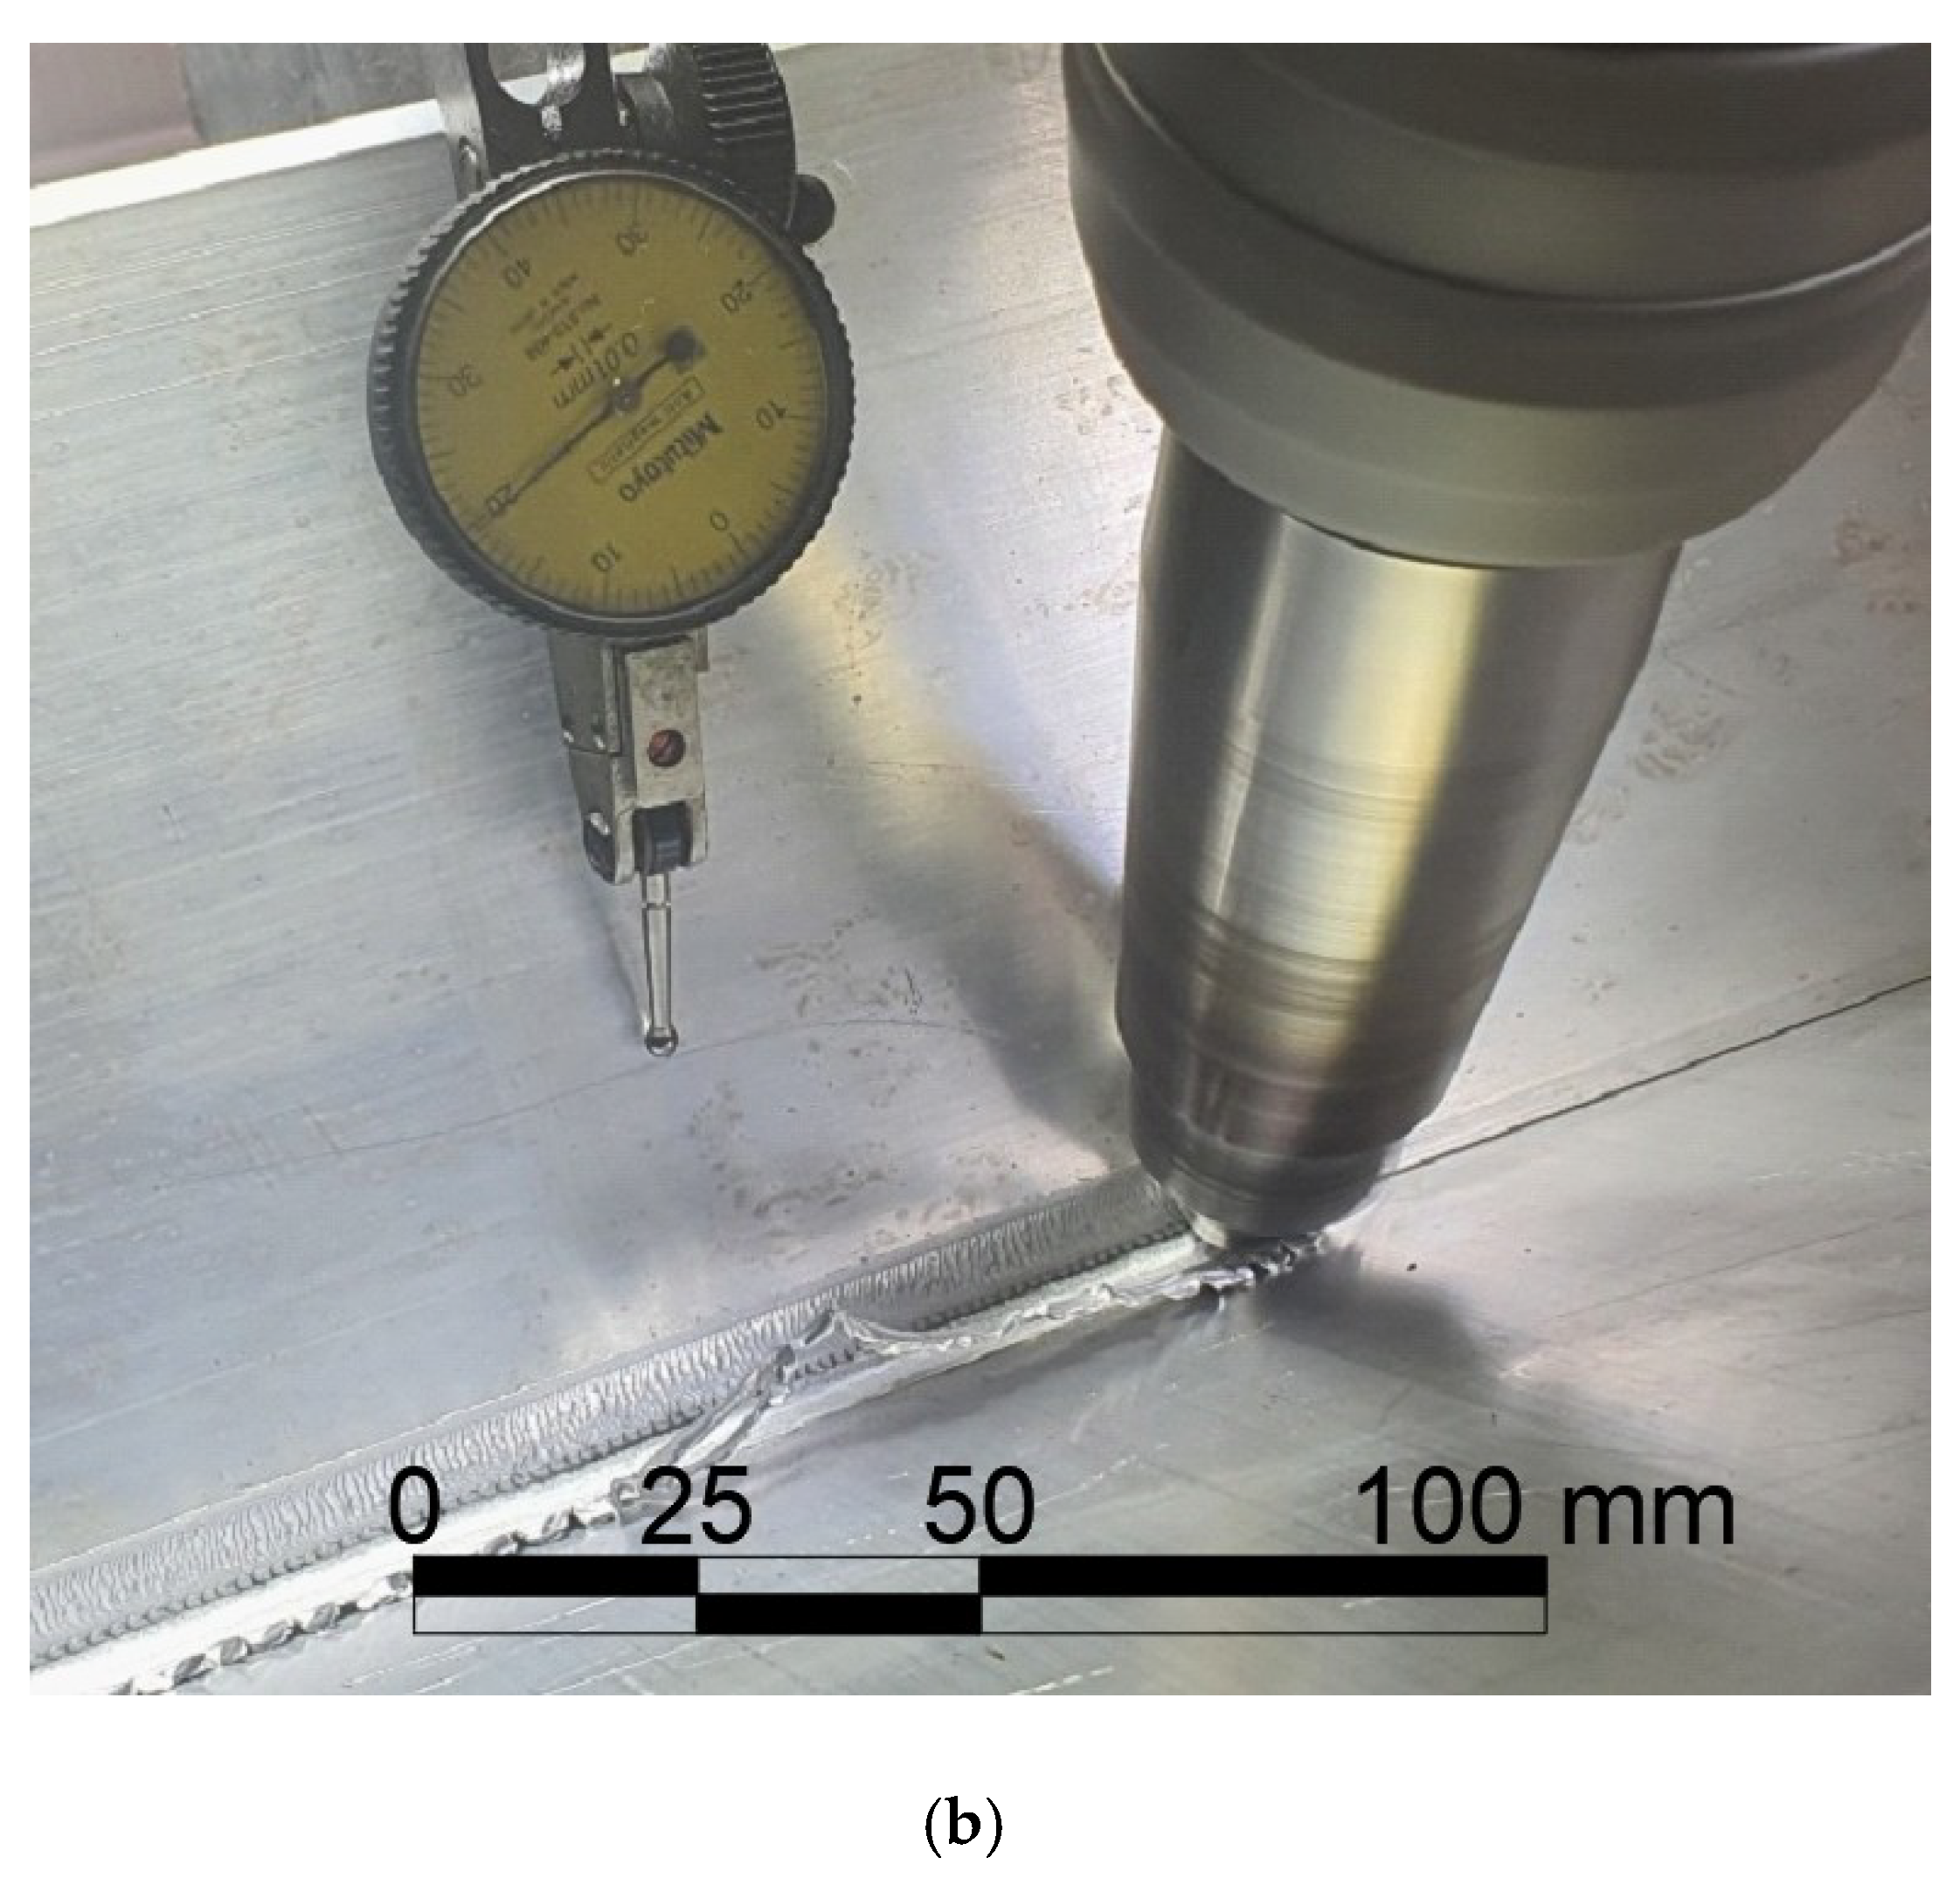
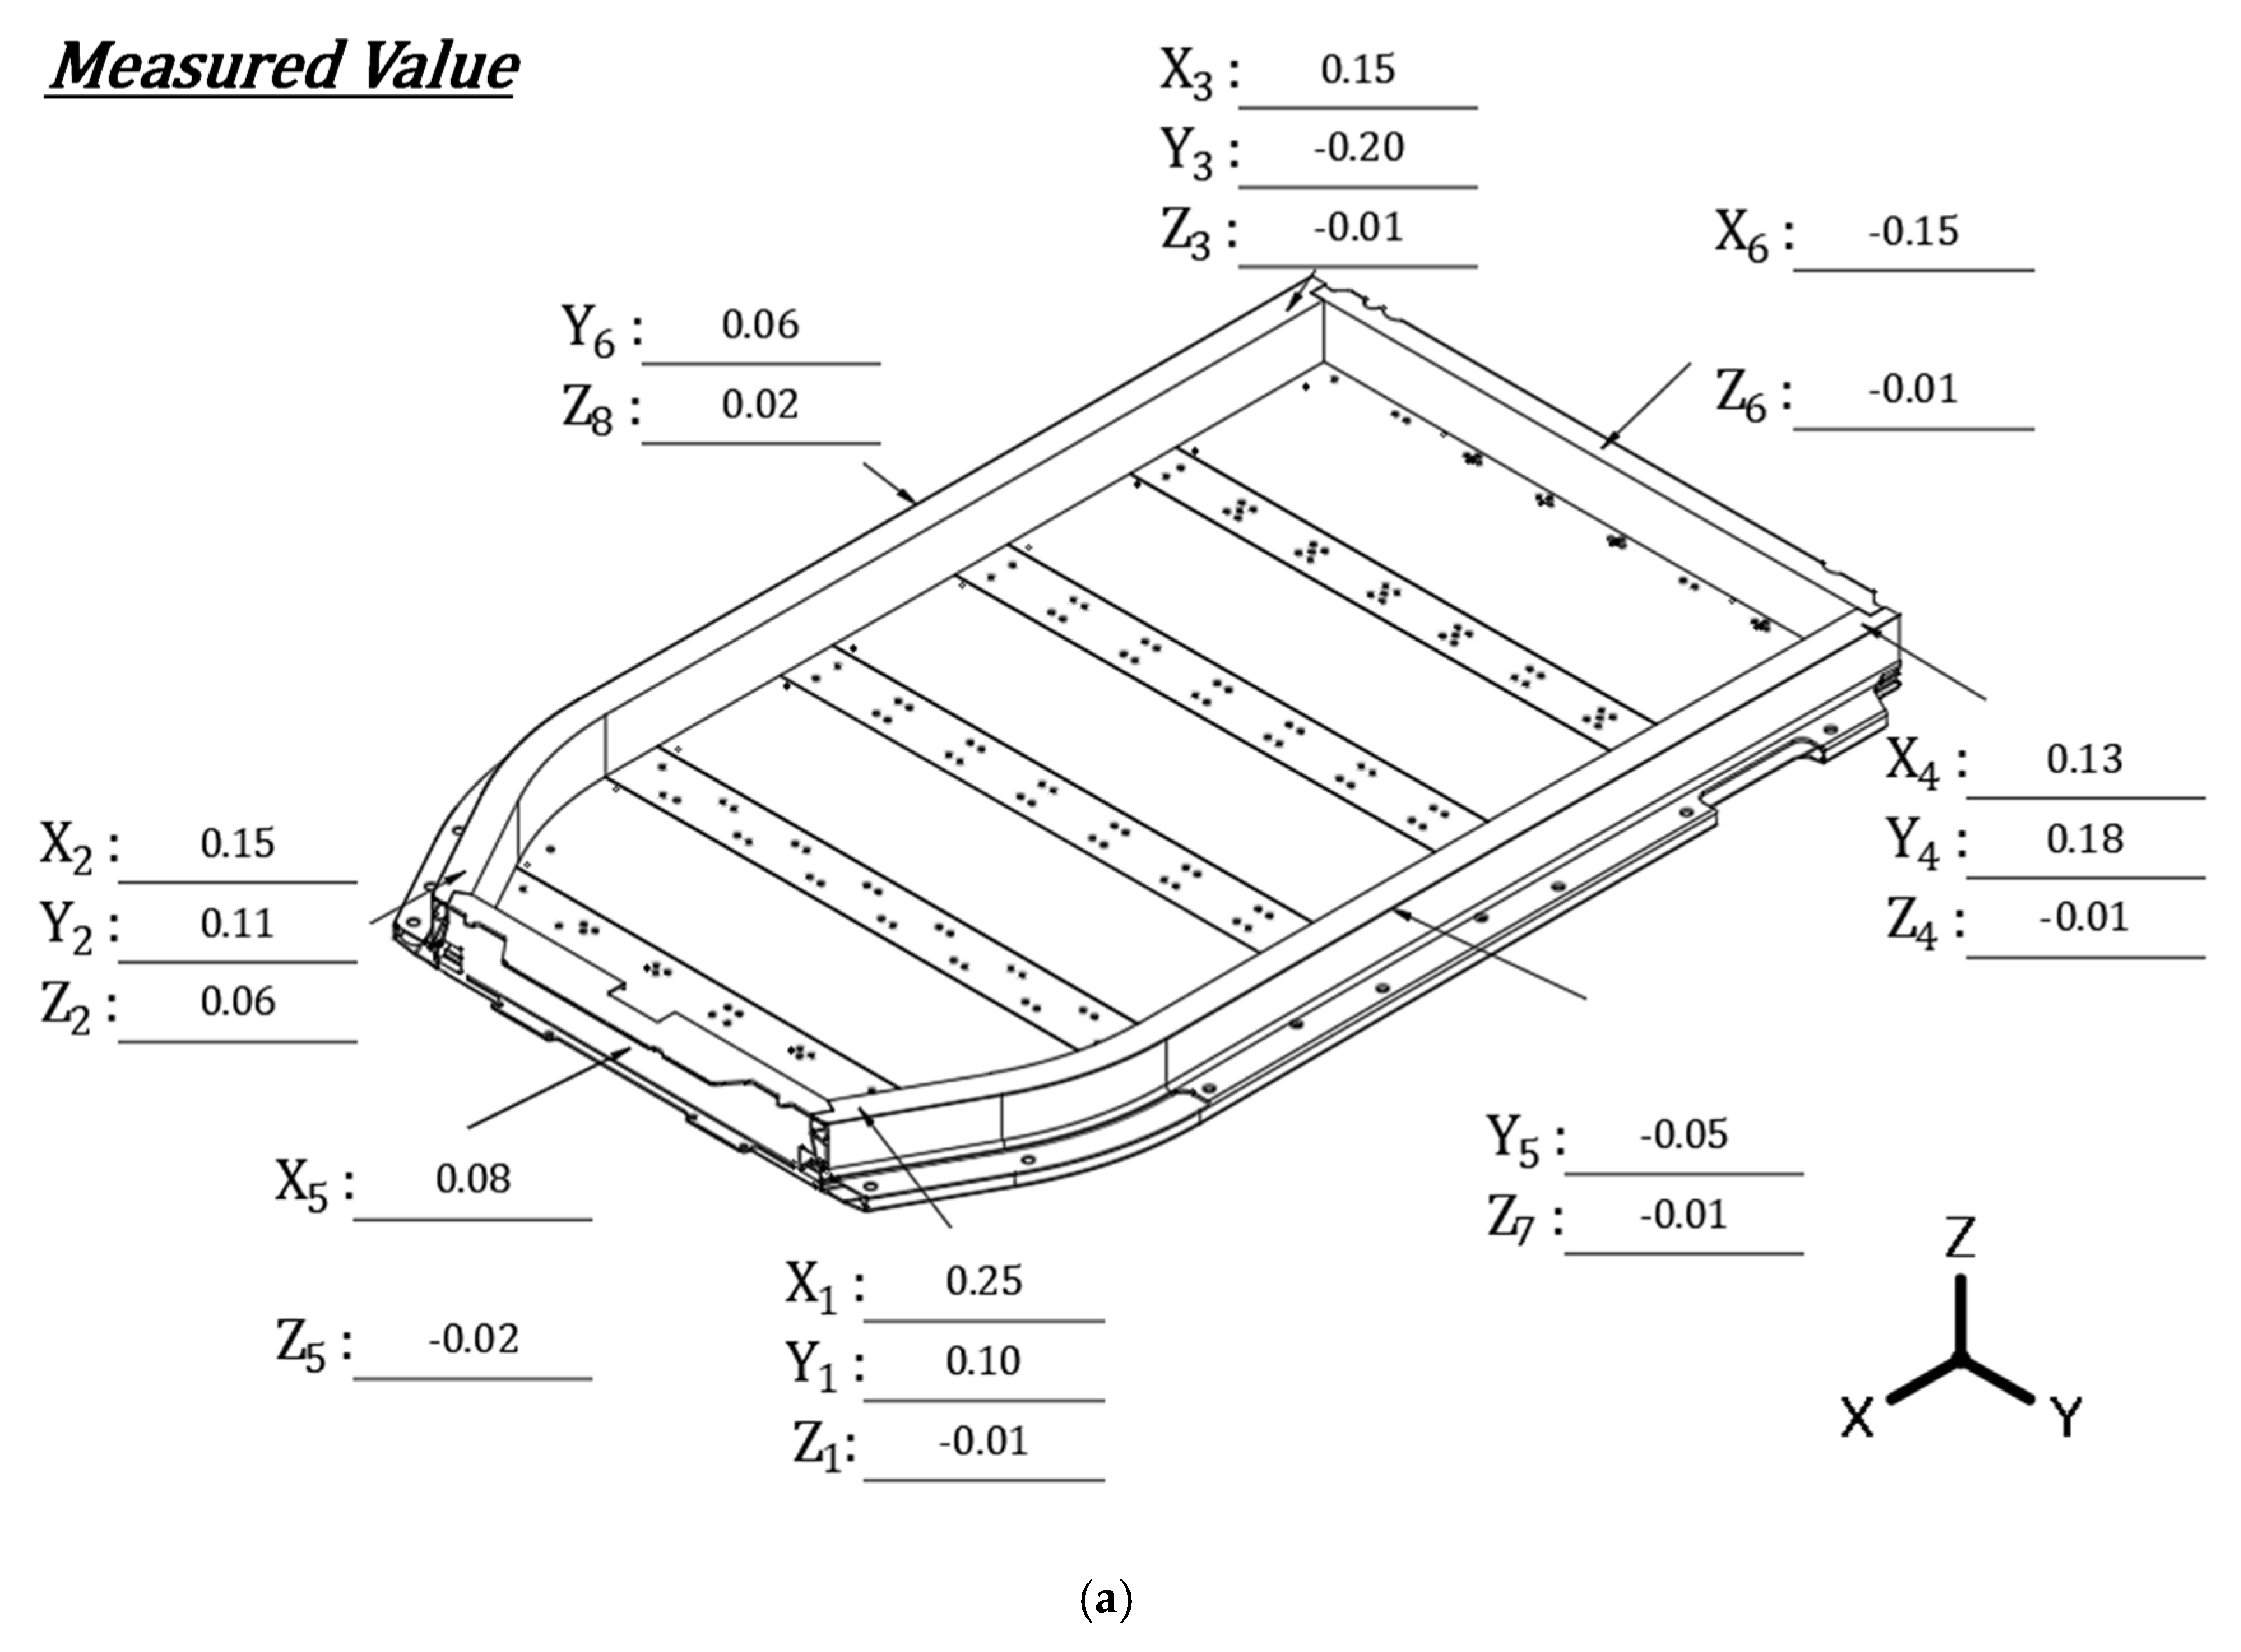
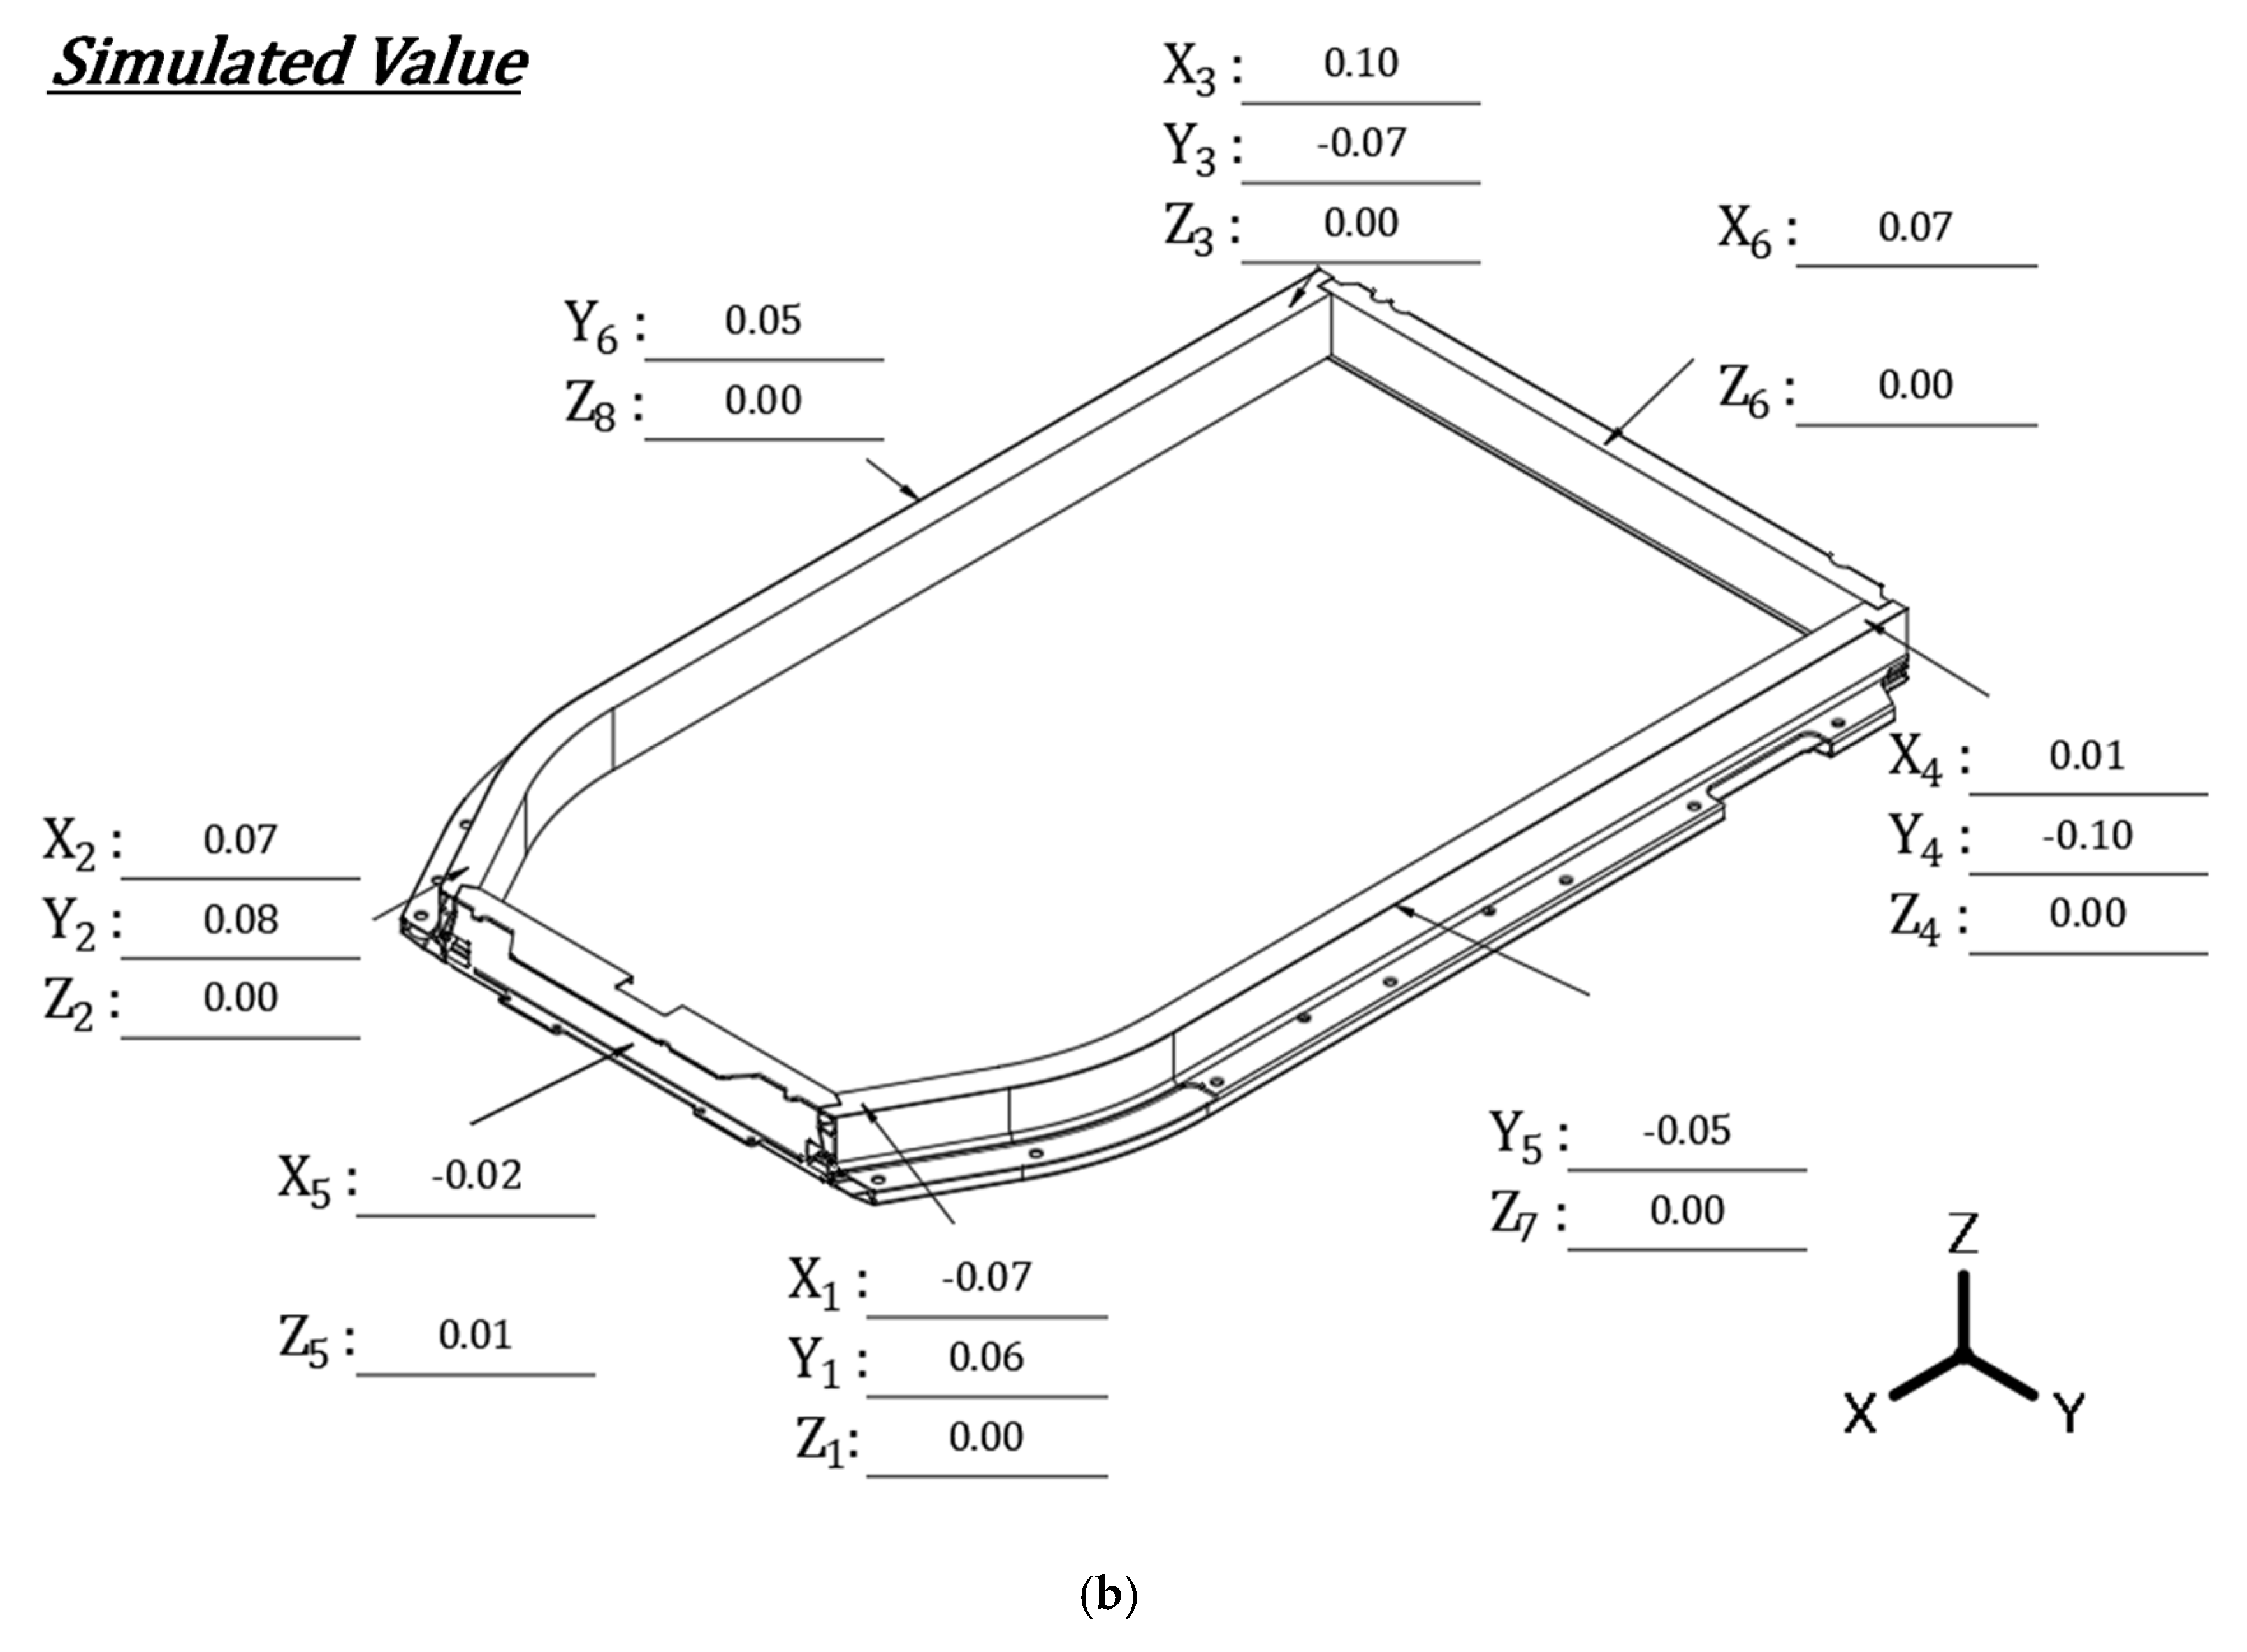
Figure 21a shows the deformation history of the structure during all of the analysis steps. The deformation was purely thermal deformation caused by thermal load, resulting in a range of 1–2 mm during welding, as the downward force of the tool was not considered for analysis. Figure 21b shows the actual deformation in the side frame measured during welding, and the maximum measurement was 1.9 mm. Even though deformation caused by downward force was not considered, the results showed a small margin of errors, and the final deformation after cooling was expected to be within ±0.1 mm. Figure 22 shows the final measured and simulated deformation values after cooling for each direction at each point and Table 11 shows the differences between these values.
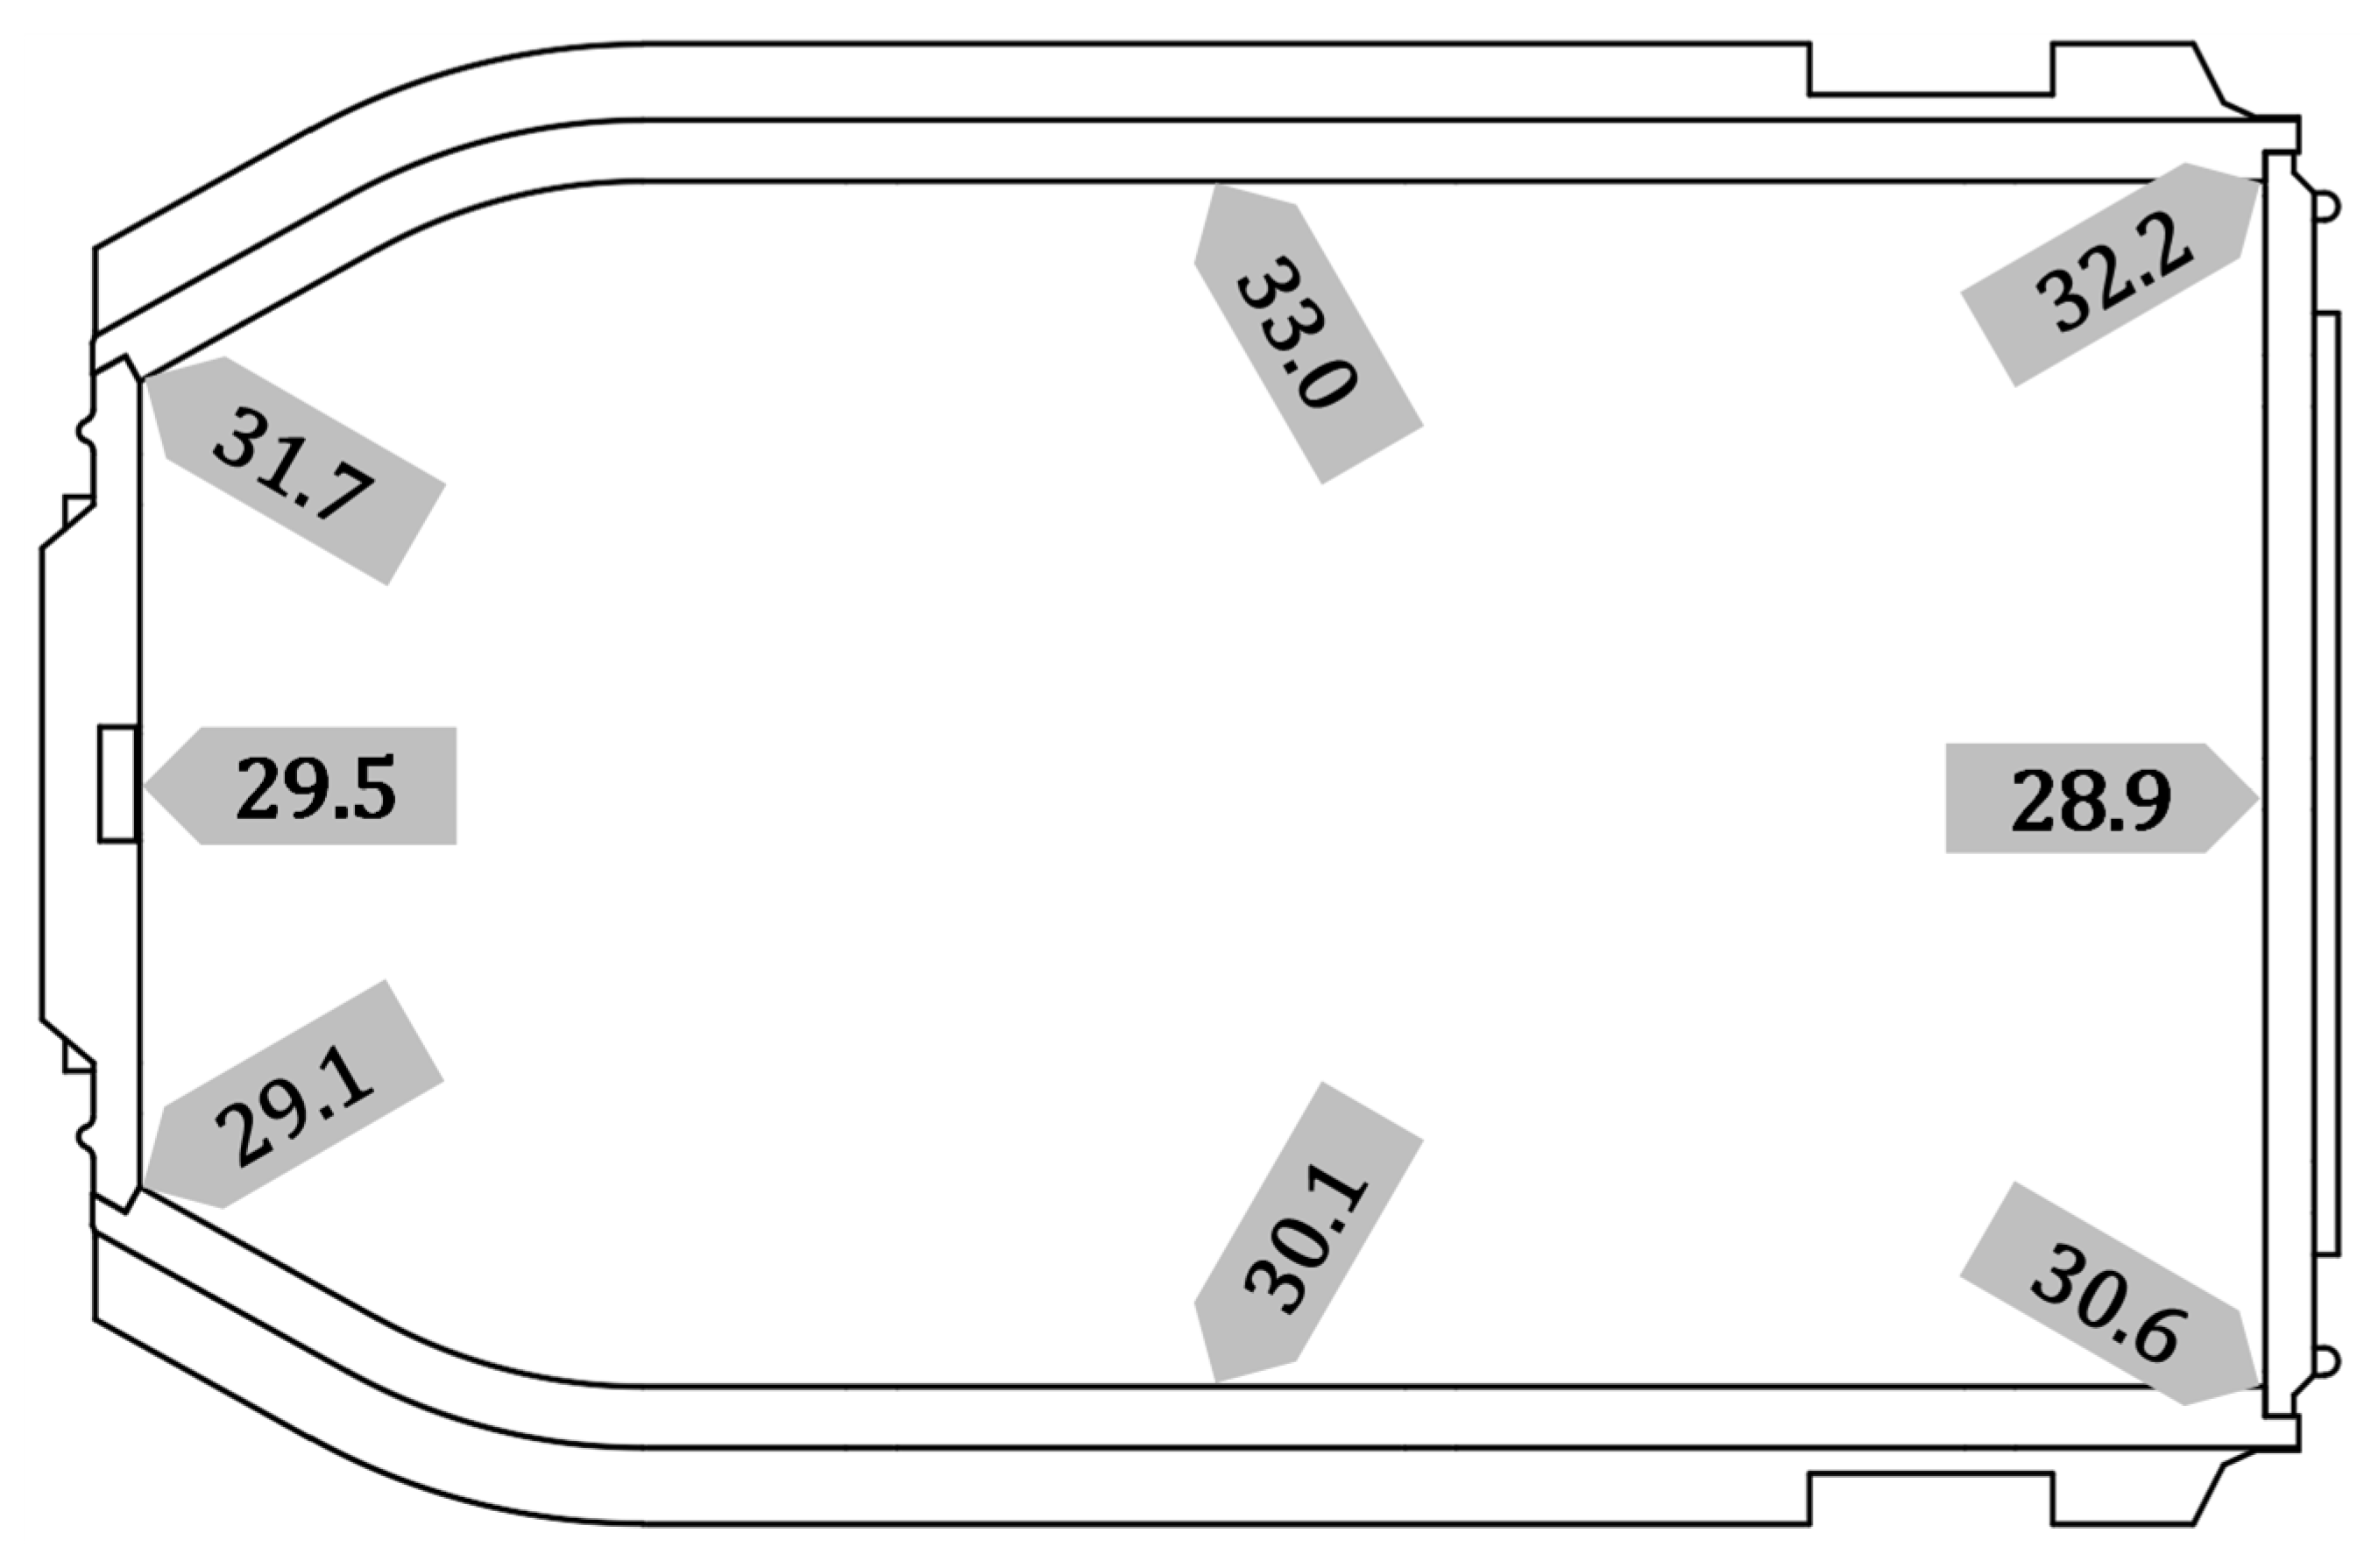
As shown in Figure 23, residual stresses of around 30 MPa were distributed near the welding center line. This was about 12% of the yield strength of aluminum (250 MPa).

7. Conclusions

The purpose of this study was to optimize the production process by predicting the deformation and residual stress when FSW is applied to fillet joints in the production process of electric vehicle battery frames and to improve the quality and mechanical performance of the product. The main findings are as follows:
  • In the case of butt FSW, the optimum process for each joining method is the rotational speed of the tool at 2000 RPM and the welding speed of 1000 mm/min. In the case of fillet joint FSW, the rotational speed of the tool was 1200 RPM and the welding speed was 80 mm/min. In the case of fillet joint FSW, it was considered that sufficient frictional heat was generated for stirring only when the welding speed was reduced by more than 10 times compared to butt joint FSW;
  • After friction stir welding (FSW) of the full-frame structure, the final deformation was less than ±0.2 mm, and the residual stress was about 30 MPa. As for deformation tendency, deformation occurred in the length and width directions, but no significant deformation occurred in the height direction. The errors between the measured and analyzed values for deformation were 0.1 mm or less in all of the directions;
  • In the process of specifying the temperature of the heat source, the method of reducing errors through test correlation with the temperature measurement experiment results was effective;
  • Although this study did not conduct comparative experiments on residual stress, the simulation results were considered to be reliable in terms of deformation tendency and similarity. Strength tests were not performed on the welds, but this will be included in additional studies as durability tests on the structure are planned in the future.
In this study, it was impossible to apply the T-joint FSW method, which was previously studied to perform FSW on the fillet joint, due to the designed cross-sectional structure. The tool was tilted at an angle of 45 degrees, and then fillet joint FSW was performed on the actual structure using a specially manufactured angle head. This attempt was successful, and the deformation and residual stress could be predicted and verified through finite element method analysis. We hope that this study will help reduce costs and time by predicting deformation and stress in advance through simulations when performing similar processes (such as fillet FSW on aluminum extrusions) and assist other studies related to FSW in the future.

Author Contributions

Conceptualization, S.K. and H.K.; methodology, S.K. and J.K.; software, C.L. and H.K.; validation, H.K. and Y.J.; formal analysis, S.K. and J.K.; investigation, H.K. and K.L.; resources, S.K. and K.L.; data curation, S.K.; writing—original draft preparation, S.K.; writing—review and editing, S.K. and K.L.; visualization, H.K.; supervision, S.K.; project administration, S.K.; funding acquisition, S.K. All authors have read and agreed to the published version of the manuscript.

Funding

This research was supported by the Ministry of Trade, Industry & Energy (MOTIE), Korea Institute for Advancement of Technology (KIAT) through the Encouragement Program for The Industries of Economic Cooperation Region (No. P0002251).

Conflicts of Interest

The authors declare no conflict of interest.

References

  1. Thomas, W.M.; Kallee, S.W.; Staines, D.G.; Oakley, P.J. Friction Stir Welding—Process Variants and Developments in the Automotive Industry. SAE Tech. Pap. Ser. 2006, 3–6. [Google Scholar] [CrossRef]
  2. Shankar, S.; Vilaça, P.; Dash, P.; Chattopadhyaya, S.; Hloch, S. Joint strength evaluation of friction stir welded Al-Cu dissimilar alloys. Measurement 2019, 146, 892–902. [Google Scholar] [CrossRef]
  3. Lee, C.G.; Kim, S.J. Development and Application of Friction Stir Welding Technology. Trans. Mater. Process. 2003, 12, 529–535. [Google Scholar] [CrossRef] [Green Version]
  4. Meyghani, B.; Awang, M. A Comparison Between the Flat and the Curved Friction Stir Welding (FSW) hermomechanical Behaviour. Arch. Comput. Methods Eng. 2019, 1–14. [Google Scholar]
  5. Buffa, G.; Fratini, L.; Arregi, B.; Peñalva, M. A new friction stir welding based technique for corner fillet joints: Experimental and numerical study. Int. J. Mater. Form. 2010, 3, 1039–1042. [Google Scholar] [CrossRef]
  6. Sabry, I.; El-Kassas, A.M.; Mourad, A.-H.I.; Thekkuden, D.T.; Qudeiri, J. Friction Stir Welding of T-Joints: Experimental and Statistical Analysis. J. Manuf. Mater. Process. 2019, 3, 38. [Google Scholar] [CrossRef] [Green Version]
  7. Salloomi, K.N. Fully coupled thermomechanical simulation of friction stir welding of aluminum 6061-T6 alloy T-joint. J. Manuf. Process. 2019, 45, 746–754. [Google Scholar] [CrossRef]
  8. Setiawan, W.; Darmadi, D.B.; Suprapto, W.; Soenoko, R.; Tri, S.G. Varied Corner Joint Design Alumuinum 6061 using Friction Stir Welding. IOP Conf. Ser. Mater. Sci. Eng. 2019, 494, 1–17. [Google Scholar] [CrossRef]
  9. Kim, Y.-G.; In-Ju, K. Effect of welding parameter on friction stir-weldability of high-strength automotive steel. J. Korean Soc. Mech. Technol. 2015, 17, 267–272. [Google Scholar] [CrossRef]
  10. Kim, Y.-G.; In-Ju, K. Weldability of Aluminum Die Casting Alloy by FSW. J. Korean Soc. Mech. Technol. 2014, 16, 1463–1467. [Google Scholar] [CrossRef]
  11. Reynolds, A.P.; Khandkar, Z.; Tang, W.; Khan, J.; Long, T. Utility of Relatively Simple Models for Understanding Process Parameter Effects on FSW. Mater. Sci. Forum 2003, 426, 2959–2964. [Google Scholar] [CrossRef]
  12. Fraser, K.A.; St-Georges, L.; Kiss, L.I. Optimization of Friction Stir Welding Tool Advance Speed via Monte-Carlo Simulation of the Friction Stir Welding Process. Materials 2014, 7, 3435–3452. [Google Scholar] [CrossRef] [Green Version]
  13. Elizabeth, H.; Santiago, E.; Juan, E.G. FSW process map development aluminum alloys: Nondestructive testing and model-based approach. In Proceedings of the 12th International Symposium on Friction Stir Welding, Chicoutimi, QC, Canada, 26–28 June 2018. [Google Scholar]
  14. Kang, S.; Kim, J.; Jang, Y.; Lee, K. Welding Deformation Analysis, Using an Inherent Strain Method for Friction Stir Welded Electric Vehicle Aluminum Battery Housing, Considering Productivity. Appl. Sci. 2019, 9, 3848. [Google Scholar] [CrossRef] [Green Version]
  15. Naterer, G.F. Advanced Heat Transfer; CRC Press: Cleveland, OH, USA, 2018. [Google Scholar]
  16. Hyoe, T.; Colegrove, P.A.; Shercliff, H.R. Friction Stir Welding and Processing II, TMS Symposium Proceedings 2003, A Publication of TMS.
Figure 1. Principle of friction stir welding (FSW) process: (a) Description of FSW progress; (b) general design shape of FSW tool.
Applsci 10 09103 g001
Figure 2. Types of FSW joint: (a) Butt FSW; (b) T-joint FSW; (c) fillet joint FSW.
Applsci 10 09103 g002
Figure 3. Application type of fillet joint FSW.
Applsci 10 09103 g003
Figure 4. Full schematic diagram of fillet joint FSW for main battery frame.
Applsci 10 09103 g004
Figure 5. Fillet joint FSW equipment: (a) Actual full-frame structure set; (b) actual fillet FSW tool set.
Applsci 10 09103 g005
Figure 6. Flow chart of research procedure.
Applsci 10 09103 g006
Figure 7. Area where frictional heat is generated by FSW method: (a) Major geometry of the tool; (b) friction area of tool in butt FSW; (c) friction area of tool in fillet joint FSW.
Applsci 10 09103 g007
Figure 8. Experiment models: (a) Butt joint; (b) fillet joint.
Applsci 10 09103 g008
Figure 9. Experiment of temperature measurement: (a) Measuring equipment; (b) measuring point of butt FSW; (c) measuring point of fillet FSW.
Applsci 10 09103 g009
Figure 10. Pre-process of heat transfer analysis for the specimen unit.
Applsci 10 09103 g010
Figure 11. Heat transfer analysis results and experiment results: (a) Butt FSW; (b) fillet joint FSW.
Applsci 10 09103 g011
Figure 12. AL6063-T5 material properties required for heat transfer analysis: (a) Density; (b) specific heat; (c) thermal conductivity.
Applsci 10 09103 g012
Figure 13. Simplify the design geometry of the full-frame structure.
Applsci 10 09103 g013
Figure 14. Mesh for heat transfer analysis.
Applsci 10 09103 g014
Figure 15. Pre-process of heat transfer analysis: (a) FSW sequence; (b) method to enter temperature in the welding center; (c) moving method of heat source.
Applsci 10 09103 g015aApplsci 10 09103 g015b
Figure 16. Temperature distribution history of the full-frame structure.
Applsci 10 09103 g016
Figure 17. AL6063-T5 material properties required for thermal elasto-plastic analysis: (a) Coefficient of thermal expansion; (b) Young’s modulus; (c) yield stress.
Applsci 10 09103 g017
Figure 18. Mesh for thermal elasto-plastic analysis.
Applsci 10 09103 g018
Figure 19. Temperature distribution history of the full-frame structure.
Applsci 10 09103 g019
Figure 20. FSW deformation measurement of actual full-frame structural: (a) Position of dial indicator; (b) measurement direction of deformation.
Applsci 10 09103 g020
Figure 21. FSW deformation: (a) Deformation history result; (b) deformation measured during welding.
Applsci 10 09103 g021aApplsci 10 09103 g021b
Figure 22. Comparative verification of FSW variant: (a) Measured values; (b) simulated values.
Applsci 10 09103 g022aApplsci 10 09103 g022b
Figure 23. Stress distribution [unit: MPa].
Applsci 10 09103 g023
Table 1. Design variables for heat source calculation.
Design ParameterButt Joint Contact AreaFillet Joint Contact AreaRatio
Shoulder106.0 mm258.7 mm255%
Pin Lateral28.3 mm227.0 mm295%
Pin Bottom7.1 mm27.1 mm2100%
Total141.4 mm292.8 mm266%
Table 2. Design variables for heat source calculation.
SymbolUnitDescriptionSymbolUnitDescription
QtW/mm2Total Heat Fluxωrad/secRotation Speed
RSmmRadius of Tool Shoulderη-Welding Efficiency
RPmmRadius of Tool Pinμ-Friction Coefficient
HPMmHeight of Tool PinτPaShear Stress
FNNDownward ForcePPaNormal Pressure
Table 3. Test conditions of butt FSW process.
mm/min6007008009001000
RPM
1600#1#2#3#4#5
1800#6#7#8#9#10
2000#11#12#13#14#15
2200#16#17#18#19#20
2400#21#22#23#24#25
Table 4. Test conditions of fillet FSW process.
mm/min406080
RPM
1000#1#2#3
1200#4#5#6
1400#7#8#9
Table 5. Optimal process condition.
Process ConditionUnitButt FSWFillet Joint FSW
Rotation SpeedRPM20001200
Welding Speedmm/min100080
Table 6. Comparison of maximum displacements in x-direction [mm].
ItemUnitMeasuring Point
Distancemm−35−25−15−1010152535
Experiment°C58.384.1110.7146.1196.1168.388.359.1
Analysis46.872.2132.6194.2194.2132.672.246.8
Deviation%19.814.2−19.8−32.91.021.218.320.9
Table 7. Comparison of maximum displacements in y-direction [mm].
ItemUnitMeasuring Point
Distancemm−50−40−30−304050
Experiment°C58.384.1110.7146.1196.1168.3
Analysis46.872.2132.6194.2194.2132.6
Deviation%19.814.2−19.8−32.91.021.2
Table 8. Mesh properties for heat transfer analysis.
MethodTetrahedrons
Element Size10 mm
Element ShapeTriangle
Number of Nodes142,129
Number of Elements440,287
Table 9. Temperature to enter into full structure analysis.
ItemUnitRange from Welding Center Line
Distancemm−10−5−22510
Temp. derived from the specimen°C323396410408382390
Temp. to enter into the simulation315390410410390315
Table 10. Mesh properties for thermal elasto-plastic analysis.
MethodTetrahedrons
Element SizeSide Frame30 mm
Bottom Frame40 mm
Element ShapeTriangle
Number of Nodes128,986
Number of Elements67,847
Table 11. Comparison of variation between measured and experimental values [unit: mm].
Measured ValueSimulated ValueMean Deviation
XX10.250.070.08
X20.150.07
X30.150.10
X40.130.10
X50.080.02
X60.150.07
YY10.100.060.05
Y20.110.08
Y30.200.07
Y40.180.10
Y50.050.05
Y60.060.05
ZZ10.010.000.02
Z20.060.00
Z30.010.00
Z40.010.00
Z50.020.01
Z60.010.00
Z70.010.00
Z80.020.00
Pubisher’s Note: MDPI stays neutral with regard to jurisdictional claims in published maps and institutional affiliations.