Article

Computer Aided Modeling of Wood Chips Transport by Means of a Belt Conveyor with Use of Discrete Element Method

1
Faculty of Mechanical Engineering, Institute of Machine Design, Poznan University of Technology, Piotrowo 3, PL-60965 Poznan, Poland
2
Department of Biosystems Engineering, Poznan University of Life Sciences, ul. Wojska Polskiego 50, 60-625 Poznan, Poland
3
Faculty of Civil and Transport Engineering, Poznan University of Technology, Piotrowo 3, PL-60965 Poznan, Poland
*
Author to whom correspondence should be addressed.
Appl. Sci. 2020, 10(24), 9091; https://doi.org/10.3390/app10249091
Submission received: 21 November 2020 / Revised: 14 December 2020 / Accepted: 15 December 2020 / Published: 18 December 2020
(This article belongs to the Special Issue AI and IoT in Manufacturing)

Abstract

:
The effectiveness and precision of transporting wood chips on the transport trailer or hopper depends on an inclination angle, a conveyor belt speed, and length. In order to devise a methodology aiding designing and the selection of technical and performance parameters (aiding the settings of conveyor belt sub-assemblies), the authors carried out the simulation tests concerning wood chips transport on the belt conveyor and their outlet. For the purposes of these tests, a simulation model was performed in the Rocky DEM (discrete element method) software in the numerical analysis environment and compared to analytical tests. The tested wood chips were taken from cherry plum branches chipping processes (Prunus cerasifera Ehrh. Beitr. Naturk. 4:17. 1789 (Gartenkalender 4:189-204. 1784)), out of which seven basic fractions were separated, which differed mainly in terms of their diameter from 5 mm to 50 mm and the length of 150 mm. The article presents the results of wood chips ejection distance in the form of the 3D functions of wood chips ejection distance depending on the conveyor belt inclination angle and belt speed. The results are presented for five conveyor belt lengths (1 m, 2 m, 3 m, 4 m, 5 m). The tests also involved the conveyor belt inclination angle in the range from 10° to 50° and the belt velocity in the range from 1 m/s2 to 5 m/s2. The numerical test results demonstrate higher average values of wood chips ejection distance than designated in the analytical model. The average arithmetical difference in the results between the numerical and analytical model is at the level of 13%.

1. Introduction

Wood chippers have various cutting mechanisms. The basic ones include: a cylindrical chipper [1], a drum chipper [2], a disc chipper [3], a hammer chipper [4], or a spiral chipper [5]. Chippers for the industrial production of biomass, with high capacity (indicated in scientific publications on the power range from 130 kW to 900 kW [6]), have the wood chips outlet system based on the forced motion of the cutting mechanism [2,3,7,8,9,10,11]. Chippers used on urban areas for tree care in parks, gardens, and by-road surfaces are low power machines (Figure 1). The main task of their drives is supplying the cutting mechanism with power; whereas wood chips transport is aided by the conveyor belt system (Figure 2). The popular designs of low power chippers (in Europe, due to regulations on exhaust fumes emission, they are equipped with combustion engines with positive ignition with the maximum capacity of 19 kW [12,13]), which is presented in Figure 1, where two out of four designs require the conveyor belt system for loading wood chips. Transport assistance systems are requirements in a flail chipper (Figure 1c) and a cylindrical chipper (Figure 1d and Figure 2), whereas a drum chipper (Figure 1b) and a disc chipper (Figure 1a) do not need any wood chips transport assistance mechanisms. Conveyor belts for wood chips transport used with a wood chipper have an option of adjusting the conveyor belt inclination angle and the belt travel velocity. Furthermore, at the purchase stage, it is possible to select the conveyor belt length. All these parameters are to enable the effective and precise transport of wood chips to the designated place, e.g., to a transport trailer or hopper transported by forklifts. However, the authors notice the lack of tools aiding the selection of such parameters, enabling the precise positioning and selection of drive and conveyor belt settings. This problem is observed at the production stage and during operation.
There are the experimental and simulation tests available in the literature which concern processes using wood chips. They refer primarily to the tests on the raw material as an energy product at the various stages of processing and in various applications. The experimental tests analyze the impact of chips origin due to the calorific value and exhaust fumes emission, e.g., on account of tree species [14], mixture proportions [15], an acquiring method [14,16], a drying method [17], and pollution in the event of wood chips from recycling [18]. There are also the descriptions of the methods of processing wood chips to fuels in the form of ethanol fuel [19] or concentrated pellet [20]. The main group of articles concerning wood chips transport is constituted by studies focused on the description of the delivery chain impact [21,22]. The analysis involves the aspects of transport monitoring [23], delivery costs [24,25], transport means selection (car [26], railway [26], pipeline [27], and maritime [28]). This topic is exceptionally important because as Gałęzia et al. indicates, in 2013, the transport of raw material to the power plant constituted a main cost [29]. The authors notice the lack of simulation tests and experimental tests concerning wood chips transport on conveyor belts, which may aid designing and the selection of conveyor belts for wood chippers.
Among simulation tests related with wood chips, there are process simulations which concern their production, e.g., fragmentation [30], modeling and particle measurement [31]. Another group refers to describing simulations; these are simulations describing wood chip processing, e.g., during compaction [32,33] or combustion [34,35]. Simulation tests also apply to indirect processes connected with wood chips storage [36] and drying [37]. Among the simulation tests conducted on wood chips transport (not referring to the delivery chain analysis), as one of few, Otto et al. tests from 2019 may be mentioned, which describe wood chips transport with the use of extractors. The tests described contributed to the improvement in the wood chips conveyance effectiveness during loading and unloading processes through the optimization of extractors design to the specification of the material being conveyed [38].
Literature studies indicate that modeling processes using conveyor belts are recognized considerably. The first group of research papers refers to conveyor belt modeling and the material being conveyed, whereas the other one focuses on the trajectory of the material outlet from the conveyor belt. The first group involves works on the measurement and imitation of many phenomena affecting the conveyor belt, e.g., impacts on the transport belt during loading [39,40,41], the mass continuous load on the transport belt [42], the influence of contact forces in the pipe conveyor belt [43,44]. Other simulation tests referred to material transported on the conveyor belt, e.g., in places causing the compaction of the mass being transported [45], the distribution of loose materials on the conveyor belt [46], the design of a feeding channel over the conveyor belt for uniform feeding [47,48]. The other main group of tests connected with transport on conveyor belts refers to the material outlet from the conveyor belt. The said studies determined the specifications and trajectories of materials going out from the conveyor belt [49] and compared actual and simulation curves [46,50,51]. Such tests are conducted in order to improve unloading effectiveness [52] and the assessment of the wear and tear condition of the transport system [53]. The tests on the trajectory of material going out from the conveyor belt are conducted mainly for loose materials or granulates, whereas there are no tests carried out for wood chips. The simulation tests of wood chips going out from the conveyor belt may aid designing and the selection of conveyor belts for various applications, but they also may support works connected with sorting the material being fragmented.
Wood chips going out from the conveyor belt have a different size (Figure 3a). The varied size of wood chips is characteristic for, inter alia, a varied weight. Since wood chips going out from the conveyor belt, due to their weight, may, in theory, be ejected at different distances, a conveyor belt outlet may be regarded as a segregation method. After the branches fragmentation by means of a cylindrical chipper, larger branch pieces could be a new product on the market, which would be competitive towards materials used for household fireplaces (Figure 3b,c). Separating thin branches, leaves, and tiny chips allows for sorting a material with more advantageous energy properties [54]. The authors recognized the subject of the segregation simulation of materials with non-spherical particles [55], with a few ingredients [56] or materials with varied geometry [57], and these tests were characteristic for the use of a rotational drum [58]. In other numerical tests, an optical conveyor belt was used, which is technically more advanced and which requires compressed air [59]. On the basis of the literature study conducted, the authors of this paper noticed the lack of tests concerning the segregation of fragmented materials with the use of a conveyor belt outlet.
The summary of the literature review shows that the research on the transport of fragmented materials concerns mainly loose materials or granules. There are no analyzes of the transport of cylindrical chips. The analysis of the transport of wood chips concerns mainly the supply chain of energy material for power plants. The authors noticed the use of discrete element method (DEM) simulation methods only in the work related to the transport of wood chips using extractors. The authors decided to use DEM modeling to analyze the selection of the conveyor belt and its settings during the transport of wood chips and compare them with the analytical model of chip ejection. An advantage of the FEM (Finite Element Method) model is that it takes into account a greater number of variables influencing chip ejection, including material collisions. In addition, the FEM analysis enables the observation of the movement of the chips on the conveyor belt and allows to determine the settings, e.g., belt speed or the inclination angle of the conveyor belt, which will prevent the ejection of the chips due to their back rotation or uncontrolled rebound.
The paper presents the analytical and numerical modeling of wood chips going out from the conveyor belt in the Rocky DEM (discrete element method) software. The selected numerical method is applied for calculating the physical properties of a large number of objects in free movement, e.g., for transporting loose materials, granulates or grains, the particles of any geometry. The discrete element method (DEM) used by Rocky DEM software was proposed by Cundall and Strack [60], which based on Newton’s second law and a proper contact model enables the numerical calculations of single particles motion. In order to designate design and performance guidelines for the advantageous loading of hoppers working with low power chippers, the impact of the conveyor belt inclination angle was tested, along with conveyor belt movement speed and conveyor belt length on the motion trajectory of wood chips from the cylindrical chipper fragmenting branches. In addition, the possibility of segregating wood chips was analyzed in terms of their weight when going out from the conveyor belt. The model devised and the results obtained will be used in designing effective transport systems and selecting technical and operating parameters (inclination angle, belt velocity and conveyor belt length depending on the hopper, i.e., its volume, loading capacity, length, width, and the height of a loading edge).

2. Materials and Methods

The tests included a simulation imitating the conveyor belt adjusted to work with a low power wood chipper (Figure 1); in other words, the conveyor belt was imitated. The conveyor belt width was 400 mm and beams were distributed at the intervals of 300 mm. In order to imitate wood chips transport in real conditions, the transport of wood chips was performed to a hopper with the following dimensions: length 4010 mm, width 2010 mm, and height 500 mm. It was assumed that the hopper base is located at the ground level (Figure 4). Nevertheless, analytical the equations in (1) presented in the paper enable the analysis of loading the hopper at different heights. The parameters changed during the test was conveyor belt length in the range from 1 m to 5 m—with a stroke change every 1 m, an inclination angle in relation to the ground from 10° to 50°—with a change every 10° and conveyor belt velocity from 1 m/s to 5 m/s—with a stroke change every 1 m/s (Figure 5).
The material transported imitated wood chips from the processes of fragmentation by means of a cylindrical chipper (Figure 3). These were wood chips from cherry plum (Prunus cerasifera Ehrh. Beitr. Naturk. 4:17. 1789 (Gartenkalender 4:189-204. 1784)), out of which seven basic fractions were separated with the length of 150 mm, which differed mainly in terms of their diameter from 5 mm to 50 mm. The geometry and dimensions of the wood chips being tested are presented in Figure 6, based on the tests on sample mass with specified geometry, average material density was determined, and it was accepted in the model as 750 kg/m3.
The simulation tests were carried out in Rocky DEM software, enabling the performance of a numerical analysis by means of a discrete element method (DEM). In the present case, the Lagrange model was used in the DEM method, which consists in tracking particles (wood chips) along the coordinates. Generally, it is a meshless method because the volume is not reticulated, while, for the purposes of these studies, the individual particles marked in Figure 6 were divided into surfaces. The detailed amount of surface area (Faces) for each individual particle (A, B, C, D, E, F, G) is summarized in Table 2 in the third column. The simulation starts with placing objects in specific locations and applying initial velocity. The total simulation time was divided into a high number of time intervals, and then, for each single interval, calculations were conducted on each object. Such calculations for a single interval have the following procedure: searching for possible collisions for each object; calculating physical properties for each object; and calculating object dislocation based on the physical properties of objects.
The boundary conditions for the tested model are presented in Table 1, which characterizes the properties of the transported material A—Wood chips (Particles), B—conveyor belt (Belt), and C—belt conveyor frame (Boundary). For the purposes of numerical research, four properties of particles and material were introduced: 1—density, 2—bulk density, 3—young’s modulus, and 4—Poisson’s ratio. It is constituted by static and dynamic friction and restitution coefficient for the correlation rubber–wood and rubber–steel [61,62] (Figure 7). During 10 seconds’ simulation, mixed wood chips were supplied randomly to the conveyor belt in the quantities specified according to Table 2.
The simulation test was repeated in three trials for the selected experiment conditions. The test results are distance intervals in which wood chip samples fell down and average values determined from these intervals.
The analytical calculations defining the wood chips motion distance include a projectile Equation (1). This is appropriate for the assumptions made that a wood chip is ejected from the conveyor belt with constant velocity v and under constant angle α . In the models under tests, a wood chip outlet point is conveyor belt end y o determining the conveyor belt distance from the ground. This equation may be used for determining the wood chip distance of going to the ground and on the surfaces above the ground simulating, e.g., the hopper edges.
y x = y o + x · tan α x 2 · g 2 · v o 2 · c o s 2 α ,
where: y x —wood chipper ejection trajectory (m), y o —distance of the conveyor belt end from the ground (hopper bottom) (m), x—temporary position of the wood chip in relation to the ground (m), α —conveyor belt inclination angle (°), g —force of gravity (m/s2), and y o —wood chip ejection velocity (m/s).

3. Results and Discussion

The analytical test results are presented in Table 2 with consideration of conveyor belt length (1m, 2 m, 3 m, 4 m, 5 m), conveyor belt inclination angle (10°, 20°, 30°, 40°, 50°), and belt velocity (1 m/s, 2 m/s, 3 m/s, 4 m/s, 5 m/s). The analytical model does not provide for the aerodynamic resistance of wood chips; therefore, with such an assumption, each type of wood chips was ejected at the same distance. For the needs of comparing the results of analytical and numerical (simulation) tests from CAD (Computer Aided Design) 3D model of the stand, the conveyor belt end height was determined from the hopper bottom for all five lengths and the inclination angle of the conveyor belt (Table 3). In order to preserve the complete comparability of the analytical and numerical (simulation)test results, the conveyor belt end height was identical.
The simulation test results concerning distance intervals at which wood chips were ejected are presented in Table 4 and Table 5. There are also average values (AVG), minimum values (Min), maximum values (Max), and standard deviation (SD) for three repetition samples. The accepted variables: conveyor belt length (A), conveyor belt inclination angle (B) and belt speeds are the same as for the analytical model. The simulation of correct wood chip transport and outlet from the conveyor belt is presented in Figure 8a, whereas, with higher velocity of the conveyor belt, wood chips are susceptible to the higher probability of wood chips rotation and not reaching the set velocity at the belt conveyor outlet. This contributes to the premature unpredictable dislocation of particles downward the conveyor belt or their uncontrolled side ejection (Figure 8b). Therefore, for the conveyor belt inclination angle of 50° in Table 4 and Table 5, there are no results of the wood chip ejection distance (wood chips fell beyond the conveyor belt and hopper, and it was not possible to determine the ejection distance). This phenomenon occurs for the belt velocity exceeding 3 m/s.
Apart from the analysis of the wood chips ejection distance, there was also a trial conducted concerning the verification of their segregation possibilities. On account of the varied velocity of wood chips ejection v depending on the belt velocity and the geometry of the wood chips being ejected, it was assumed initially that their ejection at various distances is possible, at the same time, the implementation of the wood chips segregation process into various fractions is possible, as well. Nonetheless, as the simulation tests demonstrated, the separation (segregation) of sample wood chips is not possible (Figure 9). The reason for such a state are mutual clashes of particles during ejection (flight) and the clashes and overturns of wood chips in the air, as well as their bumping onto the partitions of a three-chamber sorting box (Figure 9). The sorting box has 3 equal chambers with the dimensions 0.6 m x 0.8 m, and with the edge height of 0.5 m.
The numerical analyses (simulation) of wood chips ejection differ in the distance of wood chips ejection in relation to the analytical analyses. The differences between the numerical simulation and the analytical equation may result from the omission of interactions between the particles (in the analytical equation) and the failure to take into account the aerodynamic drag in the simulation model. In order to compare the distances of wood chips ejection for numerical and analytical analyses, the results are presented on 3D non-linear functions which were generated in Matlab 2015a using the surf (X, Y, Z) function. The function plots the values in matrix Z (Range) as heights above a grid in the x-y plane defined by X (Velocity) and Y (Inclination angle). The color of the surface varies according to the heights specified by Z (Range). Such functions ensure the practical reading of wood chips ejection distance depending on the conveyor belt inclination angle and the travel speed of its belt. The results of wood chips ejection distance depending on the conveyor belt inclination angle and belt velocity for the conveyor belt with the length from 1 m to 5 m are presented in Figure 10, Figure 11, Figure 12, Figure 13 and Figure 14. The results of the numerical analysis indicate that wood chips may be ejected at farther distances than the analytical analyses indicate. In addition, based on the model, it is possible to determine the ranges of belt velocity and conveyor belt inclination angle, at which wood chips ejection is hindered or prevented due to their motion downward the conveyor belt or uncontrolled side ejection beyond the conveyor belt. An average arithmetical difference in the results between the numerical (simulation) and analytical modeling of wood chips ejection distance is 13%, whereas a trend is observed that, as the conveyor belt inclination angle increases, a difference in the results between the numerical (simulation) model and the analytical model increases, as well. It may be also noticed that the most consistent results between the numerical (simulation) model and the analytical model are for the belt velocity of 1 m/s, which is the lowest speed accepted in the tests; similar results were obtained in the study focused on the transport of polyethylene granulate and corn grains [51].
The numerical analyses allowed for determining which conveyor set values are most appropriate for the central ejection of wood chips to the hipper modeled in the software, whereas the comparison of analytical and numerical results allowed for determining the accuracy of simulation tests in Rocky DEM software in relation to numerical analyses, where an average arithmetical difference was 13%. Furthermore, the most appropriate technical parameters were selected for the belt conveyor, which for the belt velocity range from 2 to 3 m/s, with the conveyor length from 2 to 4 m and belt inclination within the range from 20° to 40°. Similar results for belt velocity were obtained for corn transport by Hastie and Wypych [51]. While striving for the optimization of the setting parameters of the belt conveyor, it may be stated that for higher belt velocity, it is necessary to apply lower inclination and the other way round—for higher inclination—lower speed of belt travel is required. In addition, the obtained test results demonstrated that, with the inclination settings of 50° and belt velocity of 5 m/s, the particles did not remain on the conveyor, but they fell out to the sides or accumulated in the bottom part of the machine, which did not guarantee a proper transport process.

4. Conclusions

Modeling the transport processes for wood chips, and in particular their ejection, is an important aspect in terms of loading transport trailers and hoppers. Setting parameters, such as belt velocity and conveyor belt inclination angle, may determine the wood chips ejection distance. The 3D functions of wood chips ejection distance, prepared in this article, depending on the conveyor belt inclination angle and belt velocity, may help users and designers in selecting proper conveyor belt settings. A correctly selected conveyor belt setting is significant because the wood chips tested are often used to clean urban green areas, and throwing wood chips beyond their target storage site adds more work. The analytical and numerical test results differ on average arithmetically by 13%. The results of numerical (simulation) tests are characteristic for higher values of wood chips ejection for the same settings. Moreover, the numerical model demonstrated the ranges of belt velocity and conveyor belt inclination angles for which wood chips transport is hindered or prevented. The other parameter verified in the simulation tests was the possibility of wood chips segregation due to their geometrical dimensions and weight. Nevertheless, the simulation tests demonstrated that segregation resulting from the distance of the ejected wood chips of a varied fraction is not possible. Wood chips mixed with one another as early as at the ejection stage and in the air, thus preventing the assumed segregation. A further research direction is performing the actual tests and comparing them with the simulation test results. The tests carried out on the development of conveyor belt systems are still an up-to-date research subject, e.g., in the scope of improving work reliability [63], recognizing damage [64], limiting transport energy intensity [65], increasing usage safety [66,67,68], or testing the mechanical properties of transport belts made of innovative materials [69,70].

Author Contributions

Conceptualization, Ł.W., Ł.G.; methodology Ł.G., Ł.W.; software, Ł.G., K.K.; validation Ł.G., Ł.W., M.K., K.K., T.S.Z.; formal analysis, Ł.G., Ł.W., M.K.; investigation, Ł.W., Ł.G., M.K.; resources, Ł.W., M.K.; data curation, Ł.G., Ł.W., K.K., T.S.Z.; writing—original draft preparation, Ł.G., Ł.W., M.K.; writing—review and editing, M.K.; visualization, Ł.G., M.K., Ł.W.; supervision, Ł.G., Ł.W., K.K.; project administration, Ł.G., Ł.W.; funding acquisition, Ł.W. All authors have read and agreed to the published version of the manuscript.

Funding

Research was performed as part of the project “Interdisciplinary Dean’s Grant (IDG) of Poznan University of Technology” determined in the subject for the 2020 year–air quality in Poznan and how to improve it. Project title: “Design and research of mobile machines chipping wastes from urban agriculture processes for innovative construction solutions limiting the impact on the natural environment and machine operators” (33/32/SIGR/3334) financed by the Poznan University of Technology.

Conflicts of Interest

The authors declare no conflict of interest.

References

  1. Warguła, Ł.; Kukla, M.; Krawiec, P.; Wieczorek, B. Impact of Number of Operators and Distance to Branch Piles on Woodchipper Operation. Forests 2020, 11, 598. [Google Scholar] [CrossRef]
  2. Spinelli, R.; Eliasson, L.; Magagnotti, N. Value retention, service life, use intensity and long-term productivity of wood chippers as obtained from contractor records. Forests 2017, 8, 503. [Google Scholar]
  3. McEwan, A.; Brink, M.; Spinelli, R. Efficiency of different machine layouts for chain flail delimbing, debarking and chipping. Forests 2019, 10, 126. [Google Scholar] [CrossRef] [Green Version]
  4. Manzone, M.; Balsari, P. Productivity and woodchip quality of different chippers during poplar plantationharvesting. Biomass Bioenergy 2015, 83, 278–283. [Google Scholar] [CrossRef] [Green Version]
  5. Kuptz, D.; Hartmann, H. Throughput rate and energy consumption during wood chip production in relationto raw material, chipper type and machine setting. In Proceedings of the 22nd European Biomass Conferenceand Exhibition, Hamburg, Germany, 23–26 June 2014. [Google Scholar]
  6. Warguła, Ł.; Kukla, M.; Krawiec, P.; Wieczorek, B. Reduction in Operating Costs and Environmental Impact Consisting in the Modernization of the Low-Power Cylindrical Wood Chipper Power Unit by Using Alternative Fuel. Energies 2020, 13, 2995. [Google Scholar] [CrossRef]
  7. Pochi, D.; Civitarese, V.; Fanigliulo, R.; Spinelli, R.; Pari, L. Effect of poplar fuel wood storage on chipping performance. Fuel Process. Technol. 2015, 134, 116–121. [Google Scholar] [CrossRef]
  8. Ghaffariyan, M.R.; Sessions, J.; Brown, M. Evaluating productivity, cost, chip quality and biomass recovery for a mobile chipper in Australian roadside chipping operations. J. For. Sci. 2012, 58, 530–535. [Google Scholar] [CrossRef] [Green Version]
  9. Irdla, M.; Padari, A.; Kurvits, V.; Muiste, P. The chipping cost of wood raw material for fuel in Estonian conditions. For. Stud. 2017, 66, 65–74. [Google Scholar] [CrossRef] [Green Version]
  10. Mihelič, M.; Spinelli, R.; Poje, A. Production of wood chips from logging residue under space-constrained conditions. Croat. J. For. Eng. J. Theory Appl. For. Eng. 2018, 39, 223–232. [Google Scholar]
  11. Colantoni, A.; Mazzocchi, F.; Laurendi, V.; Grigolato, S.; Monarca, F.; Monarca, D.; Cecchini, M. Innovative solution for reducing the run-down time of the chipper disc using a brake clamp device. Agriculture 2017, 7, 71. [Google Scholar] [CrossRef] [Green Version]
  12. Warguła, Ł.; Kukla, M.; Lijewski, P.; Dobrzyński, M.; Markiewicz, F. Influence of Innovative Woodchipper Speed Control Systems on Exhaust Gas Emissions and Fuel Consumption in Urban Areas. Energies 2020, 13, 3330. [Google Scholar] [CrossRef]
  13. Regulation (EU). On Requirements for Emission Limit Values of Gaseous and Particulate Pollutants and Type-approval with Respect to Internal Combustion Engines for Mobile Machines Non-road, Amending Regulations (EU) No 1024/2012 and (EU) No 167/2013 and Amending and Repealing Directive 97/68/WE. No2016/1628 of the European Parliament and of the Council of 14 September 2016. Off. J. Eur. Union 2016, L252, 53–117. [Google Scholar]
  14. Pecenka, R.; Lenz, H.; Jekayinfa, S.O.; Hoffmann, T. Influence of Tree Species, Harvesting Method and Storage on Energy Demand and Wood Chip Quality When Chipping Poplar, Willow and Black Locust. Agriculture 2020, 10, 116. [Google Scholar] [CrossRef] [Green Version]
  15. Plankenbühler, T.; Kolb, S.; Grümer, F.; Müller, D.; Karl, J. Image-Based Model for Assessment of Wood Chip Quality and Mixture Ratios. Processes 2020, 8, 728. [Google Scholar] [CrossRef]
  16. Choi, Y.-S.; Cho, M.-J.; Paik, S.-H.; Mun, H.-S.; Kim, D.-H.; Han, S.-K.; Oh, J.-H. Factors Affecting the Chipping Operation Based on the Screen Size of the Drum Chipper. Forests 2019, 10, 1029. [Google Scholar] [CrossRef] [Green Version]
  17. Del Giudice, A.; Acampora, A.; Santangelo, E.; Pari, L.; Bergonzoli, S.; Guerriero, E.; Petracchini, F.; Torre, M.; Paolini, V.; Gallucci, F. Wood Chip Drying through the Using of a Mobile Rotary Dryer. Energies 2019, 12, 1590. [Google Scholar]
  18. Oveisi, E.; Sokhansanj, S.; Lau, A.; Lim, J.; Bi, X.; Preto, F.; Mui, C. Characterization of Recycled Wood Chips, Syngas Yield, and Tar Formation in an Industrial Updraft Gasifier. Environments 2018, 5, 84. [Google Scholar] [CrossRef] [Green Version]
  19. Neupane, B.; Halog, A.; Dhungel, S. Attributional life cycle assessment of woodchips for bioethanol production. J. Clean. Prod. 2011, 19, 733–741. [Google Scholar] [CrossRef]
  20. Malujda, I.; Talaśka, K. Testing of the shear strength of compressed material at increased temperature. In Proceedings of the World Congress on Engineering—WCE 2011, Imperial College, London, London, UK, 6–8 July 2011. [Google Scholar]
  21. Windisch, J.; Väätäinen, K.; Anttila, P.; Nivala, M.; Laitila, J.; Asikainen, A.; Sikanen, L. Discrete-event simulation of an information-based raw material allocation process for increasing the efficiency of an energy wood supply chain. Appl. Energy 2015, 149, 315–325. [Google Scholar] [CrossRef]
  22. Stampfer, K.; Kanzian, C. Current state and development possibilities of wood chip supply chains in Austria. Croat. J. For. Eng. J. Theory Appl. For. Eng. 2006, 27, 135–145. [Google Scholar]
  23. Holzleitner, F.; Kanzian, C.; Höller, N. Monitoring the chipping and transportation of wood fuels with a fleet management system. Silva Fenn. 2013, 47, 1–11. [Google Scholar] [CrossRef] [Green Version]
  24. Möller, B.; Nielsen, P.S. Analysing transport costs of Danish forest wood chip resources by means of continuous cost surfaces. Biomass Bioenergy 2007, 31, 291–298. [Google Scholar] [CrossRef]
  25. Searcy, E.; Flynn, P.; Ghafoori, E.; Kumar, A. The relative cost of biomass energy transport. Appl. Biochem. Biotechnol. 2007, 137, 639–652. [Google Scholar] [PubMed]
  26. Mahmudi, H.; Flynn, P.C. Rail vs truck transport of biomass. Appl. Biochem. Biotechnol. 2006, 129–132, 88–103. [Google Scholar] [CrossRef]
  27. Kumar, A.; Cameron, J.B.; Flynn, P.C. Pipeline transport of biomass. In Proceedings of the Twenty-Fifth Symposium on Biotechnology for Fuels and Chemicals Held, Breckenridge, CO, USA, 4–7 May 2003; pp. 27–39. [Google Scholar]
  28. Svedberg, U.; Petrini, C.; Johanson, G. Oxygen depletion and formation of toxic gases following sea transportation of logs and wood chips. Ann. Occup. Hyg. 2009, 53, 779–787. [Google Scholar]
  29. Gałęzia, T. Energy balance and time-consumption of selected components in technological chain of forest biomass harvesting. Sylwan 2013, 157, 419–424. [Google Scholar]
  30. Krajnc, M.; Dolsak, B. Computer and experimental simulation of biomass production using drum chipper. Int. J. Simul. Model. 2013, 12, 39–49. [Google Scholar] [CrossRef]
  31. Labati, R.D.; Genovese, A.; Piuri, V.; Scotti, F. A virtual environment for the simulation of 3D wood strands in multiple view systems for the particle size measurements. In Proceedings of the 2013 IEEE International Conference on Computational Intelligence and Virtual Environments for Measurement Systems and Applications (CIVEMSA), Milan, Italy, 15–17 July 2013; pp. 162–167. [Google Scholar]
  32. Macko, M.; Mroziński, A. Computer Aided Design of Wood Pellet Machines. In International Conference on Computer Aided Engineering; Springer: Cham, Switzerland, 2018; pp. 454–461. [Google Scholar]
  33. Rackl, M.; Top, F.; Molhoek, C.P.; Schott, D.L. Feeding system for wood chips: A DEM study to improve equipment performance. Biomass Bioenergy 2017, 98, 43–52. [Google Scholar] [CrossRef]
  34. Kurz, D.; Schnell, U.; Scheffknecht, G. CFD simulation of wood chip combustion on a grate using an Euler–Euler approach. Combust. Theory Model. 2012, 16, 251–273. [Google Scholar] [CrossRef]
  35. Athanasios, N.; Nikolaos, N.; Nikolaos, M.; Panagiotis, G.; Kakaras, E. Optimization of a log wood boiler through CFD simulation methods. Fuel Process. Technol. 2015, 137, 75–92. [Google Scholar] [CrossRef] [Green Version]
  36. Bedane, A.H.; Afzal, M.T.; Sokhansanj, S. Simulation of temperature and moisture changes during storage of woody biomass owing to weather variability. Biomass Bioenergy 2011, 35, 3147–3151. [Google Scholar] [CrossRef]
  37. Scherer, V.; Mönnigmann, M.; Berner, M.O.; Sudbrock, F. Coupled DEM–CFD simulation of drying wood chips in a rotary drum–Baffle design and model reduction. Fuel 2016, 184, 896–904. [Google Scholar] [CrossRef]
  38. Otto, H.; Zimmermann, A.; Kleiber, M.; Katterfeld, A. Optimization of an orange peel grab for wood chips. Механіка та Машинoбудування 2019, 1, 131–141. [Google Scholar]
  39. Grima, A.; Wypych, P. Discrete element simulation of a conveyor impact-plate transfer: Calibration, validation and scale-up. Aust. Bulk Handl. Rev. 2010, 3, 64–72. [Google Scholar]
  40. Molnar, W.; Nugent, S.; Lindroos, M.; Apostol, M.; Varga, M. Ballistic and numerical simulation of impacting goods on conveyor belt rubber. Polym. Test. 2015, 42, 1–7. [Google Scholar] [CrossRef]
  41. Honus, S.; Bocko, P.; Bouda, T.; Ristović, I.; Vulić, M. The effect of the number of conveyor belt carrying idlers on the failure of an impact place: A failure analysis. Eng. Fail. Anal. 2017, 77, 93–101. [Google Scholar] [CrossRef]
  42. Ilic, D.; Wheeler, C. Measurement and simulation of the bulk solid load on a conveyor belt during transportation. Powder Technol. 2017, 307, 190–202. [Google Scholar] [CrossRef]
  43. Zheng, Q.J.; Xu, M.H.; Chu, K.W.; Pan, R.H.; Yu, A.B. A coupled FEM/DEM model for pipe conveyor systems: Analysis of the contact forces on belt. Powder Technol. 2017, 314, 480–489. [Google Scholar] [CrossRef]
  44. Guo, Y.C.; Wang, S.; Hu, K.; Li, D.Y. Optimization and experimental study of transport section lateral pressure of pipe belt conveyor. Adv. Powder Technol. 2016, 27, 1318–1324. [Google Scholar] [CrossRef]
  45. Göttlich, S.; Hoher, S.; Schindler, P.; Schleper, V.; Verl, A. Modeling, simulation and validation of material flow on conveyor belts. Appl. Math. Model. 2014, 38, 3295–3313. [Google Scholar] [CrossRef]
  46. Rozbroj, J.; Nečas, J.; Gelnar, D.; Hlosta, J.; Zegzulka, J. Validation of movement over a belt conveyor drum. Adv. Sci. Technol. Res. J. 2017, 11, 118–124. [Google Scholar] [CrossRef]
  47. Mascarenhas, F.P.; Mesquita, A.L.A.; Mesquita, A.L.A. Simulation of transfer chute operation using the discrete element method. In Proceedings of the XXXIV Iberian Latin-American Congress on Computational Methods in Engineering Z.J.G.N Del Prado (Editor), ABMEC, Pirenópolis, GO, Brazil, 10–13 November 2013. [Google Scholar]
  48. Dratt, M.; Katterfeld, A. Coupling of FEM and DEM simulations to consider dynamic deformations under particle load. Granul. Matter 2017, 19, 49. [Google Scholar] [CrossRef]
  49. Hastie, D.B.; Wypych, P.W. Experimental validation of particle flow through conveyor transfer hoods via continuum and discrete element methods. Mech. Mater. 2010, 42, 383–394. [Google Scholar] [CrossRef] [Green Version]
  50. Derakhshani, S.M.; Schott, D.L.; Lodewijks, G. Modeling dust liberation at the belt conveyor transfer point with CFD and DEM. In Proceedings of the 11th International Conference on Bulk Materials Storage, Handling and Transportation, ICBMH 2013. Newcastle, Great Britain, 2–4 July 2013; pp. 1–11. [Google Scholar]
  51. Hastie, D.B.; Wypych, P.W. Conveyor belt trajectories-comparing predicted to experimental results. Sci. Technol. 2010, 30, 438–445. [Google Scholar]
  52. Ilic, D.; Wheeler, C.A. Transverse bulk solid behaviour during discharge from troughed belt conveyors. Adv. Powder Technol. 2017, 28, 2410–2430. [Google Scholar] [CrossRef]
  53. Xie, L.; Zhong, W.; Zhang, H.; Yu, A.; Qian, Y.; Situ, Y. Wear process during granular flow transportation in conveyor transfer. Powder Technol. 2016, 288, 65–75. [Google Scholar] [CrossRef]
  54. Jacob, S.; Perez, D.D.S.; Dupont, C.; Commandré, J.M.; Broust, F.; Carriau, A.; Sacco, D. Short rotation forestry feedstock: Influence of particle size segregation on biomass properties. Fuel 2013, 111, 820–828. [Google Scholar] [CrossRef]
  55. Maione, R.; De Richter, S.K.; Mauviel, G.; Wild, G. Axial segregation of a binary mixture in a rotating tumbler with non-spherical particles: Experiments and DEM model validation. Powder Technol. 2017, 306, 120–129. [Google Scholar] [CrossRef]
  56. Maione, R.; De Richter, S.K.; Mauviel, G.; Wild, G. DEM investigation of granular flow and binary mixture segregation in a rotating tumbler: Influence of particle shape and internal baffles. Powder Technol. 2015, 286, 732–739. [Google Scholar] [CrossRef]
  57. Cleary, P.W. DEM prediction of industrial and geophysical particle flows. Particuology 2010, 8, 106–118. [Google Scholar] [CrossRef]
  58. Chand, R.; Khaskheli, M.A.; Qadir, A.; Ge, B.; Shi, Q. Discrete particle simulation of radial segregation in horizontally rotating drum: Effects of drum-length and non-rotating end-plates. Phys. A Stat. Mech. Appl. 2012, 391, 4590–4596. [Google Scholar] [CrossRef]
  59. Pieper, C.; Pfaff, F.; Maier, G.; Kruggel-Emden, H.; Wirtz, S.; Noack, B.; Grum, R.; Scherer, V.; Hanebeck, U.D.; Langle, T.; et al. Numerical modelling of an optical belt sorter using a DEM–CFD approach coupled with particle tracking and comparison with experiments. Powder Technol. 2018, 340, 181–193. [Google Scholar] [CrossRef]
  60. Cundall, P.A.; Strack, O.D.L. A discrete numerical model for granular assemblies. Geotechnique 1979, 29, 47–65. [Google Scholar] [CrossRef]
  61. Homišin, J.; Grega, R.; Kaššay, P.; Fedorko, G.; Molnár, V. Removal of systematic failure of belt conveyor drive by reducing vibrations. Eng. Fail. Anal. 2019, 99, 192–202. [Google Scholar]
  62. Hou, C.; Qiao, T.; Zhang, H.; Pang, Y.; Xiong, X. Multispectral visual detection method for conveyor belt longitudinal tear. Measurement 2019, 143, 246–257. [Google Scholar] [CrossRef]
  63. Yao, Y.; Zhang, B. Influence of the elastic modulus of a conveyor belt on the power allocation of multi-drive conveyors. PLoS ONE 2020, 15, e0235768. [Google Scholar] [CrossRef]
  64. Krawiec, P.; Warguła, Ł.; Dziechciarz, A.; Małozięć, D.; Ondrušová, D. Evaluation of chemical compound emissions during thermal decomposition and combustion of V-belts. Przemysł Chem. 2020, 99, 92–98. [Google Scholar] [CrossRef]
  65. Krawiec, P.; Różański, L.; Czarnecka-Komorowska, D.; Warguła, Ł. Evaluation of the Thermal Stability and Surface Characteristics of Thermoplastic Polyurethane V-Belt. Materials 2020, 13, 1502. [Google Scholar] [CrossRef] [Green Version]
  66. Krawiec, P.; Warguła, Ł.; Małozięć, D.; Kaczmarzyk, P.; Dziechciarz, A.; Czarnecka-Komorowska, D. The Toxicological Testing and Thermal Decomposition of Drive and Transport Belts Made of Thermoplastic Multilayer Polymer Materials. Polymers 2020, 12, 2232. [Google Scholar] [CrossRef]
  67. Wojtkowiak, D.; Talaśka, K. Determination of the effective geometrical features of the piercing punch for polymer composite belts. Int. J. Adv. Manuf. Technol. 2019, 104, 315–332. [Google Scholar] [CrossRef] [Green Version]
  68. Wojtkowiak, D.; Talaśka, K.; Wilczyński, D. Evaluation of the belt punching process efficiency based on the resistance force of the compressed material. Int. J. Adv. Manuf. Technol. 2020, 110, 717–727. [Google Scholar] [CrossRef]
  69. Hastie, D.B. Experimental measurement of the coefficient of restitution of irregular shaped particles impacting on horizontal surfaces. Chem. Eng. Sci. 2013, 101, 828–836. [Google Scholar] [CrossRef]
  70. Coefficients of Restitution. Available online: https://hypertextbook.com/facts/2006/restitution.shtml (accessed on 29 October 2020).
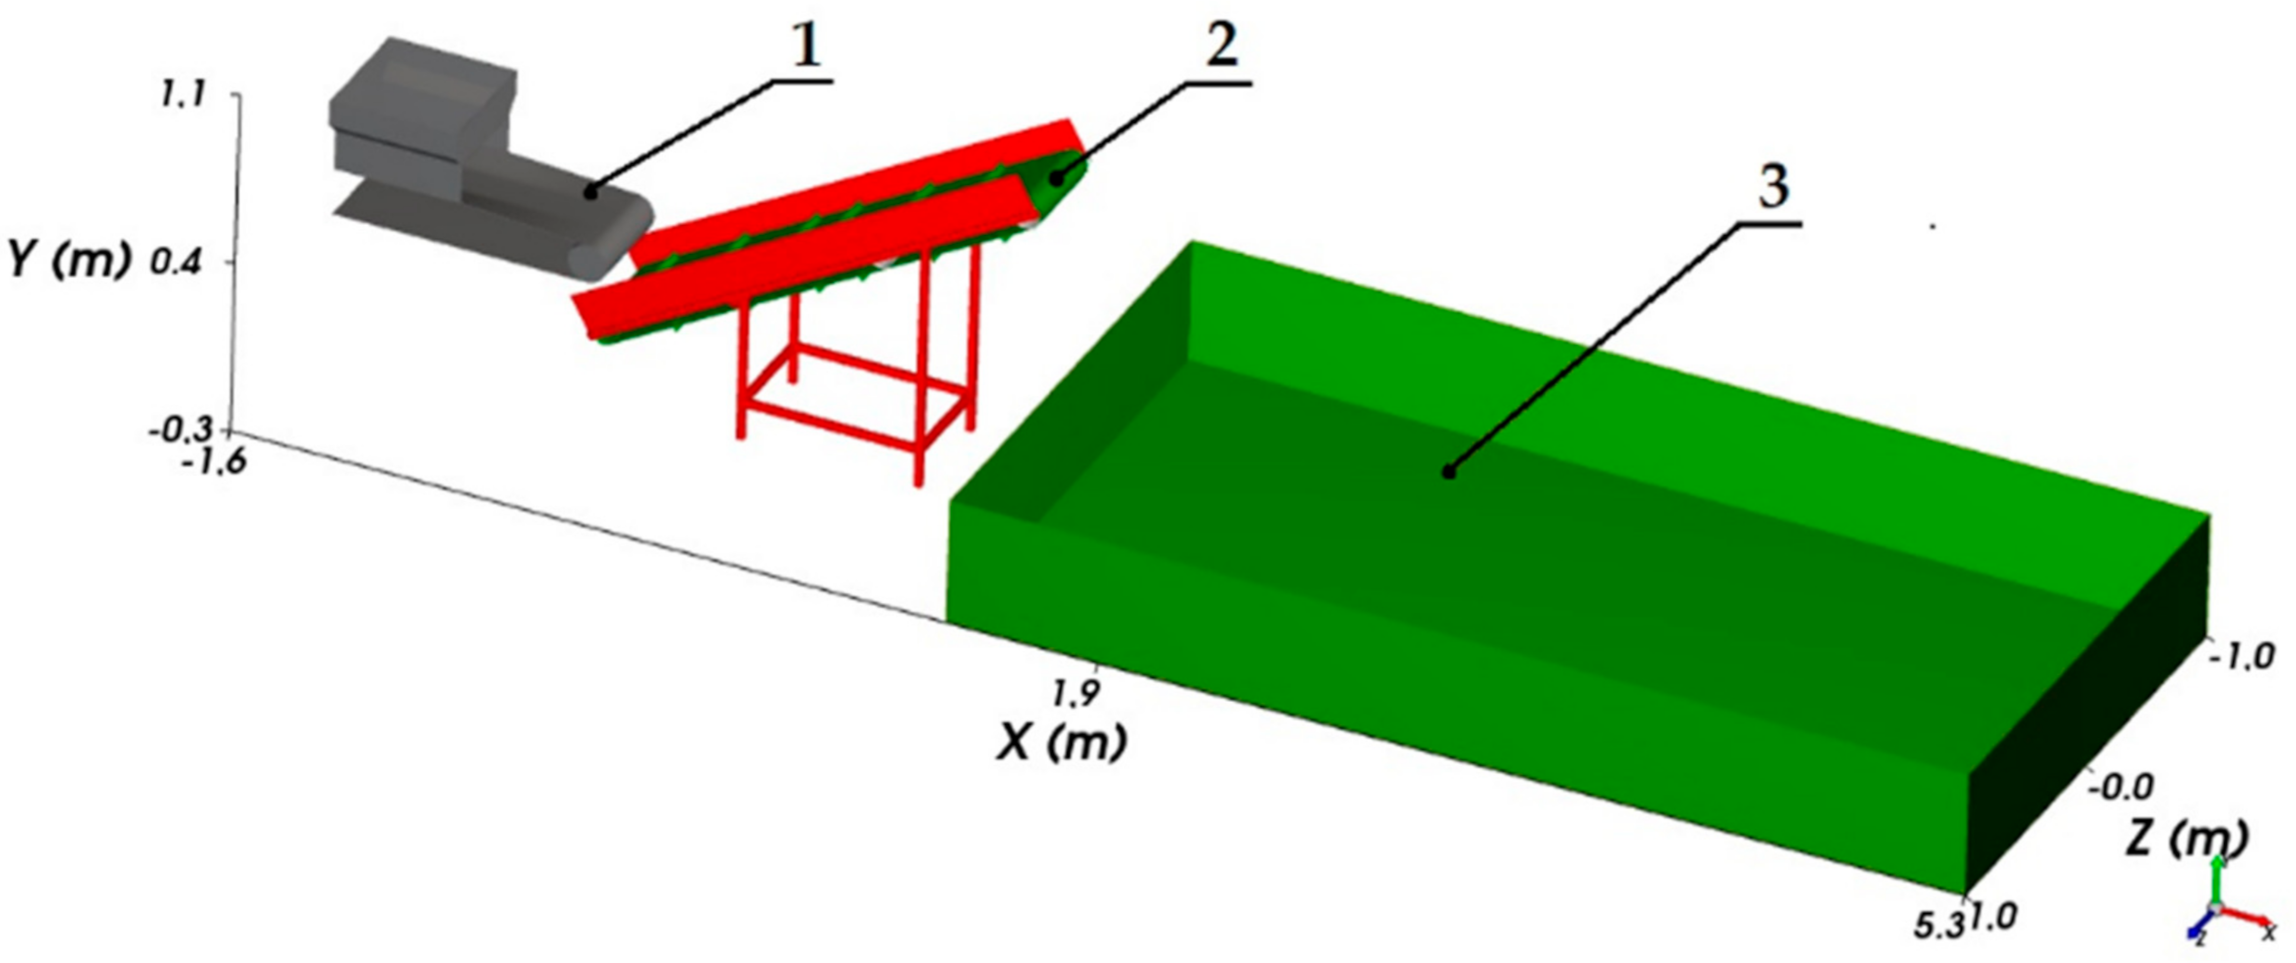
Figure 1. Low power wood chipper: (a) disc chipper, (b) drum chipper, (c) flail chipper, (d) cylindrical chipper.
Applsci 10 09091 g001
Figure 2. Cylindrical wood chipper with the conveyor belt system, where: 1—cutting mechanism, 2—driving unit, 3—inlet channel, 4—outlet channel, 5—conveyor belt, 6—conveyor belt position adjustment system.
Applsci 10 09091 g002
Figure 3. Chipped wood from a cylindrical chipper: (a) mixed, (b) as a commercial product, (c) separated large sizes of wood chips.
Applsci 10 09091 g003
Figure 4. Simulation model, where: 1—simulator of wood chips outlet from chipper, 2—conveyor belt, 3—hopper.
Applsci 10 09091 g004
Figure 5. The geometry and distribution of the system being tested, where: 1—conveyor belt, 2—hopper; P1-P5—the initial position of the conveyor belt depending on the length.
Applsci 10 09091 g005
Figure 6. The geometry and dimensions of the material being transported.
Applsci 10 09091 g006
Figure 7. The values coefficient of friction and restitution for correlation: (a) rubber–wood, (b) rubber–steel.
Applsci 10 09091 g007
Figure 8. Wood chips transport in the simulation mode, where (a) correctly performed transport, (b) incorrectly performed transport of wood chips (uncontrolled side ejection or rotation of wood chips downward the conveyor belt).
Applsci 10 09091 g008
Figure 9. Image of the wood chips segregation sample.
Applsci 10 09091 g009
Figure 10. The 3D function of wood chips ejection distance depending on the conveyor belt inclination angle and belt velocity for the conveyor belt with the length of 1 m (analytical calculations—net, numerical calculations—surface).
Applsci 10 09091 g010
Figure 11. The 3D function of wood chips ejection distance depending on the conveyor belt inclination angle and belt velocity for the conveyor belt with the length of 2 m (analytical calculations—net, numerical calculations—surface).
Applsci 10 09091 g011
Figure 12. The 3D function of wood chips ejection distance depending on the conveyor belt inclination angle and belt velocity for the conveyor belt with the length of 3 m (analytical calculations—net, numerical calculations—surface).
Applsci 10 09091 g012
Figure 13. The 3D function of wood chips ejection distance depending on the conveyor belt inclination angle and belt velocity for the conveyor belt with the length of 4 m (analytical calculations—net, numerical calculations—surface).
Applsci 10 09091 g013
Figure 14. The 3D function of wood chips ejection distance depending on the conveyor belt inclination angle and belt velocity for the conveyor belt with the length of 5 m (analytical calculations—net, numerical calculations—surface).
Applsci 10 09091 g014
Table 1. The boundary conditions for the tested model: A—Wood chips (particles), B—conveyor belt (Belt), and C—belt conveyor frame (Boundary).
Lp.The Name of the Material PropertyUnitsA-ParticlesB-BeltC-Boundary
Wood ChipsConveyor BeltConveyor Belt Frame
1.Densitykg/m3750.001100.007850.00
2.Bulk Densitykg/m3450.00660.004710.00
3.Young’s ModulusGPa0.900.10210.00
4.Poisson’s ratio[–]0.450.500.30
Table 2. Quantity of wood chips used in the simulation.
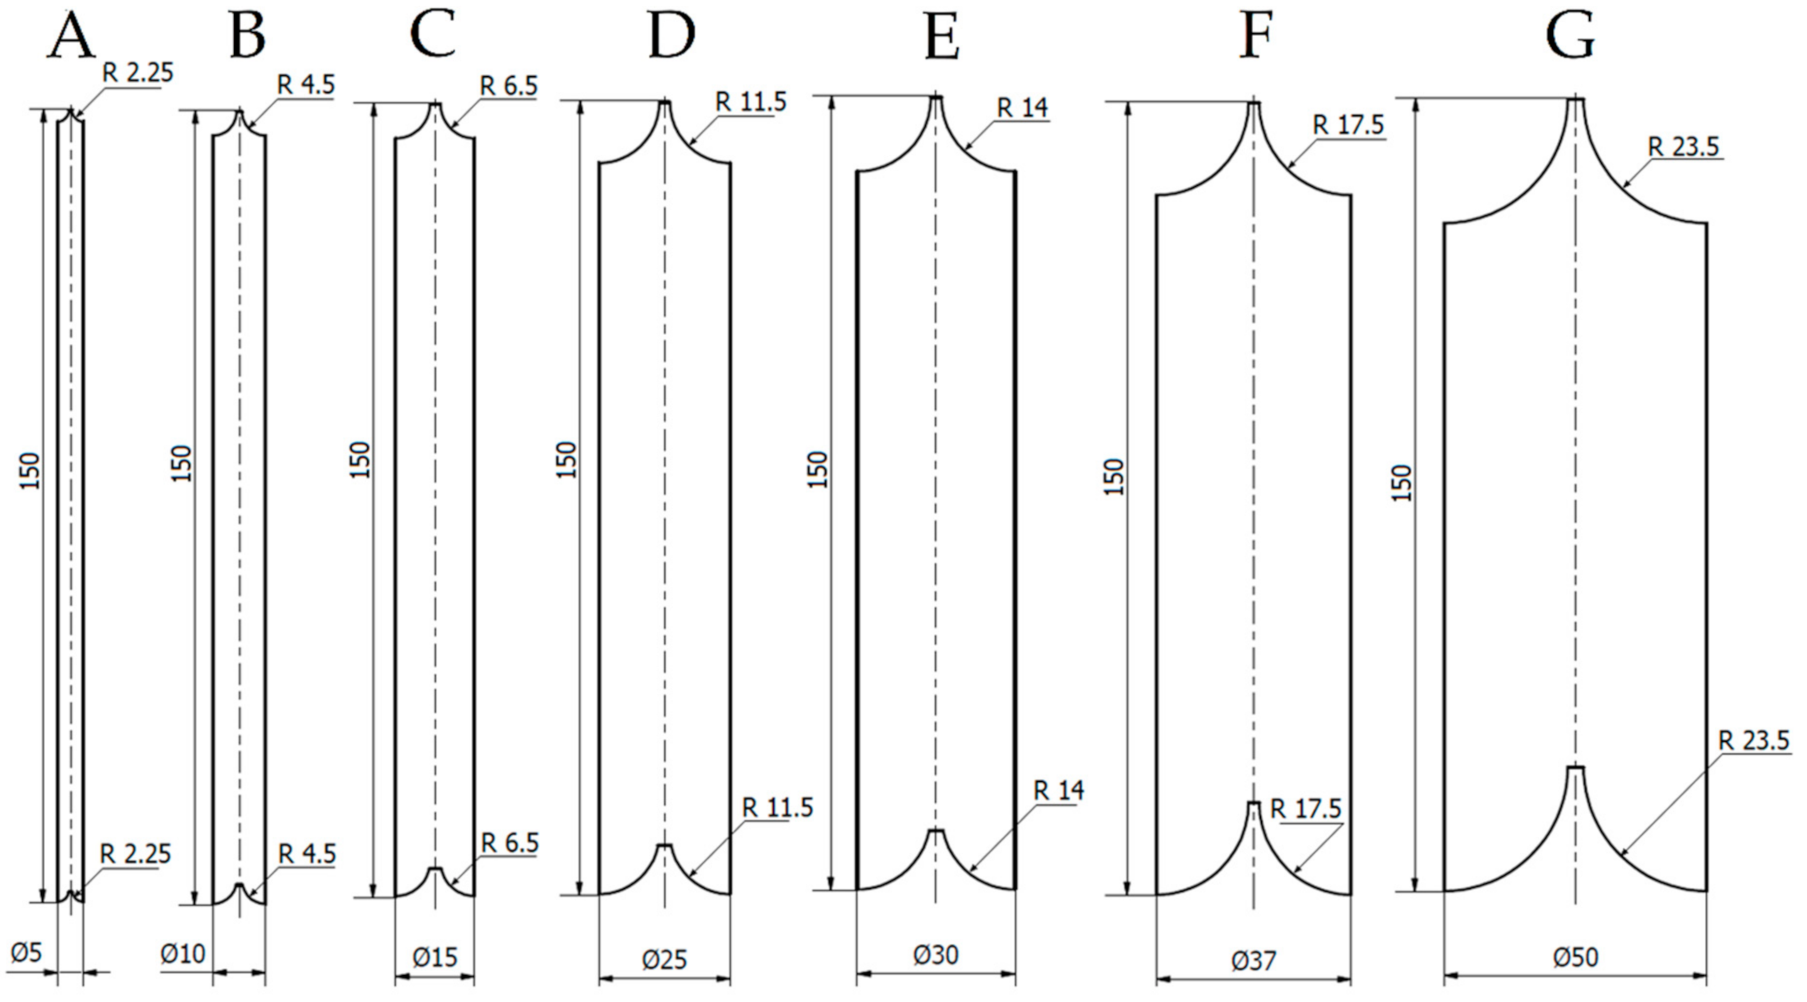
Type of Wood Chips according to Figure 6Quantity of Wood ChipsSurface Area (Faces) for One Particle (Wood Chips)
A29116
B15148
C13156
D7276
E12276
F20276
G14276
Total1101524
Table 3. The wood chips ejection distance was determined based on analytical calculations.
Conveyor Belt Length (m)Heightof Conveyor Belt End (m)Conveyor Belt Inclination Angle (°)Belt velocity (m/s)
12345
Distance of Wood Chips Ejection (m)
10.70100.390.821.281.792.35
0.86200.430.931.512.182.95
1.02300.440.991.652.443.37
1.1400.420.951.632.463.46
1.3500.380.891.542.353.33
20.83100.420.881.381.922.51
1.06200.471.011.642.353.15
1.30300.491.091.792.623.59
1.57400.491.091.832.713.76
1.70500.430.981.672.523.53
30.90100.440.921.431.992.59
1.19200.501.071.712.453.27
1.55300.531.171.912.783.78
2.05400.551.212.002.944.03
2.40500.501.121.872.773.83
41.05100.470.981.532.122.76
1.50200.551.181.882.673.54
2.25300.631.362.203.164.24
2.72400.621.362.223.224.37
3.11500.561.242.053.004.11
51.10100.481.011.562.172.81
1.79200.601.272.022.853.77
2.61300.681.452.333.334.45
3.35400.691.482.403.464.66
4.01500.631.382.253.264.42
Table 4. The wood chips ejection distance determined based on numerical calculations (the first part in the range from 1 m/s to 3 m/s). Markings: A—conveyor belt length (m), B—conveyor belt inclination angle (°), AVG—average value, SD—standard deviation.
ABBelt Velocity (m/s)
123
Distance of Wood Chips Ejection (m).
MinMaxAVGSDMinMaxAVGSDMinMaxAVGSD
1100.250.590.420.140.691.080.890.161.181.581.380.16
200.350.760.560.171.131.761.450.261.061.621.340.23
300.610.880.750.111.491.921.710.181.431.751.590.13
400.450.580.520.051.221.511.370.122.042.472.260.18
500.480.750.620.110.931.231.080.12----
2100.50.870.690.150.961.381.170.171.11.641.370.22
200.430.850.640.171.121.631.380.211.842.372.110.22
300.310.710.510.161.532.161.850.261.722.171.950.18
400.571.030.800.191.712.161.940.182.83.323.060.21
500.580.860.720.111.642.071.860.181.842.272.060.18
3100.420.840.630.170.961.351.160.161.452.221.840.31
200.531.060.800.221.051.621.340.232.052.982.520.38
300.611.120.870.211.131.761.450.262.493.232.860.30
400.340.720.530.161.382.031.710.272.413.012.710.24
501.041.421.230.161.161.821.490.272.082.742.410.27
4100.350.850.600.201.252.151.700.371.82.532.170.30
200.410.960.690.221.82.612.210.332.132.922.530.32
300.791.311.050.211.562.21.880.263.334.073.700.30
400.721.331.030.251.351.841.600.203.173.973.570.33
500.641.110.880.191.92.572.240.272.483.192.840.29
5100.150.670.410.210.891.761.330.361.522.381.950.35
200.190.790.490.241.051.971.510.382.073.012.540.38
300.781.431.110.271.372.261.820.363.214.053.630.34
400.250.680.470.181.852.552.200.293.193.893.540.29
500.401.050.730.261.22.251.730.431.582.41.990.33
- No results (wood chips fell out of the conveyor belt and load box).
Table 5. The wood chips ejection distance determined based on numerical calculations (the first part in the range from 4 m/s to 5 m/s). Markings: A—conveyor belt length (m), B—conveyor belt inclination angle (°), AVG—average value, SD—standard deviation.
ABBelt velocity (m/s)
45
Distance of Wood Chips Ejection (m)
MinMaxAVGSDMinMaxAVGSD
1102.723.212.970.203.413.973.690.23
203.063.763.410.293.554.043.800.20
301.51.951.730.180.791.281.040.20
401.071.371.220.121.762.131.950.15
50--------
2102.73.313.010.253.364.063.710.29
202.543.122.830.243.313.783.550.19
303.393.893.640.20----
403.013.573.290.233.414.033.720.25
50--------
3102.523.282.900.313.253.973.610.29
202.753.433.090.283.153.893.520.30
303.063.573.320.213.234.113.670.36
403.193.923.560.304.345.234.790.36
503.374.013.690.260.811.211.010.16
4102.783.253.020.193.153.893.520.30
203.194.073.630.363.214.123.670.37
303.254.053.650.332.853.883.370.42
403.234.253.740.423.754.544.150.32
503.814.614.210.33----
5102.062.852.460.322.593.22.900.25
202.553.633.090.44----
303.134.043.590.37----
403.524.353.940.343.774.644.210.36
503.784.013.900.09----
- No results (wood chips fell out of the conveyor belt and load box).
Publisher’s Note: MDPI stays neutral with regard to jurisdictional claims in published maps and institutional affiliations.

