Article

Potential Applications in Relation to the Various Physicochemical Characteristics of Al-Hasa Oasis Clays in Saudi Arabia

by
Ibrahim A. Al-Hawas
1,
Salah A. Hassan
2 and
Hany M. AbdelDayem
2,*
1
Department of Environmental and Natural Resources, College of Agricultural and Food Sciences, King Faisal University, Hofuf Al-Hasa 31982, Saudi Arabia
2
Chemistry Department, Faculty of Science Ain Shams University, Abassia, Cairo 11566, Egypt
*
Author to whom correspondence should be addressed.
Appl. Sci. 2020, 10(24), 9016; https://doi.org/10.3390/app10249016
Submission received: 28 November 2020 / Revised: 13 December 2020 / Accepted: 14 December 2020 / Published: 17 December 2020
(This article belongs to the Section Chemical and Molecular Sciences)

Abstract

:

Featured Application

Palygorskite and montmorillonite are the dominant phyllosilicate minerals in Al-Hasa oasis clays, although their coexistence is usually rare. Al-Hasa oasis clays can be used as alternative cheap materials for removal of heavy metals as they have the largest adsorption capacities toward lead (74.07 mg/g), compared with the other Saudi clays—namely, Tabuk clay (30 mg/g), Baha clay, (ca. 24 mg/g) and Khaiber clay (ca. 10 mg/g). In addition, Al-Hasa oasis clays have strong acidic properties, narrow pores and high thermal stabilities (up to 470 °C) and can therefore be used as catalysts in alcohol dehydration and hydrocarbon isomerization.

Abstract

In this work, various physicochemical characteristics, e.g., surface properties and mineralogical compositions, of five clays collected from different sites in the Al-Hasa oasis in Saudi Arabia have been investigated. Analysis of the mineralogical compositions of the clays in the study by X-ray diffraction indicated the coexistence of palygorskite, montmorillonite, illite, kaolinite, chlorite, calcite and quartz in different percentages. Thermogravimetric analysis indicated that all studied clays exhibited dehydroxylation temperatures higher than 470 °C. On the other hand, pore size distribution analysis of clays from N2 adsorption indicated the presence of micro- and narrow mesopores (of 1.3–2.8 nm). Furthermore, the capability of the different clays for removal of Pb (II) from aqueous solution has been studied. The adsorption process was described through the Langmuir, Freundlich, Temkin and Dubinin–Radushkevich models. The Langmuir model was the most suitable compared to the other models in the case of palygorskite- and montmorillonite-rich clays. However, the Temkin model better represented the adsorption process of Pb (II) on calcite-rich clay. The clay sample with 61.0 wt% of palygorskite was found to be the most effective at removing Pb (II), with a maximum removal capacity of 74.07 mg/g at pH 6, with a contact time of 6 h and at 25 °C. Generally, the adsorption mechanism of lead over all the studied clays followed the pseudo-second-order kinetics. On the other hand, the catalytic activity of clays in the study has been tested in methanol conversion. The acidic clays, those containing high amounts of montmorillonite, showed higher selectivity to ethylene, viz., 78.9%, with a methanol conversion of 39.1% at 350 ° C and 0.1 MPa.

1. Introduction

Several sources of clays are available in the Saudi Arabia, and so numerous studies have been conducted to characterize them and to investigate their potential uses [1,2,3,4,5,6]. Saudi Arabia is geologically divided into four distinct and extensive terrains, (Figure S1). Al-Hasa oases are situated between the rock desert of As Summan plateau in the west and sand dunes covering the adjoining plain in the east. As shown in Figure S1 in Supplementary Information (SI), Al-hasa is one of the largest oases in the world (534,000 km2), situated between 25°05′ and 25°40′ northern latitude and 49°55′ eastern longitude. To the best of our knowledge, no extensive study has been conducted to investigate the surface and physicochemical characteristics of Al-Hasa clays and their potential uses in the literature.
It is well known that clays are widely used in many industrial applications such as ceramic, paper, paint, barrier, catalyst, and adsorbent applications, etc. [7,8,9]. Reuse of wastewater resources from industrial processes is a strategic aim in Saudi Arabia. On the other side, heavy metals, especially lead, are the common contaminants of wastewater, collected as residues from petroleum industries. Clays are known to be used as alternative cheap materials for removal of heavy metals. So, five clay samples were collected from parent soil in different geographical regions of Al-Hasa in Saudi Arabia (viz., Tabuk, Baha and Khaiber) and tested in lead removal from wastewater [2].
On the other hand, the worldwide demand for ethylene and propylene has been growing steadily. Methanol-to-hydrocarbon conversion reactions were first discovered in the early 1970s using ZSM-5 (MFI zeolite) catalysts [10,11]. Different catalytic systems have been considered for use in methanol to olefin reactions, including an acid-type ion exchange resin, aluminum phosphate, a mesoporous silica alumina, e.g., Al-MCM41 or Al-MCM48, a zeolite, or a lamellar zeolite [12]. Regarding the natural clay-based catalysts for the methanol conversion processes, acidic clay mineral (e.g., kaolin or leached kaolin, etc.) or clay modified with acid such as sulfuric acid or phosphoric acid [10,11,12] could be used. Among all these catalytic systems, natural clays are the cheapest solids. Thus, in the present study, Al-Hasa clays were also investigated in the dehydration of methanol, following their catalytic performances.
Generally, the suitability of clay for a specific application is based on its mineralogical composition, crystal morphology, porosity, surface area, surface acidity and thermal stability [13]. Therefore, the main objective of this research work was to characterize the collected clay samples (Figure S2) via various techniques: X-ray powder diffraction (XRD), scanning electron microscopy (SEM), N2 adsorption, thermogravimetric analysis (TGA) as well as potentiometric acid–base titration. An attempt was undertaken to investigate the different catalytic performances of these clays in the removal of lead contaminant and in the selective methanol conversion to ethylene, in relation to the various characterization parameters. The study was also extended to explore the effect caused by the coexistence of different minerals in the clay (viz., palygorskite, montmorillonite, calcite) on the mechanism of lead adsorption profiles.

2. Materials and Methods

2.1. Clays Sampling

Five clay samples from different locations representing the major soils of the oasis were collected. Soil was chosen based on the classification map of the area (Figure S2). Site 1 was from the cultivated area grown with palm trees (of more than fifteen years old). Site 2 was a marine that has been developed on the red bed parent material and has probably been cultivated in the past. Marlstone (site 3) was collected from the Tertiary deposit, where there was no sign of any agricultural activity. Marl (site 4) was another parent material collected from the Quaternary deposits located in a farm that has been brought under cultivation recently and has never been deeply ploughed; the lower horizons were still undisturbed. Site 5 represents sabakhah, which has not been under cultivation. The abbreviations of clay samples in the study were C1, C2, C3, C4 and C5 depending on the parent soil site.

2.2. Samples Characterization

Mineralogical analysis of samples was carried out by X-ray diffraction (XRD) using a Philips X pert diffractometer operated at 40 kV and 40 mA and CuK α radiation with a wavelength of 1.5406 Å, in the range of 5 °C–80 °C. Semiquantitative analysis of minerals was performed depending on the calculation method of XRD peak area described by Brindely and Reyonds [14,15], where a mixture of standard minerals was used to quantify the palygorskite, montmorillonite, chlorite and quartz phases. Analytical transmission electron microscopy (ATEM), using a Philips EM400 instrument operated at 120 kV, was adopted for estimating the chemical composition of different phyllosilicate minerals in calcium carbonate-free clay fraction. About 0.5 g of clay was saturated with cesium by washing with 30 mL of 1.0 M cesium chloride three times, followed by three successive washings with distilled water. The produced dispersed phase was diluted with distilled water and a drop of cesium saturated clay was then placed on a carbon coated copper grid of 200 mesh. On an average, 14 crystals were analyzed by ATEM for Na, K, Ca, Mg, Si, Al, Fe, Mn and Cs. Scanning electron microscopy (SEM) was performed using a JEOL JSM-5300 microscope operated at 20 kV. Nitrogen physisorption measurements were carried out using the surface area analyzer Quantachrome Nova 2200 at a liquid nitrogen temperature. The samples were outgassed at 90 °C for 1 h and then at 250 °C overnight. Thermal gravimetric analysis (TGA) measurements were carried out using a TASDT 2960 instrument, using Pt holders under N2 flow of 30 mL/min and a heating rate of 10 °C/min.

2.3. Measurement of Acid–Base Properties

Three techniques (viz., continuous titration, batch titration and back titration) are usually applied to obtain the proton surface charge of the solid phase. The most frequently used one is the continuous titration, which consists of measuring the pH of a dispersion after the addition of an aliquot of titrant [16,17,18,19]. This method was often used for simple oxides and was also applied to study the surface characteristics of clays [20,21,22]. Therefore, in the present study, the continuous titration method was used—namely, the changes in surface acidity of the clay in solution were demonstrated according to the potentiometric titration method [16] as expressed in terms of mmol KOH g−1 catalyst. In total, 0.1 g of clay sample was dispersed overnight in an aqueous solution of 25 mL 0.004 mol L−1 HCl + 25 mL 0.02 mol L−1 KCl. Titration with 0.042 mol L−1 KOH solution was carried out using micro burette at 40 °C under nitrogen stream to avoid CO2 contamination from air with constant stirring. The variation of pH of the solution during addition of 0.1 or 0.2 mL of KOH was followed by using digital pH meter (Orion, 420 A+, Thermo Electron Corporation). KOH was added in a successive manner every 10 or 15 min since the solution pH was showed decay with time. A blank solution experiment was carried out without clay sample for correction. The excess amount of hydroxyl ions was estimated from the difference between the blank and sample curves as a function of pH.

2.4. Lead Adsorption Study

Adsorption measurements were performed by batch technique at 25 °C. In total, 0.1 g of clay was placed in 250 mL reagent bottles containing 40 mL of lead nitrate (Aldrich, 203580, 99.99%) solution of initial concentration 300 mg L−1 and the solution was checked for a given time in a thermostatic shaker bath with 130 rpm. The pH of the solution was adjusted by using 0.1 mol L−1 NaOH or HCl. The solution was centrifuged then the clay was removed. Then, the lead in filtrate was measured by using a lead ion selective electrode (Orion 9682 BN). The adsorption mechanism was investigated by applying the same predefined procedure with 6 h contact time and with the pH of suspension adjusted at 6. Pb (II) concentration varied in range from 20 to 850 mg/L. The adsorption capacity of Pb (II) ions onto clays was calculated using Equation (1).
q e =   ( C C e )   V m
where qe is the equilibrium capacity concentration of adsorbate on adsorbent (mg/g), C is the initial concentration of adsorbate (lead solution) (mg/L), Ce is the equilibrium concentration of adsorbate (mg/L) in solution, m is the used mass (g) of adsorbent (clay) and V is the volume of lead solution (L).

2.5. Catalytic Activity Study

Catalytic activity measurements were carried out at atmospheric pressure in a tubular quartz reactor (6 mm i.d.), which was placed inside a programmable furnace and the temperature was measured by a type K thermocouple located in a pocket in the center of the catalyst bed. Methanol was fed to a purpose-vaporizer by means of a Master Flex C/L variable speed tubing pump (1 to 6 rpm) EW-95990-18 [23]. The gas flow was adjusted by a Cole-Parmer compact mass flowmeter. All chemical pipes were heated to avoid condensation in the system. The feed and the produced gas compositions were determined by on-line gas chromatography (GC), using a Bruker 450 GC equipped with two channels: channel one is for analyzing oxygenates and alkenes (propylene, ethylene, methanol, formaldehyde, and formic acid); the separation was accomplished by Varian select formaldehyde and HayeSep Q. The second channel is for analyzing the nonflammable gases (viz., O2, N2, CO, CO2) using a thermal conductivity detector (TCD) and separation was accomplished by MolSieve 13X and HayeSep Q columns connected in a series. Prior to loading the clay sample in the reactor, the powder was sieved and the fraction containing particles of 0.12–0.25 mm was used. Therefore, a considerable pressure decrease over the catalyst bed could be avoided and reproducible gas flow and mass transport conditions were ensured. The clay-catalyst (0.1 g) was mixed with SiO2 to 10 wt.% in all catalytic tests to prevent hot-spot formation in the catalyst bed, [23]. All the catalytic experiments were carried out under the following conditions: methanol liquid injection feed flow rate = 2.4 mL h−1 and reaction temperatures at 350 °C. On the other hand, acid-activated clay minerals have proved to be effective catalysts for several reactions [24,25]. Therefore, in this work, Al-Hasa clays in the study were treated with hydrochloric acid solutions at 0.1 mol L−1 concentration (1.0 g clay/25 mL). The dispersions were maintained at 100 °C with stirring for 60 min. The samples were cooled to room temperature and filtrated and then washed with deionized water until free of excess acid. The samples were dried at 110 °C for 12 h. The produced acid-activated clays were tested in methanol conversion at the same reaction condition as mentioned above. The calculated conversion percentage is that of the reacted methanol, selectivity percentage is calculated as the division of product yield and conversion of methanol.

3. Results and Discussion

3.1. XRD Analysis and Mineralogy Composition

The X-ray diffraction patterns of the clays in the study are depicted in Figure 1. In addition, Table 1 presents their semiquantitative mineralogical compositions. C1, C3 and C4 clays are mainly composed of palygorskite with characteristic diffraction lines at 2θ = 8.42°, 16.42°, 21.44° 27.72° and 61.52° (JCPDS file 20-0688). In addition, the characteristic diffraction lines for illite at 2θ = 17.4°, 19.74° and 34.46° (JCPDS file 31-0968), kaolinite at 2θ = 20.1° (JCPDS file 29-1488), quartz at 2θ = 26.6° (JCPDS file 87-2096) and that characteristic for chlorite at 2θ = 13.58° (JCPDS file 03-0072) were also observed. In the case of C4 clay, calcite was also detected at a relatively high percentage (22%) of diffraction lines at 2θ = 23.04°, 35.94° and 48.52° (JCPDS file 83-178). However, in the case of C2 clay, the X-ray analysis (Table 1) shows that the clay is mainly composed of montmorillonite (73%) of one main characteristic diffraction line at 2θ = 5.78° (JCPDS file 03-0009) (Figure 1). In addition to montmorillonite the following minor phases: calcite, quartz, illite, kaolinite and palygorskite were also observed in the diffraction pattern of C2 clay. On the other hand, C5 clay is mainly composed of both calcite (39%) and palygorskite (27%). Furthermore, a pronounced broad peak can be observed at 2θ = 10.92° in the diffraction patterns of C1, C4 and C5 clays, which can be attributed to Al2Si50O103 phase (JCPDS file 46-0750).
Table 2 presents the chemical analysis using ATEM of palygorskite crystals in C1, C3, C4 and C5 clays and montmorillonite crystals in C2 clay, as dominant phyllosilicate minerals existed in these clays. From the comparison between the C1, C3, C4 and C5 clays in terms of palygorskite chemical composition, it can be observed that C4 clay has the highest amounts of Fe and Mg and the lowest amounts of Al. In addition, C1 and C3 do not show significant differences between the amounts of Fe, Mg and Al.

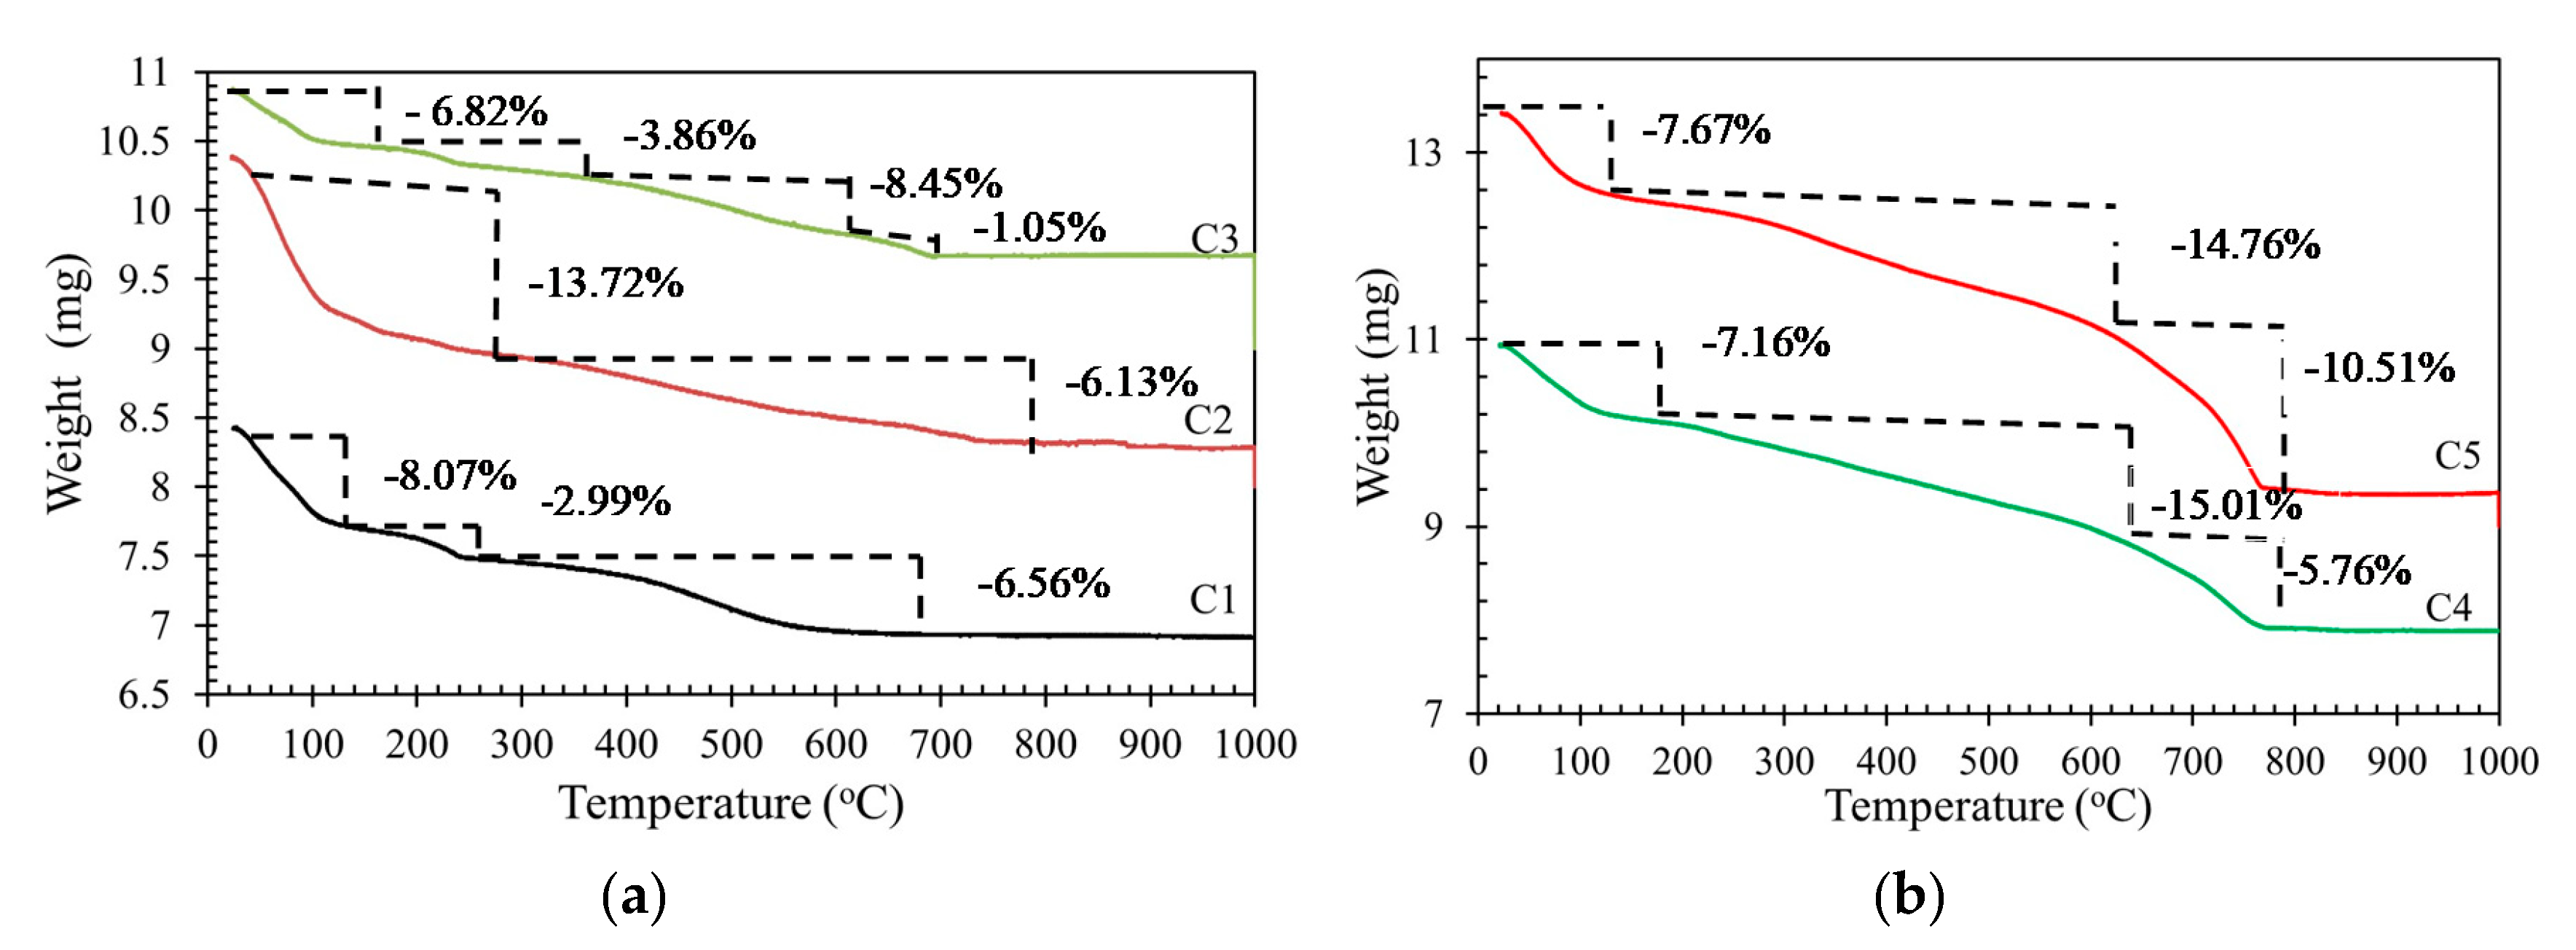
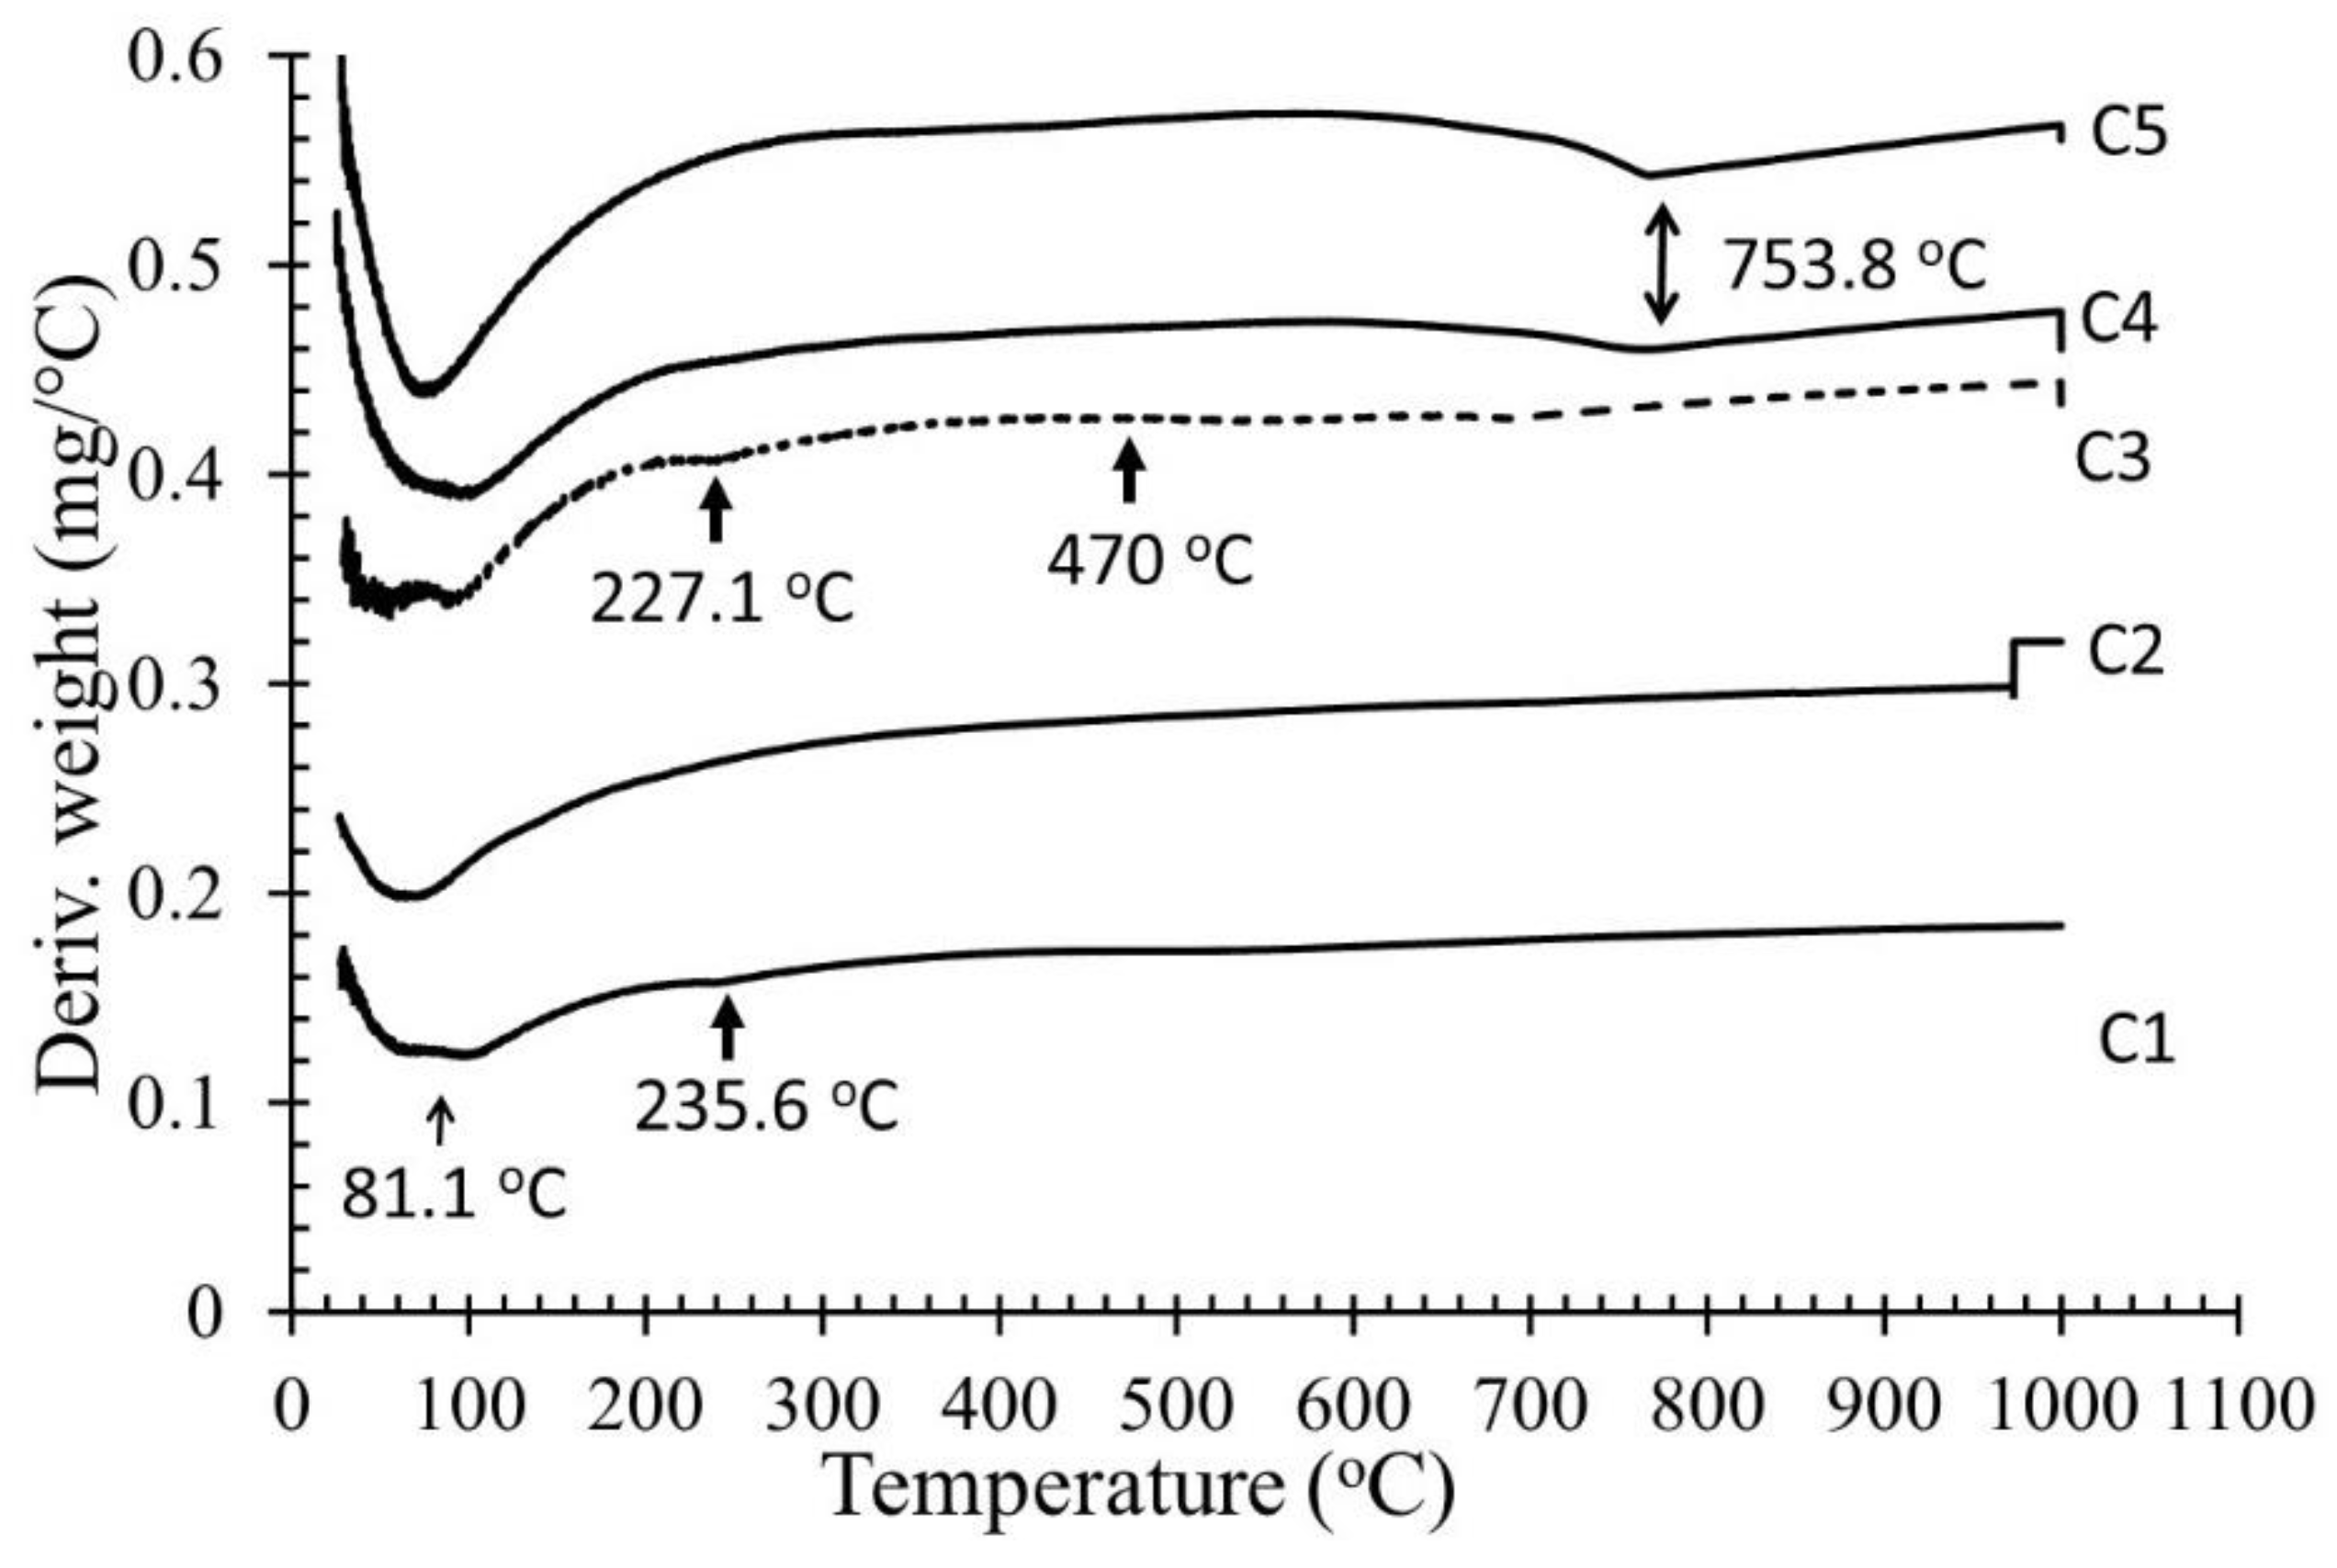
3.2. Thermogravimetric Analysis

The thermal behavior of clays was studied using TGA (Figure 2 and Figure 3). The thermograms of these clays show multiple endothermic peaks: first, all clays show an endothermic peak at ca. 80–90° C with weight loss (less than 14%). This peak corresponds to loosely bound water molecules [26]. The second stage loss (of ca. 3%) with an endothermic peak at temperature ca. 230 °C, seems to be due to the dehydration of the zeolitic water (i.e., water of hydration within cavity) [27,28]. However, this peak is observed only in the TGA curves of palygorskite-rich clays—namely, C1 and C3 (Figure 2a and Figure 3) [28]. The third stage loss with an endothermic peak at ca. 470 °C is observed in the TGA curves of all clays and becomes more pronounced in the case of palygorskite- and calcite-rich clays—namely, C4 and C5 clays, respectively; the weight loss is about 15%. This peak may be due to the dehydration of the bound water sheets [26,27]. However, in the case of C4 palygorskite-rich clay, this percentage weight loss is higher than that theoretical value of 8.53% [28]. According to the chemical formula of palygorskite, this difference may be due to a part of the zeolitic water, not considered as bound water [27,29]. The phase formed after the dehydration of bound water is called palygorskite anhydride of a chemical formula Si8O20Mg5(OH)2−x. The fourth stage loss with an endothermic peak at around 700 °C may be due to the calcination of calcite (carbonate decomposition) in the C5 sample. The weight loss linked with this peak is more significant in the case of C5 clay (ca. 10.5%), which contains a high percentage of calcite (Figure 2b and Figure 3). However, this peak can be attributed to dehydroxylation of palygorskite (i.e., forming Si8O20Mg5 phase) present in the C3 and C4 clays [28].

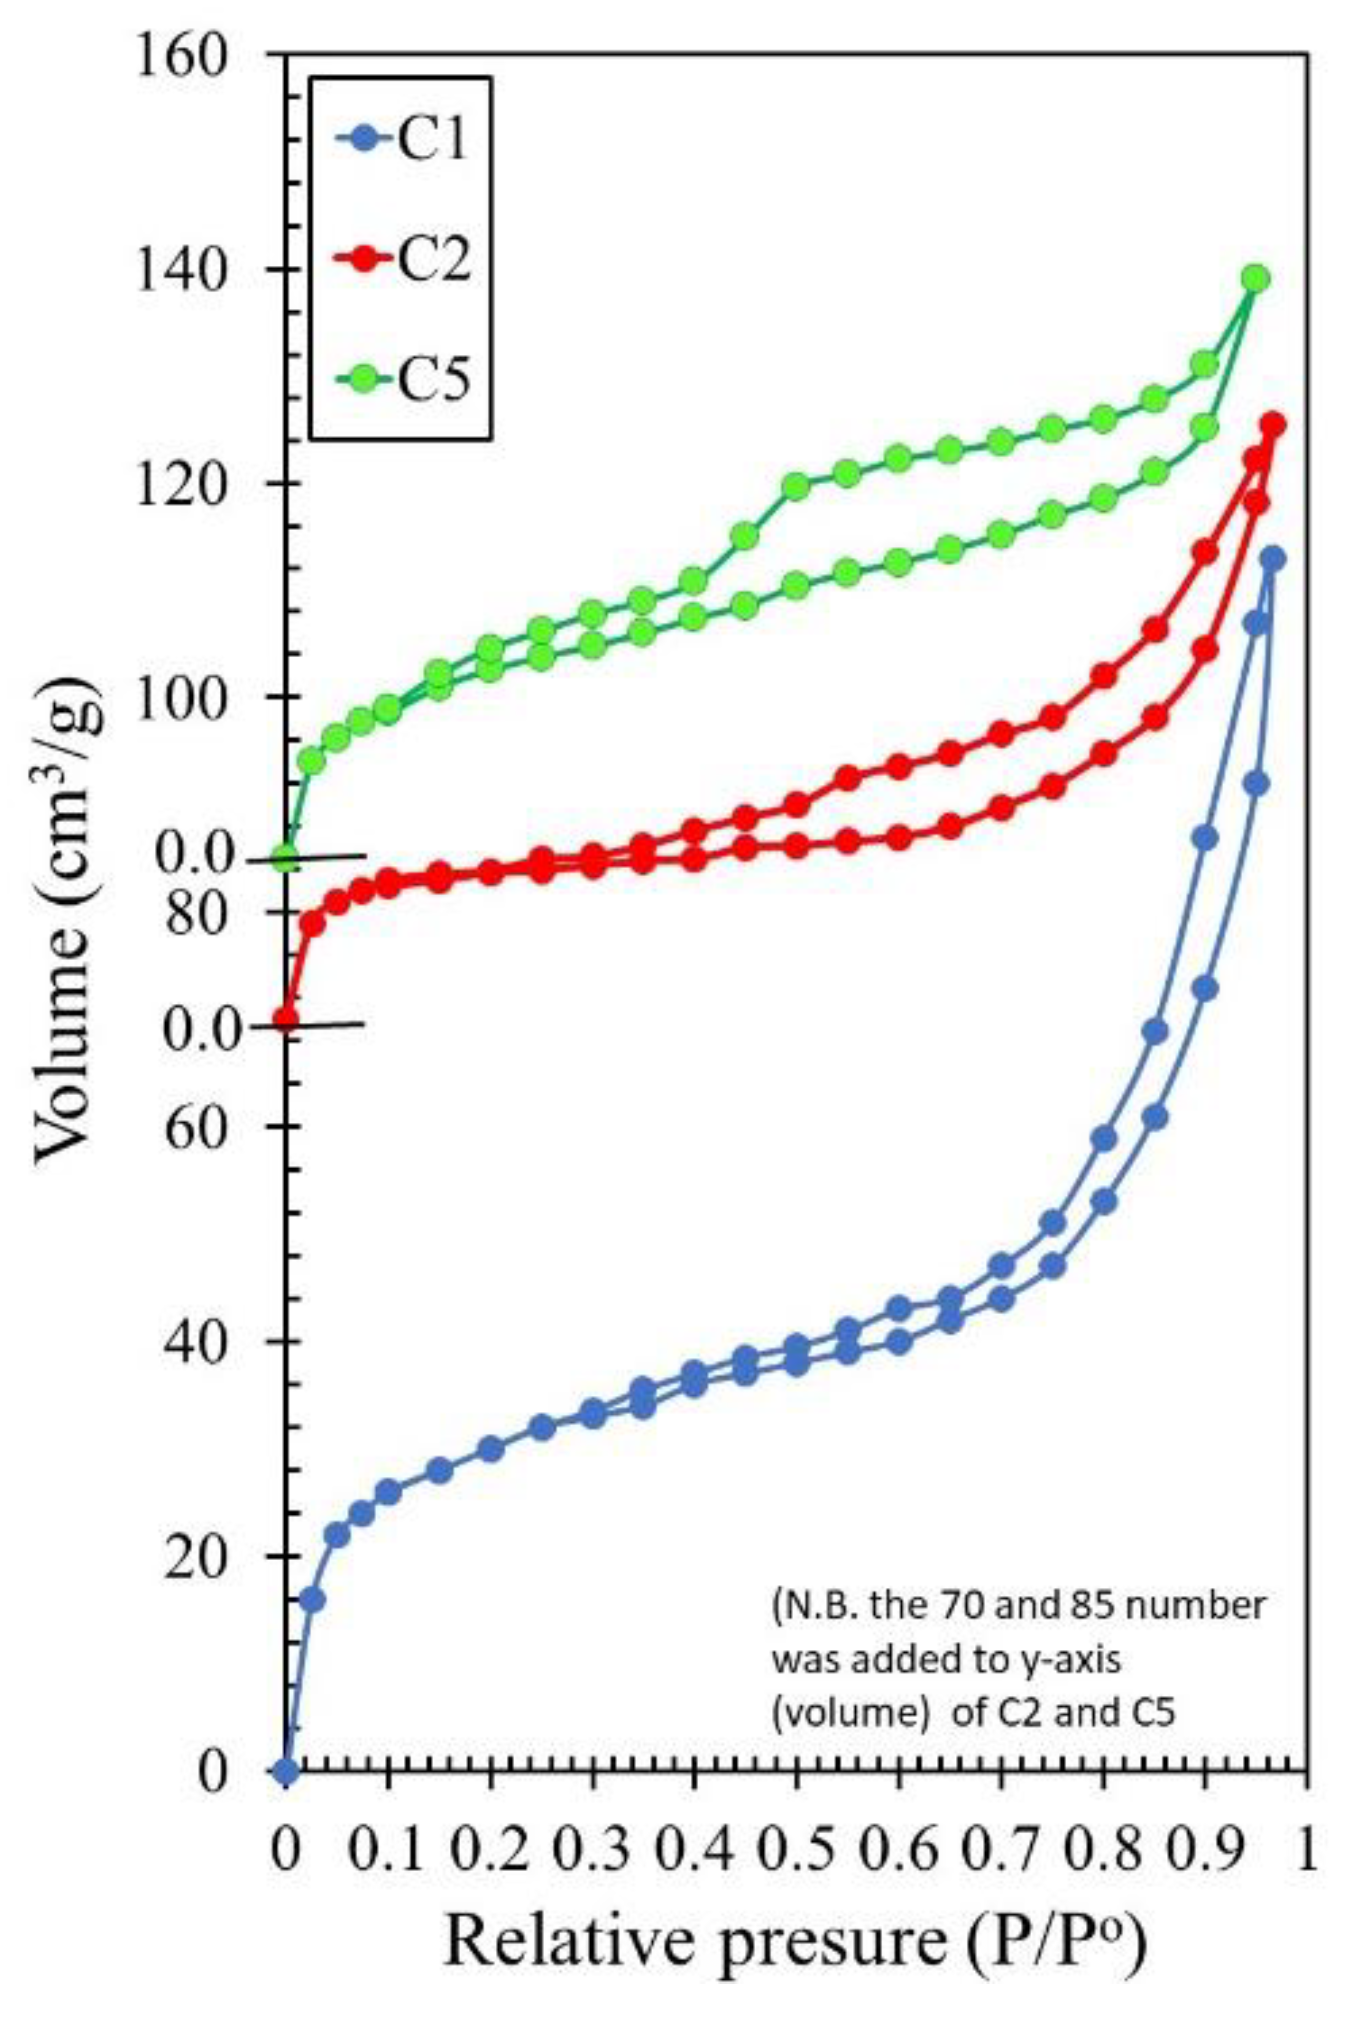
3.3. Textural and Morphological Characteristics

As shown from the N2 adsorption–desorption isotherms in Figure 4, palygorskite, montmorillonite and calcite-rich clays (viz., C1, C2 and C5) exhibit type II isotherms in the IUPAC classification [30]. The surface parameters of the clays in the study, derived from the obtained isotherms, are summarized in Table 3. The Brunauer–Emmett–Teller (BET) specific surface areas (SBET) [31] and pore volumes (Vp) of palygorskite-rich clays (viz., C1, C3 and C4) are higher than those of montmorillonite- and calcite-rich clays—namely, C2 and C5, respectively. In addition, the calculated cumulative surface areas (Scum) and cumulative pore volumes (Vcum) using the Barrett–Joyner–Halenda (BJH) method [32] are also given in Table 3. In the case of C1, C3 and C4 clays, the values of Scum are lower than those of SBET, which may indicate that the surface is mostly located in narrower fraction of pores. However, in the case of C2 and C5 clays, Scum is higher than SBET, which may indicate that the surface is located in the wider fraction of pores.

3.3.1. Pore Size Distribution (PSD) Models of Studied Clay Samples

Figure 5 represents the pore size distribution curves ( Δ V Δ r versus r) for the clays in the study, characterized by unimodal PSD profiles with mean hydraulic radii centered in the range 1.8–2.2 nm. The presence of a maximum at certain r ¯ Cp indicates the presence of more pores with the given most frequent hydraulic radius than those of the other radii values. The height of each peak is a measure of the number or the volume of this group of pores. It is evident that the C1, C3, C4 and C5 clay samples predominantly have micropores (with mean hydraulic radius of less than 2 nm). However, C2 clay shows almost narrower mesoporous profile of most frequent hydraulic radii at ca. ≥ 2.2 nm. Moreover, the pore size distribution curve of the C4 clay sample (Figure 5 inset) indicates a bimodal system with a bigger fraction of wider pores than the other samples.

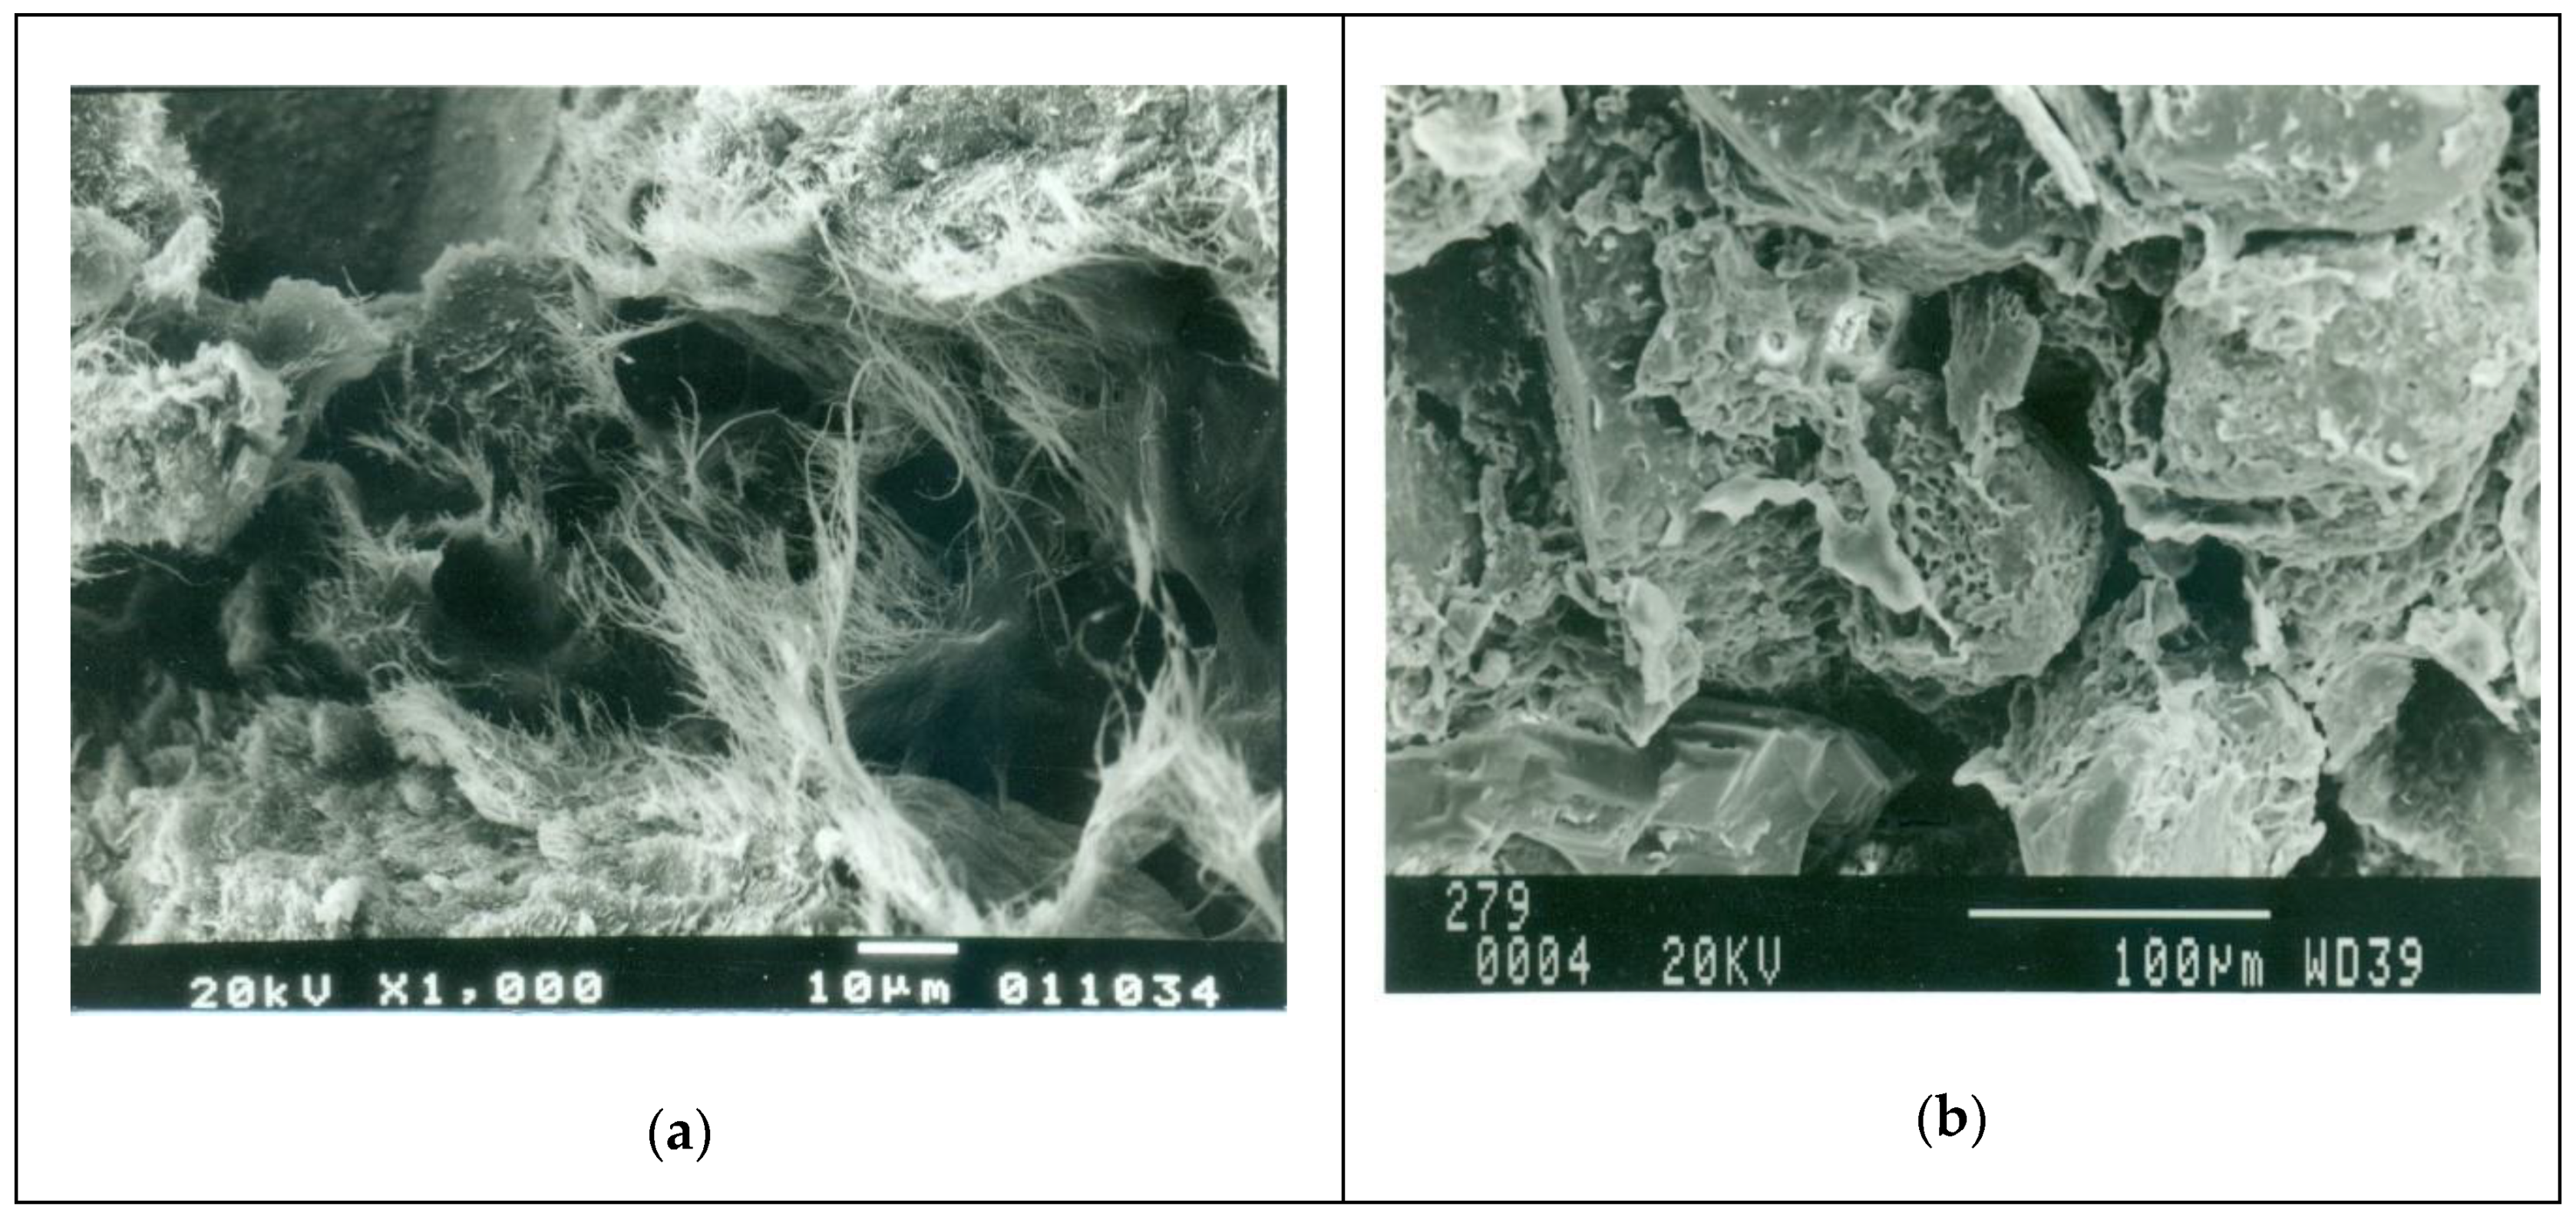
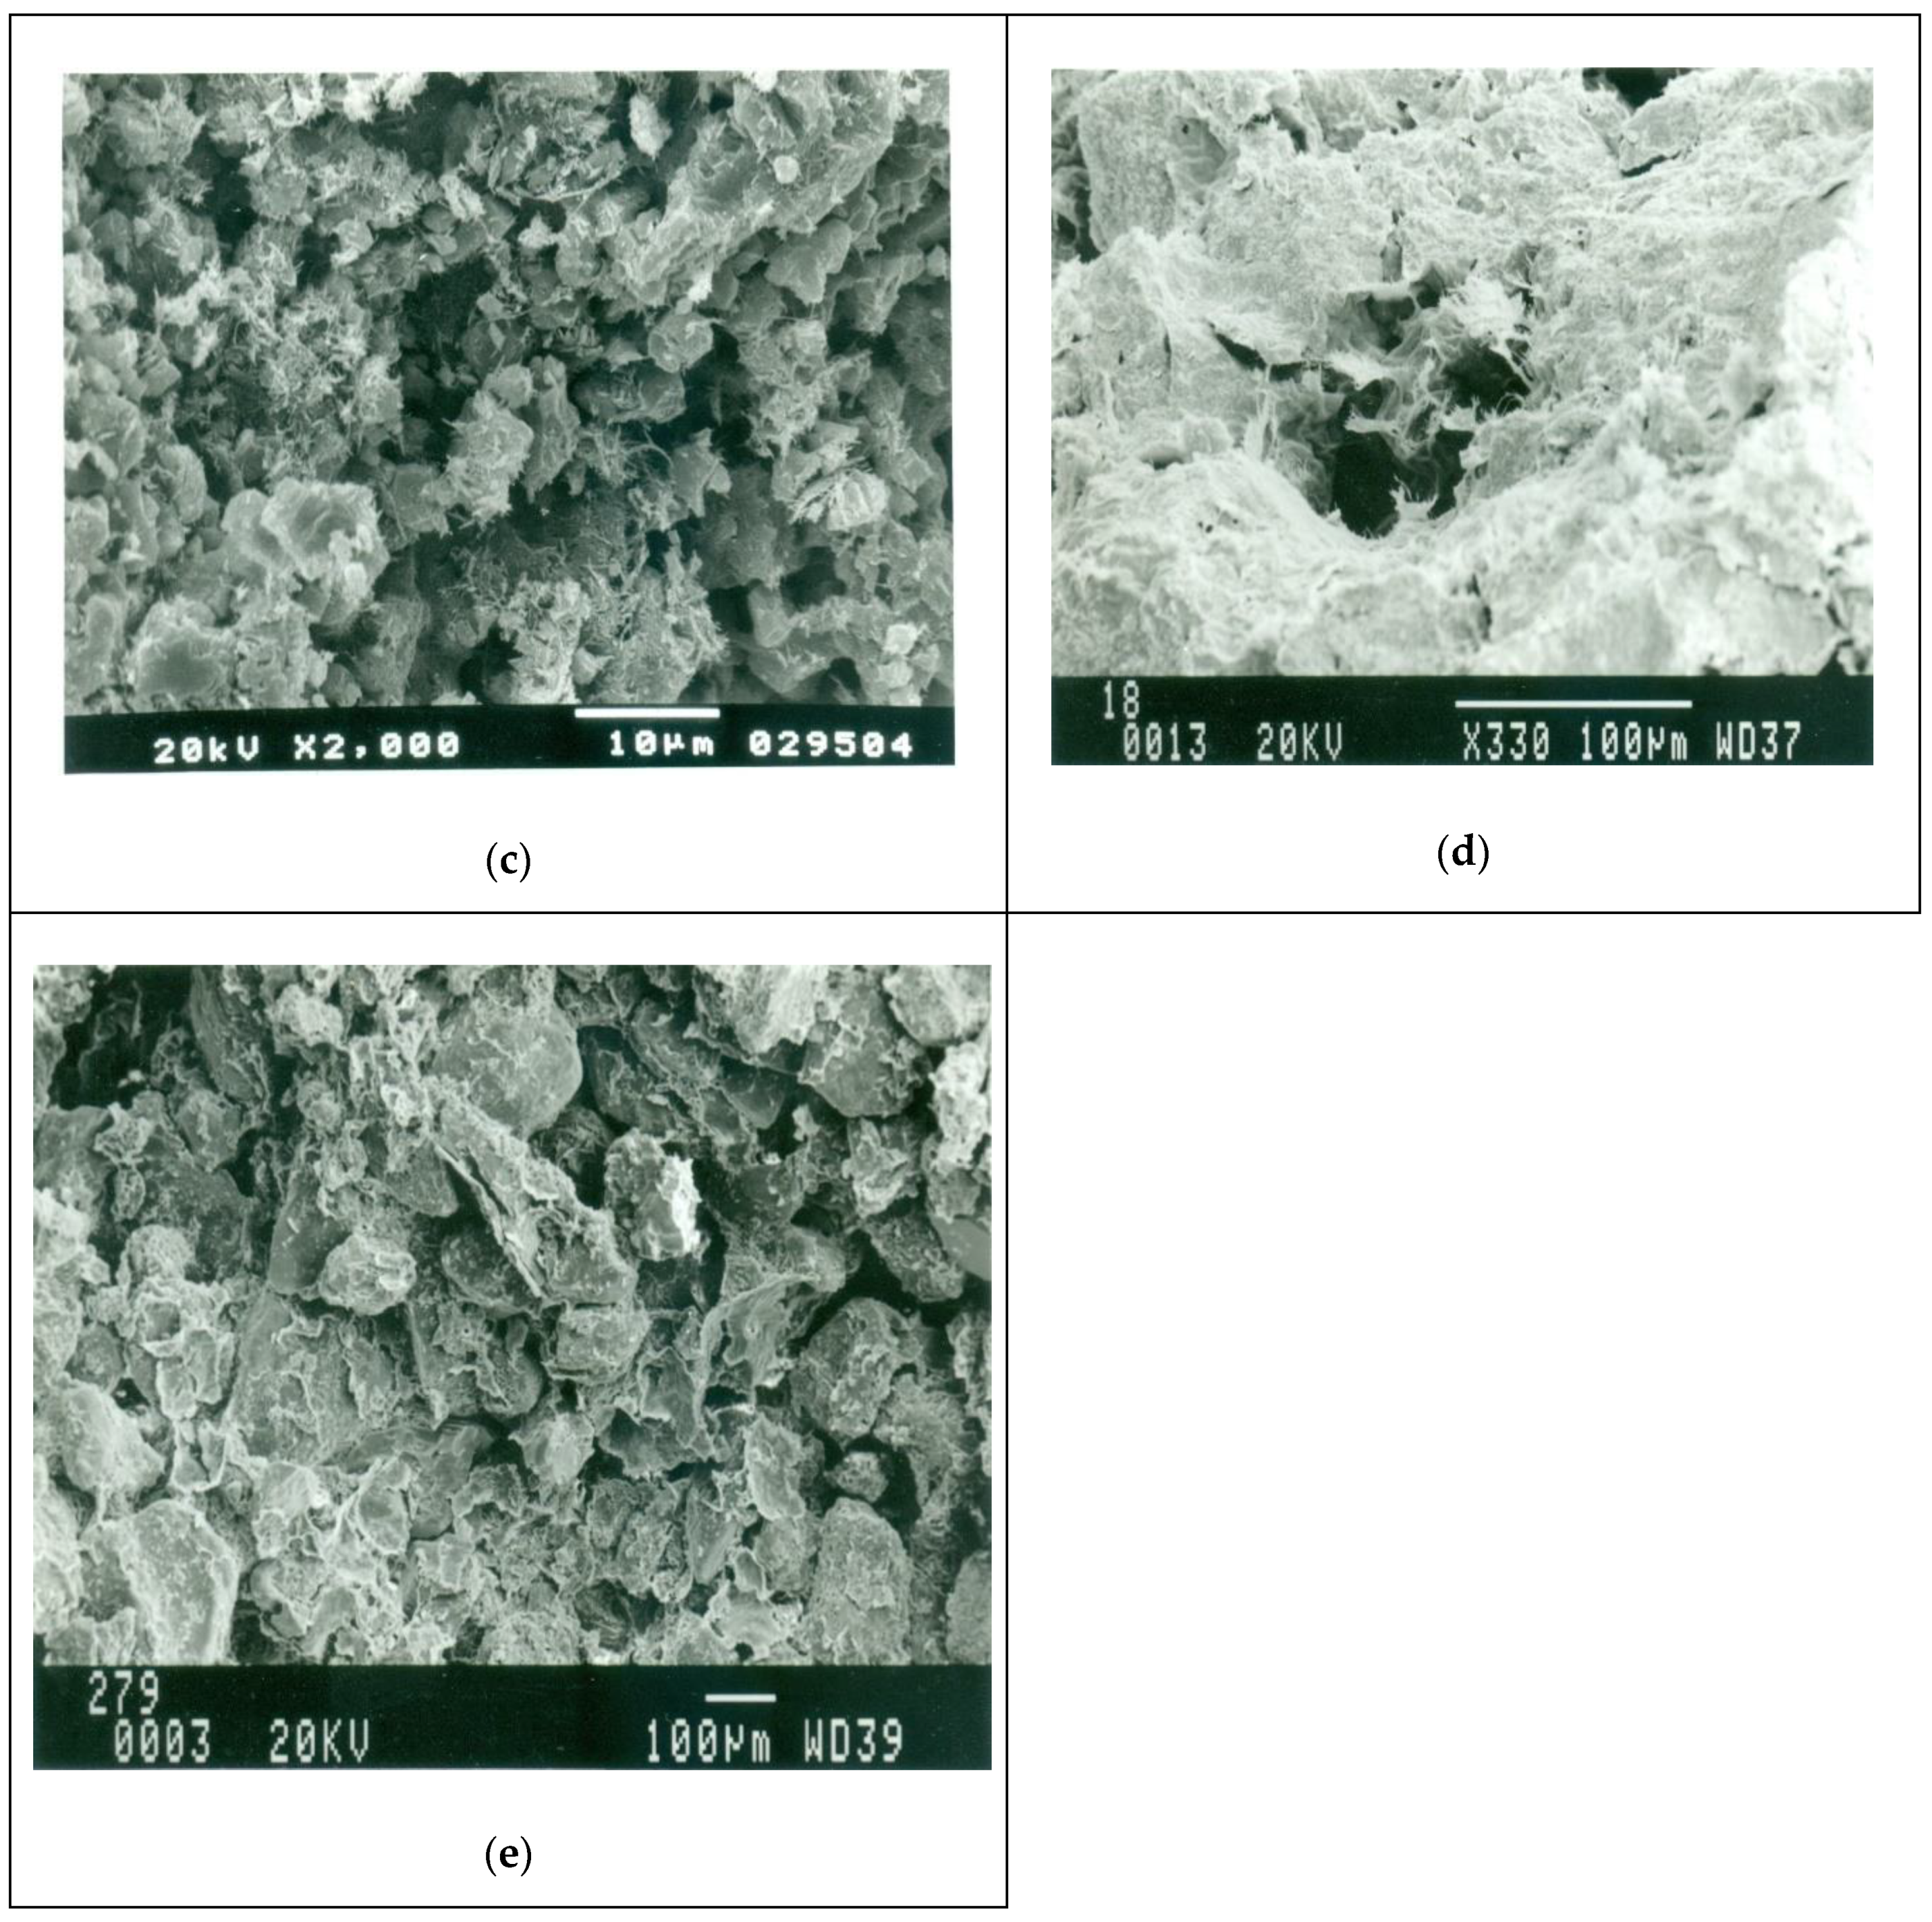
3.3.2. SEM Investigation

Figure 6a,d illustrates the SEM micrographs of C1 and C4 clays, showing larger pore fractions with occurrence of palygorskite fibers as laths and bundles around the pore mouths. This pattern can probably be linked with the observed high surface areas and high porosity characters of these samples. On the other hand, the image of C2 clay (Figure 6b) indicates the palygorskite fibers, which are believed to be overgrown on montmorillonite beds and radiated into the pore spaces. The pores seem to be blocked by palygorskite fibers, which may be linked with the lower surface area and pore volume values of C2 clay derived from N2 adsorption data, (Table 3), as compared with the other clays. On the other hand, aggregated large particles of contained minerals were observed in the obtained images of C3 and C5 clays, (Figure 6c,e).
It is well known that the clay surface is covered by hydroxyl groups in aqueous solution [33,34,35,36], which are not necessarily equivalent. Some of them may act as an acid, some may act as a base and the rest may be amphoteric with different isoelectric points. Each acid strong enough to react with a solution of a given pH dissociates a proton (Clay-O + H+), producing a negative charge. On the other hand, each base strong enough to react with the solution associates with a proton from the solution (Clay-OH2+), yielding a positive charge. Figures S3–S7 show the potentiometric titration curves of clays in the study. In all cases, curve 1 represents a blank titration curve of 25 mL HCl (0.0042 mol L−1) + 25 mL KCl (0.02 mol L−1) against 0.042 mol L−1 KOH. Curve 2, however, is obtained using the same HCl+ KCl solution in which 0.1 g of clay sample is soaked overnight upon titration against the same solution of KOH. The total amounts of acid (Clay-O) on the surface are denoted as ΔΓO- at the same time, while as the total amounts of base (Clay-OH2+) on the surface are denoted as ΓH+. In addition, the pH of the solution at zero charge, i.e., in presence of equal amounts of the negative and positive charges, is called the point of zero charge (P.Z.C) (Table 3).
As shown in Figure S3 of C1 clay, no change in the initial pH values of sample titration, curve 2, was observed (i.e., the titration curve 2 coincides with the blank curve 1). The same behavior was also observed for C2 clay (Figure S4), clearly confirming the acidic nature of C1 and C2 clays [16]. However, the potentiometric titration curves in Figure S5 ensure the presence of both acidic and basic hydroxyl groups on the surface of C3 clay.
For the C4 and C5 clay samples (Figures S6 and S7), the titration curve completely coincides with the blank curve in the pH range from 7.0 to 11.0, which may refer to the absence of acidic properties of these clays—i.e., they have only basic properties, which seems most likely due to the presence a large amount of calcite in these clays [16].
Figure 7 displays the variation of the logarithm of the obtained amounts of acids (ΔΓO) and of bases (ΔΓH+) with pH values. The ΔΓH+ and ΔΓO parameters were estimated from the difference between titration curves 1 and 2 in Figures S3–S7, while the obtained values of point zero charge are depicted in Table 3. As shown in Figure 7a, in the case of C1 clay, the amounts of acids (log ΔΓO) increases gradually with an increasing pH up to pH ≈ 10. However, for C2 clay, log ΔΓO increases sharply up to pH = 5 and then increases gradually up to pH = 10, which may suggest that the surface of C2 clay may be covered with strong acidic hydroxyl groups. Figure 7b, displays the acid–base properties of C3 clay. The amounts of acids (log ΔΓO) increase sharply with increasing the pH up to pH = 9.5. However, log ΔΓH+ remains unchanged in the pH range between 6 and 7 and then decreases sharply up to pH = 8.8. On the other hand, Figure 7c shows the change of log ΔΓH+ with pH for C4 and C5 clays. log ΔΓH+ remains unchanged at 6 < pH < 7 and then sharply decreases up to pH = 7.7, which indicates that the basic sites of C4 and C5 clays are weak and cover small range of pH, as compared with C3 clay sample.

3.4. Removal of Lead from Aqueous Solution

3.4.1. Effect of Contact Time
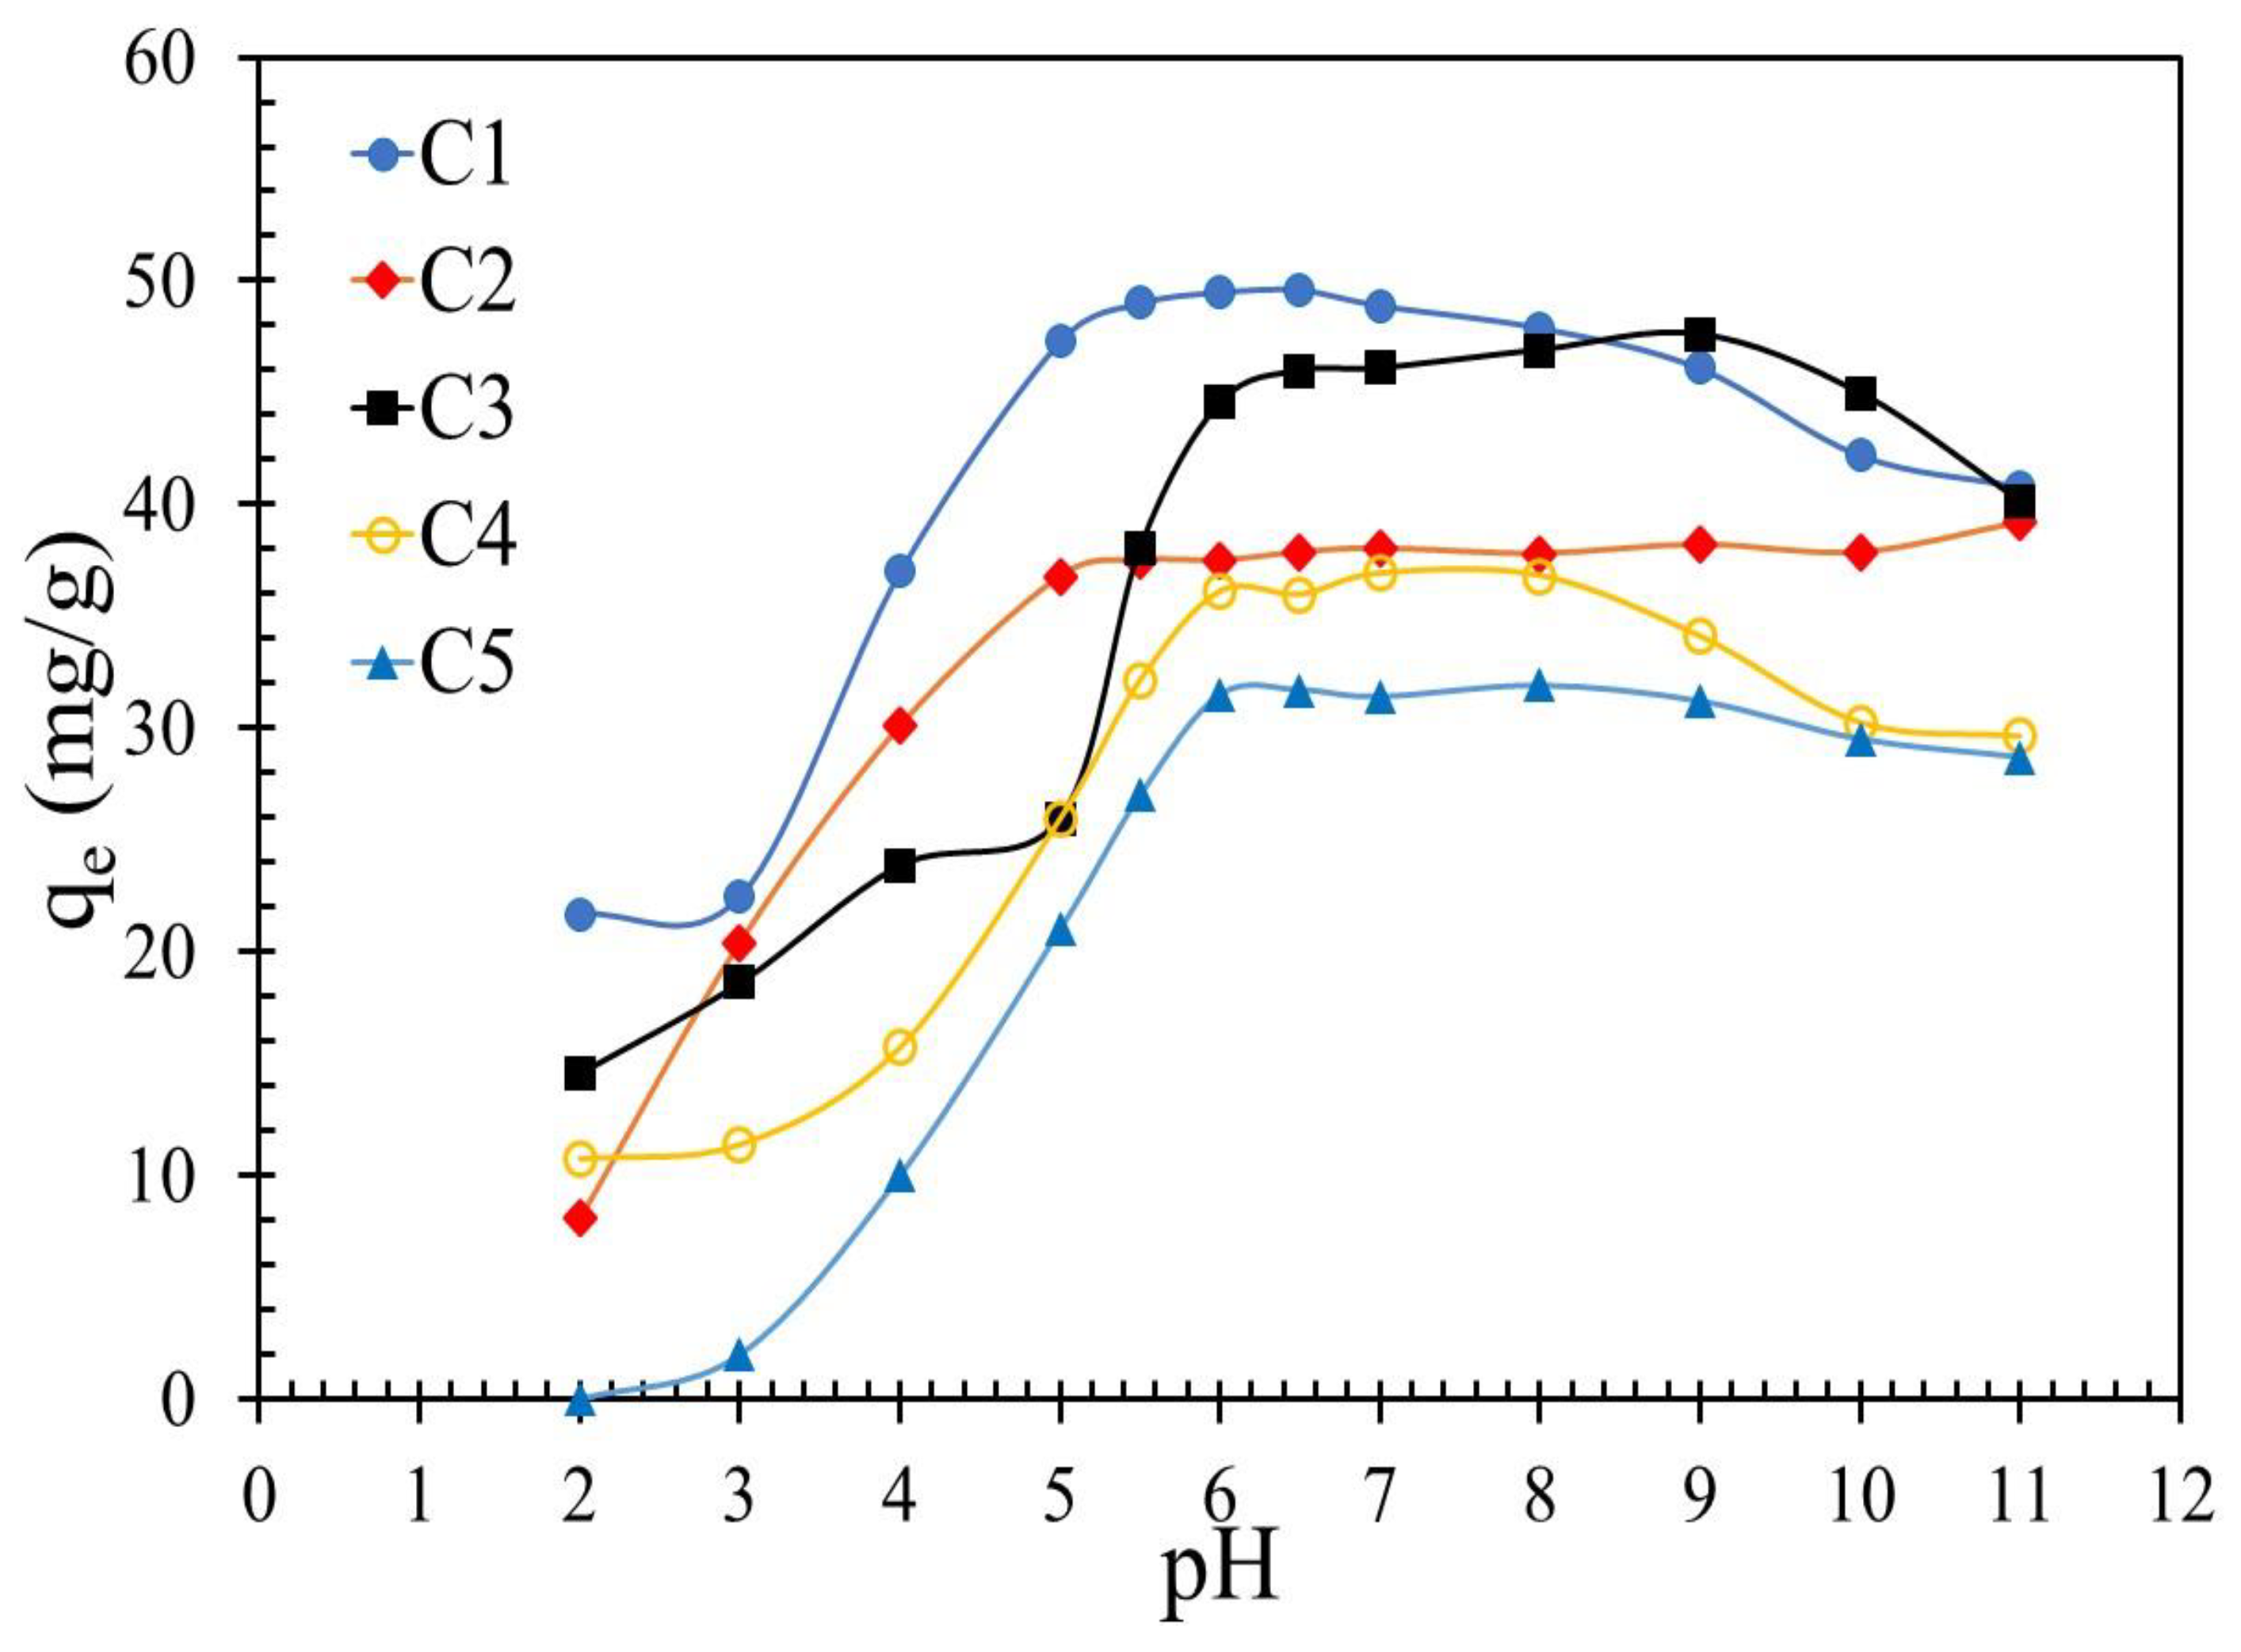
Figure 8 shows the effect of contact time on the adsorption capacity (qt) of studied clays to Pb (II). In the case of palygorskite-rich clays (viz., C1, C3 and C4), qt increases continuously with increasing contact time until equilibrium reached at 5 h and then remained constant. These results indicate that the equilibrium is reached very slowly, which is comparable with the results reported by Potgieter et al. [37] for pure palygorskite, which was found to be 30 min for concentrations of Pb (II) from 20–100 mg/L. A similar trend was observed with montmorillonite-rich clay, where the equilibrium time (150 min) was longer than that (100 min for Pb concentration = 150 mg/L) observed by Zhang et al. [38]. The difference may be due to the not well exposed adsorption sites on palygorskite because of existence of other minerals on the surface of this type of clays (see SEM, Figure 6b). It may also be referred to the involvement of palygorskite in competitive adsorption with other minerals. However, the adsorption of Pb onto the calcite-rich clay (C5) reaches the equilibrium faster (namely at 31 min) than either the palygorskite- or montmorillonite-rich clays. This ensures that the adsorption nature of Pb (II) onto C5 clay is clearly different than that observed on other clays, which is due to the existence of high amounts of calcite in this clay [39].

3.4.2. Effect of pH

Figure 9 depicts the effect of pH on the adsorption of Pb (II) onto different clays in the study over the pH range 2–11. In general, the adsorption amount (qe) of Pb (II) onto C1, C3 and C4 clays tends to increase slowly at pH ˂ 4 and increase sharply at pH range ca. 4–6. It can also be seen that qe reaches a plateau at pH range 6–8 and then decreases slightly when increasing the pH ˃ 9. Such a trend of qe versus pH of C1, C3 and C4 clays can be attributed to the existence of palygorskite as the dominant mineral in these clays. Several authors reported a similar trend for adsorption of Pb(II) onto neat palygorskite [40,41]. Moreover, in the case of C1 clay, qe reaches its maximum at lower pH (viz., 5), which seems to be linked with the lower point of zero charge (P.Z.C = 4.4), compared to that of the C3 and C4 clays (namely, 9.0 and 7.6, respectively). On the other hand, the surface of the clay is negatively charged at pH ˃ P.Z.C and the increase in pH leads to increase in the negativity and thus to increase the Pb (II) adsorption until a plateau is reached. On the other hand, the removal of Pb (II) by C2 clay increases dramatically as the pH of the solution increases and even reaches equilibrium at pH 5, attributed mostly to its lower P.Z.C = 3.8 than the other clays. However, the removal of Pb (II) by C5 is negligible at pH 2 while it increases sharply as the initial pH of solution increases from 3 to 6, and then reaches a plateau at pH ≥ 6. The results obtained suggest that the adsorption of Pb (II) on C5 clay follows the precipitation reaction due to the presence of high amounts of calcite in the sample [42].

3.4.3. Adsorption Isotherm

The adsorption isotherms of Pb (II) onto different clays in the study are shown in Figure 10. In the case of C1, C2, C3 and C4 clays, the adsorption isotherms can be assigned to Langmuir L-type, which started with the steep initial portion followed by the plateau covering a wide range of equilibrium concentrations, especially in the case of C2 clay. The L-shaped (Langmuir) isotherm is characterized by a decreasing of slope as the concentration increases since vacant adsorption sites decrease as the adsorbent becomes covered. Such adsorption behavior could be explained by the high affinity of the adsorbent for the adsorbate at low concentrations, which then decreases as the concentration increases. In the present study, the observed L-type isotherm can be attributed to the existence of high amounts of palygorskite and montmorillonite in these clays, where previous studies declared that the adsorption of Pb (II) on neat palygorskite and neat montmorillonite obeyed L-type isotherms [38,41,43].
However, the adsorption isotherm from the C5 clay is near to S-type, where with an S-type isotherm the slope initially increases with adsorbate concentration, but eventually decreases and becomes zero as vacant adsorbent sites are filled [44]. This type of isotherm indicates that, at a low concentration, the surface has a low affinity for the adsorbate, which increases at higher concentrations. This trend can be attributed to the existence of different minerals in this clay and to the fact that calcite is the dominant mineral in the sample with 39%.
The adsorption data of lead onto different clays in the study were correlated using different four models equations—namely, Langmuir [45,46], Freundlich [47,48], Temkin [49,50,51] and Dubinin–Radushkevich [52,53,54,55,56,57].
The Langmuir model assumes the formation of a monolayer adsorbate on the outer surface of the adsorbent and uniform energies of adsorption onto the surface and no migration of adsorbate on the surface of adsorbent [45,46]. The linear form of Langmuir equation (Equation (2)) is given as:
C e q e =   1 bq max +   C e q max
where qe is the equilibrium capacity concentration of adsorbate (lead solution) on adsorbent (clay) (mg/g), Ce is the equilibrium concentration of adsorbate in solution (mg/L), qmax is the maximum monolayer adsorption capacity of adsorbent and b is the Langmuir adsorption constant (L/mg), which is related to free energy of adsorption.
The Freundlich model assumes the adsorption characteristics for the heterogeneous surface [47,48]. The linear form of model can be written as the following (Equation (3)):
log q e =   log K f +   1 n log C e
where Kf (L/g) and n (dimensionless) are Freundlich isotherm constants, which incorporate the factors affecting adsorption capacity and intensity, respectively.
On the other hand, the Temkin model suggests that heat of adsorption of all molecules in the layer decreases linearly rather than logarithmically with coverage and a uniform distribution of bounding energies up to a certain maximum value [49,50,51]. The model is given by the following linear equation (Equation (4)):
q e =   B   lnA +   B ln C e
where A is the Temkin isotherm equilibrium binding constant (L/g) and B is a constant related to the heat of adsorption and is given by Equation (5) as follows:
B =   RT L
L is the Temkin isotherm constant (J/mol), T is the absolute temperature and R is the general gas constant (8.31 J/mol K).
Furthermore, the Dubinin–Radushkevich (D-R) isotherm model was used to correlate the adsorption data in the present work, where the model generally expresses the adsorption mechanism with a Gaussian energy distribution onto a heterogeneous surface [52,53,54,55,56,57]. The model has often successfully fitted the intermediate range of concentration data well and high solute activities, where its linearized equation form (Equation (6)) can be written as follows:
lnq e =   ln q s   β ε 2
where qe is the amount of adsorbate in the adsorbent at equilibrium (mg/g); qs is the theoretical isotherm saturation capacity (mg/g); β (mol2/KJ2) is the activity coefficient, which is useful in obtaining the mean sorption energy E (KJ/mol), which can be expressed by Equation (7).
E =   1 2 β
where ԑ is the Dubinin–Radushkevich isotherm polanyi potential constant and it is given by Equation (8) as a function of the equilibrium concentration of adsorbate in solution (Ce) (mg/L) [41,42,43,44,45,46].
ε = RTln [ 1 + 1 C e ]
Table 4 reports the various parameters calculated from the fitting of Pb(II) adsorption data to the four models. As seen from Table 4 and Figure 11a–e, the Langmuir isotherm best describes the uptake of Pb (II) ions onto the C1, C2, C3 and C4 clays (r2 ca. 0.99) (Figure 11a), which suggests that Pb (II) adsorbed onto clay-uniform sites. The maximum monolayer (qmax) adsorption capacity for the uptake of Pb (II) ions was found to be 74.07 mg/g for C1 clay, which can be attributed to the presence of high amounts of palygorskite in this sample and its high surface area [40]. On the other hand, the multilayer adsorption model (Freundlich, Figure 11b) and adsorbent–adsorbate interaction model (Temkin, Figure 11c) may also play an important role in the lead uptake onto C1, C3 and C4 clays (r2 for Freundlich is ca. 0.95 and for Temkin is ca. 0.98). However, in the case of C5, the Temkin adsorption isotherm best described the uptake of Pb (II) ions (r2 value of 0.990) (Figure 11c). The good regression coefficient of the Temkin model for C5 suggests a strong affinity for the sorption of Pb (II) onto calcite, which is a dominant mineral in this clay [42]. Again, our results are consistent with the findings of Rangel-Porras et al. [42], who reported that the adsorption mechanism of Pb (II) onto limestone solid with 41.0% calcite can be better described by the Temkin model. Moreover, we cannot neglect the fact that the D-R model also fitted the lead adsorption data of C5 clay (r2 of 0.90) better than other clays (Figure 11d and Table 4). In addition, the E value calculated from D-R model of C5 clay was higher than 8 KJ/mol, indicating that the adsorption of Pb (II) ions onto C5 clay is through chemisorption in nature [58].

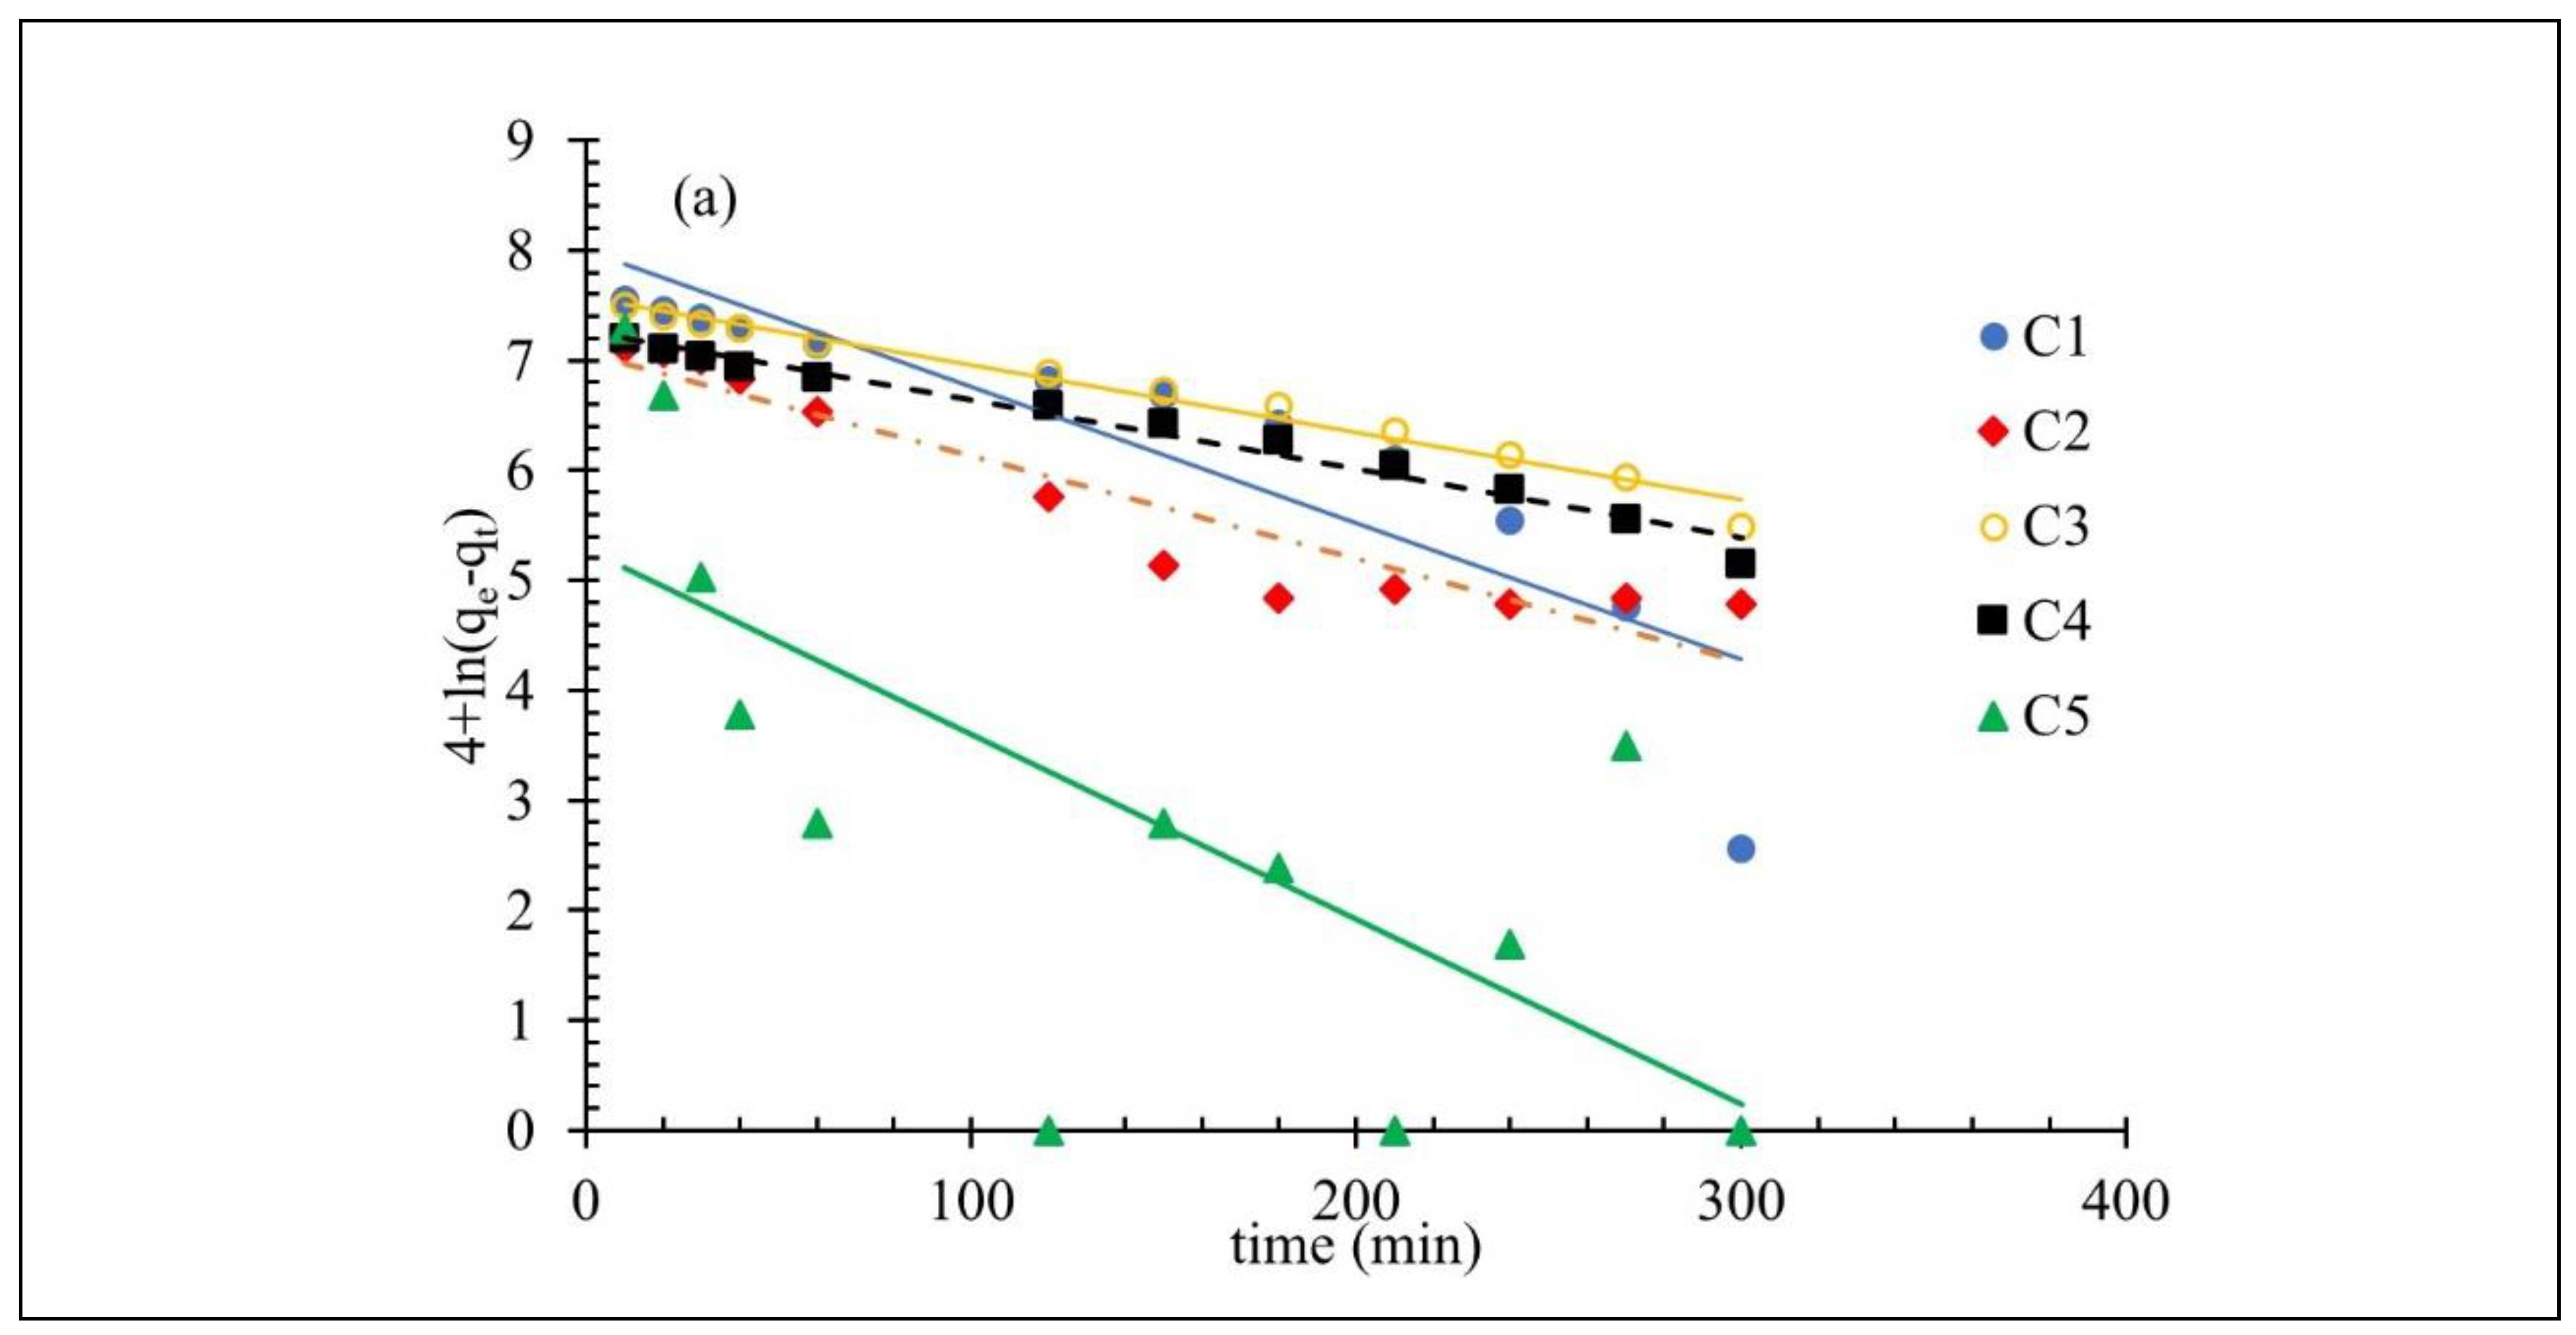
3.4.4. Adsorption Kinetics

Three different kinetic models have been used to investigate the adsorption kinetics of Pb(II) on different clays—namely, Lagergren pseudo-first-order [59], pseudo-second-order [60] and intraparticle diffusion [61]. The linear forms of the three different kinetic model can be written as Equations (9)–(11), respectively:
ln ( q e q t ) =   ln q e   k t
t q t = 1 k 2   q e 2 + t q e
q t =   k i t 0.5 +   C
where qt (mg/g) is the adsorption capacity at time t and k1 (min−1) and k2 (g/mg min), are the rate constants of the pseudo-first-order and pseudo-second-order adsorptions, respectively. ki (mg/g min0.5) is the intraparticle diffusion rate constant and C (mg/g) is a constant.
As shown in Table 5 and Figure 12, the pseudo-second-order rate equation is the best fit model for adsorption of Pb (II) onto different clays in the study, where a good regression coefficient (r2) was obtained for the pseudo-second-order rate kinetic model compared with the pseudo-first-order and intraparticle diffusion kinetics models. It suggests that chemical adsorption is the rate controlling step of adsorption of Pb (II) onto different clays in the study, even though these clays contain different type of minerals with different weight percentages [62,63]. In addition, the values of intercept C of all clays (Table 5), as estimated by Equation (11), were not zero, which indicates that intraparticle diffusion is not the controlling rate determining step in adsorption of Pb (II) onto different clays [64].

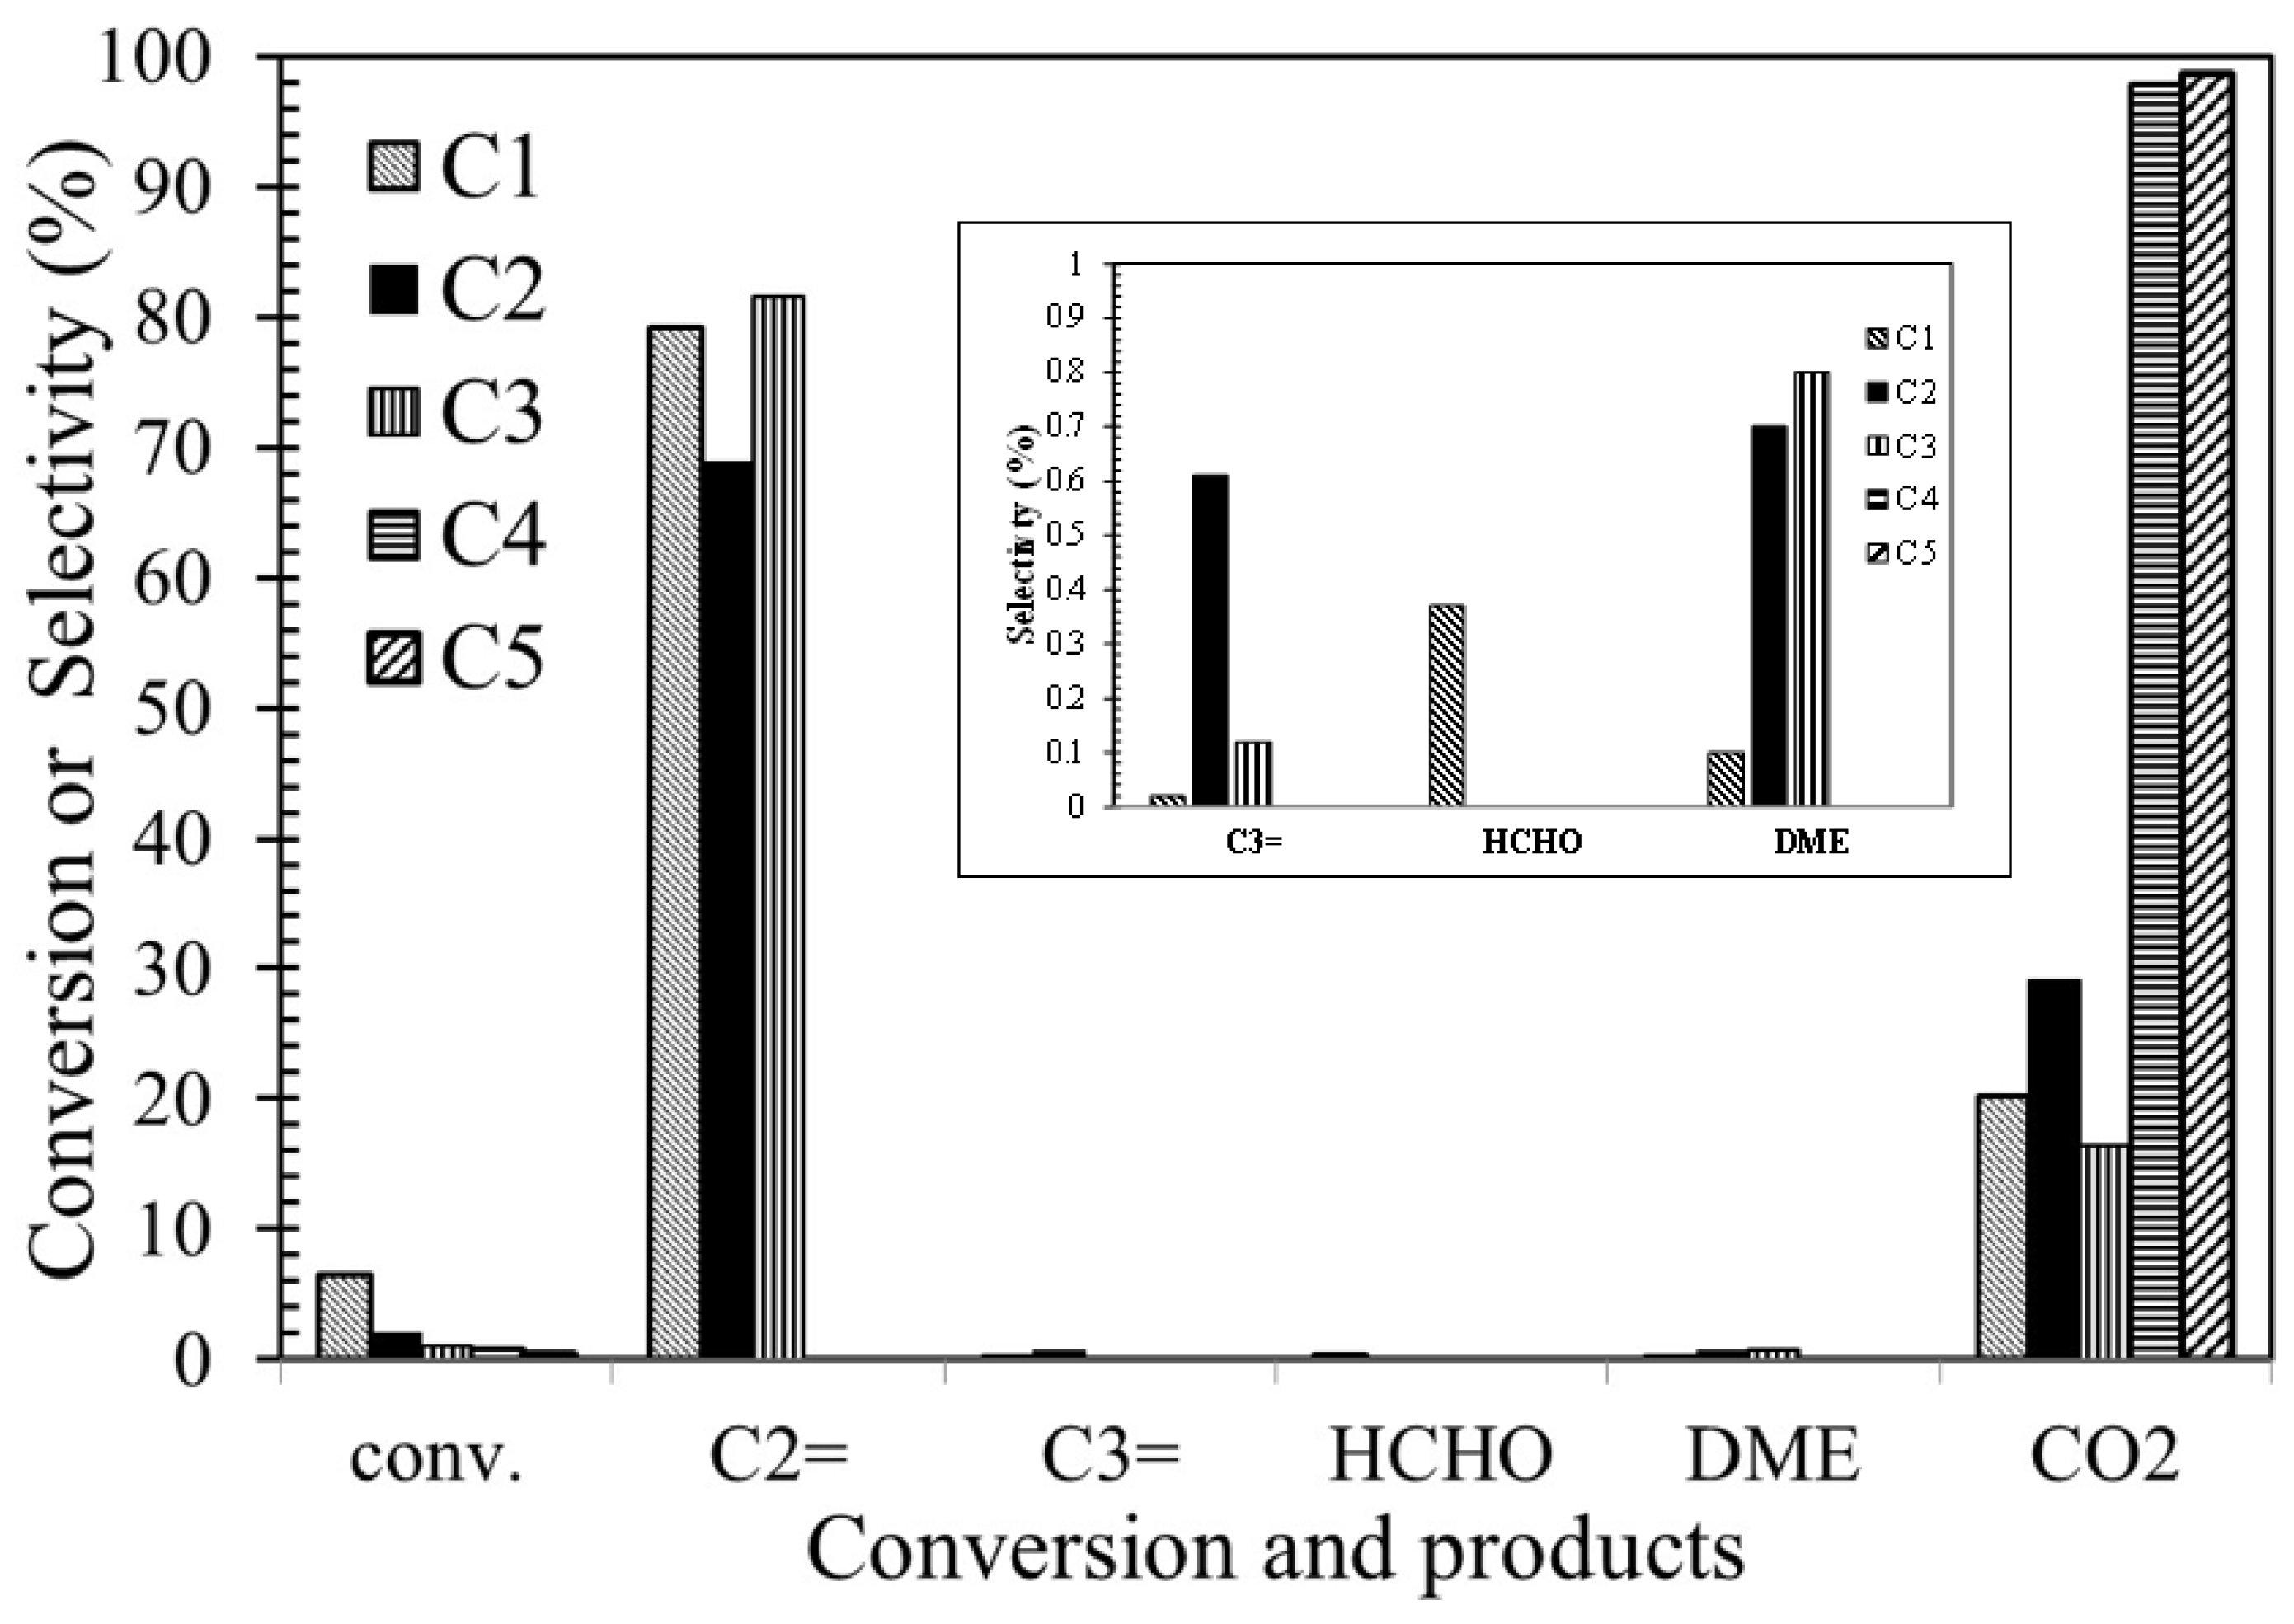
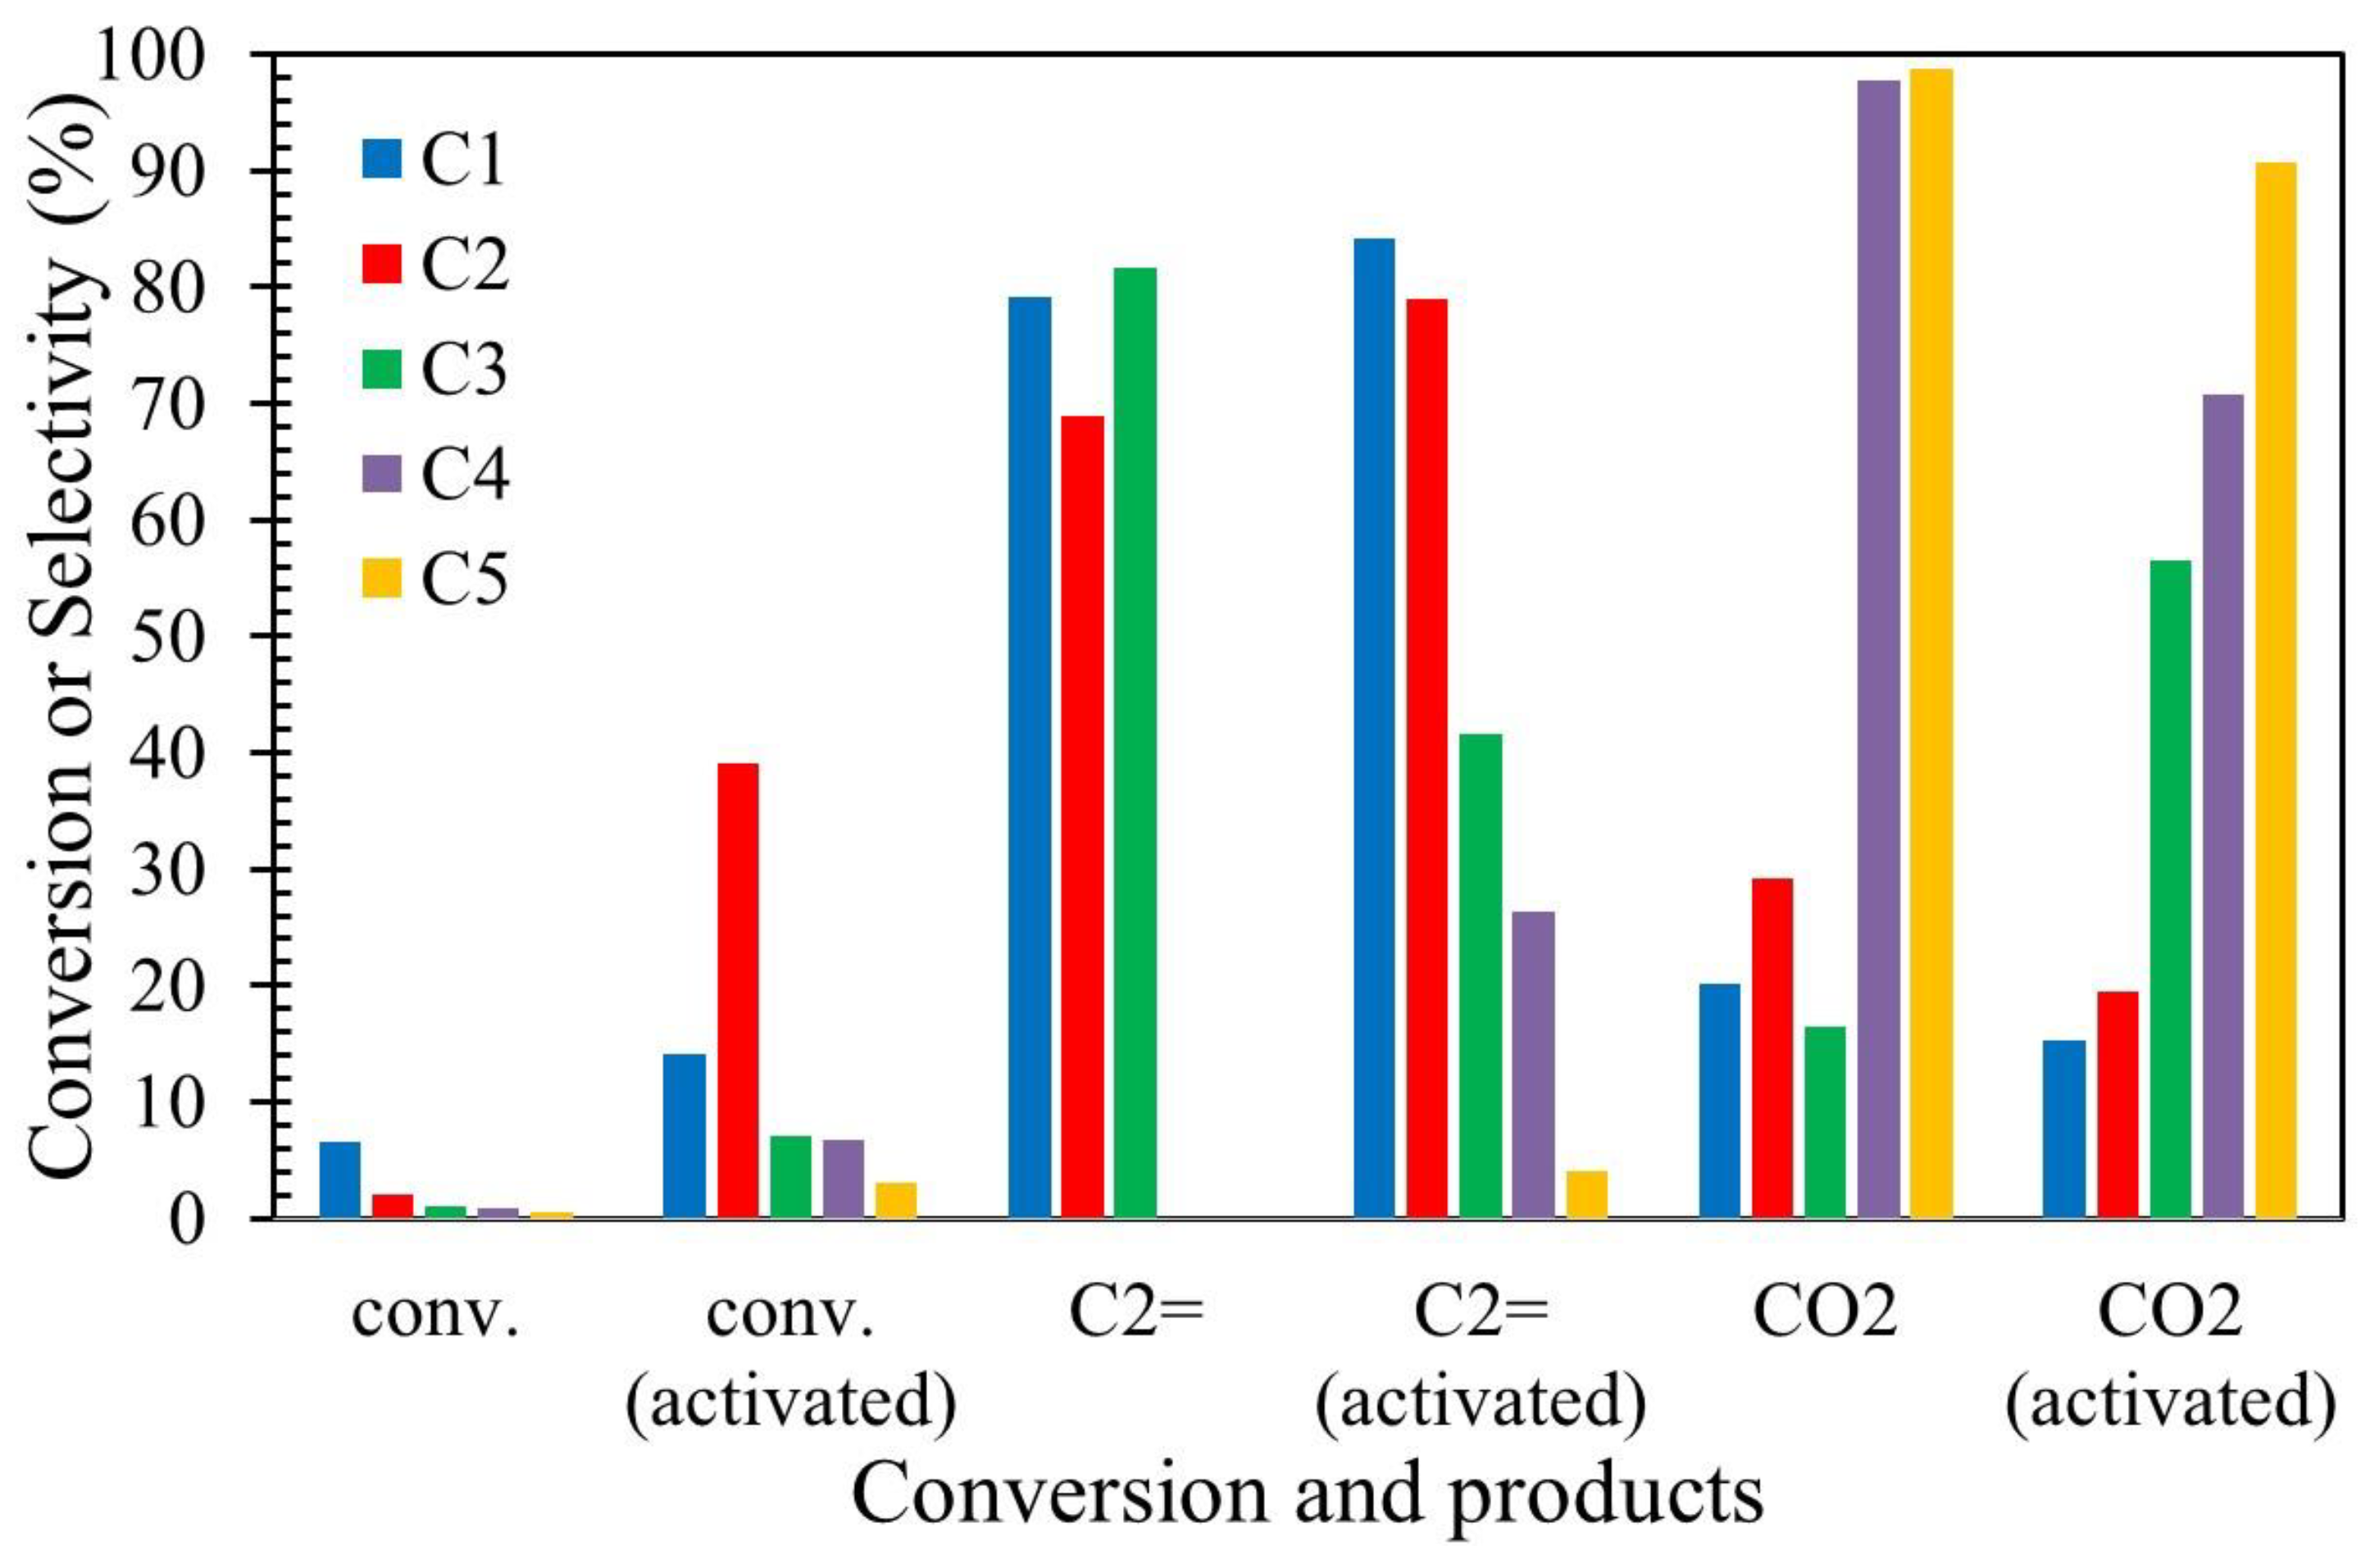
3.5. Catalytic Conversion of Methanol

The results of methanol conversion over the tested clays and selectivity to products are gathered in Figure 13. Ethylene, propylene, dimethyl ether (DME), formaldehyde and CO2 are the reaction products detected. Eventually, C1 and C2 clays were found to be the more promising clays for production of alkenes. However, the maximum selectivities to ethylene observed over C1 and C2 clays were 79.2% and 68.9% respectively, with conversion of 6.6% and 2.1%. It is well known that selectivity of clay to alkene formation is related to the number of strong acidic centers [65]. In this sense, the higher selectivity of C1 and C2 clays for production of ethylene can be attributed to their acidic nature (see Figure 7a). Additionally, the narrow pore dimensions (frequent hydraulic radius at ca. 2.0 nm) of these clays may impose a limitation to the chain growth of the produced ethylene, where propylene is the largest hydrocarbon detected but with a low selectivity percentage [66]. According to the above reason, it is acceptable that basic clays (viz., C4 and C5) exhibited low methanol conversion.
On the other hand, activation of Al-Hasa clays with HCl acid enhanced their conversion of methanol and selectivity to ethylene and reduced the CO2 production (Figure 14 and Figure S8), especially for C2 clay (ethylene selectivity was 78.9% with conversion of 39.1%). The maximized methanol conversion and ethylene selectivity of C2 clay can be referred to as the existence of high amounts of montmorillonite in this clay, where Ravichandran and Sivasankar found that treatment of montmorillonite with hydrochloric acid enhanced the conversion of methanol to olefin-rich hydrocarbons [67].

4. Conclusions

Palygorskite and montmorillonite are the dominant phyllosilicate minerals in Al-Hasa oasis clays; the simultaneous occurrence of palygorskite and montmorillonite in the same clay is rare. In addition, varying amounts of illite, kaolinite and chlorite also coexist in the clay. However, quartz and calcite are the dominant nonphyllosilicate mineral in Al-Hasa clays. Thermal gravimetric analysis of these clays indicated that these clays could resist dehydroxylation of the octahedral sheets up to 470°C. Differences in specific surface area and porosity of Al-Hasa clays samples were observed, which are harmonious with the mineralogical composition of these samples and affect their catalytic performance in conversion of methanol to ethylene. The quantification of the P.Z.C of these clays by potentiometric titration depicted the contribution of electrostatic and cation exchange mechanisms in retention of lead by phyllosilicate clays. Clay was collected from a cultivated area grown with palm trees over fifteen years, in which palygorskite-rich clay was found to have the highest affinity for lead removal. Al-Hasa clay has the largest lead adsorption capacity (74.07 mg/g) in comparison with other values [3] reported for Saudi clays—namely, Tabuk clay, 30 mg/g, Baha clay, ca. 24 mg/g and Khaiber clay, ca. 10 mg/g. The Langmuir model expressed the adsorption process in the case of palygorskite- and montmorillonite-rich clays; however, the Temkin model represented the adsorption process of calcite-rich clay. In addition, adsorption kinetic experiments indicated that Pb (II) adsorption onto different clays was well described by the pseudo-second-order kinetic model without contribution from film diffusion. Furthermore, the acidic clay sample containing high amounts of montmorillonite exhibited a higher catalytic performance in dehydration of methanol to ethylene. Acidification of this clay by HCl resulted in improvement regarding the conversion of methanol to ethylene.

Supplementary Materials

The following are available online at https://www.mdpi.com/2076-3417/10/24/9016/s1, Figure S1: Localization of Al-Hasa oasis in Saudi Arabia, Figure S2: Localization of in the study clays soil-sites in Al-Hasa oasis, Figure S3: Typical titration curves of 25 mL 0.004 mol L−1 HCl + 25 m L 0.02 mol L−1 KCl. Titration with 0.042 mol L−1 KOH in the absence (□, curve) and in the presence (■, curve) of clay (a) C1, Figure S4: Typical titration curves of 25 mL 0.004 mol L−1 HCl + 25 m L 0.02 mol L−1 KCl. Titration with 0.042 mol L−1 KOH in the absence (□, curve) and in the presence (■, curve) of clay (b) C2. Figure S5: Typical titration curves of 25 mL 0.004 mol L−1 HCl + 25 m L 0.02 mol L−1 KCl. Titration with 0.042 mol L−1 KOH in the absence (□, curve) and in the presence (■, curve) of clay (c) C3. Figure S6: Typical titration curves of 25 mL 0.004 mol L−1 HCl + 25 m L 0.02 mol L−1 KCl. Titration with 0.042 mol L−1 KOH in the absence (□, curve) and in the presence (■, curve) of clay (d) C4, Figure S7: Typical titration curves of 25 mL 0.004 mol L−1 HCl + 25 m L 0.02 mol L−1 KCl. Titration with 0.042 mol L−1 KOH in the absence (□, curve) and in the presence (■, curve) of clay (e) C5. Figure S8. Catalytic performances (conversion (%) and selectivity (%)) of acid-activated clays understudy in methanol dehydration (ethylene (C2=), propylene (C3=), formaldehyde (HCHO), dimethyether (DME) and carbon dioxide (CO2)).

Author Contributions

H.M.A. and I.A.A.-H. conceived and planned the experiments; H.M.A. and I.A.A.-H. carried out experiments and the characterization of the samples; H.M.A. and S.A.H. contributed to the analysis and interpretation of the results; H.M.A. wrote the manuscript with input from all authors; S.A.H. revised the manuscript. All authors have read and agreed to the published version of the manuscript.

Funding

The authors acknowledge the Deanship of Scientific Research at King Faisal University for the financial support under Nasher Track (Grant No. 186312).

Conflicts of Interest

The authors declare no competing interests.

References

  1. Alandis, N.M.; Mekhamer, W.; Aldaye, O.; Hefne, J.A.A.; Ala, M. Adsorptive applications of montmorillonite clay for the removal of Ag(I) and Cu(II) from aqueous medium. J. Chem. 2019. [Google Scholar] [CrossRef] [Green Version]
  2. Al-Jlil, S.A.; Alsewailem, F.D. Saudi Arabian clays for lead removal in wastewater. Appl. Clay Sci. 2009, 42, 671–674. [Google Scholar] [CrossRef]
  3. Mohsen, Q.; El-Maghraby, A. Characterization and assessment of Saudi clays raw material at different area. Arabian J. Chem. 2012, 3, 271–277. [Google Scholar] [CrossRef] [Green Version]
  4. Shadfan, H.; Mashhady, A.; Eter, A.; Hussen, A.A. Mineral composition of selected soils in Saudi Arabia. J. Plant Nutr. Soil Sci. 1984, 147, 657–668. [Google Scholar] [CrossRef]
  5. Aba-Rusayn, M.M. Mineralogy of AL-Hasa desert soils (Saudi Arabia). Clay Clay Miner. 1977, 25, 138–147. [Google Scholar] [CrossRef]
  6. Lee, S.Y.; Dixon, J.B.; Aba-Husayn, M.M. Mineralogy of Saudi Arabian soils: Eastern Region. Soil Sci. Soc. Am. 1983, 47, 321–326. [Google Scholar] [CrossRef]
  7. Grim, R.E.; Guven, N. Bentonites: Geology, Mineralogy, Properties, and Use. Developments in Sedimentology; Elsevier: Amsterdam, The Netherlands, 1978; Volume 24. [Google Scholar]
  8. Murray, H.H. Traditional and new applications for kaolin, smectite, and palygorskite: A general overview. Appl. Clay Sci. 2000, 17, 207–221. [Google Scholar] [CrossRef]
  9. Bergaya, F.; Theng, B.K.G.; Lagaly, G. Clays in Industry. In Handbook of Clay Science, 1st ed.; Bergaya, F., Theng, B.K.G., Lagaly, G., Eds.; Elsevier: Amsterdam, The Netherlands, 2006; Volume 1, pp. 823–850. [Google Scholar]
  10. Chang, C.D.; Lang, W.H.; Silvestri, A.J. Manufacture of Light Olefins. U.S. Patent 4,062,90, 13 December 1977. [Google Scholar]
  11. Chang, C.D. Methanol conversion to light olefins. Catal. Rev. Sci. Eng. 1984, 26, 323–345. [Google Scholar] [CrossRef]
  12. Dugkhuntod, P.; Wattanakit, C. A comprehensive review of the applications of hierarchical zeolite nanosheets and nanoparticle assemblies in light olefin production. Catalysts 2020, 10, 245. [Google Scholar] [CrossRef] [Green Version]
  13. Galn, E. Properties and applications of palygorskite-sepiolite clays. Clay Miner. 1996, 31, 443–453. [Google Scholar] [CrossRef]
  14. Bridley, G.W. Quantitative X-ray analysis of clays. In Crystal Structures of Clay Minerals and Their X-ray Identification; Brindley, G.W., Brown, G., Eds.; Mineralogical. Society Monograph N.5: London, UK, 1980. [Google Scholar]
  15. Reynolds, R.C. Principles and techniques of quantitative analysis of clay minerals by X-ray powder diffraction. In The Clay Mineral Society CMS Workshop Lectures; Pevear, D.R., Mumpton, F.A., Eds.; Clay Minerals Society: Evergreen, CO, USA, 1989; Volume 1, pp. 4–36. [Google Scholar]
  16. Kita, H.; Henmi, N.; Shimazu, K.; Hattori, H.; Tanabe, K. Measurement of acid–base properties on metal oxide surfaces in aqueous solution. Chem. Soc. Farady Trans. 1981, 1, 2451–2463. [Google Scholar] [CrossRef]
  17. Abendroth, R.P. Behavior of pyrogenic silica in simple electrolytes. J. Colloid Interface Sci. 1970, 34, 591–596. [Google Scholar] [CrossRef]
  18. Brady, P.V.; Walther, J.V. Surface chemistry and silicate dissolution at elevated temperatures. Am. J. Sci. 1992, 292, 639–658. [Google Scholar] [CrossRef]
  19. Huang, C.P.; Stumm, W. Specific adsorption of cations on hydrous-Al2O3. J. Colloid Interface Sci. 1973, 43, 409–420. [Google Scholar] [CrossRef]
  20. Avena, M.J.; De Pauli, C.P. Proton adsorption and electrokinetics of an Argentinean montmorillonite. J. Colloid Interface Sci. 1998, 202, 195–204. [Google Scholar] [CrossRef]
  21. Ward, D.B.; Brady, P.V. Effect of Al and organic acids on the surface chemistry of kaolinite. Clay Clay Miner. 1998, 46, 453–465. [Google Scholar] [CrossRef]
  22. Huertas, F.J.; Chou, L.; Wollast, R. Mechanism of kaolinite dissolution at room temperature and pressure: Part 1. Surface speciation. Geochim. Cosmochim. Acta. 1998, 62, 417–431. [Google Scholar] [CrossRef]
  23. AbdelDayem, H.M.; Al-Shihry, S.S.; Hassan, S.A. Impact of Titanium in Controlling Silver Particle Size on Enhancement of Catalytic Performance of AgMoO3/Ti-HMS for Direct Epoxidation of Propylene. ACS Omega 2020, 5, 4469–4481. [Google Scholar] [CrossRef] [Green Version]
  24. Zatta, L.; Ramos, L.P.; Wypych, F. Acid-activated montmorillonites as heterogeneous catalysts for the esterification of lauric acid with methanol. Appl. Clay Sci. 2013, 80–81, 236–244. [Google Scholar] [CrossRef]
  25. Hart, M.P.; Brown, D.R. Surface acidities and catalytic activities of acid-activated clays. J. Mol. Catal. A Chem. 2004, 212, 315–321. [Google Scholar] [CrossRef]
  26. Baran, B.; ErtÖuk, T.; Sarikaya, Y.; Alemdaroglu, T. Workability test method for metals applied to examine a work ability measure (plastic limit) for clays. Appl. Clay Sci. 2001, 20, 53–63. [Google Scholar] [CrossRef]
  27. Bayram, H.; Önal, M.; Üstünişik, G.; Sarikaya, Y. Some thermal characteristics of a mineral mixture of palygorskite, metahalloysite, magnesite and dolomite. J. Therm. Anal. Calorim. 2007, 89, 169–174. [Google Scholar] [CrossRef]
  28. Frost, R.L.; Ding, Z. Controlled rate thermal analysis and differential scanning calorimetry of sepiolites and palygorskites. Thermochim. Acta 2003, 397, 119–128. [Google Scholar] [CrossRef] [Green Version]
  29. Brigatti, M.F.; Laurora, A.; Malferrari, D.; Medici, L.; Poppi, L. Adsorption of [Al(Urea)6]3+ and [Cr(Urea)6]3+ complexes in the vermiculite interlayer. Appl. Clay Sci. 2005, 30, 21–32. [Google Scholar] [CrossRef]
  30. Sing, K.S.W. Reporting physisorption data for gas/solid systems with special reference to the determination of surface area and porosity. Pure Appl. Chem. 1985, 57, 6013–6019. [Google Scholar] [CrossRef]
  31. Brunauer, S.; Emmett, P.H.; Teller, E. Adsorption of gases in multimolecular layers. J. Am. Chem. Soc. 1938, 60, 309–319. [Google Scholar] [CrossRef]
  32. Barrett, E.; Joyner, P.; Halenda, P.P. The determination of pore volume and area distributions in porous substances: I. computations from nitrogen isotherms. J. Am. Chem. Soc. 1938, 73, 373–380. [Google Scholar] [CrossRef]
  33. Ledoux, R.L.; White, J.L. Infrared studies of the hydroxyl groups in intercalated kaolinite complexes. Clay Clay Miner. 1964, 13, 289–315. [Google Scholar] [CrossRef]
  34. Russell, J.D.; Frase, A.R. IR spectroscopic evidence for interaction between hydronium ions and lattice OH groups in montmorillonite. Clay Clay Miner. 1971, 19, 55–59. [Google Scholar] [CrossRef]
  35. Tyagi, B.; Chudasama, C.D.; Jasra, R.V. Determination of structural modification in acid activated montmorillonite clay by FT-IR spectroscopy. Spectrochim. Acta A 2006, 64, 273–278. [Google Scholar] [CrossRef]
  36. Douiri, H.; Louati, S.; Baklouti, S.; Arous, M.; Fakhfakh, Z. Structural and dielectric comparative studies of geopolymers prepared with metakaolin and Tunisian natural clay. Appl. Clay Sci. 2017, 139, 40–44. [Google Scholar] [CrossRef]
  37. Potgieter, J.P.; Potgieter-Vermaak, S.S.; Kalibantonga, P.D. Heavy metals removal from solution by palygorskite clay. Miner. Energy 2006, 19, 463–470. [Google Scholar] [CrossRef]
  38. Zhang, S.Q.; Huo, W.G. Adsorption behavior of Pb (II) on montmorillonite. Colloid Surf. A Physico. Chem. Eng. Asp. 2008, 320, 92–97. [Google Scholar] [CrossRef]
  39. Godelitsas, A.; Astilleros, J.M.; Hallam, K.; Harissopoulos, S.; Putnis, A. Interaction of calcium carbonates with lead in aqueous solutions. Environ. Sci. Technol. 2003, 37, 3351–3360. [Google Scholar] [CrossRef] [PubMed] [Green Version]
  40. Fan, Q.; Li, Z.; Zhao, H.; Jia, Z.; Xu, J.; Wu, W. Adsorption of Pb (II) on palygorskite from aqueous solution: Effect of pH, ionic strength and temperature. Appl. Clay Sci. 2009, 45, 111–116. [Google Scholar] [CrossRef]
  41. Chen, H.; Wang, B. Kinetic and isothermal studies of lead ion adsorption onto palygorskite clay. J. Colloid Interface Sci. 2007, 307, 309–316. [Google Scholar] [CrossRef] [PubMed]
  42. Rangel-Porras, G.; García-Magno, J.B.; González-Muñoz, M.P. Lead and cadmium immobilization on calcitic limestone materials. Desalination 2010, 262, 1–10. [Google Scholar] [CrossRef]
  43. Chu, Y.; Khan, M.A.; Wang, F.; Xia, M.; Lei, W.; Zhu, S. Kinetics and equilibrium isotherms of adsorption of Pb (II) and Cu (II) onto raw and arginine-modified montmorillonite. Adv. Powder Technol. 2019, 30, 1067–1078. [Google Scholar] [CrossRef]
  44. Giles, C.H.; Smith, D. A general treatment and classification of the solute adsorption isotherm I. theoretical. J. Colloid Interface Sci. 1974, 47, 755–765. [Google Scholar] [CrossRef]
  45. Langmuir, I. The constitution and fundamental properties of solids and liquids. Part I. solids. J. Am. Chem. Soc. 1916, 38, 2221–2295. [Google Scholar] [CrossRef] [Green Version]
  46. Hall, K.R.; Eagleton, L.C.; Acrivos, A.; Vermeulen, T. Pore- and solid-diffusion kinetics in fixed-bed adsorption under constant-pattern conditions. Ind. Eng. Chem. Fundam. 1966, 5, 212–223. [Google Scholar] [CrossRef]
  47. Freundlich, H.M.F. Over the Adsorption in Solution. Z. Phys. Chem. 1906, 57, 385–471. [Google Scholar]
  48. Hutson, N.D.; Yang, R.T. Theoretical basis for the Dubinin-Radushkevitch (D-R) adsorption isotherm equation. Adsorption 2000, 3, 189–195. [Google Scholar] [CrossRef]
  49. Temkin, M.I.; Pyzhev, V. Kinetic of Ammonia Synthesis on Promoted Iron Catalyst. Acta Physicochim. Chem. URSS 1940, 12, 327–356. [Google Scholar]
  50. Mahamdi, C.; Nharingo, C. Utilization of water hyacinth weed (Eichhornia crassipes) for the removal of Pb(II), Cd(II) and Zn(II) from aquatic environments: An adsorption isotherm study. Environ. Technol. 2010, 31, 1221–1228. [Google Scholar] [CrossRef]
  51. Aharoni, C.; Ungarish, M. Kinetics of activated chemisorption. Part 2. Theoretical models. J. Chem. Soc. Faraday Trans. 1977, 73, 456–464. [Google Scholar] [CrossRef]
  52. Dubinin, M.M.; Radushevich, L.V. The equation of the characteristic curve of the activated charcoal. Proc. Acad. Sci. USSR Phys. Chem. Sect. 1947, 55, 331–337. [Google Scholar]
  53. Foo, K.Y.; Hameed, B.H. Insights into the modeling of adsorption isotherm systems. Rev. Chem. Eng. J. 2010, 156, 2–10. [Google Scholar] [CrossRef]
  54. Gunay, A.; Arslankaya, E.; Tosun, I. Lead removal from aqueous solution by natural and pretreated clinoptilolite: Adsorption equilibrium and kinetics. J. Hazard. Mater. 2007, 146, 362–371. [Google Scholar] [CrossRef]
  55. Dabrowski, A. Adsorption-from theory to practice. Adv. Colloid Interface Sci. 2001, 93, 135–224. [Google Scholar] [CrossRef]
  56. Dubinin, M.M. The potential theory of adsorption of gases and vapors for adsorbents with energetically non-uniform surface. Chem. Rev. 1960, 60, 235–266. [Google Scholar] [CrossRef]
  57. Hobson, J.P. Physical adsorption isotherms extending from ultra-high vacuum to vapor pressure. J. Phys. Chem. 1969, 73, 2720–2727. [Google Scholar] [CrossRef]
  58. Monika, J.; Garg, V.; Kadirvelu, K. Chromium (VI) removal from aqueous solution, using sunflower stem waste. J. Hazard. Mater. 2008, 162, 365–372. [Google Scholar]
  59. Lagergren, S. Zur theorie der sogenannten adsorption gelöster stoffe. K. Sven. Vetensk. Handl. 1898, 24, 1–39. [Google Scholar]
  60. Ho, Y.S.; McKay, G. Pseudo-second order model for sorption processes. Proc. Biochem. 1999, 34, 451–465. [Google Scholar] [CrossRef]
  61. Weber, W.J., Jr.; Morriss, J.C.; Sanitary, J. Kinetics of adsorption on carbon from solution. J. Eng. Div. Am. Soc. Civ. Eng. 1963, 89, 31–38. [Google Scholar]
  62. Baskaralingam, P.; Pulikesi, M.; Elango, D.; Ramamurthi, V.; Sivanesan, S. Adsorption of acid dye onto organobentonite. J. Hazard. Mater. 2006, 128, 138–144. [Google Scholar] [CrossRef]
  63. Guibal, E.; Milot, C.; Tobin, J.M. Metal anion sorption by chitosan beads: Equilibrium and kinetic studies. Ind. Eng. Chem. Res. 1998, 37, 1454–1463. [Google Scholar] [CrossRef]
  64. Gupta, S.S.; Bhattacharyya, K.G. Adsorption of Ni (II) on Clays. J. Colloid Interface Sci. 2006, 295, 21–32. [Google Scholar] [CrossRef]
  65. Derouane, E.D.; Chang, C.D. Confinement effects in the adsorption of simple bases by zeolites. Micropor. Mesopr. Mater. 2000, 35/36, 425–433. [Google Scholar] [CrossRef]
  66. Cheng, S.; Peng, G.Z.; Clearfield, A. Decomposition of alcohols over zirconium and titanium phosphates. Ind. Eng. Chem. Res. Dev. 1984, 23, 219–225. [Google Scholar] [CrossRef]
  67. Ravichandran, J.; Sivasankar, B. Properties and catalytic activity of acid-modified montmorillonite and vermiculite. Clay Clay Miner. 1997, 45, 854–858. [Google Scholar] [CrossRef]
Figure 1. Powder X-ray patterns of in the study clays. Minerals denoted as (●) montmorillonite, (○) palygorskite, (+) calcite, (■) quartz, (◊) illite, (□) kaolinite, (‡) chlorite and (*) Al2Si50O103.
Applsci 10 09016 g001
Figure 2. (a) Thermogravimetric analysis (TGA) curves of C1, C2 and C3 clays. (b). TGA curves of C4 and C5 clays.
Applsci 10 09016 g002
Figure 3. Differential thermogravimetric analysis (dTGA) curves for in the study clays.
Applsci 10 09016 g003
Figure 4. Nitrogen adsorption–desorption isotherms for C1, C2 and C5 clays.
Applsci 10 09016 g004
Figure 5. Pore size distribution curves for in the study clays.
Applsci 10 09016 g005
Figure 6. SEM images for in the study clays: (a) C1, (b) C2, (c) C3, (d) C4 and (e) C5.
Applsci 10 09016 g006aApplsci 10 09016 g006b
Figure 7. Dependence of log ∆ΓO (amount of acid) and log ∆ΓH+ (amount of base) on pH for (a) C1 and C2 clays, (b) C3 clay and (c) C4 and C5 clays.
Applsci 10 09016 g007aApplsci 10 09016 g007b
Figure 8. Effect of contact time on Pb (II) adsorption onto clays in the study; agitation speed (130 rpm), temperature (25 °C), pH 6 and initial adsorbate concentration (300 mg/L).
Applsci 10 09016 g008
Figure 9. Initial pH effects on the amount (mg/g) of Pb (II) removed by different clays in the study; agitation speed (130 rpm), contact time 6 h, temperature (25 °C) and initial adsorbate concentration (300 mg/L).
Applsci 10 09016 g009
Figure 10. Adsorption isotherms of lead onto clays in the study; agitation speed (130 rpm), contact time 6 h, pH 6 and temperature 25 °C.
Applsci 10 09016 g010
Figure 11. Statistical fitting of data from adsorption isotherms for lead onto different clays using different models: (a) Langmuir, (b) Freundlich, (c) Temkin and (d) Dubinin–Radushkevich (D-R).
Applsci 10 09016 g011
Figure 12. Statistical fitting of data from adsorption of lead onto different clays using different kinetic models: (a) pseudo first order, (b) pseudo second order, (c) intraparticle diffusion.
Applsci 10 09016 g012aApplsci 10 09016 g012b
Figure 13. Catalytic performance (conversion (%) and selectivity (%)) of different clays in the study in methanol dehydration. Ethylene (C2=), propylene (C3=), formaldehyde (HCHO), dimethylether (DME) and carbon dioxide (CO2).
Applsci 10 09016 g013
Figure 14. Comparison between the performances (conversion and selectivity to ethylene (C2= and CO2) of neat clays in the study and those of the same clay samples activated by acid in methanol dehydration.
Applsci 10 09016 g014
Table 1. Mineralogy composition of the in the study clays from X-ray powder diffraction (XRD) analysis.
ClayMontmorillonite (%)Chlorite (%)Palygorskite (%)Kaolinite (%)Illite (%)Calcite (%)Quartz (%)
C1016192801
C273096741
C3615792061
C4255479221
C5100271033911
Table 2. Chemical composition of palygorskite as the most dominant mineral in clays (C1, C3, C4 and C5 *) and that of montmorillonite for C2 clay measured by Analytical transmission electron microscopy (ATEM).
Composition\Clay (%)C1 PalygorskiteC2 MontmorilloniteC3 PalygorskiteC4 PalygorskiteC5 Palygorskite
SiO256.8056.0757.2251.5959.82
Al2O313.0424.4413.299.7512.93
Fe2O35.053.385.287.475.6
MgO4.591.885.066.374.99
K2O0.240.240.260.340.28
CaO0.080.100.050.100.10
Cs2O3.7713.21.791.322.89
H2O13.60-16.8023.0013.95
* N.B. Calcite is the most dominant mineral in C5 clay.
Table 3. Surface characteristic parameters (viz., BET surface area (SBET), pore volume (Vp), pore radius (r), cumulative surface area (Scum) and cumulative pore volume (Vcum)) and point of zero charge (P.Z.C) calculated from potentiometric titration of clays in the study.
ClaySBET
(m2/g)
Vp
(cm3/g)
r
(nm)
Scum
(m2/g)
Vcum
(cm3/g)
P.Z.C
C193.740.1773.7851.060.1524.4
C242.750.0853.9749.620.0093.8
C375.010.1313.5034.72 0.1079.0
C490.80.2705.9471.750.2607.6
C563.910.0962.9986.100.1067.1
Table 4. List of estimated parameters from Langmuir, Freundlich, Temkin and Dubinin–Radushkevich (D-R) adsorption models; r2 is the regression coefficient.
Adsorption-ModelConstantsC1C2C3C4C5
Langmuirqmax (mg/g)74.0740.068.0353.4899.01 a
b (L mg−1)0.0080.0270.0070.00600.001 a
r20.9970.9990.9960.9930.607
FreundlichKf1.692.661.350.807.35
n1.682.191.641.560.93
r20.9460.8920.94880.9530.916
TemkinB 14.616.4513.4810.5913.74 b
A (L/g)0.1161.0880.1020.0790.038 b
L (J/mol)169.5384.0183.7233.9186.02 b
r20.9850.9030.9830.9810.990
D-Rβ (mol2/KJ2)0.000040.000010.000040.000070.0005
E (KJ/mol)111.80223.60111.8084.5131.62
qs (mg/g)42.230.2238.1228.5632.56
r20.7580.7690.7560.7530.908
a unreliable value and b reliable value for C5 clay.
Table 5. List of estimated parameters from Lagergren pseudo-first-order, pseudo-second-order and intraparticle diffusion kinetic models; r2 is the regression coefficient.
Kinetic ModelConstantsC1C2C3C4C5
Pseudo-first orderqe (mg/g)53.3621.6235.5026.273.56
k1 (min−1)0.01240.00940.00610.00630.0094
r20.7890.9010.9790.9760.348
Pseudo-second orderqe (mg/g)53.7640.3250.036.9032.47
k2 (g/mg min)0.000340.000940.000270.000390.0028
r20.9930.9990.9900.9900.996
Intraparticleki (mg/g min0.5)1.681.021.571.160.57
diffusionC(mg/g)13.1517.589.677.5920.98
r20.8810.7680.9410.9330.316
Publisher’s Note: MDPI stays neutral with regard to jurisdictional claims in published maps and institutional affiliations.

