Article

A Gravity Search for Oil and Gas and Groundwater in Egypt Using the Strike Angles Derived from EIGEN 6C4

by
Jaroslav Klokočník
1,*,
Jan Kostelecký
2,3,
Lenka Varadzinová
4,
Aleš Bezděk
1,5 and
Gunther Kletetschka
6,7
1
Astronomical Institute, Czech Academy of Sciences, Fričova 298, 251 65 Ondřejov, Czech Republic
2
Research Institute of Geodesy, Topography and Cartography, Ústecká 98, 250 66 Zdiby, Czech Republic
3
Faculty of Mining and Geology, VSB-TU Ostrava, 17. listopadu 2172/15, 708 00 Ostrava, Czech Republic
4
Czech Institute of Egyptology, Faculty of Arts, Charles University, Celetná 20, 110 00 Prague 1, Czech Republic
5
Faculty of Civil Engineering, Czech Technical University in Prague, Thákurova 7, 166 29 Prague 6, Czech Republic
6
Institute of Hydrogeology, Engineering Geology and Applied Geophysics, Faculty of Science, Charles University, Albertov 6, 128 43 Prague 2, Czech Republic
7
Geophysical Institute, University of Alaska—Fairbanks, 903 N Koyukuk Drive, Fairbanks, AK 99709, USA
*
Author to whom correspondence should be addressed.
Appl. Sci. 2020, 10(24), 8950; https://doi.org/10.3390/app10248950
Submission received: 10 November 2020 / Revised: 2 December 2020 / Accepted: 4 December 2020 / Published: 15 December 2020
(This article belongs to the Special Issue Analyses in Geomatics: Processing Spatial Data on History and Today)

Abstract

:
We correlate the gravity aspects (descriptors), namely the strike angles, derived from a recent gravity field model, with the known oil, gas and groundwater deposits/reservoirs and hypothetical paleolakes with the locations of archaeological sites. This allows us to extrapolate the investigation, by analogy, to unknown regions. The gravity aspects, derived from the EIGEN 6C4 gravity field model, are used, together with EMAG 2 magnetic anomalies and ETOPO 1 topography model, for the investigation of oil, gas and water deposits in Egypt. One of the gravity aspects, s/c strike angle, is significantly combed (oriented in one direction locally) in places where the known deposits exist. However, they are combed also in some other places. This may be used as a guide as to where to seek new and promising deposits. Accounting for the combed strike angles and the relationship between gravity anomalies and height differences, we reconstructed potential paleolakes under thick sand layers in the Great Sand Sea, Western Egypt (our previous work), and between Kharga and Toshka, Southern Egypt (this work), consistent with the known archaeological sites.

1. Introduction

The objective of this work is to correlate the gravity aspects (descriptors), namely the strike angles ([1] and references therein), derived from a recent gravity field model (see below), with known oil, gas and groundwater deposits/reservoirs and hypothetical paleolakes with archaeological sites, and then to extrapolate, by analogy, to unexamined regions. The novel application of the specific gravity aspects is a unique approach allowing the detection of near-surface gravity disturbances. The use of specific gravity aspects described further in this work allows the detection of unexpected geological and geophysical features, including the detection of rock stresses and minute density anomalies. Combining these signatures with the archaeology and gas and oil efforts in this region allows new discoveries.
Each density variation under the surface (of the causative body) generates gravity variations and an anomalous gravity signal (gravity aspect changes). We were able to detect, among others, oil and gas localities [1,2] and/or paleolakes in the Sahara [3,4]. Thus far, archaeological sites have been studied by exploration on the ground (field archaeology) or from the air (aerial or satellite images) [5,6]. In [1], we review discoveries of candidates of subglacial volcanoes, lakes and a lake basin, as well as the impact craters on the surface, beneath the ice cover or on the bottom of the ocean (references in Section 2.1 and Section 3.2).
We work with the gravity anomalies Δg but also with the Marussi tensor of the second derivatives of the disturbing geopotential, namely with its radial component Tzz, with the gravity aspects I1 and I2 and their specific ratio I (a 2D indicator causative body), with the virtual deformations vd (they stand for an alternative and concise representation of the Marussi tensor) and with places with more or less one-way oriented (“combed”) vectors of the strike angles θ. All these gravity aspects should be treated together to provide the most representative signature of the gravity sources; this approach moves beyond the use of the traditional gravity anomaly. For definitions of the gravity aspects, explanation of their (geo)physical meaning and examples of various geological features, see [1]—from theory to graphical samples.
The layers of oil, gas and water in the subsurface correlate with the combed strike angles and thus we assume that, gravitationally, this material mixture generates strike angle signatures. Moreover, deeper or wider river valleys are indicated by the gravity aspects, including combed θ. When the river water is filled with sediment (sand, silt, clay), the density of the combined body of fluid (pool) and sediment still contrasts with respect to surrounding rocks due to the significant porosity contrast; this is what we detect (if the contrast is sufficiently large). Then, the pre-existing body of water shows negative Δg and Tzz and specific values of the other gravity aspects, such as those observed, for example, at the Libyan–Egyptian border in the Great Sand Sea (GSS), investigated in [4] or between Kharga in the Western Desert of Egypt and Toshka at the Nile river (investigated here). These signals appear to be preserved for a long time, but endogenous and exogenous forces are transporting masses and, in the course of time, change the local gravity signal.
Locally, for this paper, we use the abbreviation TD for the “target deposit”, meaning here hydrocarbons (oil and gas) and/or groundwater/paleolake.
In Section 2, we outline the theory, method and data that we work with. For additional details, see [1]. In Section 3, we focus on oil and gas deposits. In Section 4, we deal with groundwater and hypothetical paleolakes in relation to archaeological sites.

2. Notes on the Theory, Method and Data

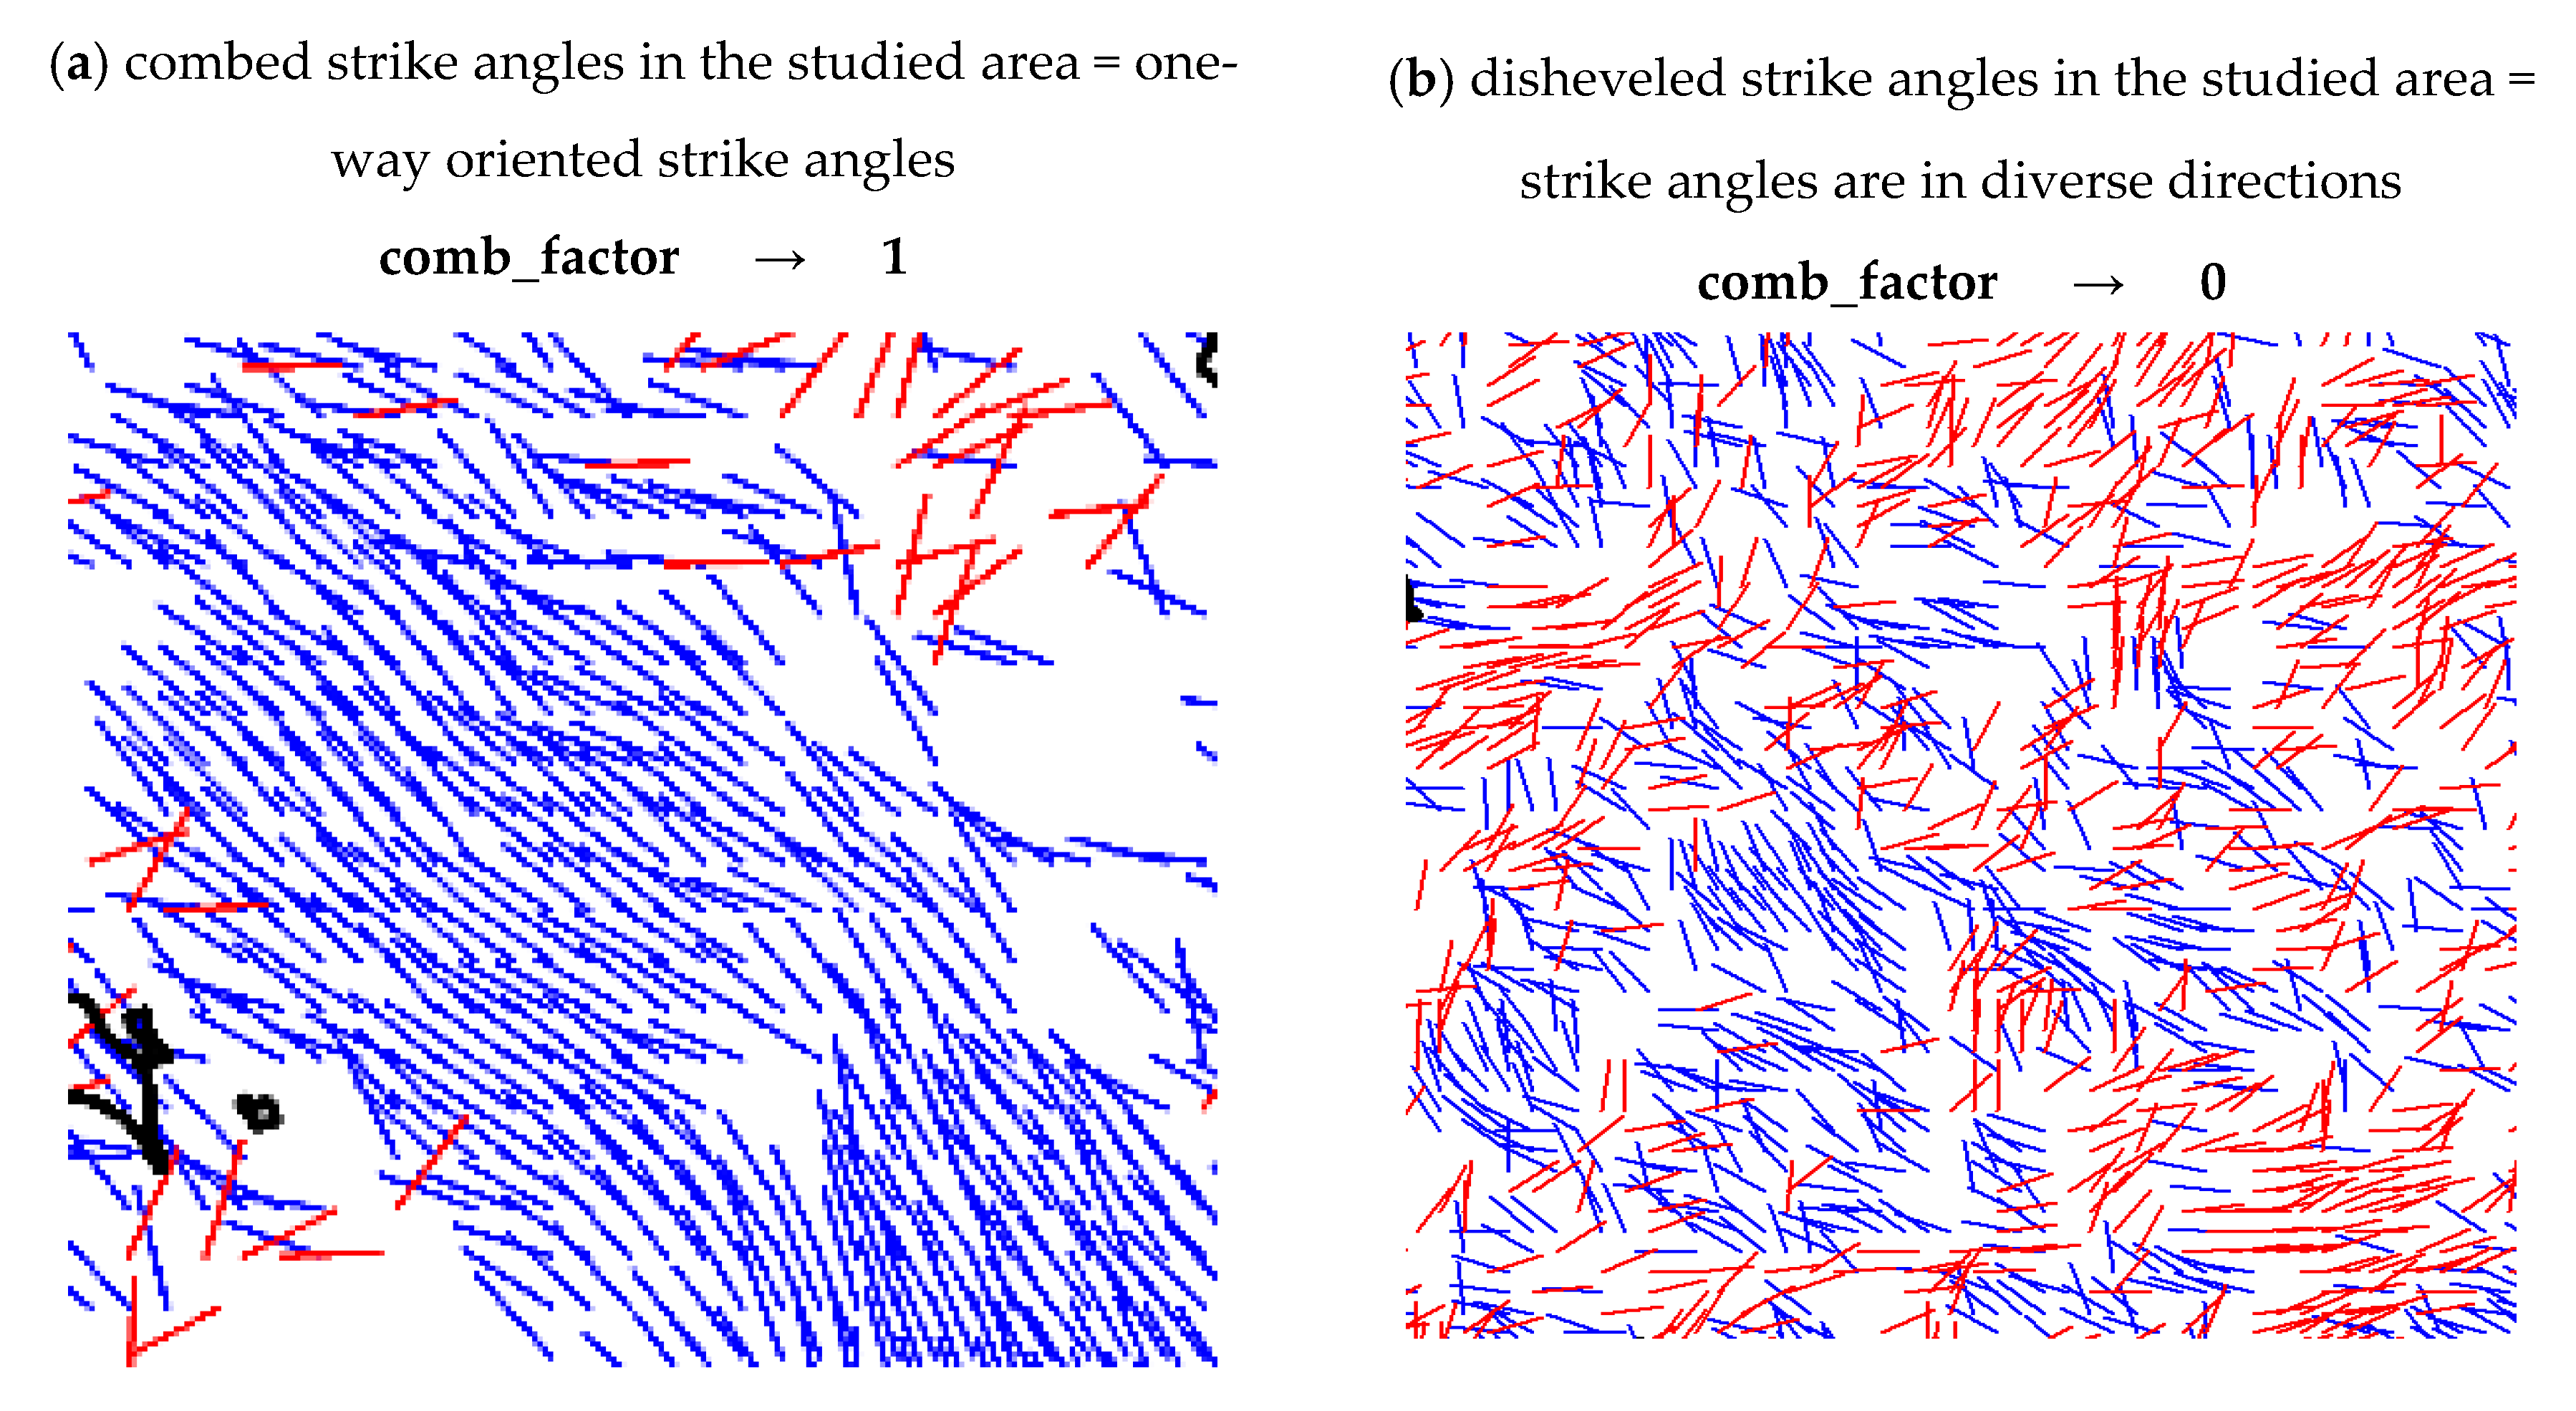
2.1. Theory: Theoretical Preliminaries about the Strike Angles

The strike angle θ (strike directions) is one of the gravity aspects (descriptors) and is defined as follows (see [1,3] and references therein):
tan 2 θ = 2   T x y ( T x x + T y y ) + T x z T y z T x x 2 T y y 2 + T x z 2 T y z 2 = 2 T x y T z z + T x z T y z T x z 2 T y z 2 + T Z Z ( T X X T Y Y )
(unambiguity within a multiple of π/2); Tij are the components of the Marussi tensor (e.g., [7]), i.e., the tensor of gravity gradients or second derivatives of the disturbing potential. These are non-linear combinations of the harmonic geopotential coefficients (Stokes parameters), and these are (in the form of a gravity field model) the input data for all our analyses.
The full Marussi tensor is a convenient source of information about the density anomalies of the causative bodies, providing useful details about the underground objects located close to the Earth’s surface and their shape and orientation. It was tested for local features (economic minerals, oil and gas deposits, faults, etc.), e.g., [8,9,10].
Mathematically, the strike angle θ is the main direction of the tensor Γ; geophysically, it may indicate areas with lower porosity and/or stress anisotropy. For example, we observed that the strike angles are combed inside and within a certain distance from the impact craters, owing to the impact event [11]. Strike angle values contain information about the anisotropy, specifically about the target material and, in some cases, about the impactor direction (they are combed perpendicular to the impactor direction). The strike angles seem to be parallel to the weakness in the strength of the rock, e.g., schistosity and/or presence of micro-faults. The liberation of the energy of the impactor releases the stress of the rock along the cleavage planes, while the stress perpendicular to these planes is maintained. This anisotropy is what is being detected by the strike angles.
The usual situation is that the strike angle θ has diverse, random directions, as projected on the Earth’s surface. The combed strike angles are the strike angles oriented roughly in one and the same direction in the given area (tutorial Figure 1), or creating a “halo” around the objects (e.g., around the impact crater) (tutorial Figure 2). It is not so important in which direction combed strike angles are, but the unidirectionality (or shaping a halo) is important. A theory for the “combed” strike angles was explained, together with relevant empirical statistics and examples, in [12]. Under any coordinate transformation, the Marussi tensor Γ preserves just three invariant parameters (I0, I1, I2), known as gravity invariants:
I 0 = t r a c e   ( Γ ) = T xx + T yy + T zz =   0
I 1   = ( T xx T yy + T yy T zz + T xx T zz ) ( T xy 2 + T yz 2 + T xz 2 ) = 1 2 { i , j } { x , y , z } ( T i i T j j T i j 2 )
I2 = det (Γ) = (Txx(TyyTzzTyz2) + Txy(TyzTxzTxyTzz) + Txz (TxyTyzTxzTyy).
The ratio I of the two gravitational gradients I1 and I2
0 I = ( I 2 / 2 ) 2 ( I 1 / 3 ) 3 1
is always between zero and unity [7]. If the causative body is strictly 2D, then I equals zero; the higher I, the “more 3D” the causative object. For oil and gas deposits, we rather expect flat (like 2D) than 3D objects, i.e., rather smaller than higher values in the interval I <0, 1>. This is certainly not the only possible criterion (moreover, a condition necessary but not sufficient) to detect 2D sites (see [13]).

2.2. Other Important Information.

There are two “axioms” and one comment to mention.
(1)
Warning against “short-cuts”:
The gravity data indicate only geologic structures (anticlines, faults, salt domes, etc.), any of which may occasionally contain concentrations of TD; the combed strike angles are not directly due to gas, oil or water contained within the TD.
(2)
Correlation does not imply causation:
Correlation does not imply causation and therefore our statement that our data and method are supportive for an estimation of the existence of the TD, by definition, does not confirm (prove in the mathematical sense) the existence of the TD.
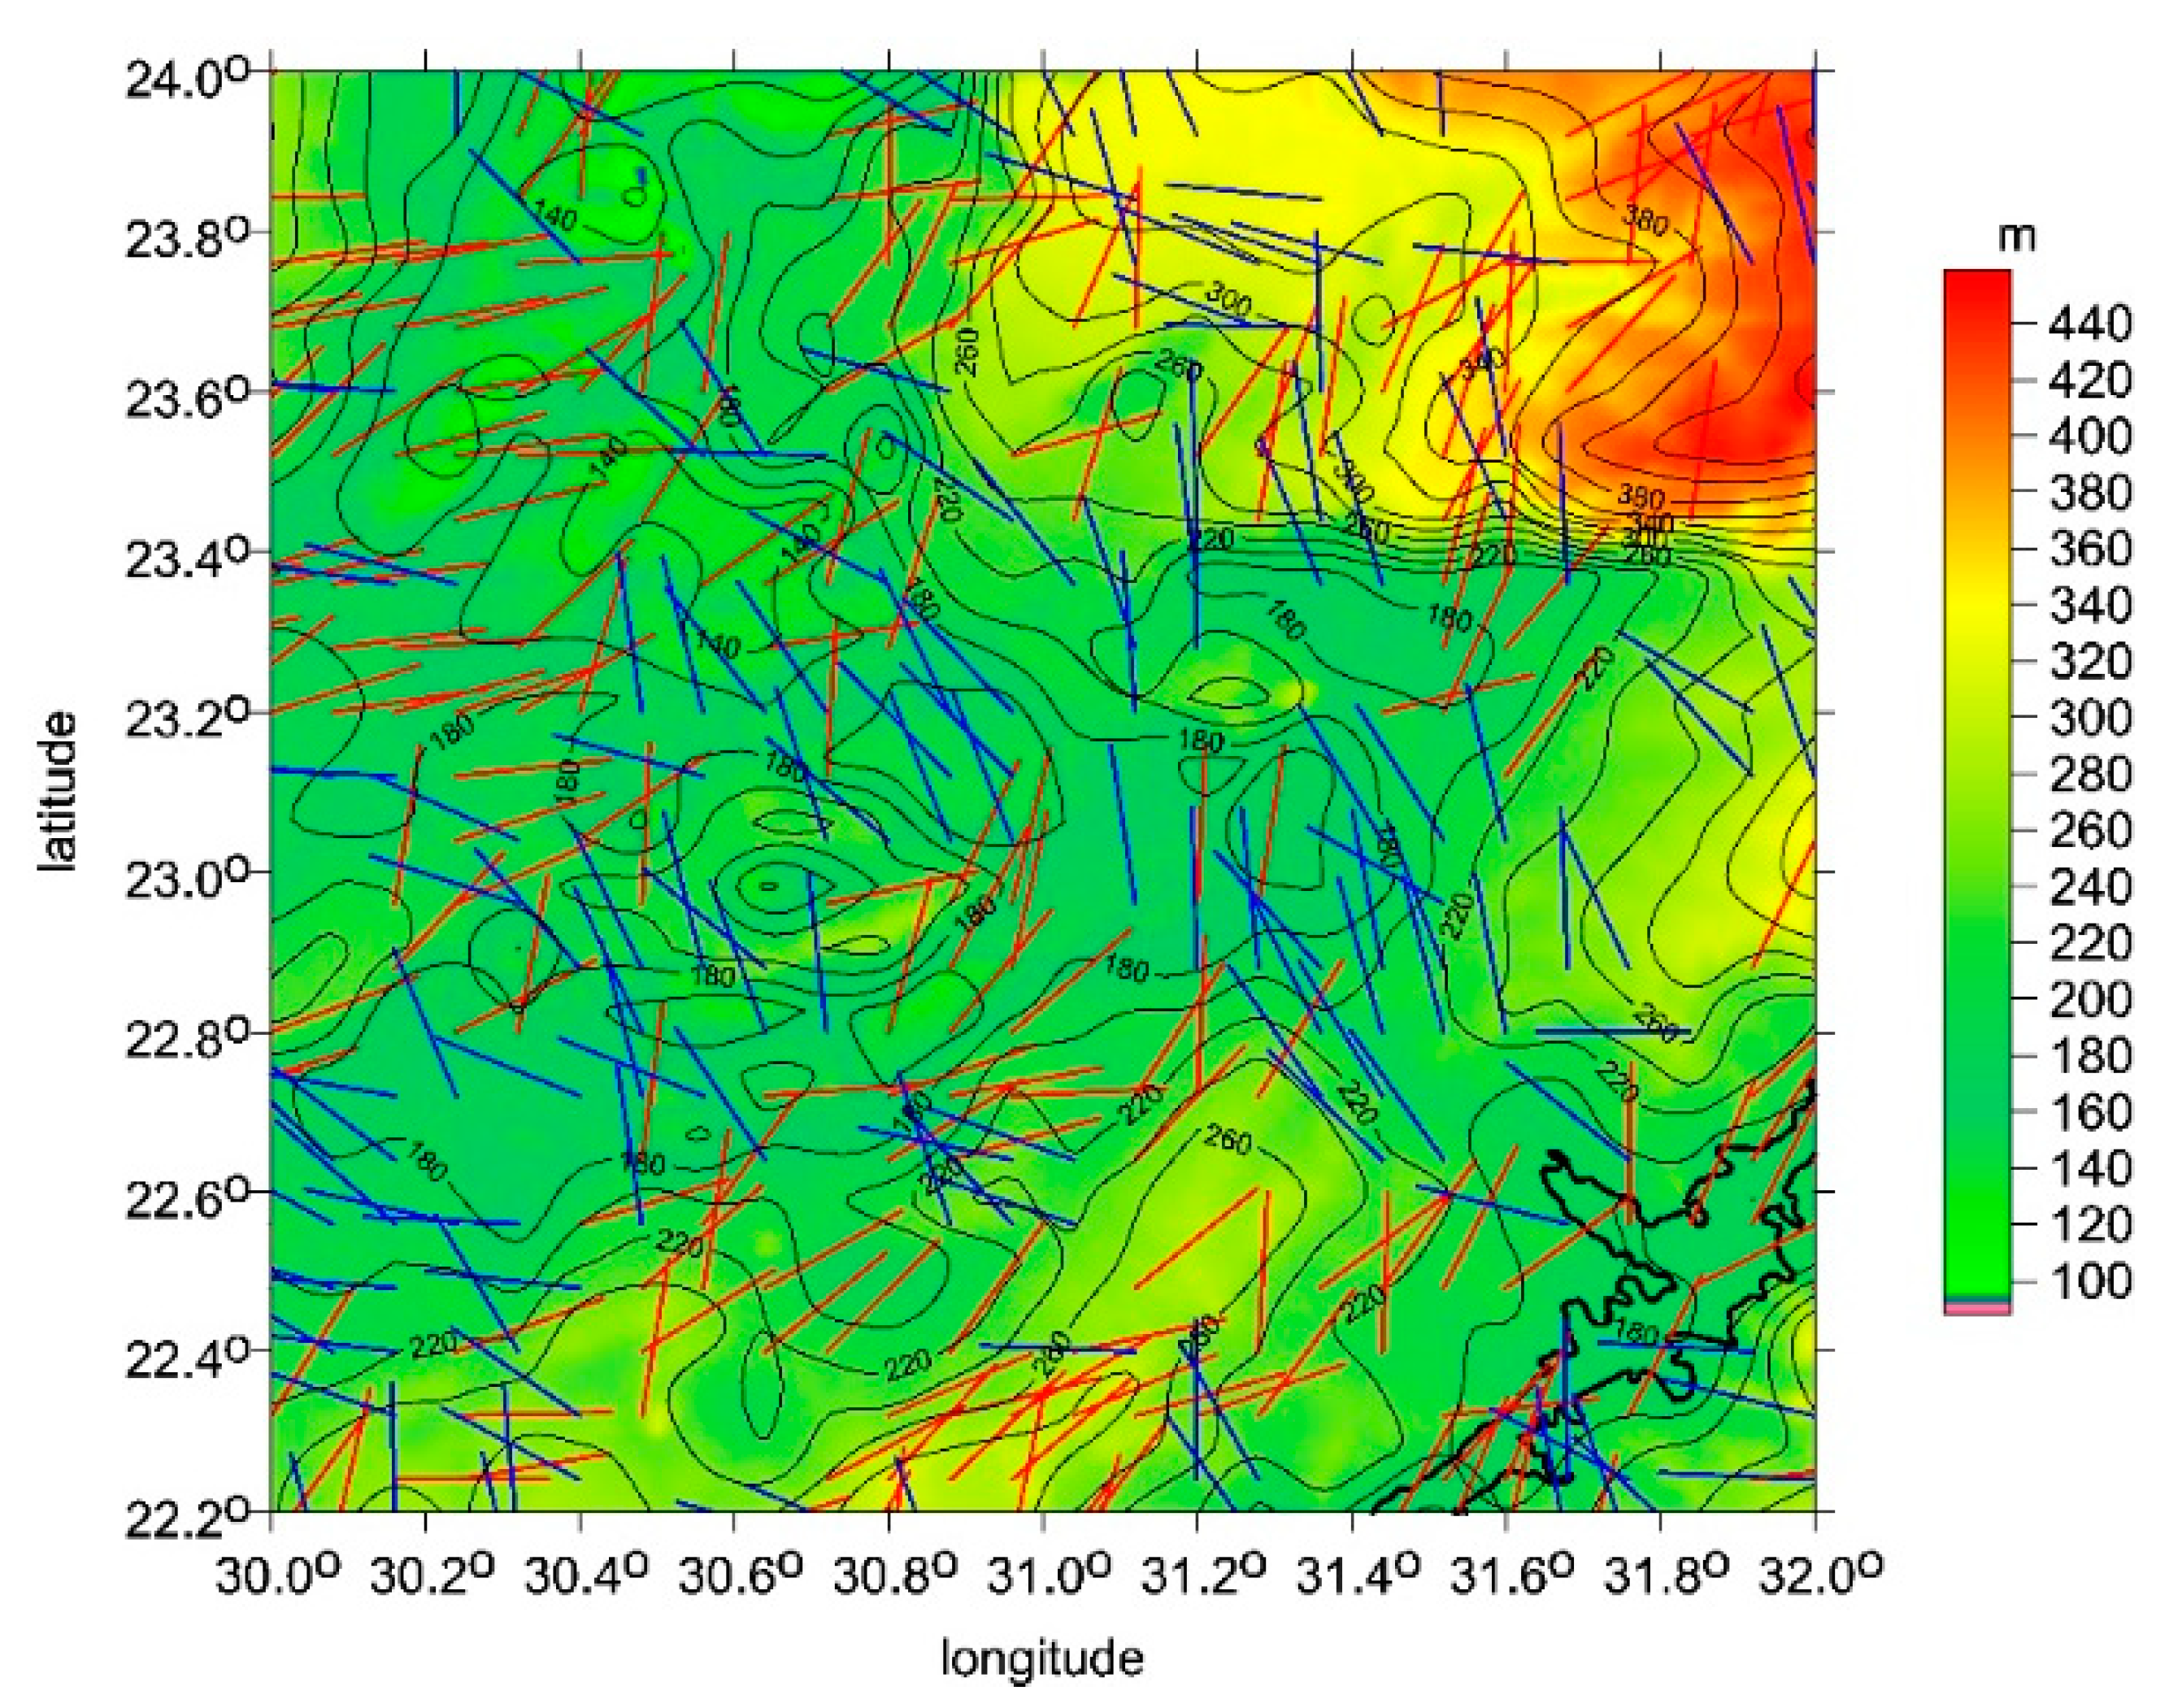
The spatial distribution of the combed strike angles may indicate a new cheap and accessible empirical geophysical tool for the recognition of some potential oil and gas areas or water or both. The method represents the first approximation for less accessible regions to decide to include or exclude them from more detailed investigations, thus potentially saving money.

2.3. Method

We compute and plot the strike angles θ. The combed θ co-identify oil, gas and groundwater deposits; these sources are often located together. Where combed, we can expect the oil and gas or water deposits, but unfortunately not only this, because—as is well known—the gravity signal used solely by itself does not provide a unique information. There is no direct relationship meaning that the combed strike angles define TDs (Section 2.2). They rather indicate the changed porosity of the local material, which may well be owing to the impact force in the case of an impact event, or they can be combed due to geological/tectonic processes. It is evident that close cooperation with regional specialists is always needed to resolve the local/regional problem.
Nevertheless, the combed strike angle provides an easily accessible criterion and a simple preliminary diagnostic tool for the respective presence of oil and gas (hydrocarbon) or groundwater localities. They should be included in the pre-prospection phase because they can help to lower the risk of incorrect prediction. For our results and discussion about them, see Section 3.
As for the groundwater and paleolakes, there is a negative Δg and second radial derivative Tzz, compression in vd inside the objects and combed θ. However, we know that the gravity signal is not unique and that similar characteristics appear also for wide and deep river valleys, such as parts of the Nile, canyons such as the Great Canyon, faults such as Lake Vostok, Baikal and similar, etc. (see [1] and references therein).
The first step of our method to detect such an object is to transform the difference in the gravity anomalies between its assumed deepest and highest place to the difference in the heights to make the maximal estimate where the object can be located and how large/deep it might be. Sometimes, several iterations are needed. The second step is to use a topography model and the geographic positions of archaeological sites, leading eventually to a fine-tuning of the level, extent and shape of the object to keep the archaeological site at its shore for the time interval in question. This also requires a few iterations. For more details on our method, results and discussion, see Section 4.

2.4. Data: Remote Sensing and Terrestrial

2.4.1. Gravity and Magnetic Data

The input data to our analysis are the harmonic geopotential coefficients (Stokes parameters) of the spherical harmonic expansion of the disturbing gravitational (not gravity) potential. A set of these coefficients defines the so-called global static gravitational (gravity) field model.
We make use of the high quality, of the highest accessible precision worldwide and of the highest resolution combined gravity models, based on satellite and terrestrial data; now, this is still the EIGEN 6C4 (European Improved Gravity model of the Earth by New techniques). This is a global but detailed gravity field model which includes gradiometry data from the whole GOCE mission (Gravity field and steady-state Ocean Circulation Explorer, ESA) [16]. It is expanded to degree and order (d/o) = 2190. This corresponds to the ground half-wavelength resolution 5 × 5’ (arc minutes, arcmin) or equivalently ~9 km on the Earth’s surface. The remote data (satellite altimetry, gradiometry, other types of satellite measurements) together with terrestrial data (gravity anomalies from gravimeters) are important components of the gravity field models “mixed” in them in a specific way.
We have tested an experimental XGM2019e gravity field model [17], which, however, must produce results similar to those from EIGEN 6C4 owing to the similar database. XGM2019e might be slightly better over the oceans due to the additional measurements likely provided by altimetry satellites. There is a version of XGM2019 to d/o ~2190 (with the ground resolution ~9 km), the same as EIGEN 6C4, and another version up to d/o = 5399 (the resolution ~4 km); we used both for a comparison. It is impossible to guarantee that some of the fine features shown by these gravity models are not just artefacts caused by noise [17]. For Egypt, we did not find any observable difference in most of the gravity aspects, but we observed a total failure in the strike angles. The reason is not yet known, but it may be due to altitude difference as the gravity field changes rapidly from the surface sources. Therefore, we continue to work only with the EIGEN 6C4 model; we count with the ground resolution ~10 km and estimate of the external accuracy not more than 10 mGal (Ch. Förste, priv. commun.).
The magnetic anomalies—the values of magnetic induction (in nanotesla [nT]) as an additional informative source to the gravity data/aspects—are taken from the worldwide model EMAG 2 [18]. This is a global 2’ resolution grid compiled from satellite, marine, aeromagnetic and ground surveys. It has a ground resolution of 5–10 km (depending on the location). We also tested EMAG 3 (with a lower resolution) but without effect for Egypt. Some parts of Egypt (central and southern areas) are without any data in the EMAGs.

2.4.2. Surface Topography Data

ETOPO 1 is a part of the global 1’ relief model of the Earth’s surface that integrates land topography and ocean bathymetry from a large number of satellite measurements [19]. It is one of the global topography models; it is used here (we chose this one among other potential models due to its simplicity). Its precision should be σ = ±10 m in height (but not everywhere). Our experience (over Sahara) is that the stated precision of such models is in fact only their internal precision and not the actual external accuracy. We conservatively assume σ = ±20 m for our study areas.

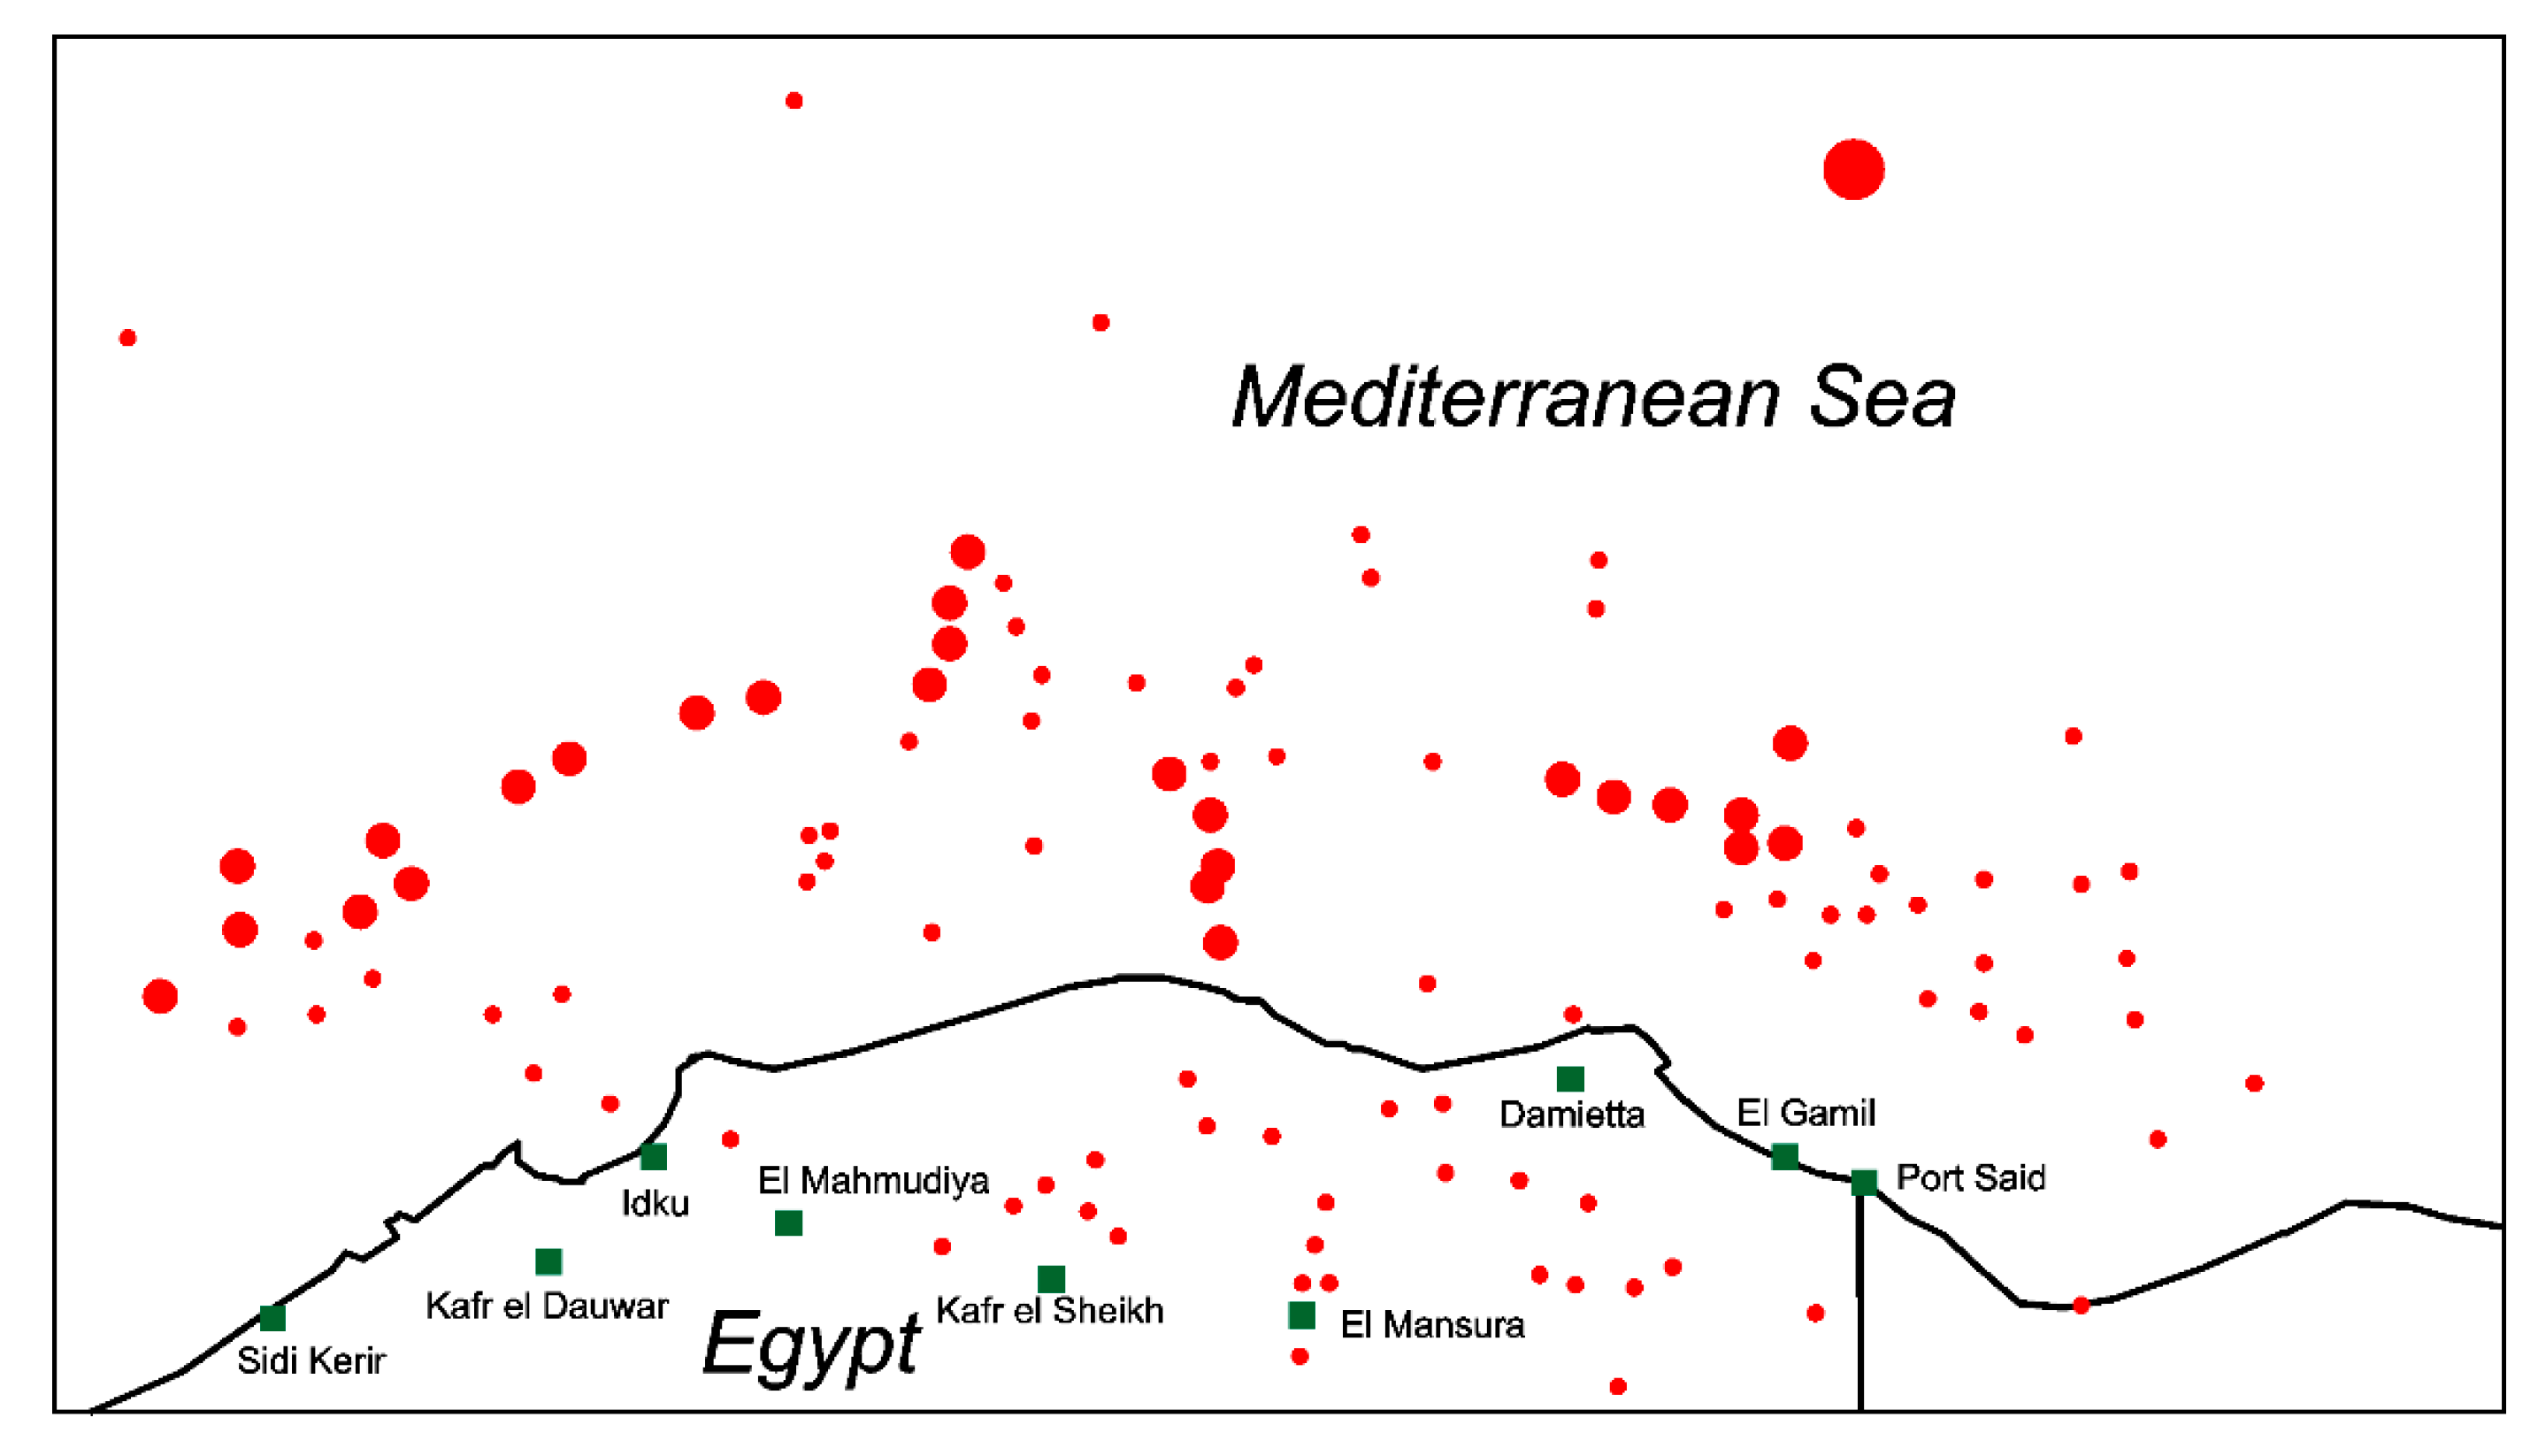
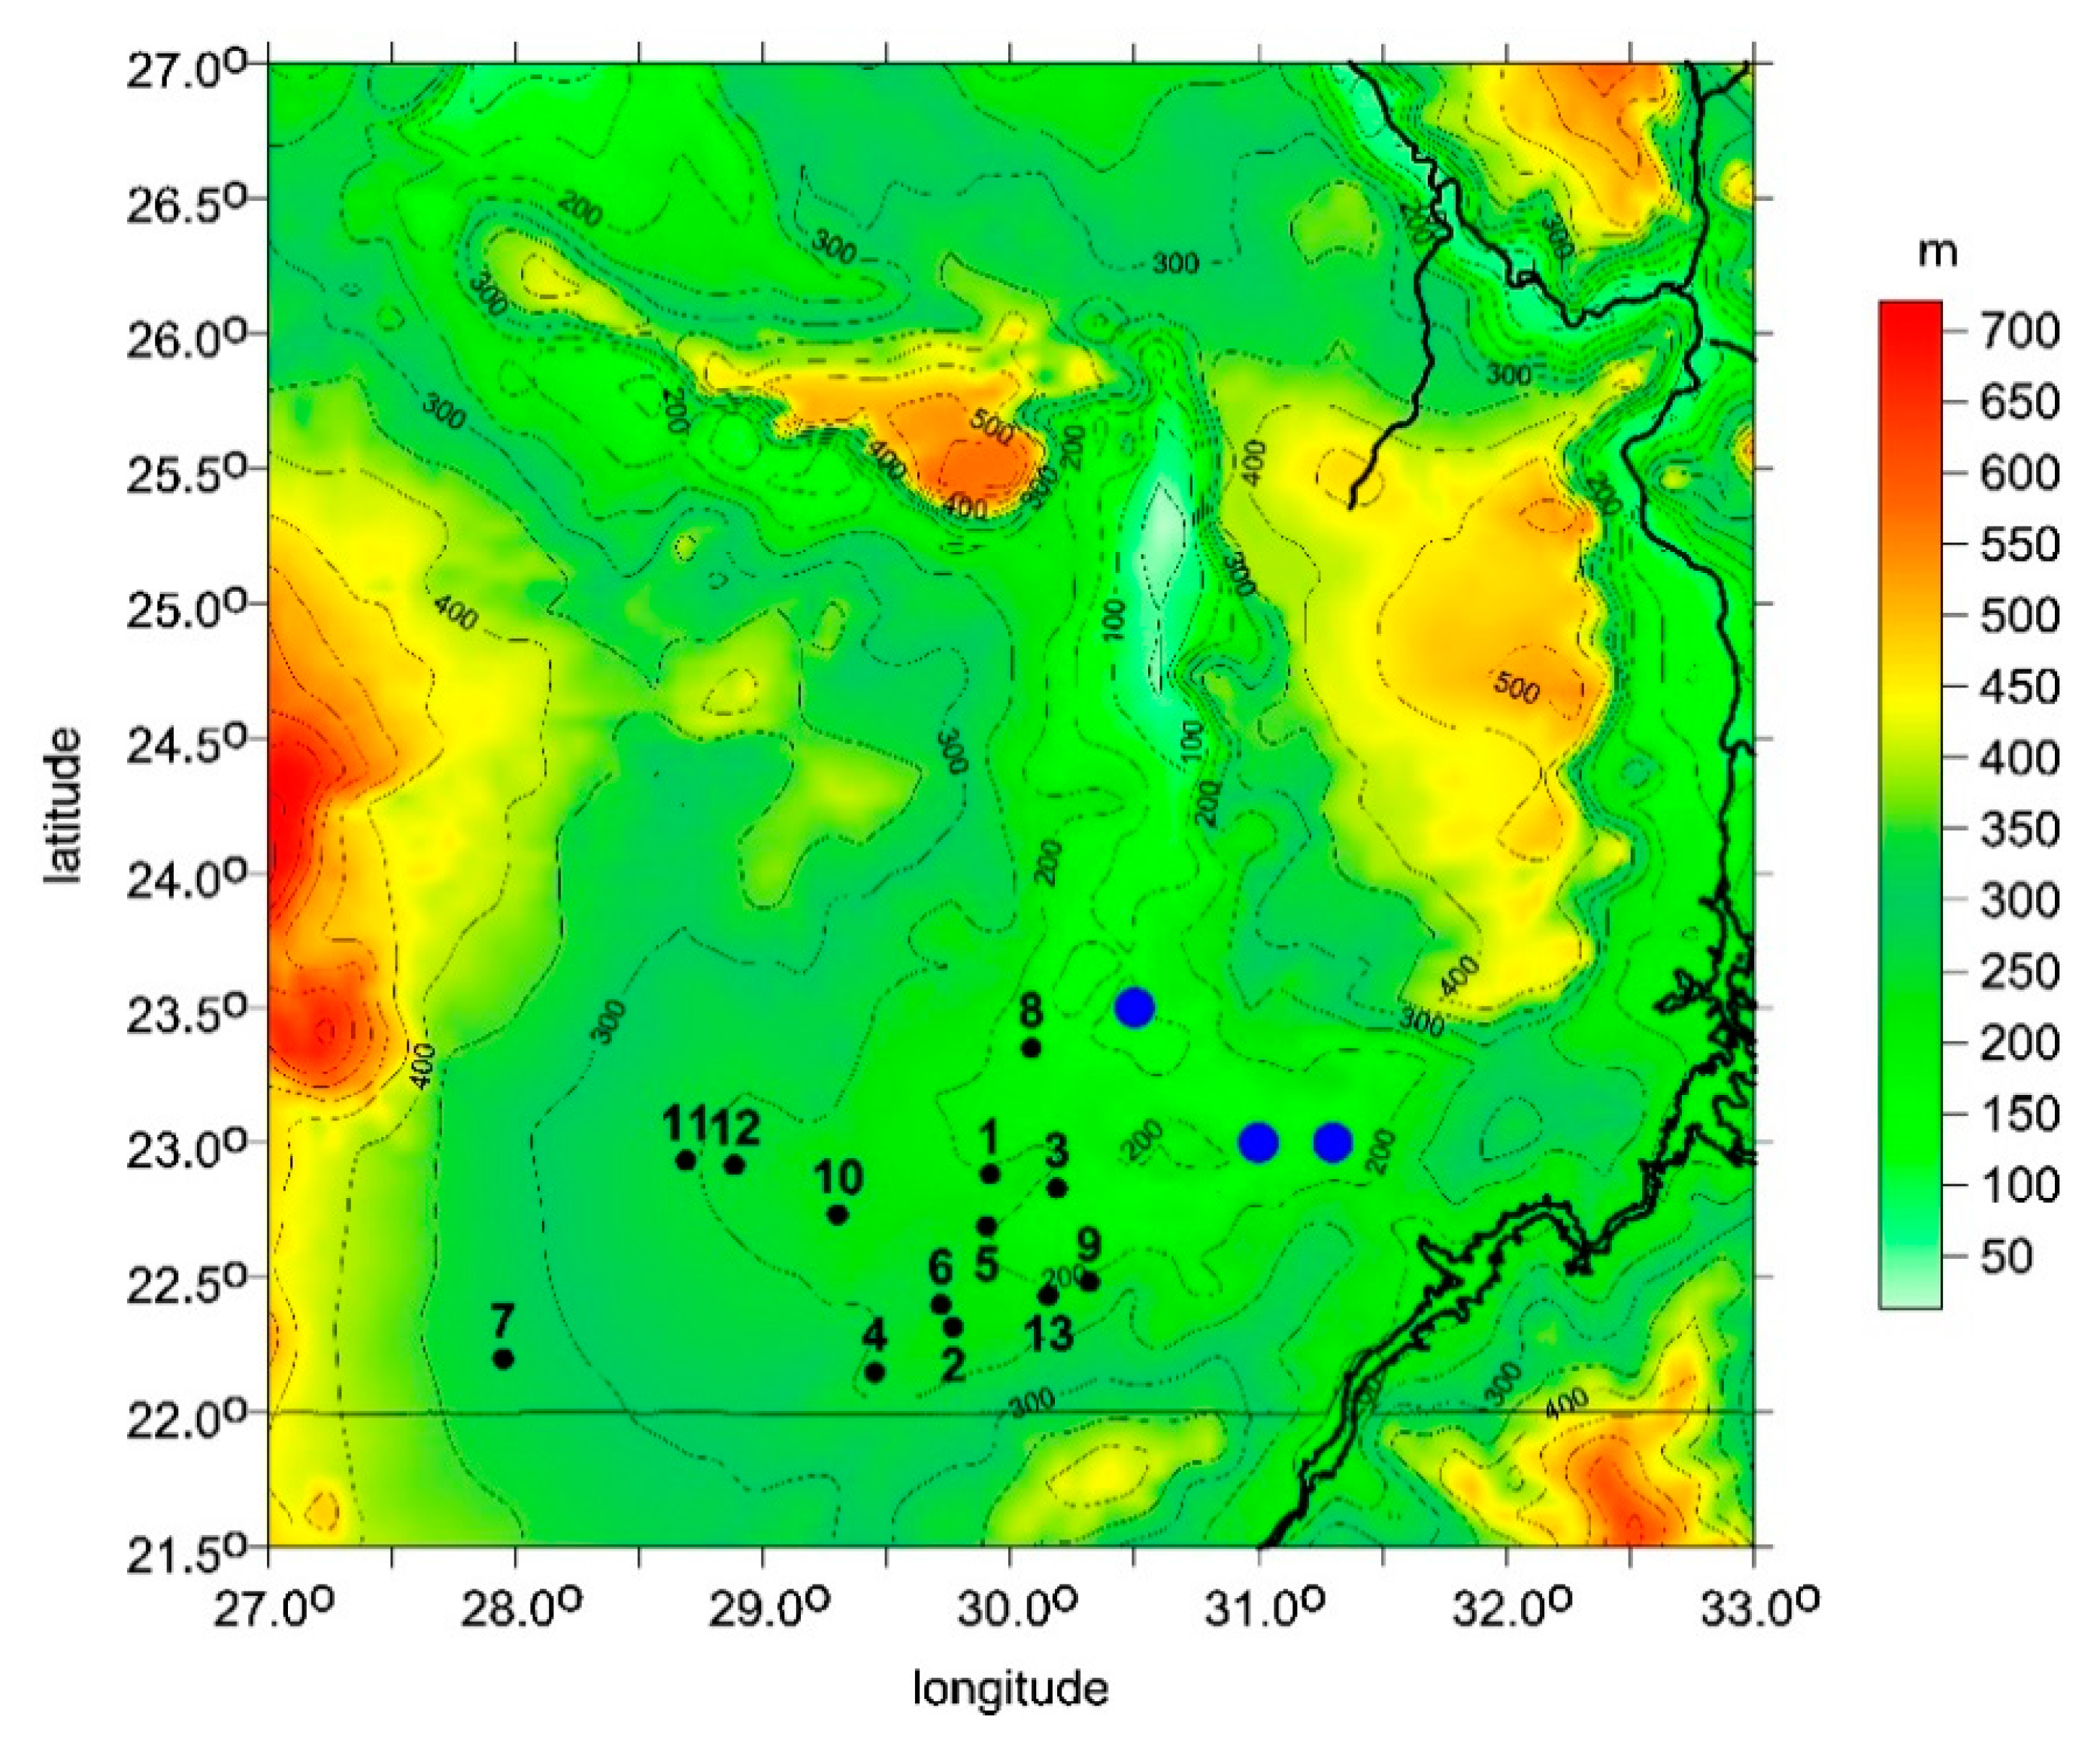
2.4.3. Positions of Known Oil and Gas Deposits

First, we take data/plots (and geodetic coordinates where available) showing locations (ground positions) of oil and gas deposits (discovered and planned for drilling or already in use) from the literature (see Figure 3 and Figure 4). Then (Section 3), we correlate these places with the maps of the strike angles computed from EIGEN 6C4. We already started with such a work in Section 7.3.2 of [1].
During approximately the last ten years, a series of large natural gas discoveries in the Eastern Mediterranean has changed how energy is used in the region (e.g., [20]). Israel now has the potential to export gas. In the region, the most significant discoveries were the Tamar field (Israel), Leviathan fields (Israel), Aphrodite (Cyprus), Zohar (Egypt), plus delta of the Nile (Nile Margin Reservoirs) or Suez (Egypt) [21] (their figure 1, plus various internet sources).

2.4.4. Archaeological Data

River valleys, lakes and/or inner seas played a vital role in human prehistory [23]. In the Western Desert of Egypt, which is the focus of this study, permanent settlement has been confined since the Late Holocene (after 4200 BP (BP, before present, calibrated years)) to five major oases in the northern and central parts of the currently hyper-arid desert (Figure 5). Nevertheless, varied archaeological evidence attests to repeated periods of greater humidity when this region, just as the entire Sahara, was periodically habitable and regularly occupied by diverse human groups (e.g., [24,25]). The available archaeological data can be used to test the hypothesis of the existence of paleolake and paleoriver systems detected using the gravity signals.
Kuper and Kröpelin [24] gathered data from 150 excavations at Holocene sites in support of their hypothesis of the climate-controlled occupation of the Eastern Sahara (Figure 6). The locations of archaeological sites from their phase of maximum expansion of human occupation (~9000–7300 BP; [24] (their figure 3c)) were used in [4] to locate possible paleolakes in the northern part of the Western Desert of Egypt (Figure 7). In this study, we limit the spatial focus to the south-eastern part of the Egyptian Western Desert but work with more detailed archaeological data covering both Holocene and Pleistocene occupation.
Our research area consists of two depressions. The southern part contains the lowland between the Kiseiba Scarp in the west (ca. 250 km west of the Nile), Eocene Limestone Plateau in the north and Wadi Toshka in the east (ca. 70 km west of the Nile). The current shape of this area is the result of intensive and repeated erosion, deflation and deposition during the Pleistocene and Holocene [26,27]. The average elevation of this area is around 240 m asl, with the desert surface gradually rising towards the south. The surface of the lowland is dotted with numerous low-lying, internally drained and enclosed basins with elevation well below 200 m asl [27]. The depression features evidence of occupation during the Lower Paleolithic (~500,000–300,000 BP) and Middle Paleolithic (~175,000–70,000 BP). Nevertheless, in consequence of major reworking of the area during the hyper-arid phase between ~70,000 BP and the beginning of the Holocene (~11,500 BP), the Pleistocene evidence is only rarely found in situ in elevated locations [28]. The Holocene remains are mostly tied to the low-lying basins or playas and usually attest to multiple reoccupations of the same locations (in particular, see [27,28,29]). The Holocene archaeological sequence for this region consists of seven cultural units grouped into four main periods: Early (~9500–7300 bp), Middle (~7100–6600 bp), Late (~6500–5800 bp) and Final Neolithic (~5700–4500 bp) (“bp” refers to uncalibrated age as given in primary research publications (in particular, [29])), followed by a brief Late Holocene occupation during a short moist period ~3860 bp. The local Holocene climatic optimum coincides with the latter part of the Early Neolithic (~8050–7300 bp; [29]). This depression constitutes the primary area for the testing of our hypothesis as it offers data suitable for a controlled discussion.
The northern part of our research area contains the Kharga Oasis, a large and narrow depression (220 km in length, 15–40 km in width) that runs north to south ca. 200 km west of the Nile. Its northern and eastern borders are delimited by the scarps of the Egyptian Limestone Plateau at ~350 m asl. The mean elevation of the depression itself is around 50 m asl [30,31]. Several regional projects have brought to light here numerous Pleistocene and Holocene sites occurring in the context of spring vent pools, lakes, playas and wadis; an established spatial and temporal pattern in the regional record of prehistoric occupation; and nearly continuous occupation for at least the last 300,000 years thanks to the presence of stable sources of water from artesian springs (e.g., [27,31,32,33,34,35]). This multiplicity of sources of water and of archaeological data makes this oasis less suitable for testing the hypothesis. For this reason, the Kharga Oasis is further considered a secondary area where more general correlation with the data from the south is required.
For the purposes of correlation, we also refer to the evidence of robust Lower and Middle Paleolithic occupations at lakeshores and at spring vents and of the ephemeral Holocene human presence at Bir Tarfawi and Bir Sahara, two small deflational basins situated ca. 100 km west of the Kiseiba Scarp [27,36].
The archaeological sites from the Toshka-Kiseiba depression selected for this study are overviewed in Table 1. Most of them correspond to areas with clusters of localities occupied during more than one phase or period of prehistory. Only evidence found in situ is included for both the Pleistocene (1 area) and Holocene (11 areas). To indicate the dating of the Holocene remains, we employ a simplified sequence of two main periods, with one corresponding to the “reoccupation” (~10,500–9000 BP) and “formation” (~9000–7300 BP) phases of [24] (their figure 3b,c) and the Early and Middle Neolithic of the regional archaeological sequence, and the other to the “regionalization” phase (~7300–5500 BP) of [24] (their figure 3d) and the Late and Final Neolithic in this region.
To plot the positions of the areas onto the maps presented in this study, the topographic and cartographic data available in primary publications (see Table 1) were used to identify the locations on Google Earth. The coordinates included in the table refer to the playas, i.e., often the lowest-lying sectors of the basins. Where elevation (height above present sea level, asl) of the locations was not indicated in the publications, it was estimated using Google Earth and is expressed as an average of elevations of the playa and its shores where human settlements were usually located.

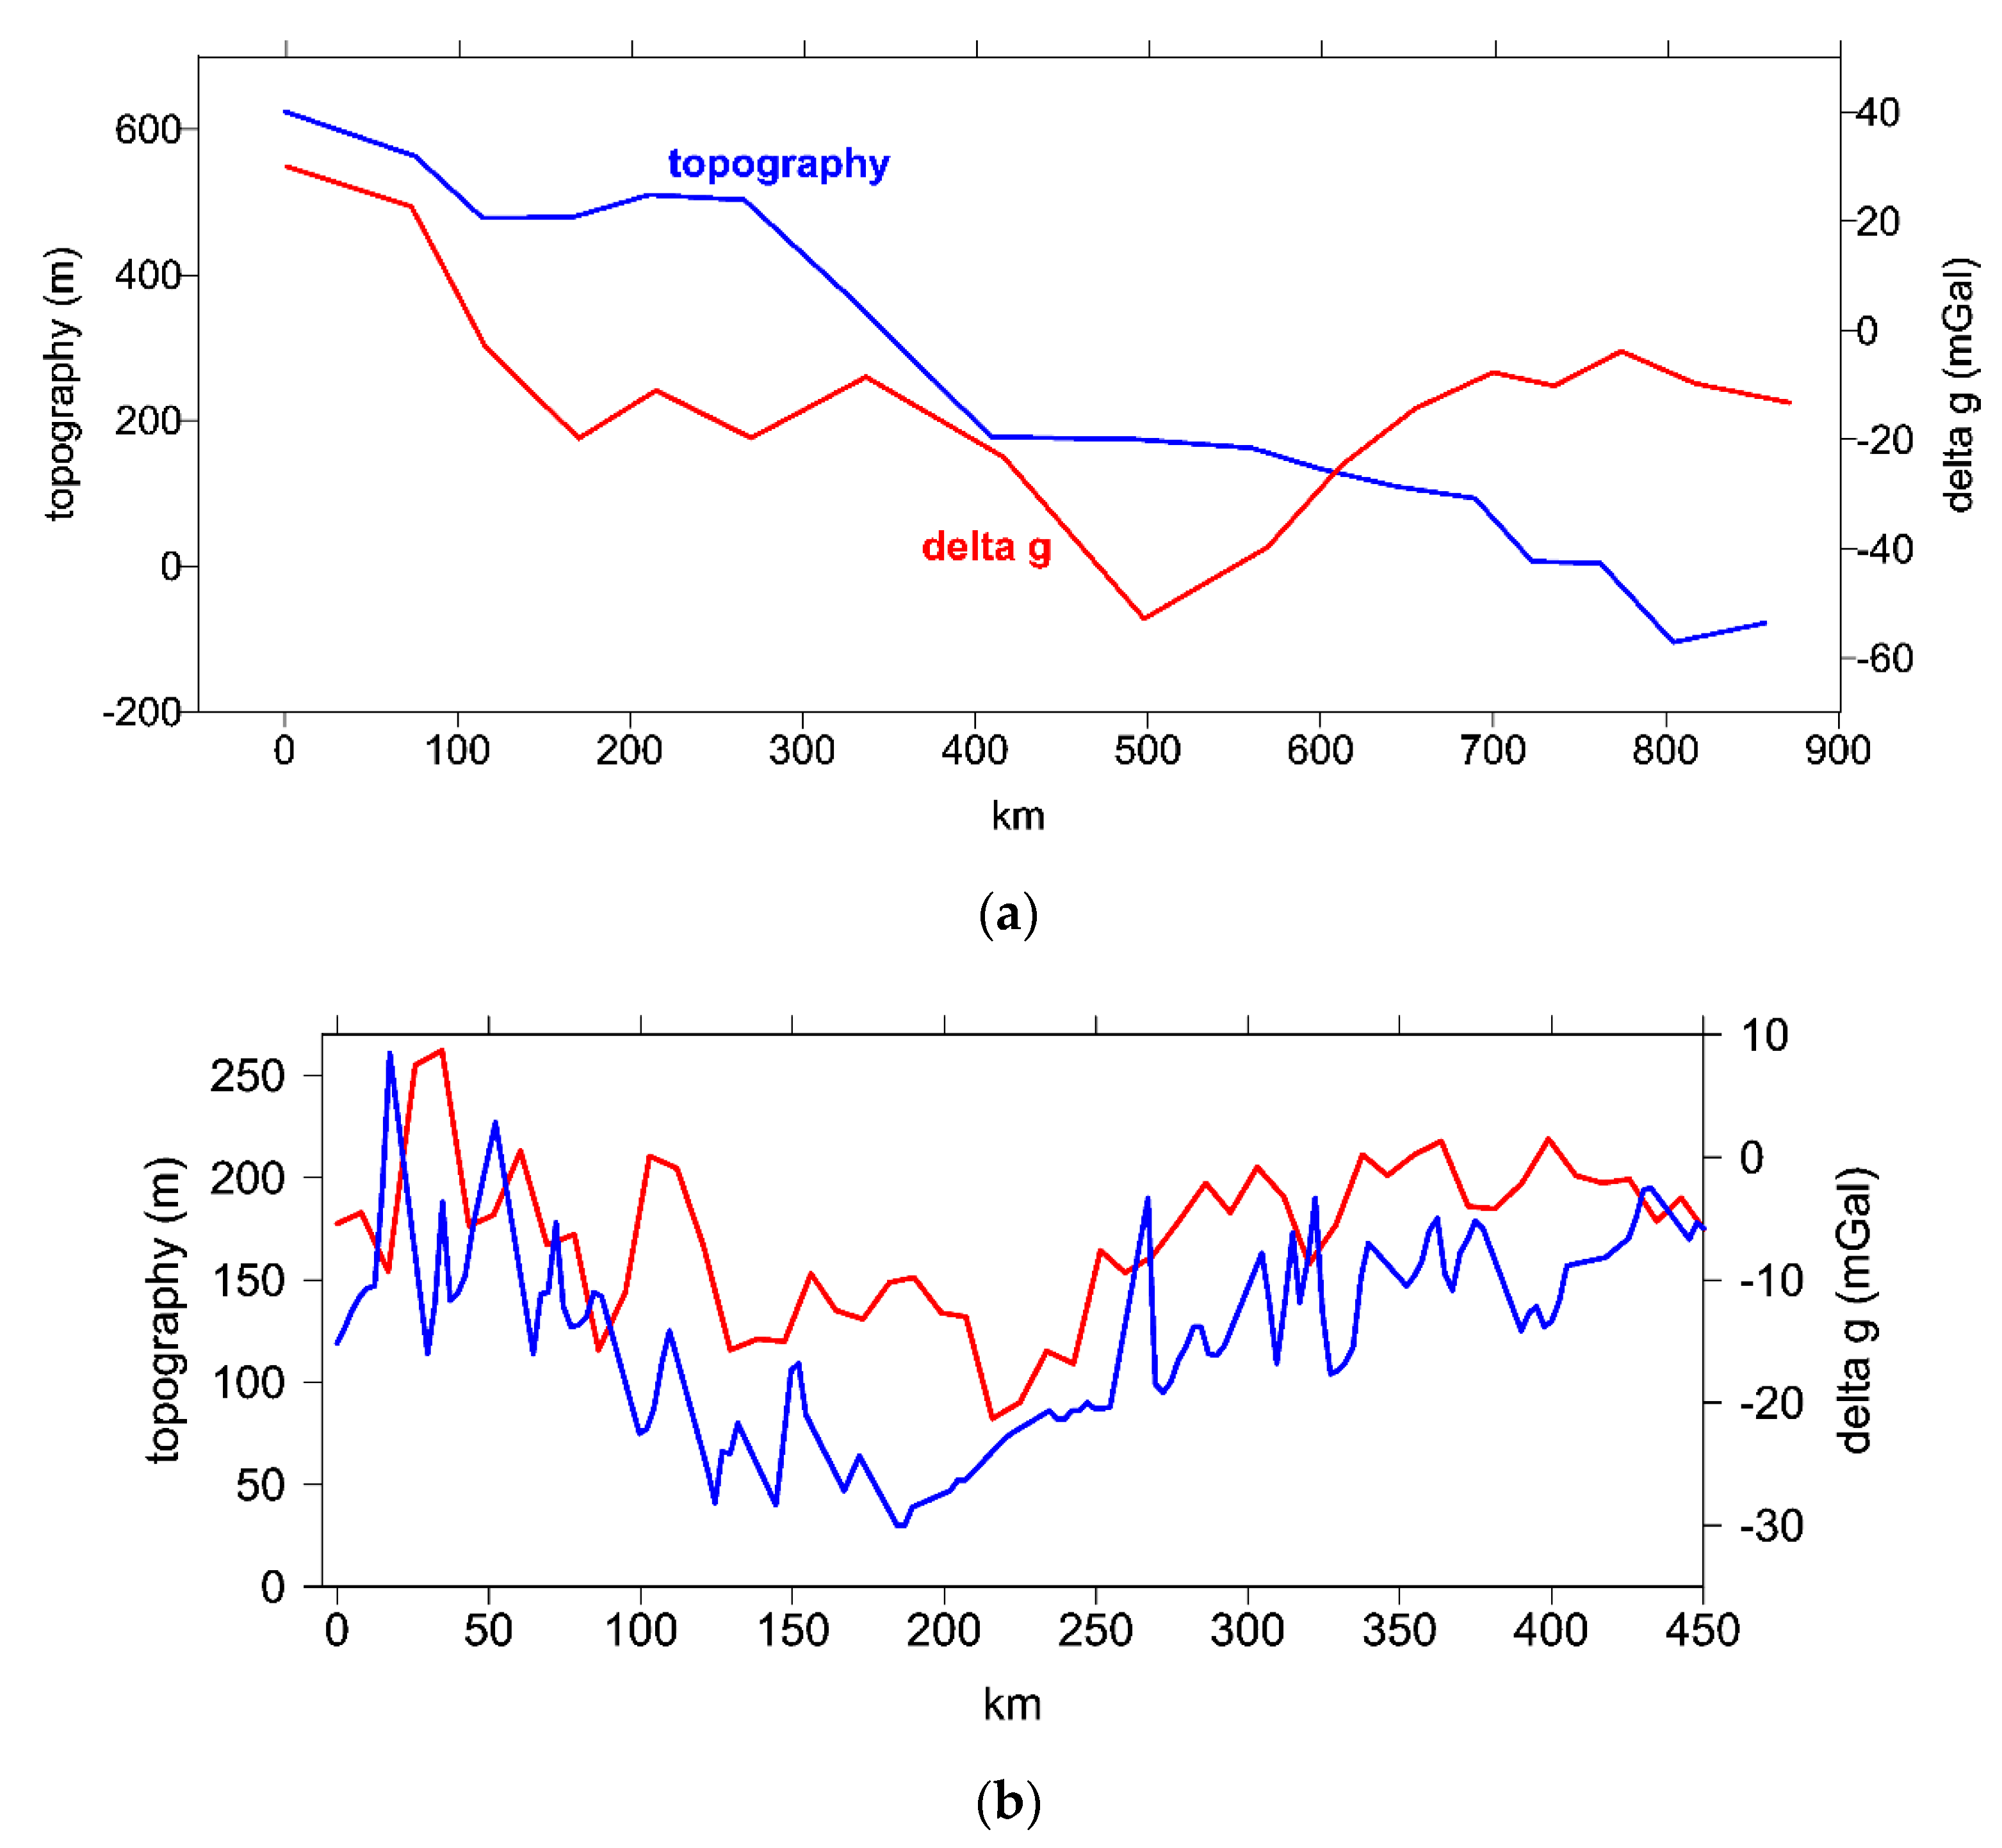
2.5. A Simple Test Model: Strength of the Gravity Signal

How large can the gravity anomalies Δg and the radial component of the Marussi tensor Tzz be expected to be from an oil or water pool under the surface? We need such an estimate to compare it to the precision of EIGEN 6C4; this is not worse than 10 mGal (according to the main author of the model, as mentioned above). Thus, the question is: is the gravity signal from oil and gas and/or a water reservoir significantly stronger than 10 mGal?
We used our method of modeling from [40]. We assume an ideal oval oil trap (bowl upside down, or umbrella, consisting of gas, oil and water layers, from top down) with a long axis a, short axis b, thickness (width) c, deposited in the depth d beneath the surface (with the upper end of “umbrella”), with a density contrast Δρ between the umbrella’s content and surrounding large-scale oil-bearing strata—clay stones. We assume that the observer of these gravity signals is located on the surface at the axis above the pool (centrically above the pool). For the shale gas, computations are done for a basin instead of umbrella.
The results are gathered in Table 2; these results are valid for Δρ = −1.5 (g/cm3); the values of Δg and Tzz depend on Δρ linearly. One can see that EIGEN 6C4 is able to detect Δg and Tzz from the modeled oil pools well.
It is well known, however, that in particular field conditions, the situation for TD is complex. As a rule, in the hydrocarbon provinces occur numerous oil–gas deposits in inhomogeneous media in the traps of different types where superposition of many alternating gravity effects is observed. Seismic prospecting is now the most effective searching tool. Geophysical potential fields are also applicable, but under specific conditions.
We try to contribute by a new “gravity diagnostics” using our approach with the gravity aspects; this method, for this purpose, is a new one.

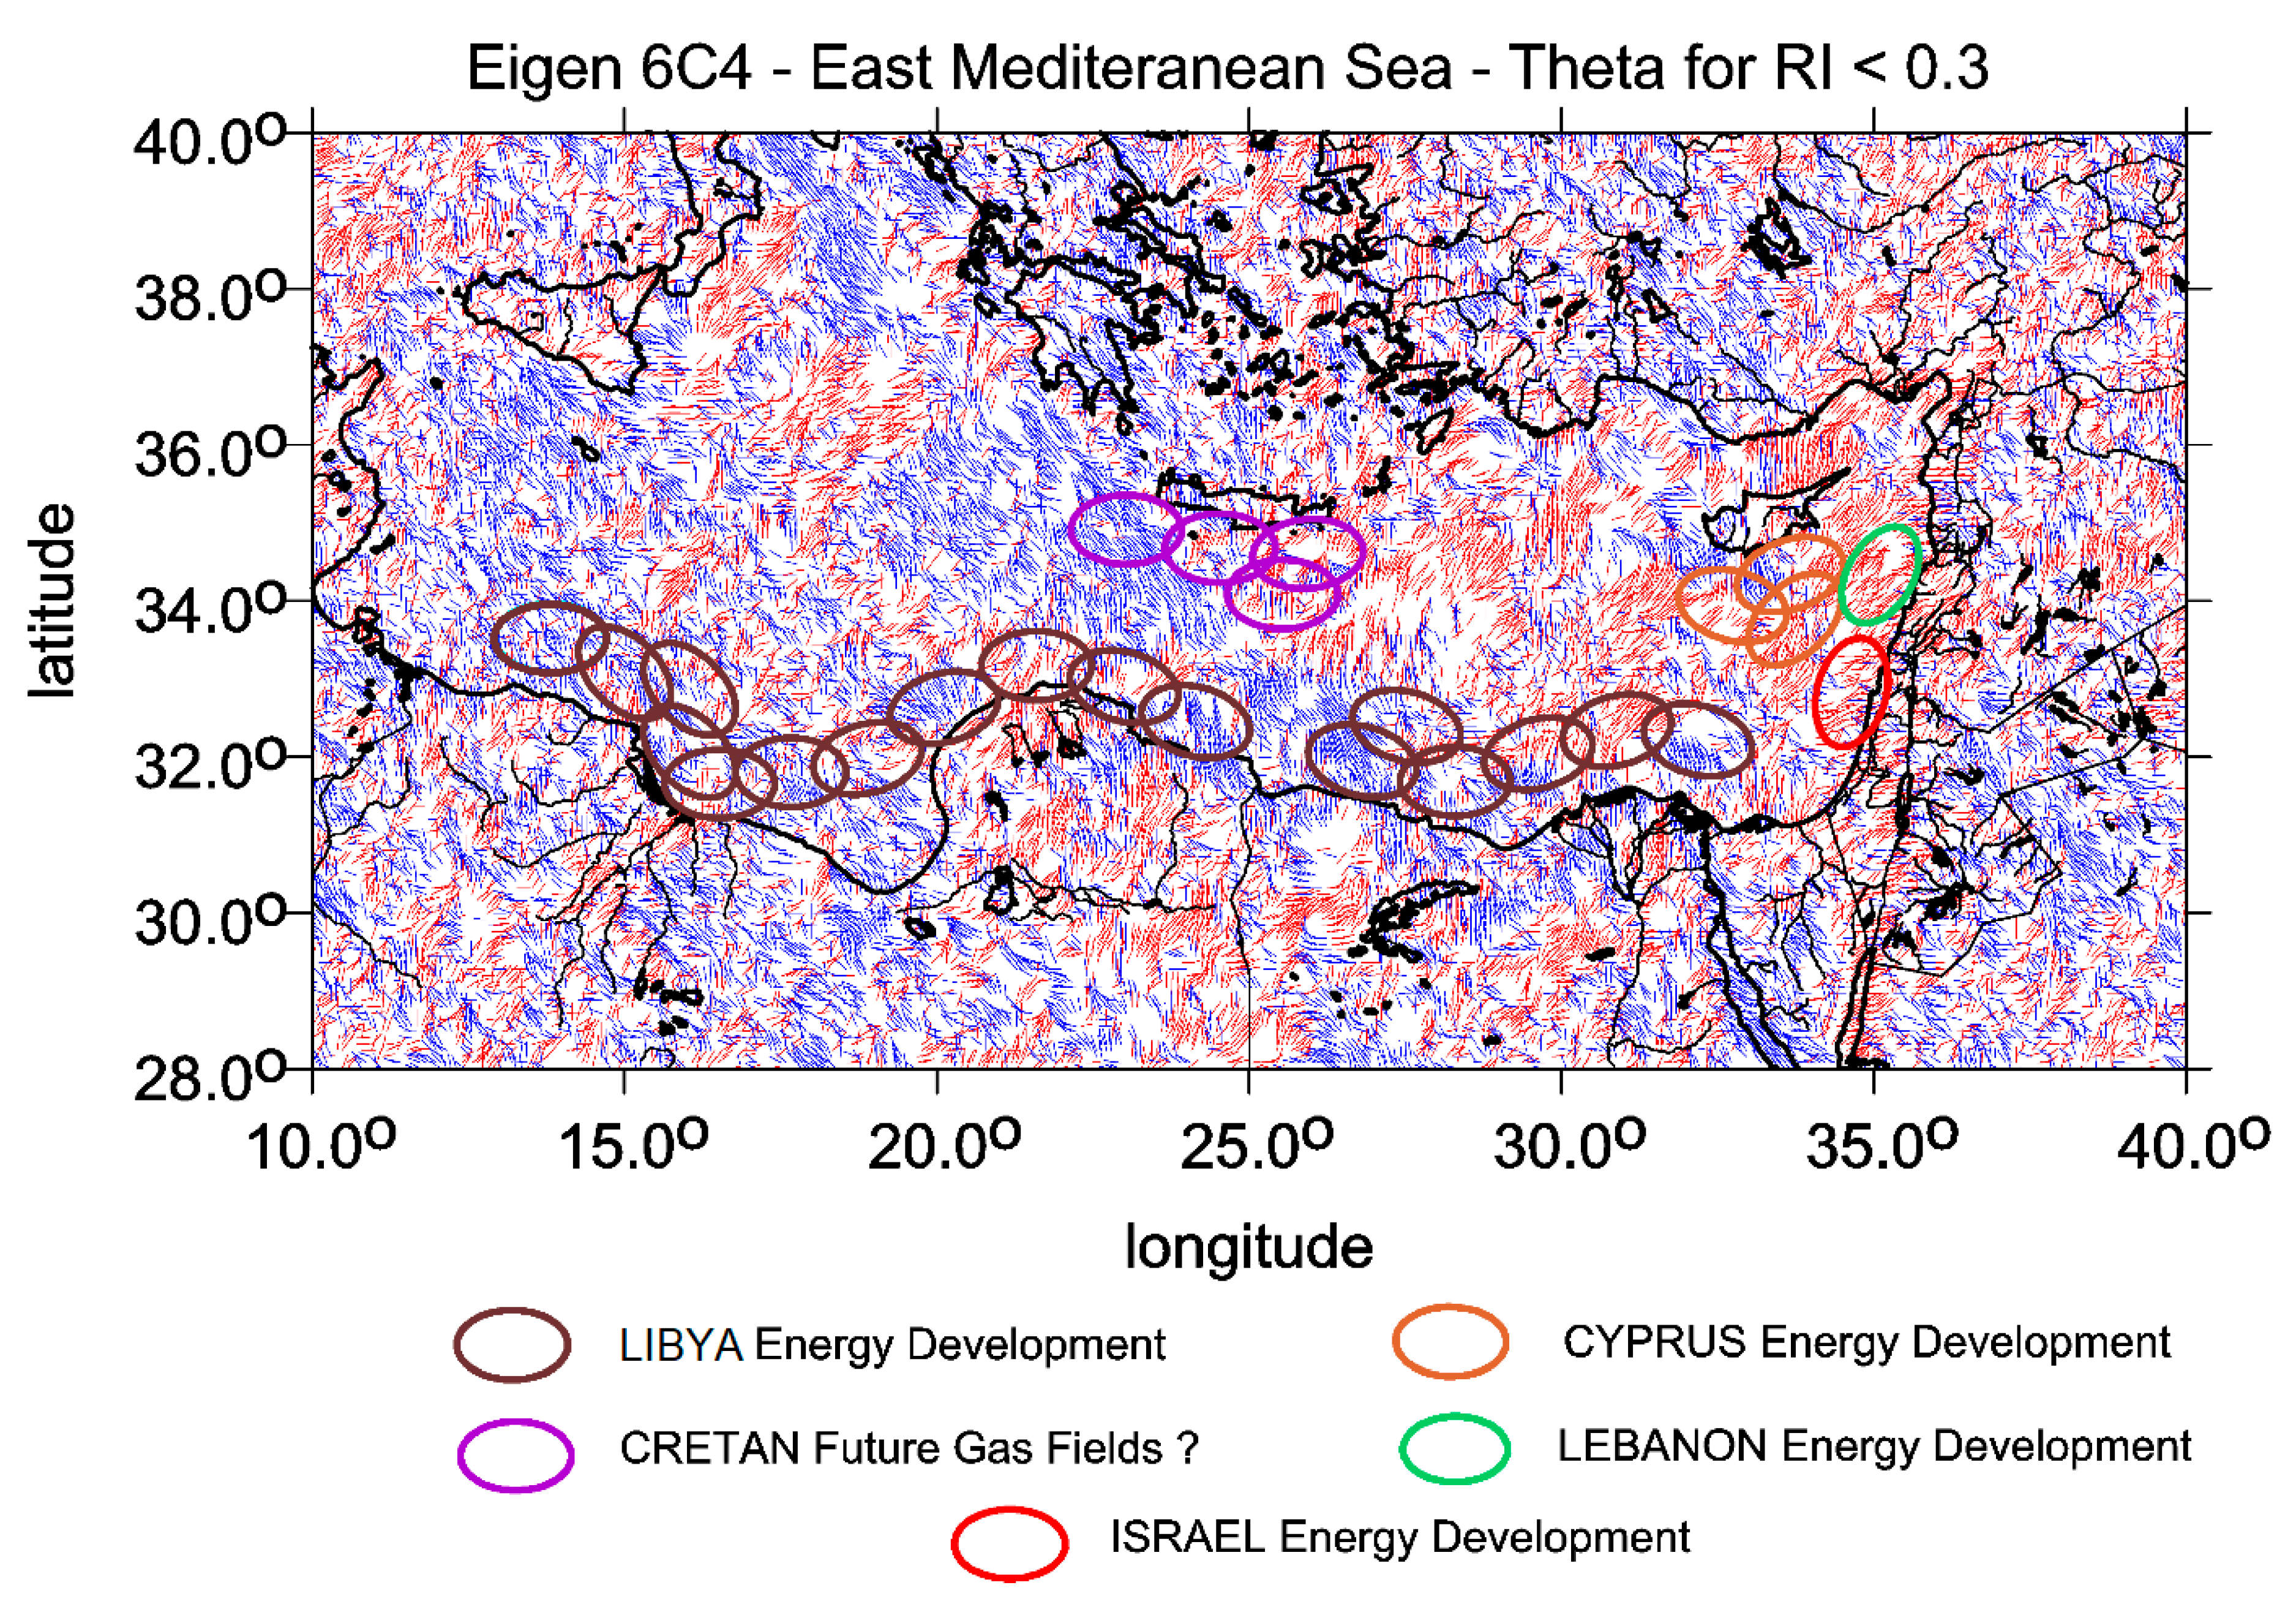
3. Observations Focused on Oil and Gas

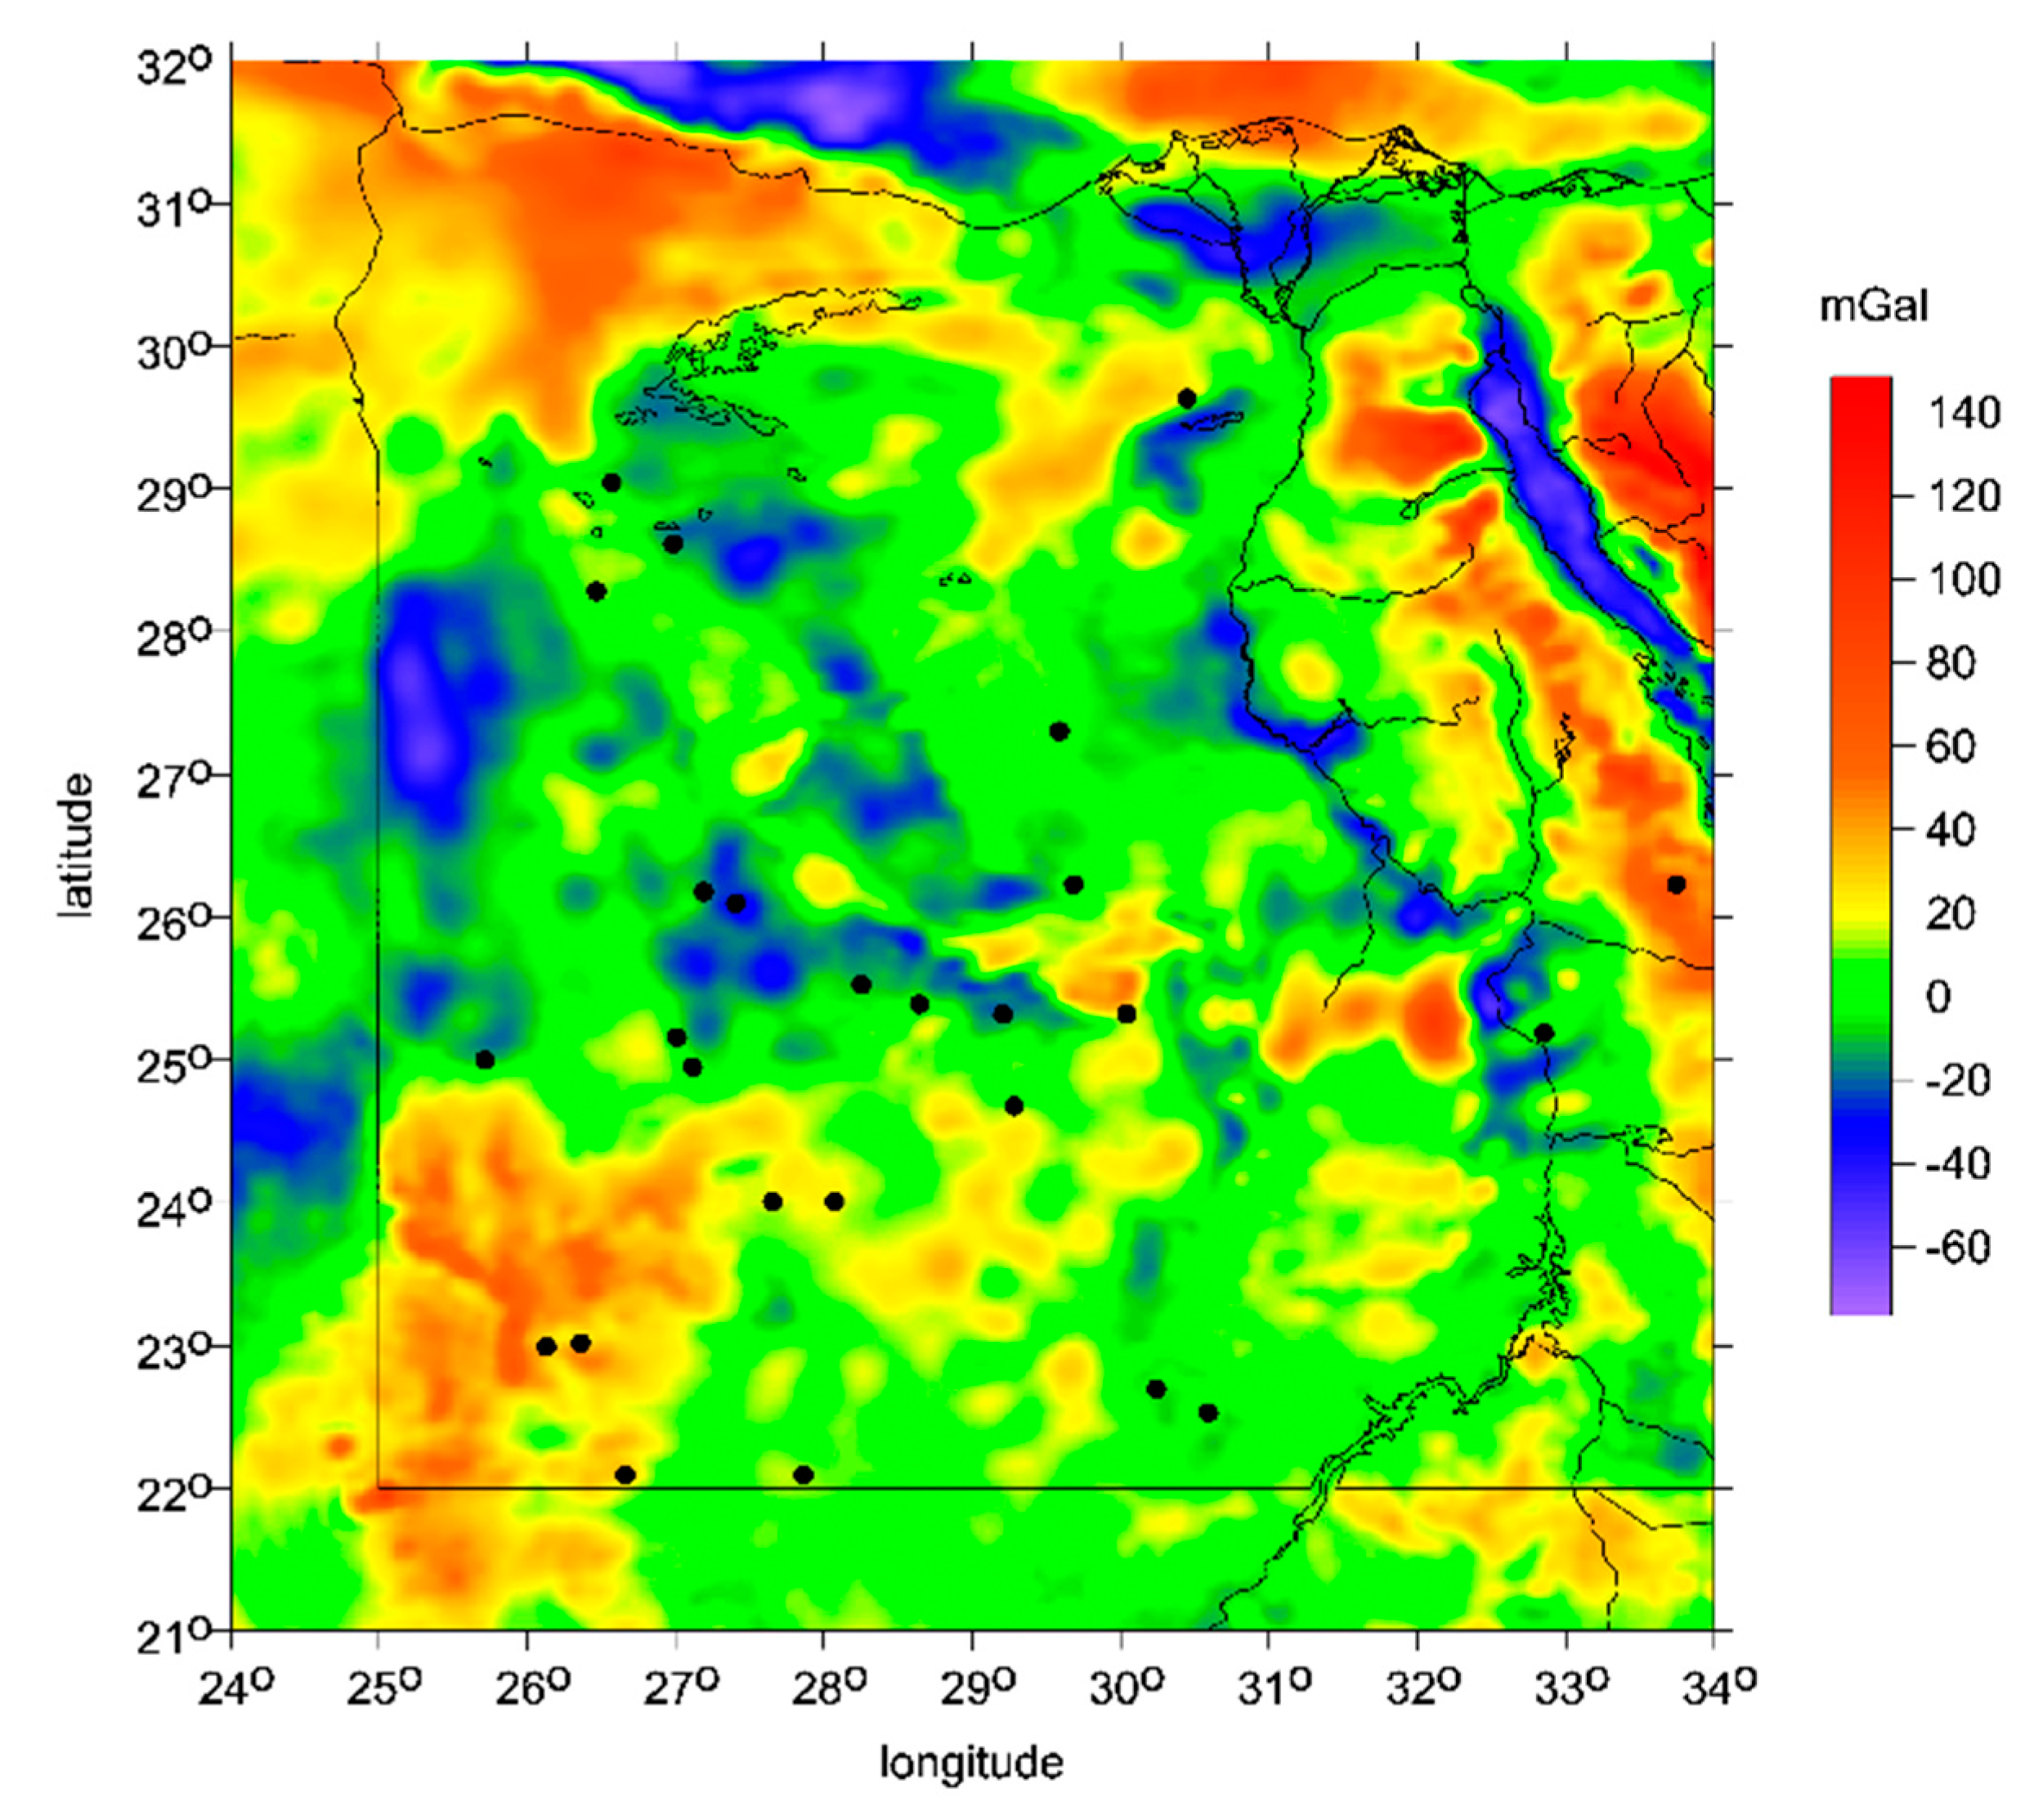
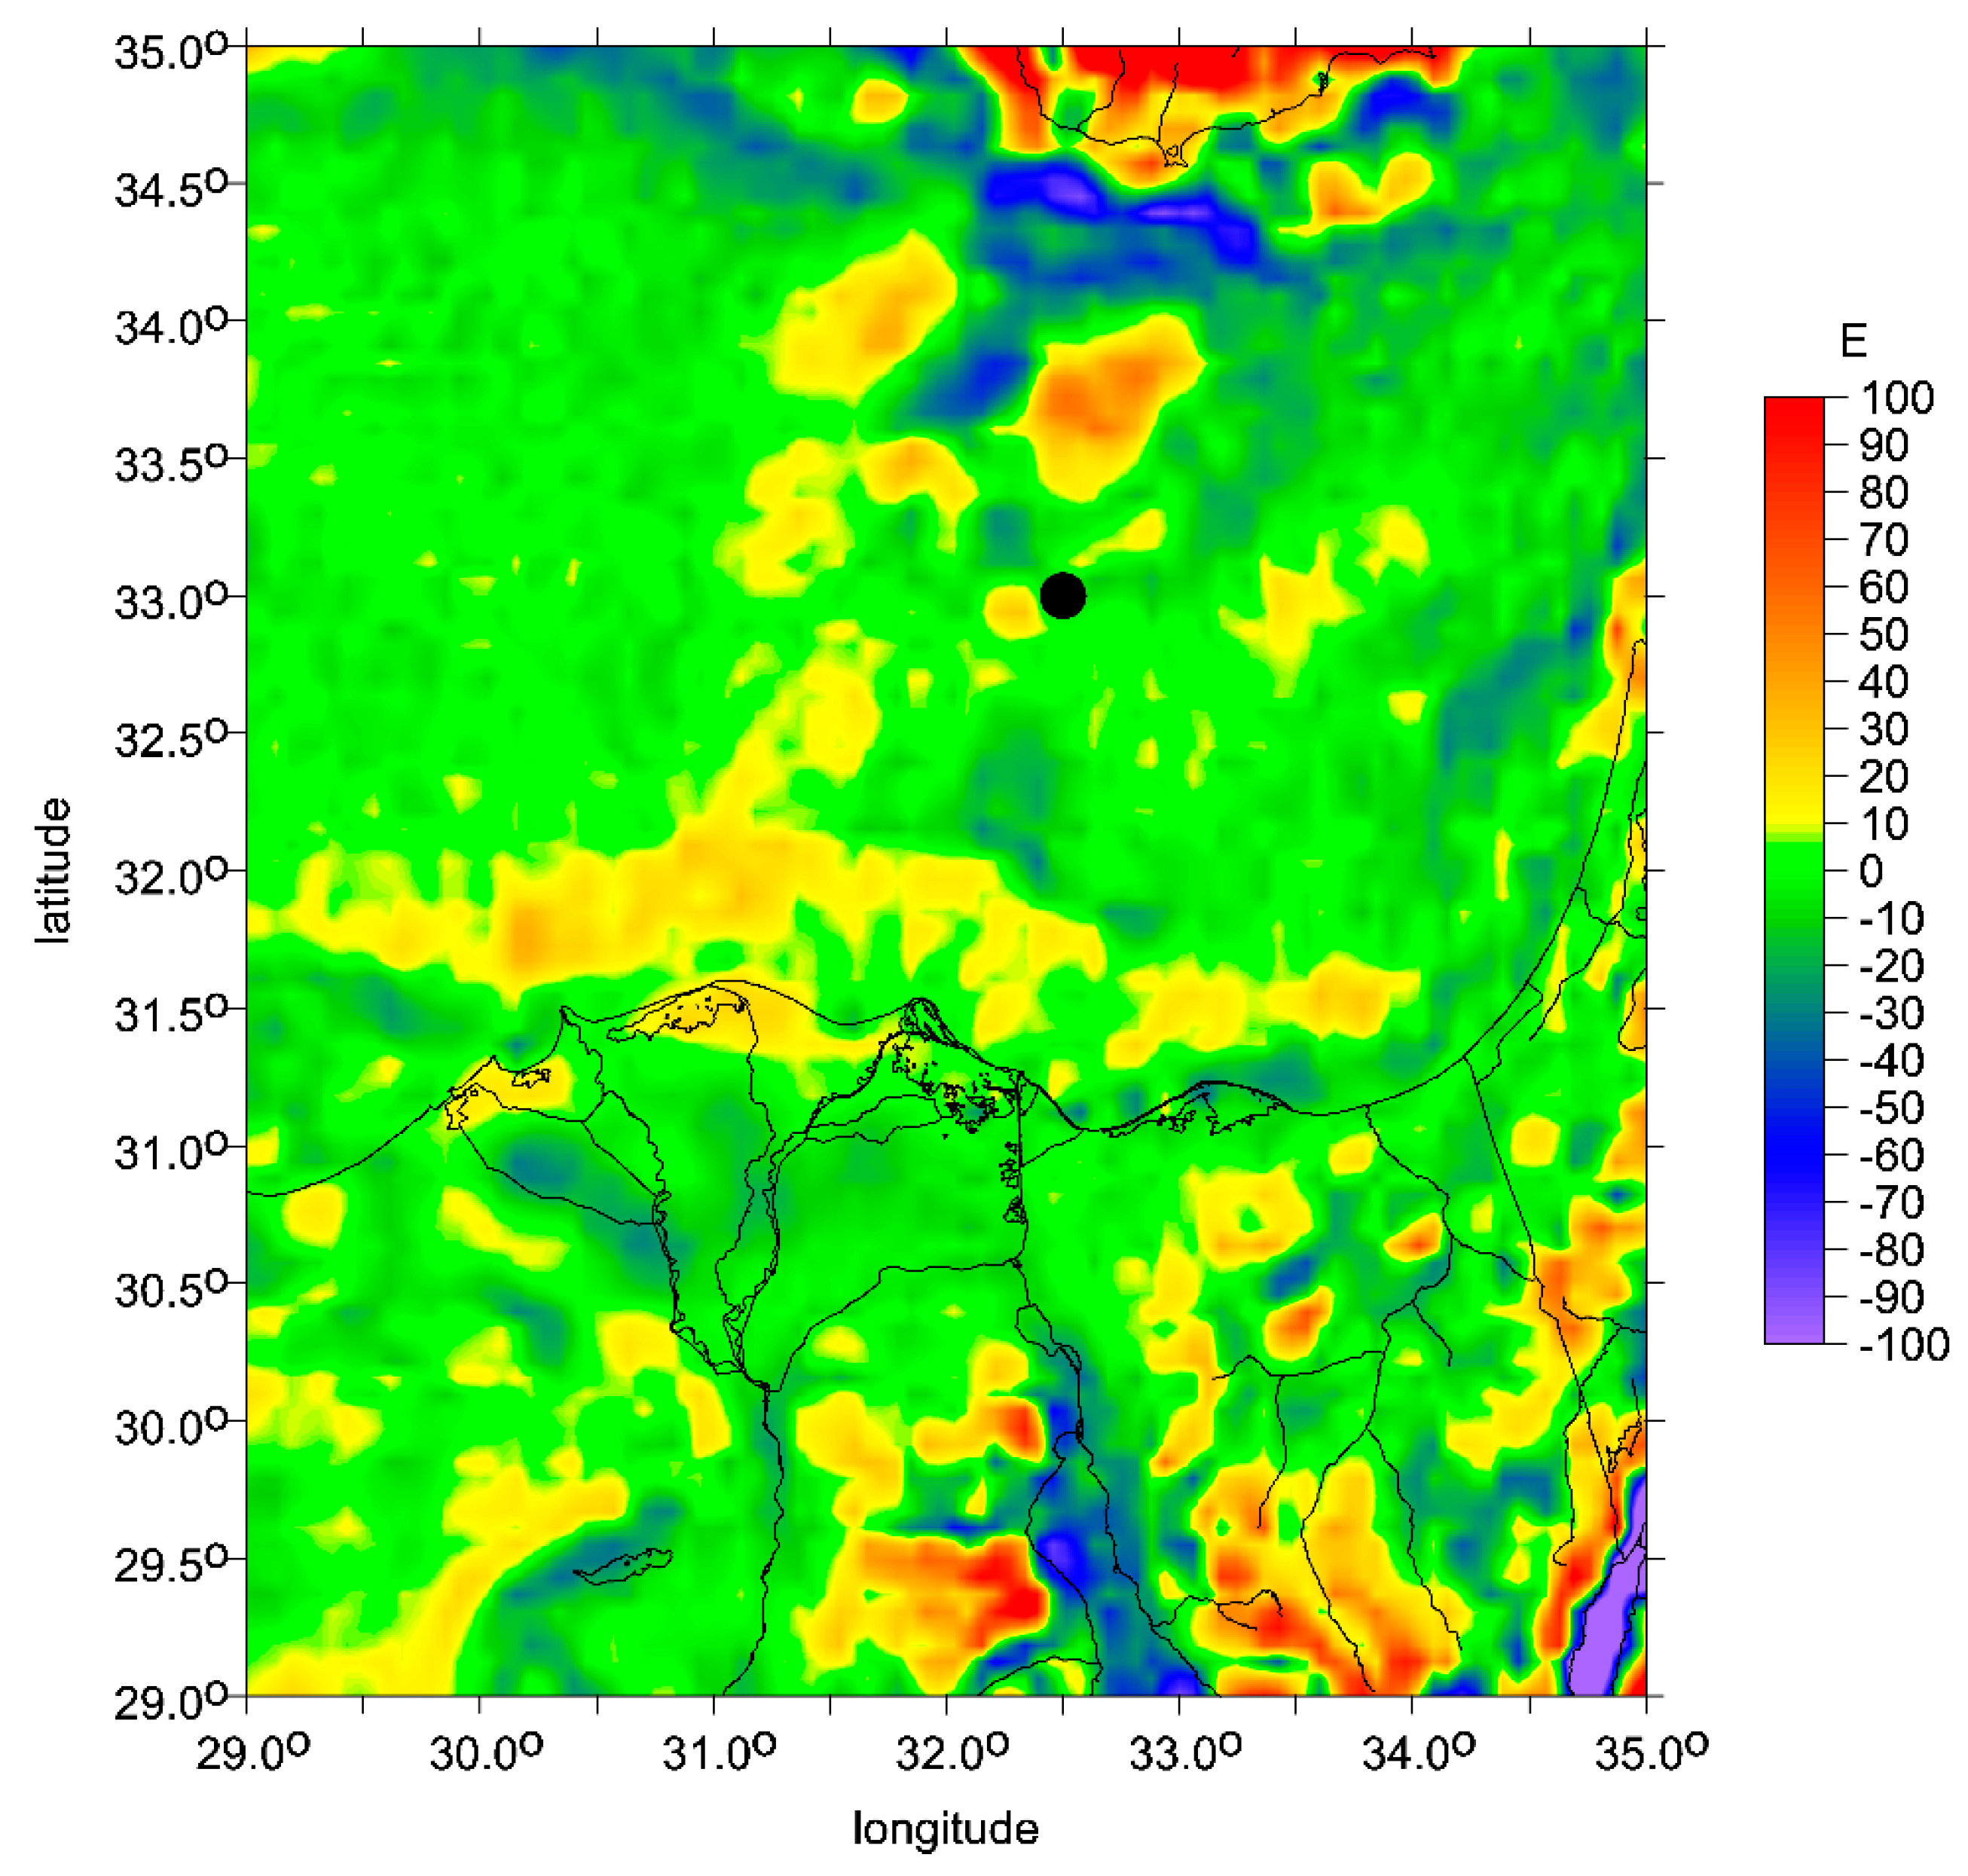
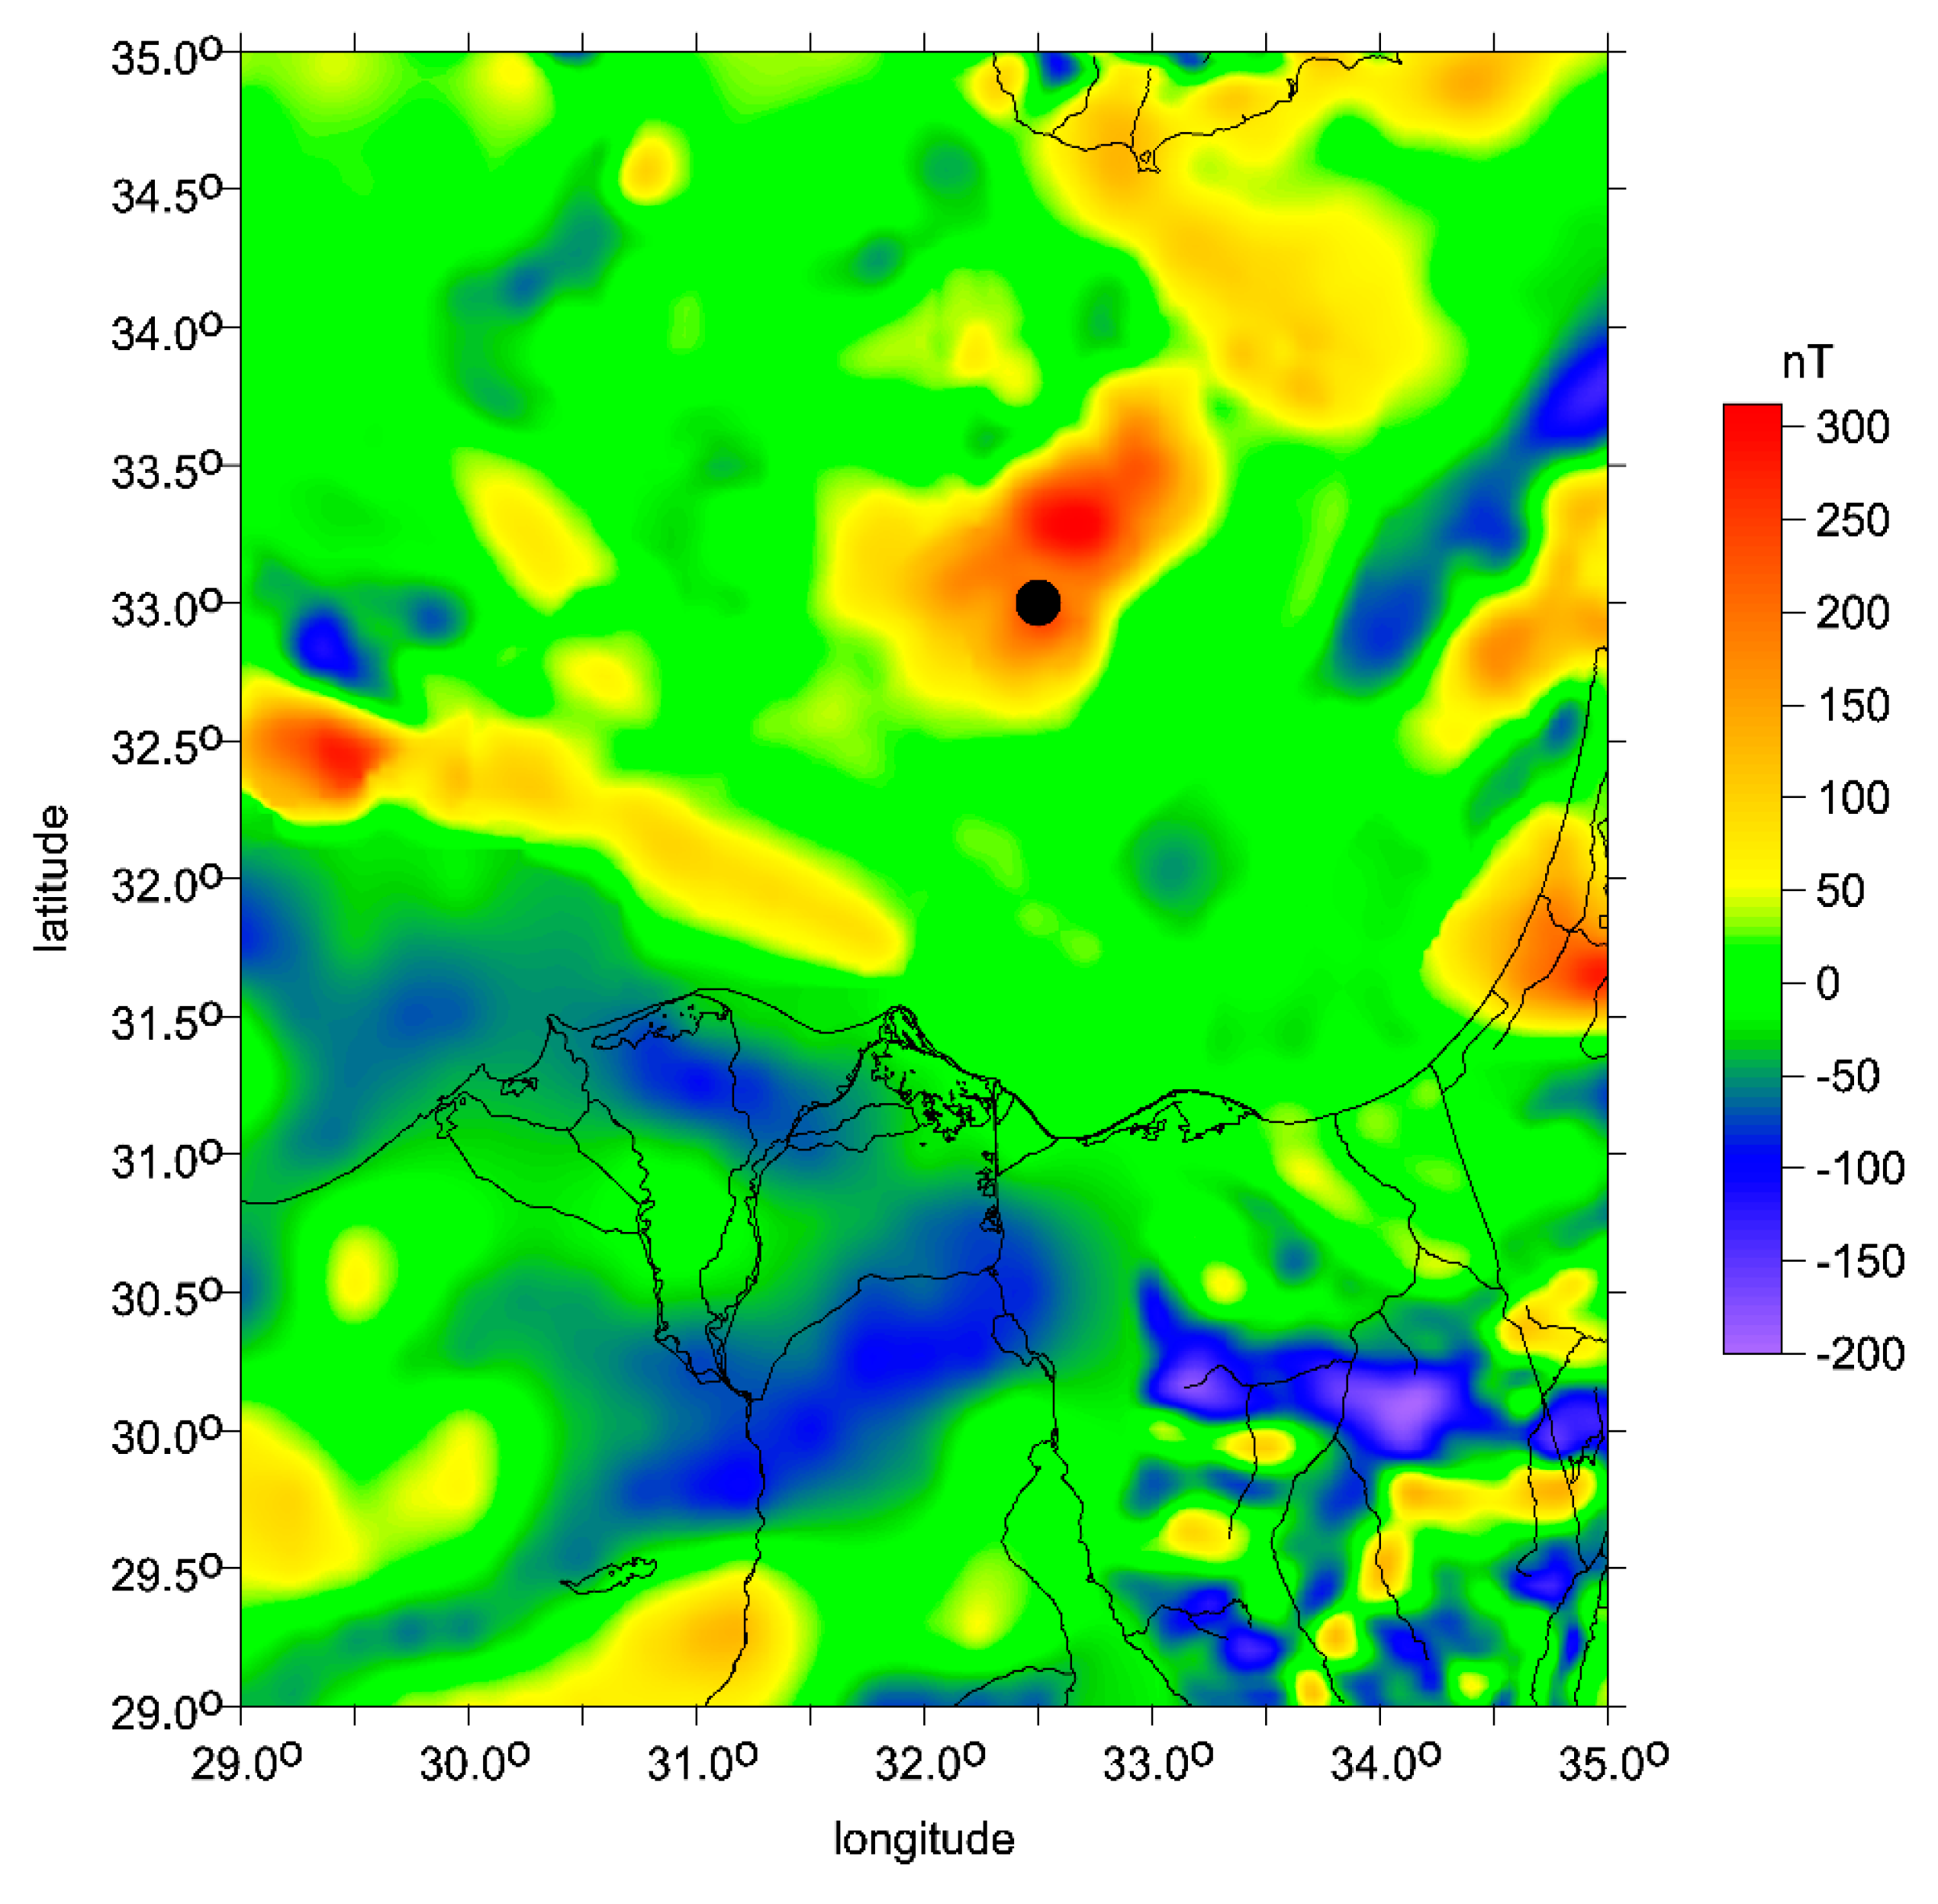
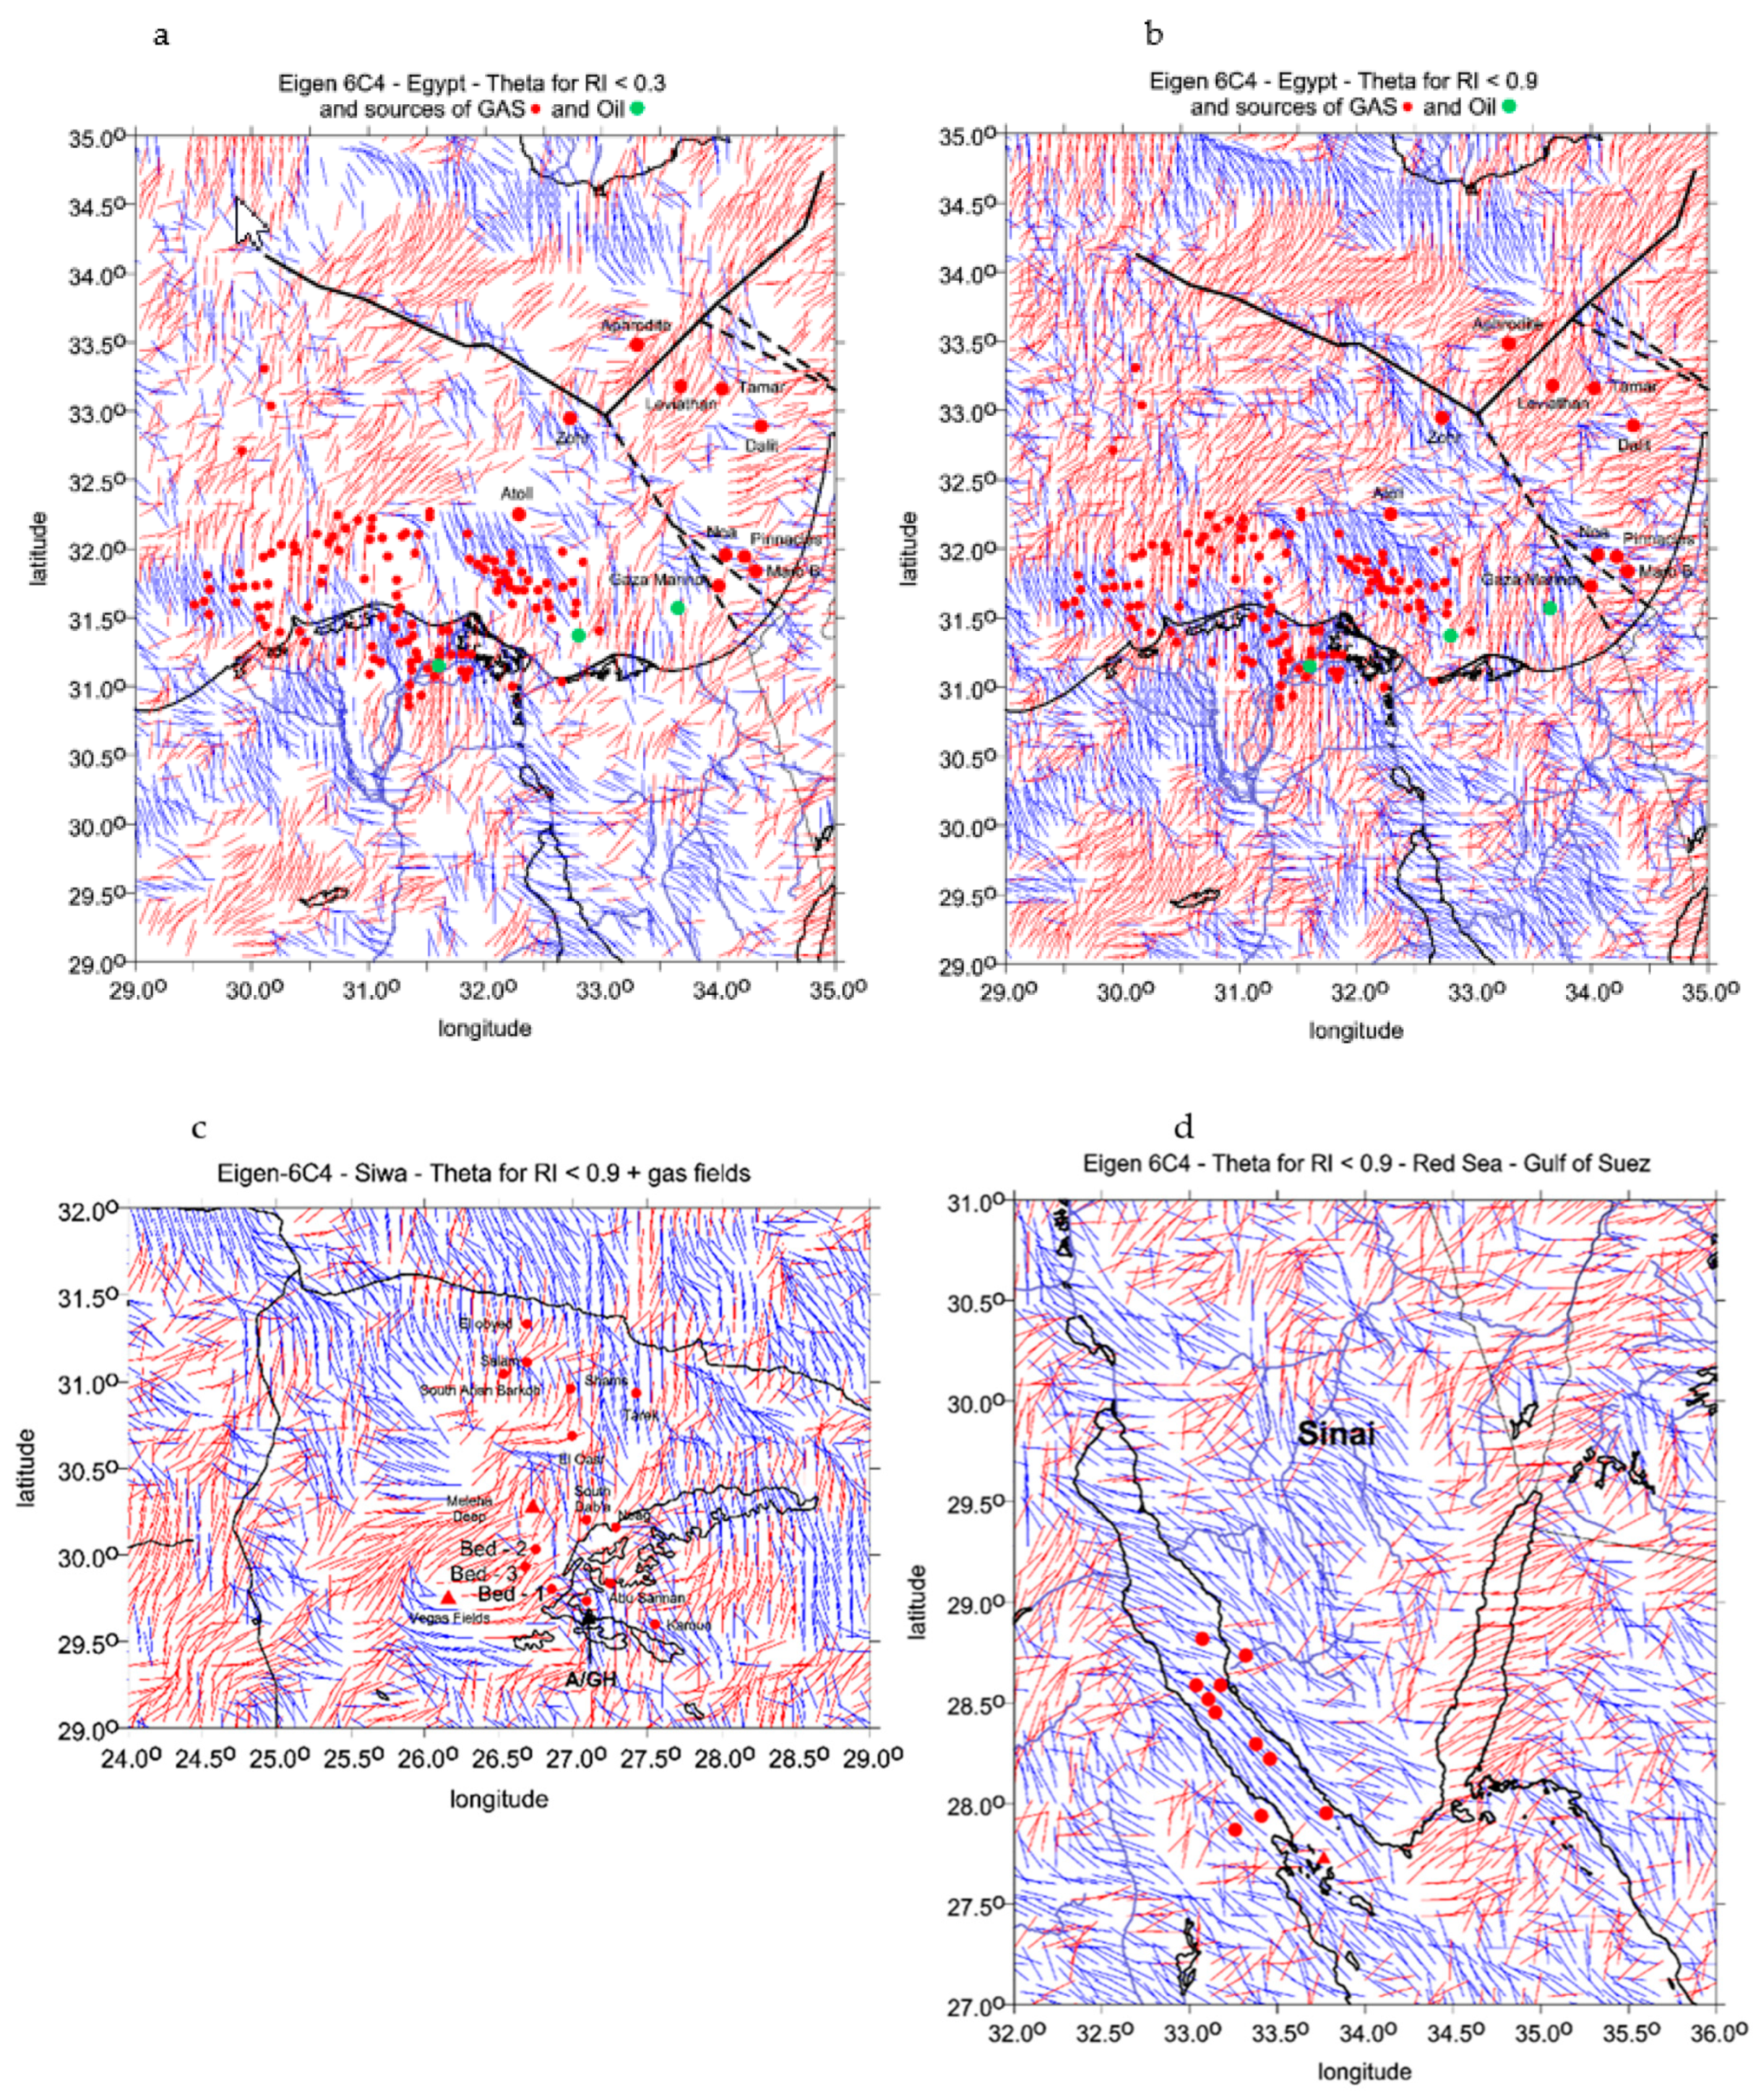
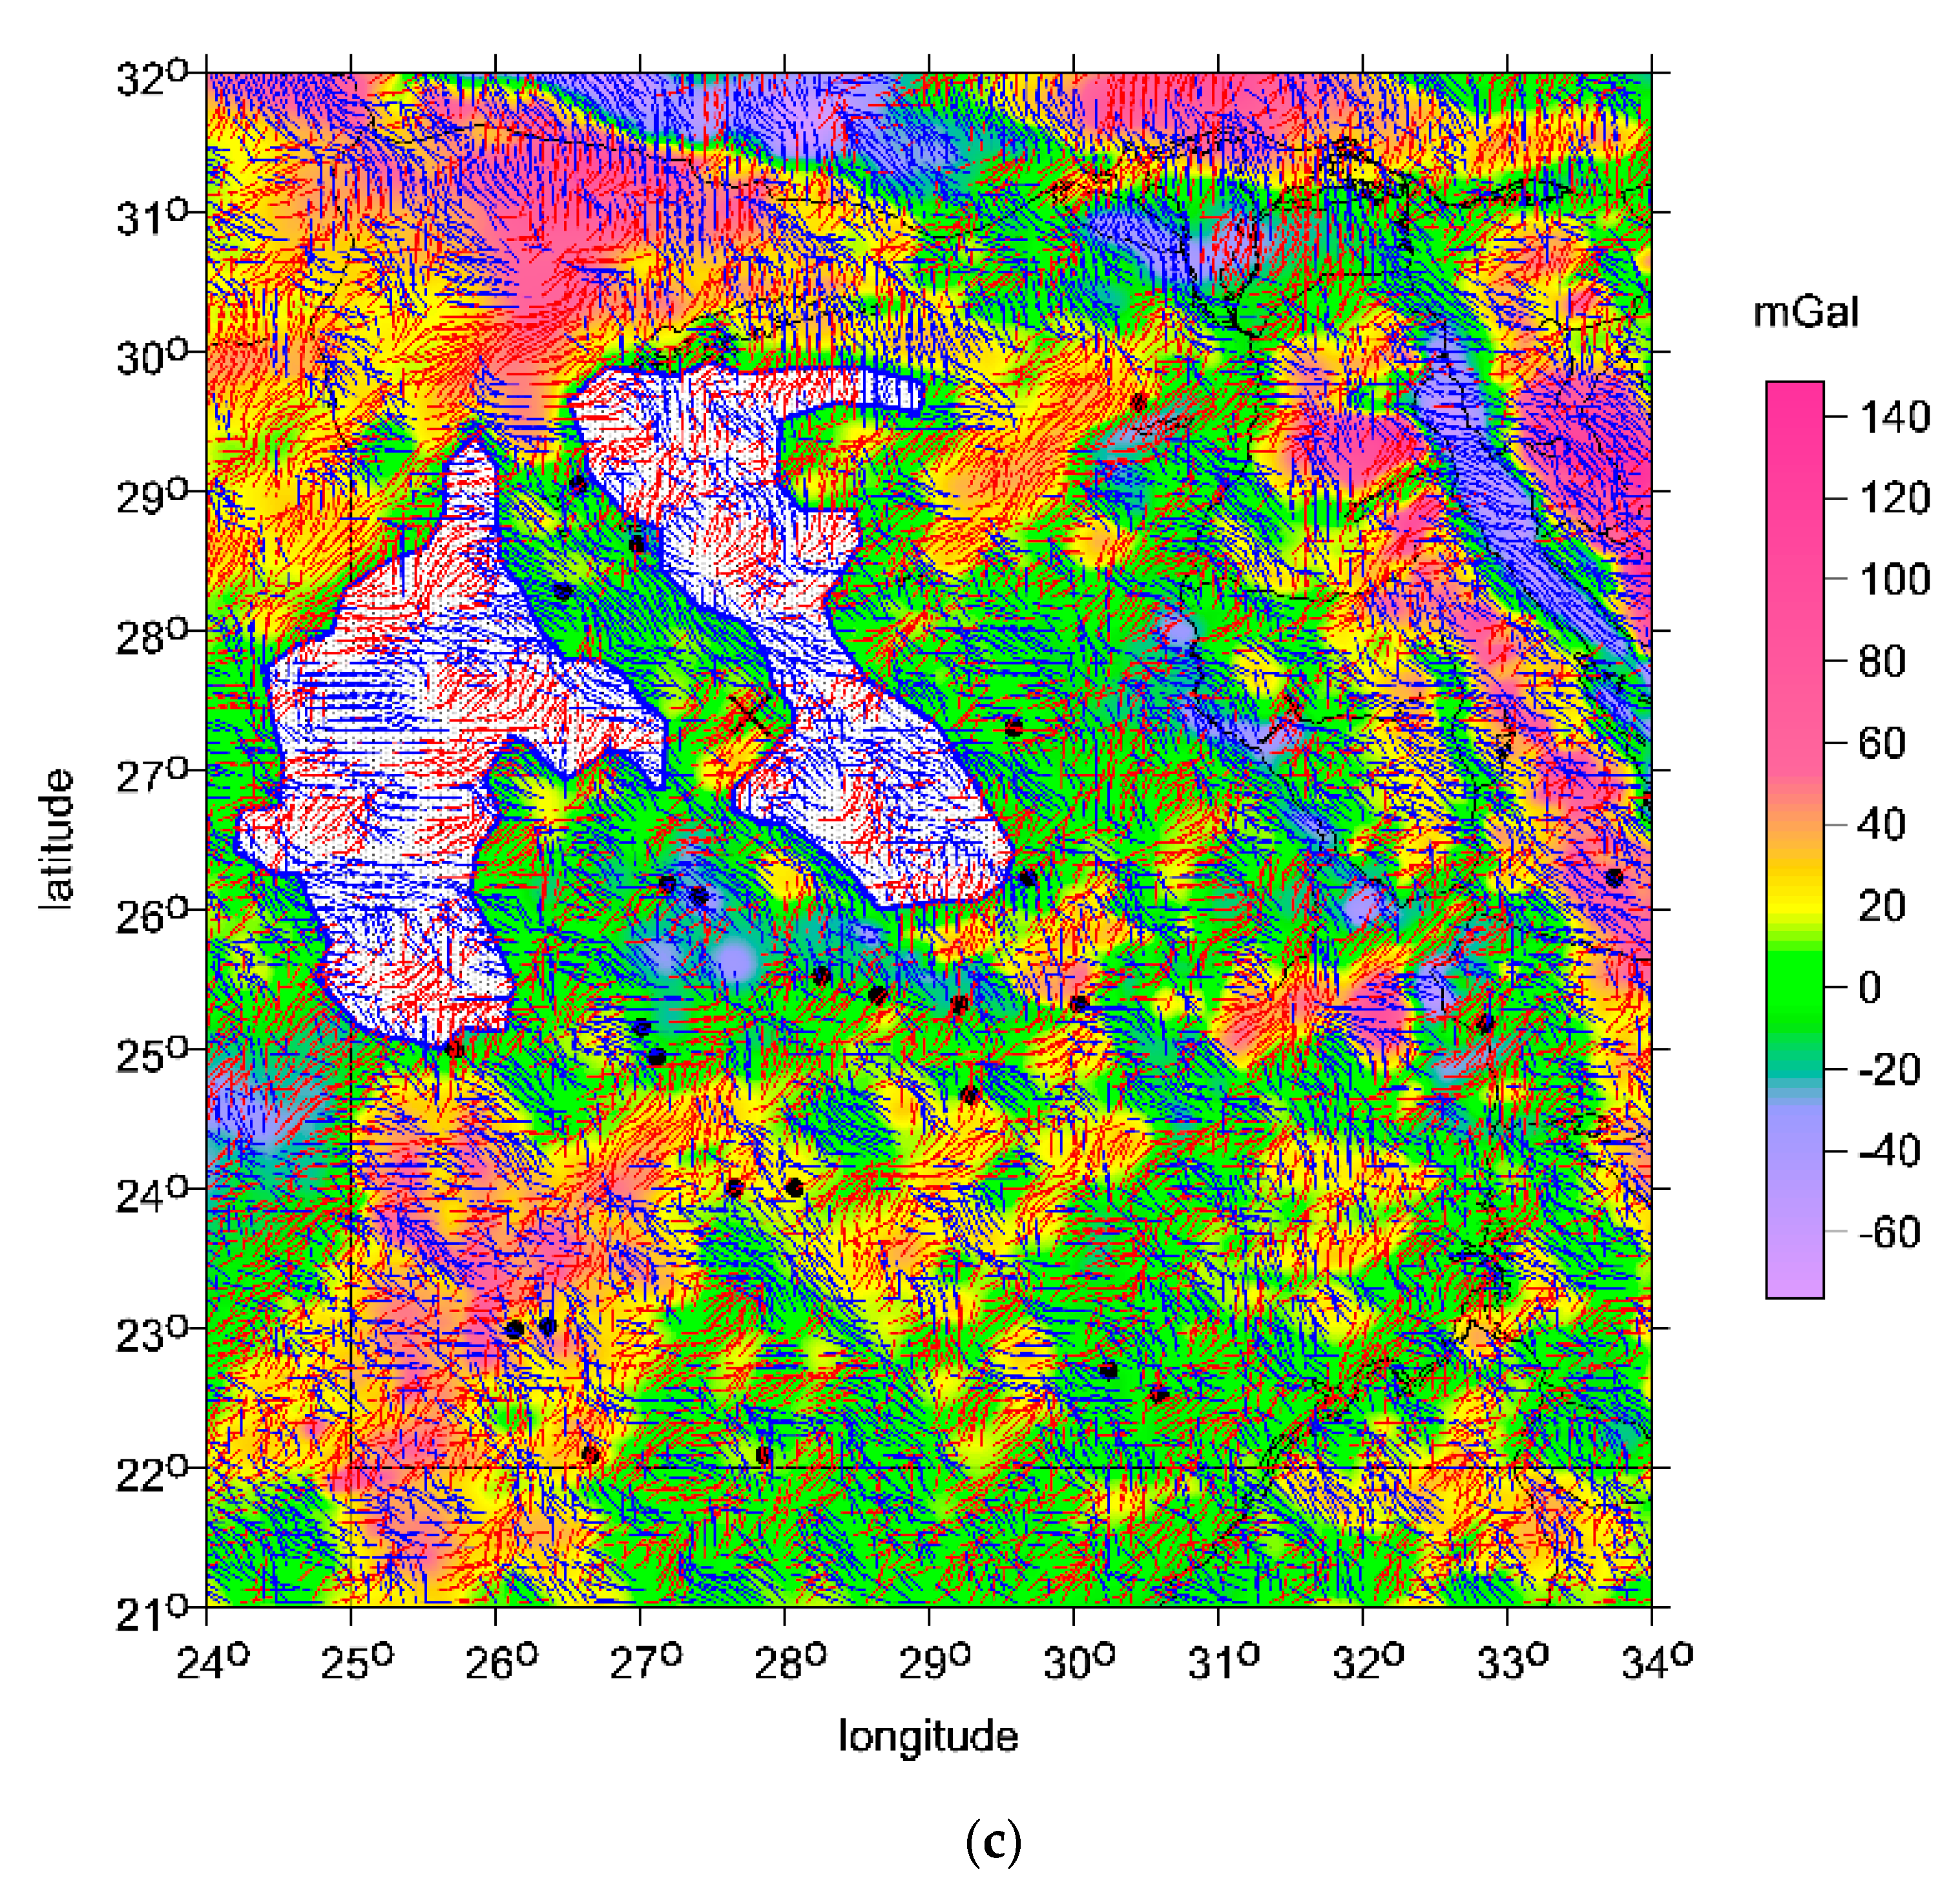
3.1. Results: Gravity Aspects and Magnetic Anomalies for Egypt

In general, there are two thirds of oil and gas accumulation located in large anastomosing rivers and their deltas. This is because such large river systems deposit and bury large amounts of organic materials that eventually become oil and gas resources [41,42]. For example, the Nile is such a large river that contributes with its sediment to the accumulation of oil and gas deposits. The Nile Valley is between eastern (slightly higher elevation and more structurally active due to normal faulting structures) and western Eocene limestone plateaus, both with more or less horizontal strata, with a small regional tilt towards NNW [43]. This geology suggests that pre-existing rivers that existed in this area were likely to flow in the NNW direction, transporting their sediment into the Mediterranean Sea, reorganizing its bottom and contributing to its diverse tectonic history [44].
We present the gravity aspects for Northern Egypt, Sinai and surrounding countries (Israel, Jordan, Lebanon, Cyprus, Turkey, incl. the whole Eastern Mediterranean). The ETOPO 1 topography (Figure 8) shows a deep ocean near Zohar; Figure 9 and Figure 10 show Tzz and vd. The most interesting are highly combed θ for I < 0.3 (Figure 11 and Figure 12) and I < 0.9 (this includes also deeper layers; see Figure 13). The magnetic anomalies are shown in Figure 14.
Figure 14 shows that the regions east of the Nile delta have a clear absence of significant magnetic anomalies; see the next section for discussion of its interpretation.

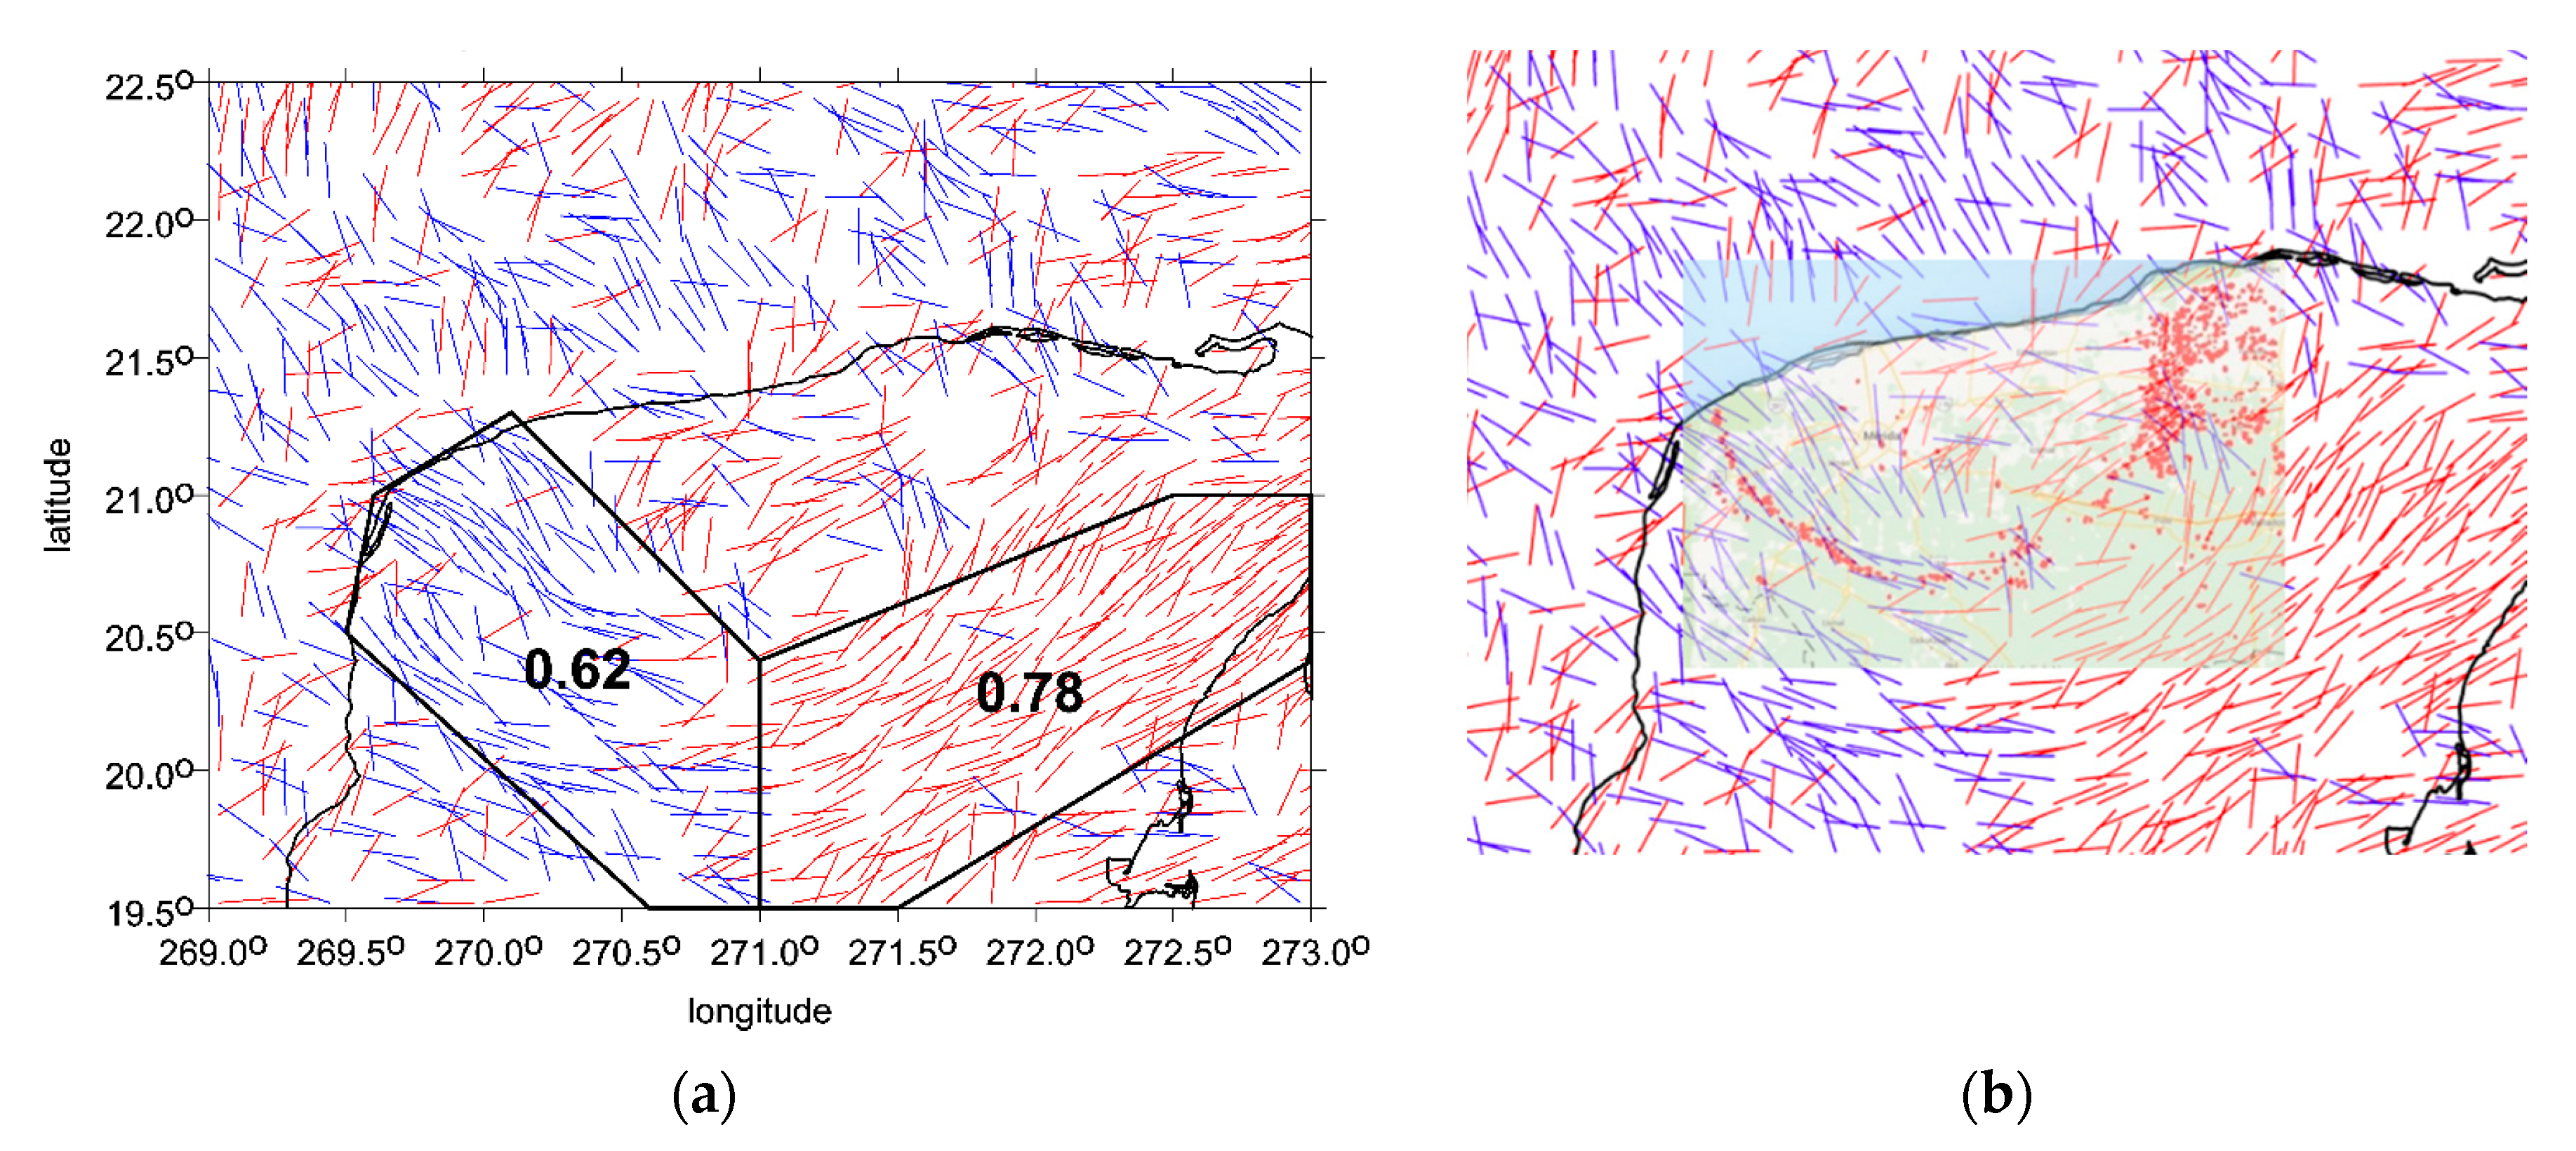
3.2. Discussion: Correlation of Oil and Gas Deposits with Combed Strike Angles

The maps with oil and gas deposits (Section 2.4.3) were plotted together with the strike angles θ (Figure 15a–d) for the Nile delta, Mediterranean Sea, Suez/Sinai/Red Sea and Western Egypt near Siwa to determine whether and how much the combed θ correlate with the locations of known TD. They correlate well in all locations that we tested: any larger deposit of TD is marked by the combed θ. This is a positive finding. Somewhat disquieting is the fact that they correlate on many further places, often close to or being a “continuation” of known deposit sites, but the combed strike angles are also on many other places separated from known digging spots.
This can mean two things: (1) this new method truly navigates to new places with potential TD. However, (2) it is good to recall here the axioms from Section 2.2 explaining that the combed θ do not automatically mean that the deposits exist there, and correlation does not mean causation. The combed θ generally provide information about changed porosity but the reasons for this are diverse and mean various things (for example, groundwater). Figure 12, for example, shows highly combed areas of θ (I < 0.3) in regions of Egypt, Israel, Jordan, Saudi Arabia, Lebanon, Cyprus, regions of Turkey and Saudi Arabia, and the Eastern Mediterranean. All these places are candidates with potential TD.
We can conclude that such maps as in Figure 15a–d (possibly with zooms) may navigate the investigator to new possible deposits of TD. This suggests the possibility of new discoveries and indicates that researchers should seek to investigate such localities by traditional, much more expensive, methods.
Recall that Figure 14 shows that the regions east of the Nile delta demonstrate a clear absence of significant magnetic anomalies, which indicates that the magnetic sources are fairly deep and that the significant thickness of material in this region is without significant concentration of magnetic materials and/or does not contribute to a larger block of significant magnetic remanence. This is likely due to the pre-existing deep sea floor that was being continuously filled with the sediment eroding from the African continent. In general, the regions of less contrasting magnetic anomalies are consistent with pre-existing impact structures [45,46,47].

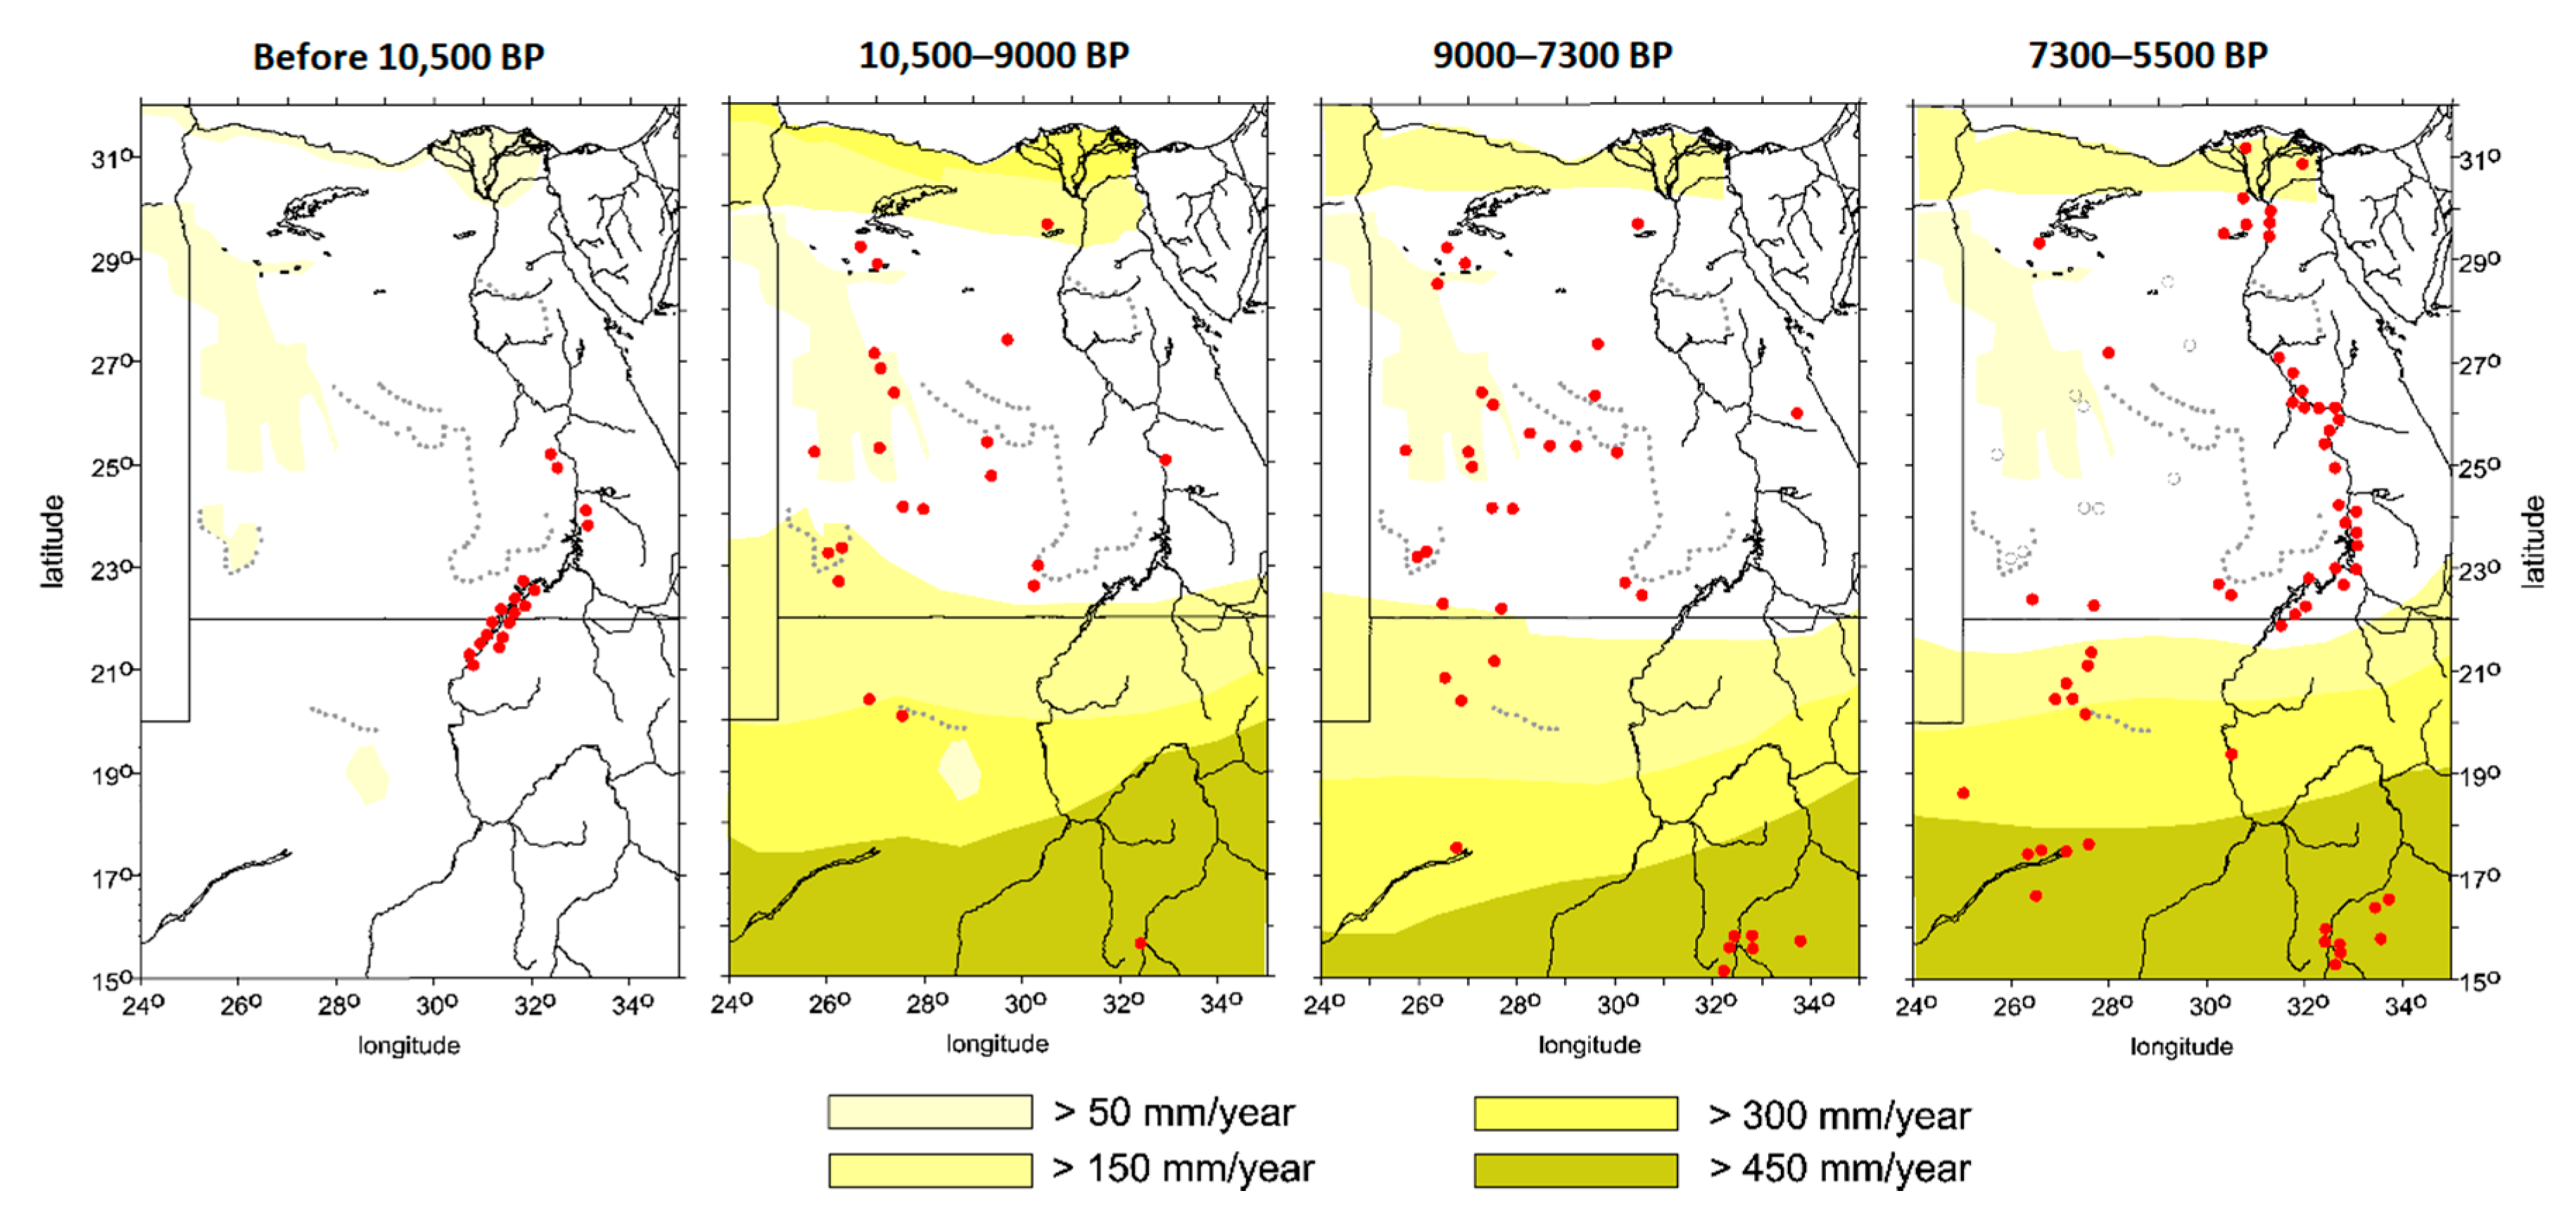
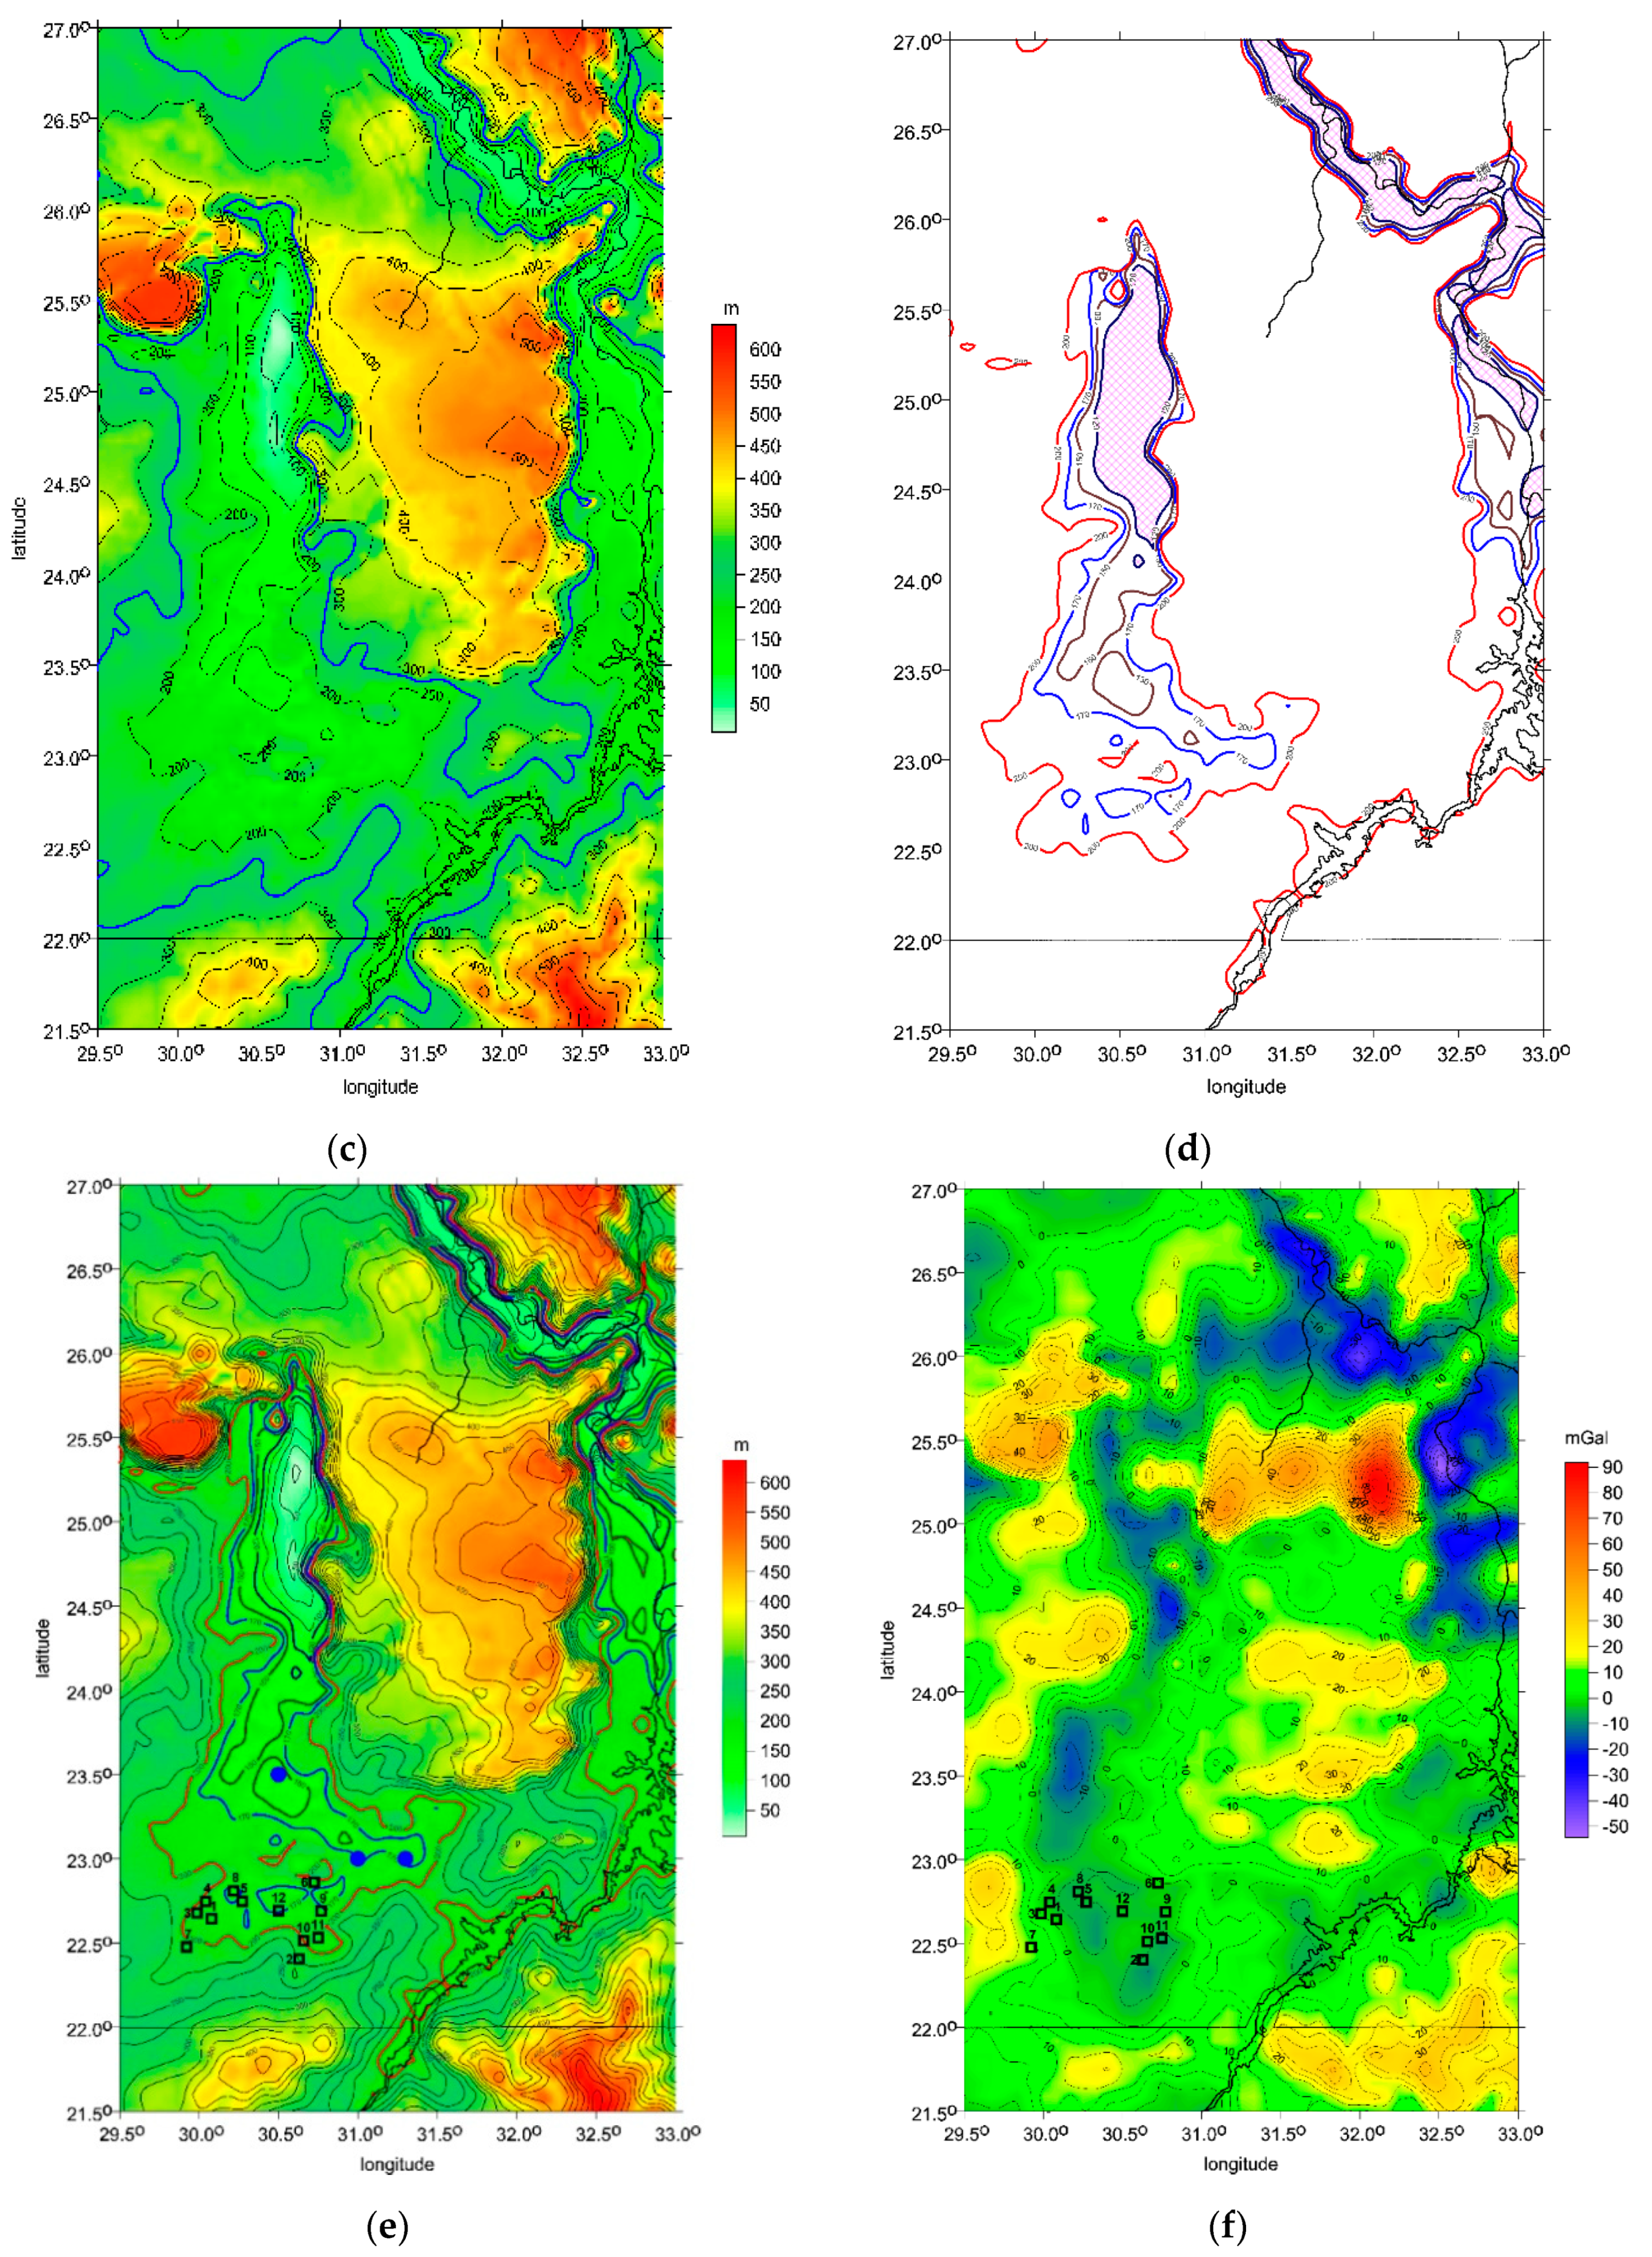
4. Paleolakes and Groundwater

4.1. Introduction, Method and Its Limitations

4.1.1. Introduction

Paleolakes and their implications for groundwater accumulation in the Eastern Sahara and namely in the Great Sand Sea (GSS, Western Desert of Egypt) have been mentioned already by El-Baz [48]. He wrote (p. 60) about the drainage encompassing the GSS, about two wells drilled for petroleum exploration near the northern edge of the GSS (p. 64) and about the relationship between sand dunes and groundwater; we quote from p. 65: “… sand was borne by water and sculptured by the wind. It follows that areas with large accumulations of sand dunes host much groundwater beneath the surface.” The reader can compare this conclusion with our new findings, described in this section (namely Section 4.3) and in [4].
Paleolakes are places where long-term sedimentation has resulted in complete sediment fill of the lake. This has been the case in many lakes that formed after the last glaciations, due to large blocks of ice left in the glacial tilt that created landscape dimples filled with water, creating lakes. These lakes are continuously being filled and become paleolakes [49,50]. Each paleolake has clay sediment that creates a break in water flow in paleolake sediment volume and generally preserves the volume of water content. Paleolake deposits can serve as a long-term water storage and determining their locations may be useful in discovering significant sources of water bound in lake sediments of paleolakes.

4.1.2. Our Method to Detect Paleolakes

A new method, independent of all others used till now, to detect paleolakes via their gravity signal (using the gravity aspects) has been proposed and tested in [3] for the Sahara and in [1,4] with implications for geoscience and archaeology in the Sahara, specifically in North-Western Egypt (GSS). The method was mentioned in Section 2; here, we provide further details.
The first step is to transform differences in the gravity anomalies to height differences to estimate roughly where the paleolake might be located and how large/deep it might be. We make use of EIGEN 6C4 and ETOPO 1 for this purpose.
Then, taking the available archaeological literature, the positions of archaeological sites are utilized for a fine-tuning of the lake level, extent and shape such that the known archaeological sites would be at its shore for the given epoch. In our recent study [4], the positions of archaeological sites with remains of Holocene occupations between ~10,500 and ~7300 BP in the Western Desert of Egypt were utilized (following [24]). For the current study (see Section 4.3), the input data gathered in Table 1 include more detailed and more recent data for the southern part of the Egyptian Western Desert as compared with [24].
The use of combed θ to co-predict groundwater or paleolakes and paleorivers will now be extended outside North-Western Egypt. Here, we show, first of all, the strike angles over the entire country of Egypt (Figure 16a). Many areas contain combed θ, as expected, including the hypothetical paleolakes in the north-western part of the Egyptian Western Desert (Figure 16b,c). Moreover, other areas have often combed θ; see below. We cannot exclude the presence of groundwater, oil and gas or a combination of them (because they often appear together) in such locations. This alone would be a very interesting result for Egypt.
How can we proceed to estimate the position, depth, shape and extent of a hypothetical paleolake?
(1)
We transform the maximum existing gravity anomaly difference in the investigated area (read from the map of Δg; here, from EIGEN 6C4) to the height difference. This provides a maximum estimate of the depth when the lake is fully filled with water.
(2)
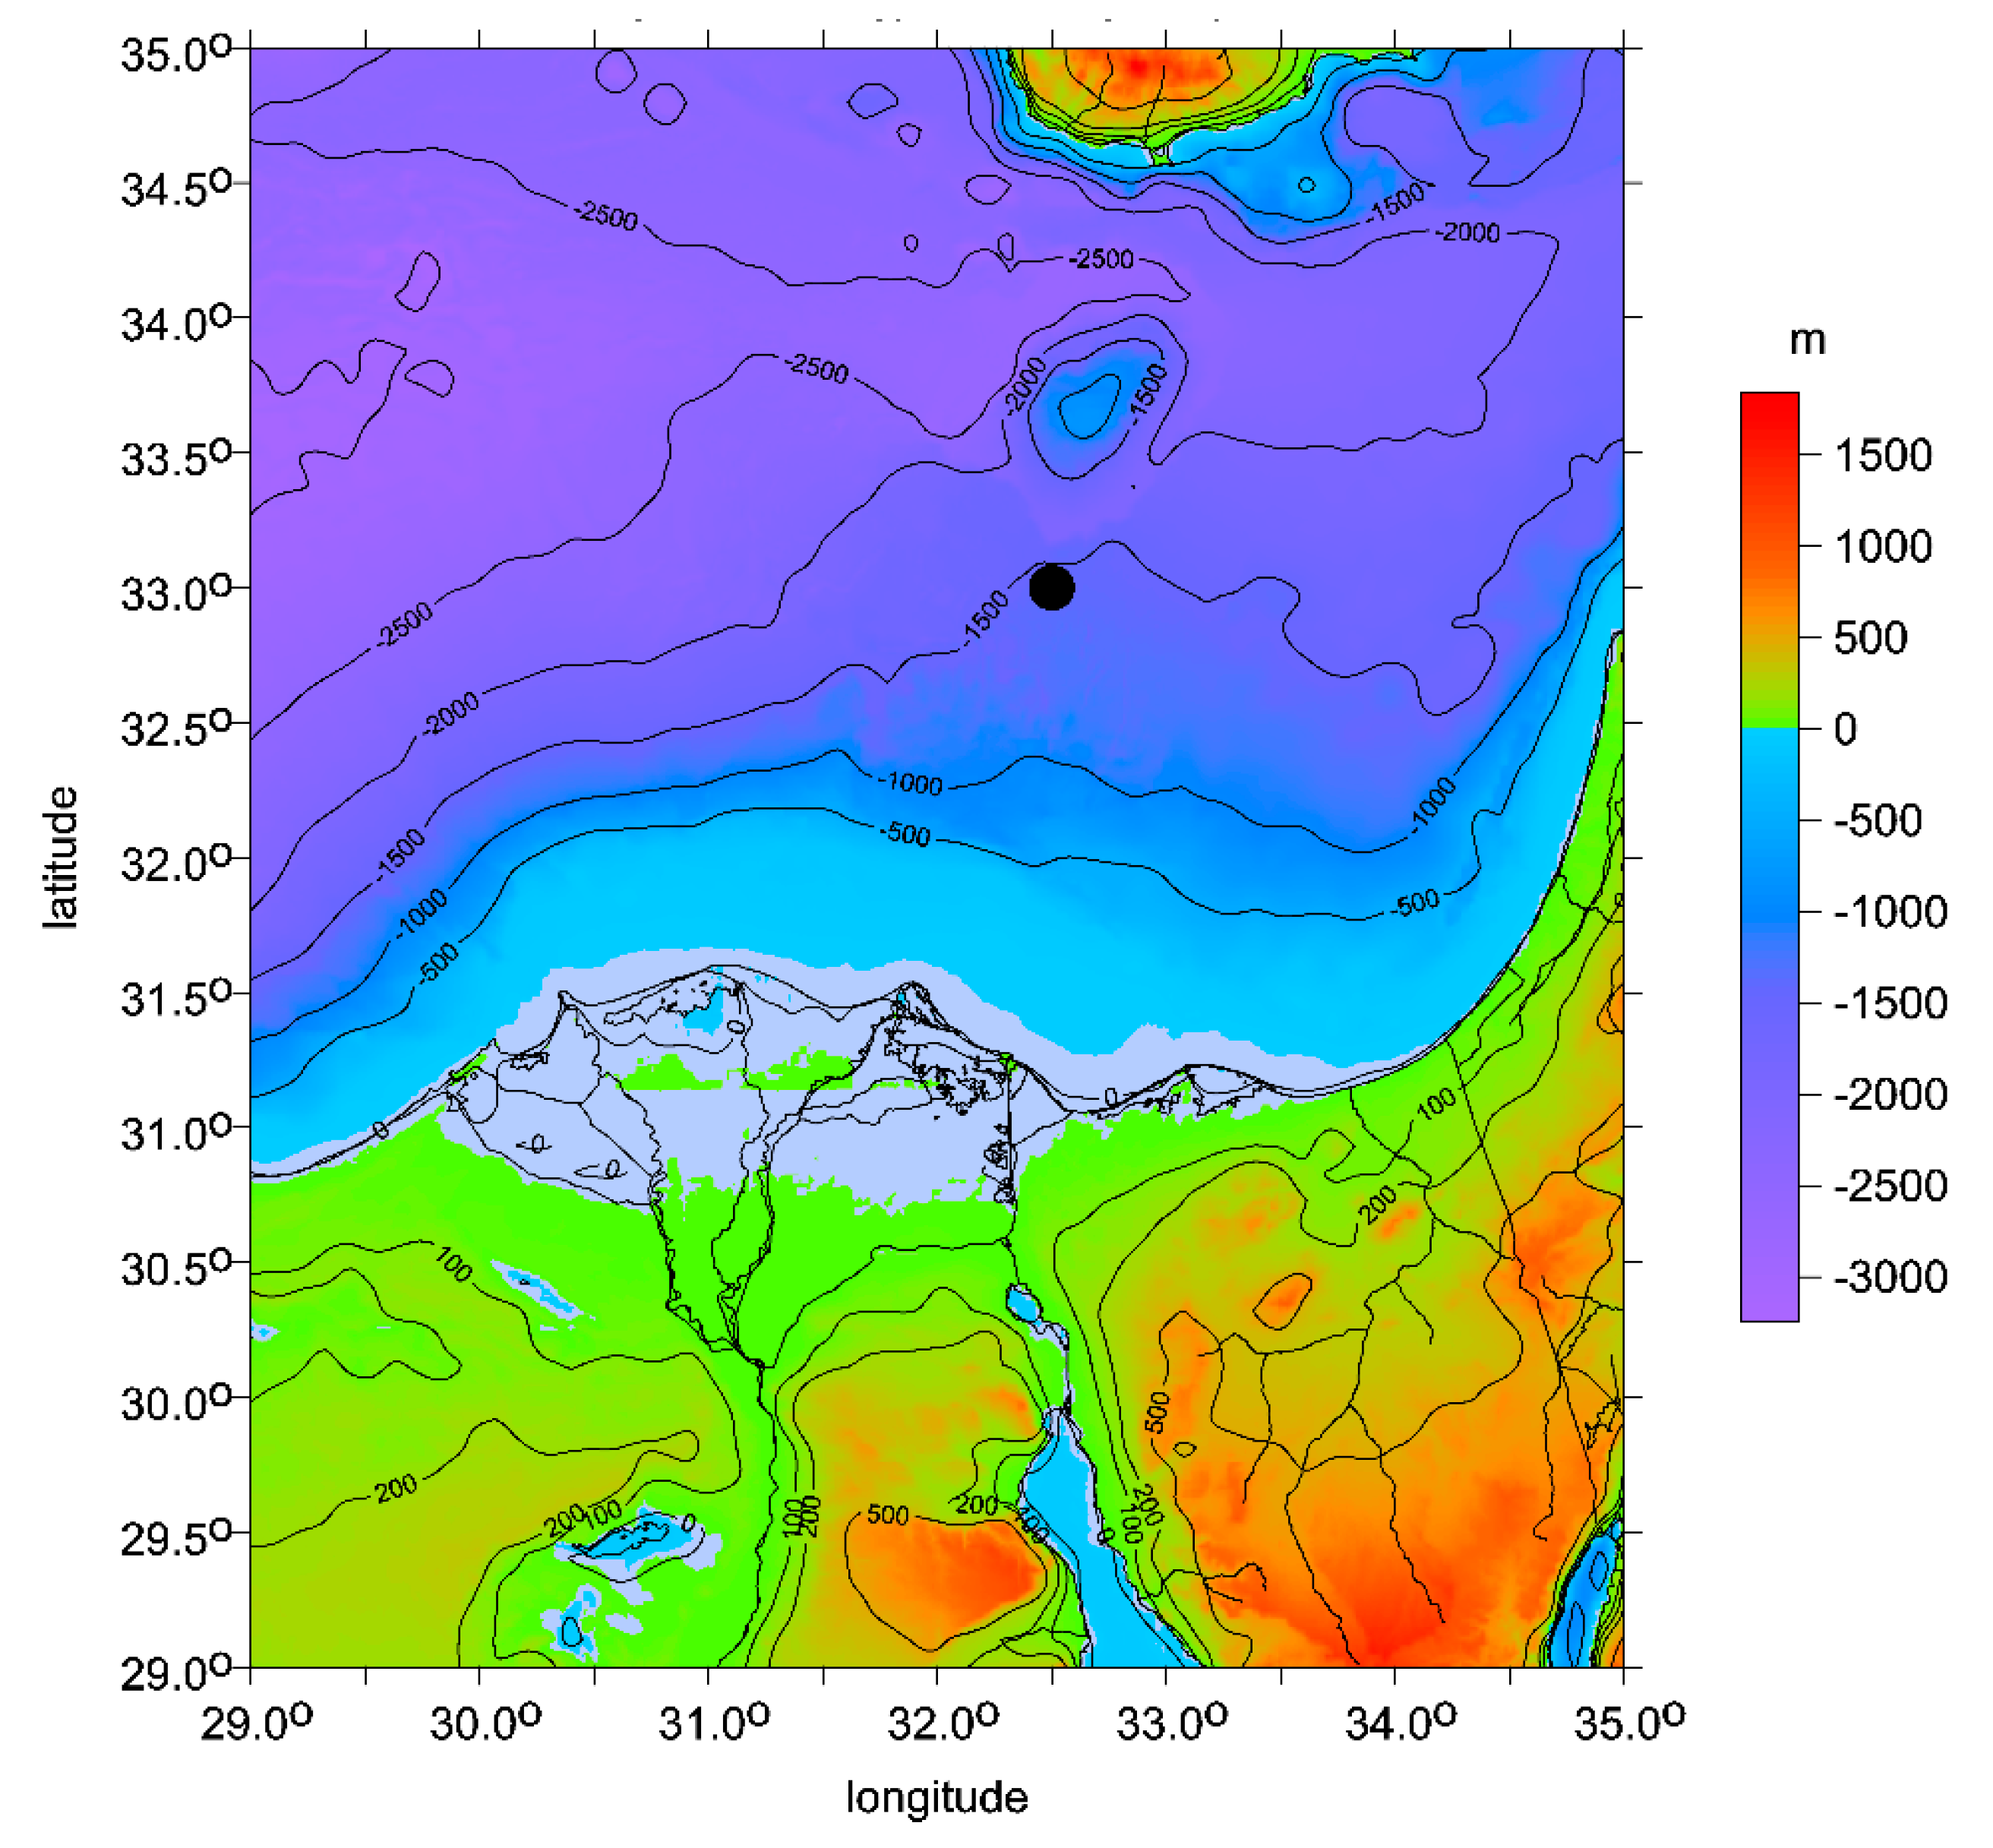
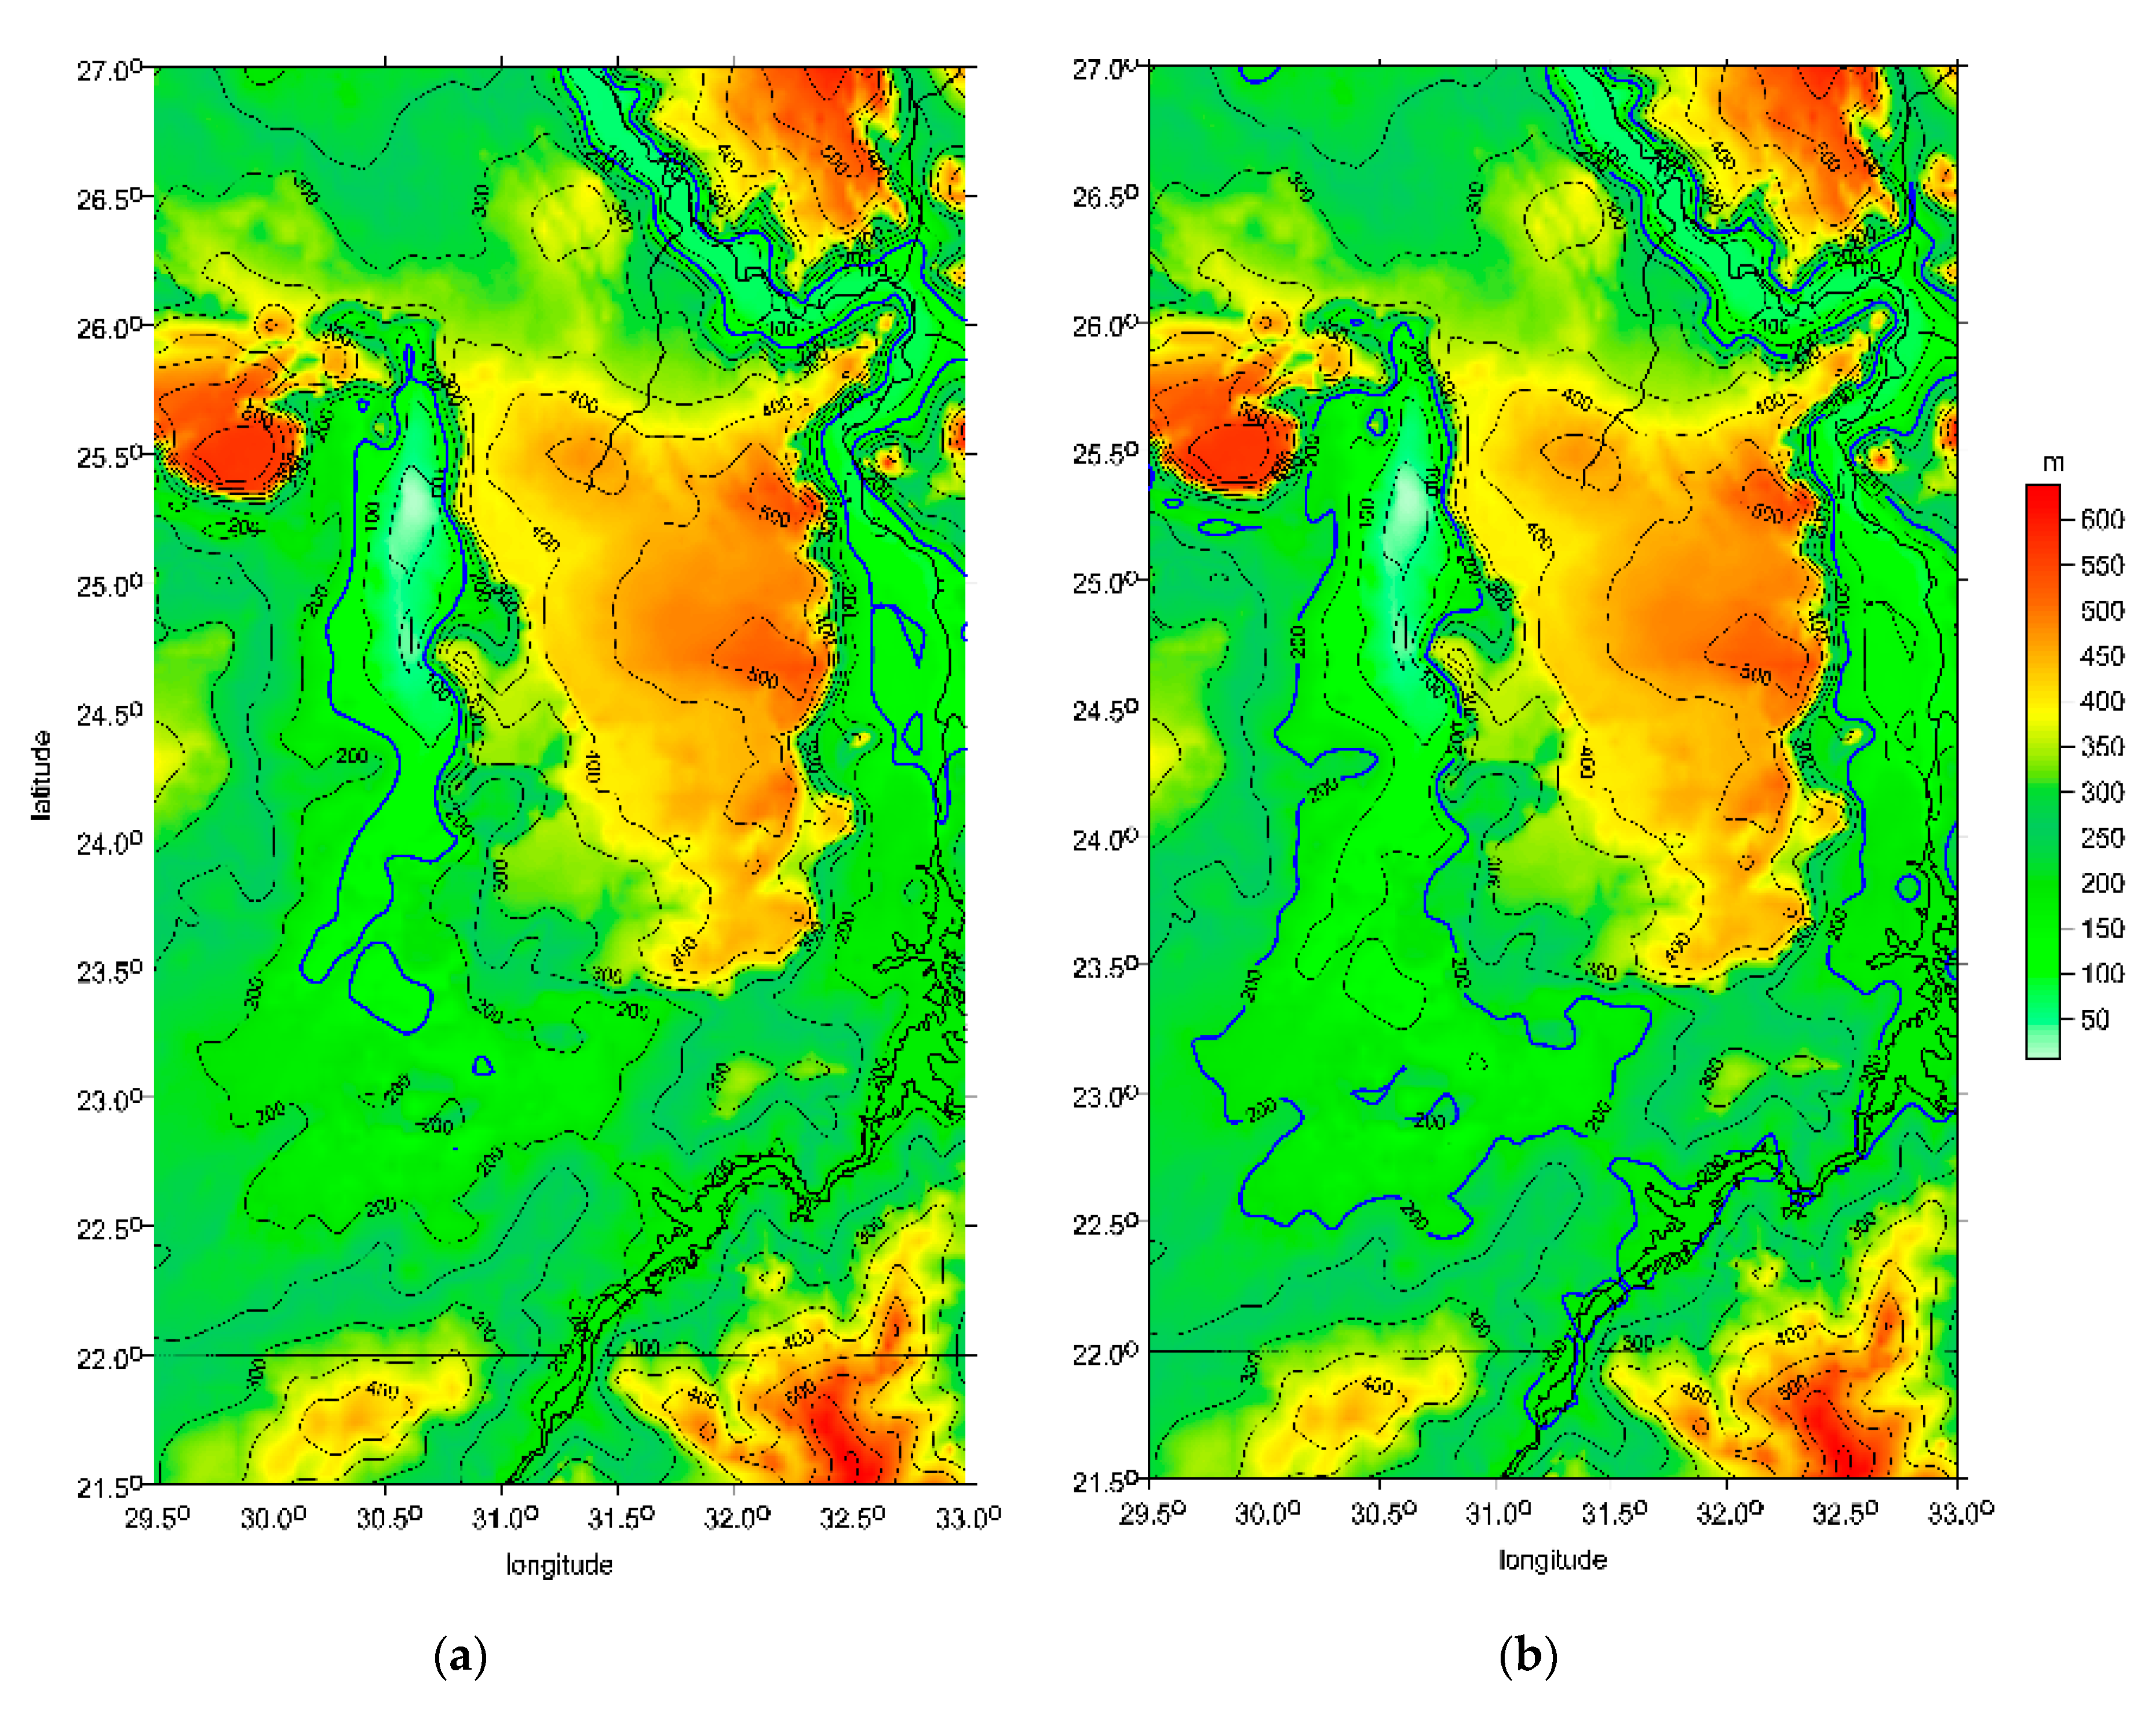
We plot surface topography (here, ETOPO 1) and select a few appropriate contour lines for a realistic range of the paleolake level estimate.
(3)
We plot the known locations of archaeological sites (Table 1 in this study, and [24] in [4]) into the maps of topography and check whether and how the sites correlate with the water. This is the final fine-tuning of the lake level.
For complete figures, see [1,4]; one is reproduced here as Figure 16b, and one new figure is added as Figure 16c.

4.1.3. The Limitations

We also should keep in mind the accuracy estimates of the input data that we work with to realistically estimate how accurately we can determine the water level. This analysis may seem unpromising and the results surprising, but we seek to avoid unfounded optimism.
(i)
It is important to provide the geodetic positions of archaeological sites up to arc-seconds (as in Table 1) because, in the real world, these are always clusters and areas, not points (we recall that 1 arc-second is ~20 m and ~30 m on the ground in latitude and longitude, respectively). Moreover, ordinary figures cannot utilize such high precision.
(ii)
It would be inappropriate to provide heights in asl to the individual meters, because accuracy estimates for them, derived from recent topographic models like ETOPO 1 (Section 2.4.2), is σ = ±20 m.
(iii)
We must account for a floor—say 20 m—for sand layers between Kharga-Toshka, much less than in GSS, but certainly not zero. This means that higher values can now be achieved.
(iv)
For both the Pleistocene and Holocene, we must account for fluctuations in lake levels between, but also within, the individual phases of one and the same humid period.
Accounting for all the above, let us recall that the realistic accuracy estimate (square root of sum of squares of (ii) and (iii)) for any paleolake level suggested by our method is ~±30 m. This is the best possible estimate. This limitation is not a failure of the method but the result of imprecision due to the input data. Today, there are few better tools available than Google Earth or the ETOPO 1 or ASTER GDEM topographic models. Some authors and users too optimistically rely upon the given data without critically evaluating their precision. This is not the case here; hopefully, this realism will not be taken as a limitation.

4.2. Notes to the Great Sand Sea: Results and Discussion

We only recall here that it was found [4] that the locations of archaeological sites adopted from [24] (their figure 3c) correlate with the features found from the gravity data assuming logically that the settlements were built at paleolake borders or at rivers. Based on these findings, we suggested the position, extent and shape of the paleolakes [1,4].
In turn, there is the possibility to excavate and locate ground potable water outside the known oases (Siwa, Bahariya, Farafra, Dakhla, Kharga; Figure 5)—for example, directly below the thick sand layers (to 200 m thick) in the Great Sand Sea (GSS) on the Egyptian–Libyan border. At first glance, this appears unfeasible.
We have investigated this area in [3,4] and, here, we only outline the results about the GSS which are useful and overlap with our new research on the Kharga-Toshka (TK) possible paleolake (Section 4.3).
First, we recall Δg for North-Western Egypt with contours for the hypothetical paleolakes at two levels of Δg differences, 15 and 30 mGals (Figure 16b); then, we present θ [deg], I < 0.9 (Figure 16c), both together with archaeological sites from [24]. The results are as follows: (1) In contrast to the flat topography of the GSS, there are evident and large gravity lows. (2) The strike angles are clearly combed. In Section 4.3, we add (3) height profiles and Δg profiles roughly from south to north along the Egyptian–Libyan border from Gilf Kebir to Siwa for a comparison with the TK hypothetical paleolake. The profiles exhibit up to 200 m difference, indicating the likelihood of a thick sand layer.
The GSS hypothetical paleolake contains a volume of cubic kilometers of clay and bound water. This paleolake was filled with sediment and subsequently covered by a thick sand layer, as is its current state, up to 200 m thick. Often, dried out lakes, playas, have surrounding topography allowing the existence of so-called intermittent lakes and streams, which allow partial water filling during occasional storms. In these cases, the playa often may contain an artesian well system that becomes active shortly after the storm [51].

4.3. Hypothetical Paleolake between Kharga and Toshka

While the GSS in North-Western Egypt has recently appeared, at first glance, improbably as a (paleo)lake or a river system or a combination of both, the “lowland” (depression, valley, long and relatively narrow bowl) south of Kharga appears to be a very logical candidate (Figure 17a). During wet periods, water would be gathered by gravitation. Archaeologists anticipate that there was a lake (see below).
In Figure 17a–d, we show the ETOPO 1 topography, then Δg, Tzz and vd for the area between Kharga and Toshka, where we seek another paleolake (TK). There is a topographic bowl; there are also local minima of Δg and Tzz and compression in vd. There was evidently ample space for a lake/inner sea/river system some time ago when the Sahara was green; the TK lowland was filled, probably repeatedly, by water.
How deep and large might a hypothetical paleolake be? We will repeat the task carried out for the GSS from [3] now for the TK.
With the relationship between the free air gravity anomaly Δg and the relevant height difference Δh (e.g., [53]), we obtain:
Δh [m] = Δg/0.2667 = 3.75 Δg [mGal],
where we take the densities of dry sand ρ = 1.4–1.7 g/cm3 and of the typical non-volcanic rock density ρ = 2.6–2.7 (g/cm3). We seek to identify the known prehistoric settlements (squares in Figure 18e,f) at a paleoshore. We read the difference Δg between these dots and the largest negative anomaly in the assumed bowl in TK. We obtain Δg = 30–50 mGal, which corresponds to Δh ≈ 110–190 m. This would be the maximum possible depth (the basin fully filled by water). In reality, we may expect depths in the order of tens of meters. Then, we add 20 m for the height above sea level of the deepest parts of the bowl and speculative 20 m for the sand layers.
For an easy orientation in the problem to reconstruct the paleolake, we used Δg from Figure 17b and added the contour lines for 150, 200 and 250 m asl from the topography in Figure 17a. The result is presented in Figure 18a–c. The contour lines separately without the topography are shown in Figure 18d for 200, 170, 150 and 120 m asl. Large expanses at 250 and 200 m are replaced by the break-up of one large lake (its shallower southern part) into a few smaller lakes at 170 and 150 m asl and, finally, at 120 m, only the northern deeper zone remains with water.
Figure 18e,f show the position and extent of the hypothetical paleolake based on the assumptions and estimates. The paleolake would include five of the endorheic Toshka lakes from the late 1990s at φ = 23–23.5° formed due to anthropogenic diversion of the water from Lake Nasser via the Sadat Canal (Figure 18e and Figure 19; Google Earth permits an independent check of the time series satellite images showing the progressive shrinking of the lakes) and the large depression of the Kharga Oasis. The paleolake would be huge. Its northern part (within Kharga) would be the deepest. The southern, shallower part would be more prone to water level variations and desiccation.
The available archaeological data from the Toshka-Kiseiba depression allow us to test the hypothesis of the existence of a large lake in the southern part of the Western Desert of Egypt and to attempt to constrain its extent and position. Figure 18e shows all 12 sites from Table 1 plotted onto the map, with the ETOPO 1 topography showing the position and extent of the hypothetical lake at 200 m asl and the contour lines for 170, 150 and 120 m asl. Of the sites, two Holocene locations (nos. 2, 7) are situated away from the 200-meter contour and the shore of the hypothetical lake. Three sites (nos. 3, 4, 10), including the only Pleistocene (Lower Paleolithic, no. 3) location, are positioned near the 200-meter contour (at 200, ˂180 and 190 m asl, respectively). The remaining seven sites, all of Holocene dating, are located between the 200- and 170-meter contours, with three areas (nos. 5, 6, 9) positioned close to and two (nos. 8, 12) even below the 170-meter contour. This distribution rules out a Holocene age for a large lake at 200 m asl, as most of the settlements would end up submerged by its waters. For this period, one may allow only for the existence of a smaller lake—or, rather, a system of lakes—in the southern section of the area of interest, with the water levels reaching generally between ~170 and ~180 m asl.
Despite the clear correlation of many (if not all) Holocene occupation areas with the proposed height of the water level of the hypothetical lake(s) at ~170 and ~180 m asl, diverse evidence suggests variation in the lake levels on diverse scales during the Holocene. First, there are clear long-term changes in the availability of water between the Early and Middle Holocene (see Table 1). In the former period (before 8200 BP), there is an increase in the number of occupied sites from seven in the earlier phase (~9500–8200 bp) to ten during the local climatic optimum (~8050–7300 bp). This increase is accompanied by a shift from seasonal occupation by mobile foragers in the earlier phase to reduced mobility and stabilization of the settlement system (large settlements, wells) and intensified use of local resources (plant foods, storage) by intensive collectors in the later phase. In addition to the explored localities, the later phase of the Early Neolithic is attested at numerous unexplored basins and represents the most common Holocene occupation in the depression [29]. In the Middle Holocene (after 8200 BP), settlements are rare during the Middle Neolithic (~7100–6600 bp) and include only two more substantial and other smaller occupations left behind by highly mobile mixed pastoralists in three basins (nos. 7, 11, 12), but the evidence is difficult to evaluate due to severe aeolian erosion after this humid phase. Subsequently, there is a clear reduction in settlement between the Late (~6500–5800 bp) and Final (~5700–4500 bp) Neolithic between Kiseiba and Toshka from west to east, towards the Nile, with only three basins of five reoccupied during the latter phase. The characteristic of the remains (mostly short-lived camps) in these three basins (nos. 2, 11, 12) suggests a rather mobile lifestyle, with the locations serving as fixed points in otherwise mobile landscapes and as places of ceremonies (Nabta Playa) and burials (Ramlah Playa) for otherwise dispersed communities [29,55]. All three are located at different elevations (see Table 1), and it is possible that the presence of a conspicuous mountain (gebel in Arabic) in each of these areas (Bargat El-Shab, Gebel Nabta, Gebel Ramlah, respectively) might have been decisive for the selection of these areas for occupation in addition to the presence of subsurface water. For the first time during the Final Neolithic, small artefact concentrations attest to ephemeral occupation also in the vicinity of the modern wells (bir in Arabic) at Bir Tarfawi and Bir Sahara and near Bir Safsaf situated further to the west (see Figure 19 for the locations of these wells).
Second, there was a medium-term variation in the levels of the lake(s), with expansion of the lake(s) during the humid interphases (each lasting between ~350 and 1200 years) and their contraction (or even desiccation) during the arid phases of 100 to 150 years that punctuate the regional chronostratigraphic sequence [29]. Furthermore, the presence of remains of occupation from the same phase both near the edges of the playas and close to the centers of the playas and on the playa silts, where they could be placed only after (partial) contraction of the lake(s), suggests short-term fluctuations within individual humid phases, related both to differences between wet and dry parts of each year as well as inter-annual variation in the amount of rainfall [27,29].
Although the Early and Middle Holocene was a period of a substantial climatic amelioration (as compared with the late Upper Pleistocene and most of the Late Holocene), it was still comparatively dry, with annual precipitation equating to 100–200 mm even during the climatic optimum [29]. Rains constituted the main source of water for the playa lakes which occupied the low-lying deflational basins that dot the surface of the Kiseiba-Toshka depression and which drained comparatively large areas in some cases (e.g., Nabta Playa, ca. 1500 km2). In this connection, the absence of Early and Middle Holocene sediments and any substantial occupations at Bir Sahara and Bir Tarfawi, two deflational basins with evidence of robust occupation during the Lower and Middle Paleolithic [27], could be of interest. Nevertheless, despite the comparative closeness of the Toshka-Kiseiba depression to the Nile, no direct evidence for high Nile floods contributing water to the local Holocene lake(s) has been brought to light so far—the remains of fish and Nile bivalves are extremely rare in this area and most likely constitute imports rather than evidence for overflow of the Nile [27,29].
Interestingly, the influx of water from the Nile through the Toshka spillway was recently suggested as one of the sources of water for a large Holocene lake reconstructed in the northern part of our research area—in the Kharga Oasis. Based on the presence of lake sediments in the northernmost part of the oasis and the elevations of Early and Middle Holocene sites, lake levels at 170 m asl have been proposed for this Holocene lake [56], similar to the level seen in our results in the southern part of the area of interest. A large lake in this oasis was hypothesized already by [57], but there has been disagreement as to the age of such a lake—it was considered as rather a Pleistocene than Holocene feature by [58]. An earlier and still larger lake, extending further south, is allowed for (but not tested) in this area by Bunbury et al. [56] as well.
The existence of an earlier and larger lake in the southern part of the Egyptian Western Desert is difficult to assess using the evidence from the Toshka-Kiseiba depression alone. The depression in its current shape is the result of repeated erosion, deflation and deposition in the past, particularly during the hyper-arid phase between ~70,000 BP and ~11,500 BP that removed most of the earlier sediments and had also scooped out the deflational basins in the depression that were refilled as seasonal lakes during the Holocene [26]. The Pleistocene evidence is thus only rarely found in situ. It occurs more frequently as eolised Acheulean (Lower Paleolithic, ~500,000–300,000 BP) or Mousterian and Aterian (Middle Paleolithic, ~175,000–70,000 BP) lithic pieces, scattered on deflational surfaces, dropped there from much higher elevations [27,28], or as pieces reused in much later Holocene contexts [29,59]. An exception is the only Lower Paleolithic cluster of sites in our corpus (no. 3 in Table 1) situated on a 5-km-wide plateau that constitutes the remnants of an Acheulian surface preserved ca. 20 m above the surrounding Holocene terrain [28]. Its correlation with the 200-meter contour (Figure 18e) is of interest but insufficient alone to support the existence of a large lake in this area.
Further evidence in this respect was presented by Haynes [60] and Maxwell et al. [52], who proposed a lake at ~190 m asl that would have filled both the northern and southern parts of our area of interest. Another, even larger lake was hypothesized by [52] at ~247 m asl based on the evidence of Middle Paleolithic occupations at Selima to the south and Bir Tarfawi and Bir Sahara to the west of our research area. In the latter two basins, a sequence of five lakes dated between ~175,000 and 70,000 BP was established. Some of them were comparatively deep and, in combination with precipitation of ca. 500 mm per year, capable of supporting large animals and fish that were found in substantial amounts in the vicinity of these lake sites, including species found today only in the Nile, Chad or Niger basins [27,36]. For these two hypothesized Pleistocene lakes, unlike for the Holocene one(s) reconstructed in the southern part of our research area, overflow of the Nile through Wadi Toshka is seen as a likely source of water [52]; cf. Figure 18c,d.
The reconstruction of paleolakes has important implications as one may expect groundwater, perhaps shallow, to be found at many places in the past lake location(s). This is exactly the case with our study area in the southern part of the Western Desert, with subsurface water reachable at some places in the area overlapping with the hypothetical lake(s), just a few meters below the present-day surface (Figure 19).
In recent years, this groundwater began to be exploited for agricultural reclamation projects, clearly visible on Google Earth, with circular fields watered by sprinklers using water pumped from the aquifer (e.g., El Oweinat project; see Figure 16a) or densely packed watermelon cultivation fields relying more on the near-surface water sources (at or near nos. 2, 5, 6, 13 in Figure 19), e.g., [30].
The strike angles at the southern end of the TK lowland are combed, as expected—see Figure 20—but it is not so intensive as for other places discussed elsewhere in this paper (probably the energy of the stresses on the local material was not so intensive).
Finally, we plot the profiles of Δg together with the surface topography along the deepest places of the sought-for paleolake(s), starting from north (at Kharga) to south (Figure 21b). The reader can compare this with such a profile for the GSS in Figure 21a, taken from [4]. While the GSS shows a large difference between the two profiles (gravity and topography), indicating where the paleolake(s) might be, TK is simply a lowland and a hole potentially and sometimes filled by water.
Our analyses allow new insights into the possible presence of paleolakes. We were able to pinpoint locations that correspond well with the archaeological data. Despite the multiple projections that we made in this work, the research is ongoing and one can see in our data that there may be more hidden paleolakes that we did not identify. This remains to be part of our future analyses.

5. Conclusions

Our application of the gravity aspects revealed that one aspect, the so-called strike angles, is significantly combed in the localities with known target deposits (TD) in Egypt. This discovery allows novel prediction of the localities where there may still be more TD present for further exploitation.
Additionally, strike angles provide the potential for not only discoveries of oil and gas but also of the groundwater volumes.
The spatial distribution of the combed strike angles is near the surface. The connection of the gravity disturbance to the stress fields preserved in these geological volumes presents itself a new inexpensive and accessible empirical geophysical tool for the recognition of future resources that include oil, gas and groundwater.
Our analysis represents the first approximation for the detection of important resources in less accessible regions that may warrant more detailed investigations.
Groundwater resources were detected for the first time in the form of hypothetical paleolakes in the Great Sand Sea (GSS), North-Western Egypt, and between Kharga and Toshka (TK), Southern Egypt. The boundaries of the detected paleolakes were reconstructed and discussed. It is evident that the water level continued to fluctuate over the course of time.
Archaeological sites provided a practical constraint (external limiting factor) for the lakes’ positions and extents. Specifically: (i) Our detection in the GSS [4] (Section 4.2) allows us to link additional archaeological sites near the groundwater extent expected within the GSS. (ii) Our work focused on TK (Section 4.3) is independent of [56] and others but, however, provides similar results. Here, we estimate lake(s) position(s) and extent including their temporal changes.

Author Contributions

J.K. (Jaroslav Klokočník): Conceptualization, Methodology, Investigation, Formal analysis, Writing—Original draft preparation, Writing—Reviewing and Editing; J.K. (Jan Kostelecký): Conceptualization, Methodology, Software, Data Curation, Visualization, Formal analysis, Validation; L.V.: Data Curation, Formal analysis, Investigation, Validation, Writing—Original draft preparation, Writing—Reviewing and Editing; G.K.: Methodology, Formal analysis, Investigation, Writing—Original draft preparation, Validation, Writing—Reviewing and Editing; A.B.: Methodology, Software, Data Curation, Investigation, Writing—Reviewing and Editing, Validation, Supervision. All authors have read and agreed to the published version of the manuscript.

Funding

This work has been prepared in the framework of the project RVO #679 858 15 (Czech Acad. of Sciences, Czech Republic, CR) and partly supported by the project LO1506 (PUNTIS) from the Ministry of Education of the CR. G.K.’s support came from the Czech Science Foundation projects 20-08294 S, Ministry of Education LTAUSA 19141. L.V.’s contribution was supported by the Program of the Development of Fields of Study at Charles University, no. Q11: Complexity and Resilience: Ancient Egyptian Civilisation in Multidisciplinary and Multicultural Perspective, and by a non-investment subsidy no. MŠMT-40214/2019-12, VEG 2020/1.

Acknowledgments

We cordially thank Ivan Pešek for his work on the model in Section 2.5. The input data—the harmonic geopotential coefficients of the gravity field model EIGEN 6C4—are publicly available; data from our figures (in surfer program) and our figures with high resolution (.png files) can be provided by Jan Kostelecký on request. Václav Cílek provided useful geological consultations.

Conflicts of Interest

The authors declare no conflict of interest.

References

  1. Klokočník, J.; Kostelecký, J.; Cílek, V.; Bezděk, A. Subglacial and Underground Structures Detected from Recent Gravito-Topography Data; Cambridge SP: Cambridge, UK, 2020; ISBN 978-1-5275-4948-7. [Google Scholar]
  2. Klokočník, J.; Kostelecký, J. Gravity signal at Ghawar, Saudi Arabia, from the global gravitational field model EGM 2008 and similarities around. Arab. J. Geosci. 2015, 8, 3515–3522. [Google Scholar] [CrossRef]
  3. Klokočník, J.; Kostelecký, J.; Cílek, V.; Bezděk, A.; Pešek, I. A support for the existence of paleolakes and paleorivers buried under Saharan sand by means of “gravitational signal” from EIGEN 6C4. Arab. J. Geosci. 2017, 10, 199. [Google Scholar] [CrossRef]
  4. Klokočník, J.; Cílek, V.; Kostelecký, J.; Bezděk, A. Gravity aspects from recent Earth gravity model EIGEN 6C4 for geoscience and archaeology in Sahara, Egypt. J. Afr. Earth Sci. 2020, 168, 103867. [Google Scholar] [CrossRef]
  5. Klokočník, J.; Kostelecký, J.; Pavelka, K. Google Earth: Inspiration and Instrument for the Study of Ancient Civilizations. Geoinformatics 2011, 6, 193–210. [Google Scholar] [CrossRef]
  6. Pavelka, K.; Šedina, J.; Matoušková, E. High Resolution Drone Surveying of the Pista Geoglyph in Palpa, Peru. Geosciences 2018, 8, 479. [Google Scholar] [CrossRef] [Green Version]
  7. Pedersen, B.D.; Rasmussen, T.M. The gradient tensor of potential field anomalies: Some implications on data collection and data processing of maps. Geophysics 1990, 55, 1558–1566. [Google Scholar] [CrossRef]
  8. Murphy, C.A.; Dickinson, J.L. Exploring exploration play models with FTG gravity data. In Proceedings of the 11th SAGA Biennial Technical Meeting and Exhibition, Swaziland, South Africa, 16–18 September 2009; pp. 89–91. [Google Scholar]
  9. Mataragio, J.; Kieley, J. Application of full tensor gradient invariants in detection of intrusion-hosted sulphide mineralization: Implications for deposition mechanisms. Min. Geosci. EAGE First Break 2009, 27, 95–98. [Google Scholar]
  10. Saad, A.H. Understanding gravity gradients-a tutorial, the meter reader. Ed. B. Van Nieuwenhuise, August issue. Lead. Edge 2006, 25, 941–949. [Google Scholar] [CrossRef]
  11. Klokočník, J.; Kostelecký, J.; Bezděk, A.; Kletetschka, G. Gravity strike angles: A modern approach and tool to estimate the direction of impactors of meteoritic craters. Planet. Space Sci. 2020, 194, 105113. [Google Scholar] [CrossRef]
  12. Klokočník, J.; Kostelecký, J.; Bezděk, A. The putative Saginaw impact structure, Michigan, Lake Huron, in the light of gravity aspects derived from recent EIGEN 6C4 gravity field model. J. Gt. Lakes Res. 2019, 45, 12–20. [Google Scholar] [CrossRef]
  13. FitzGerald, D.J.; Holstein, H. Structural foliations from gravity gradient data for a 2D fault. Practical demonstration of deriving structural foliations from Gravity gradient data for 2D faults. In Proceedings of the Gravity Gradiometry in Exploration Workflow, SEG Annual Meeting Post-Convention Gravity and Magnetics Workshop, Denver, CO, USA, 26–31 October 2014. [Google Scholar]
  14. Donofrio, R.R. North American impact structures hold giant field potential. Oil Gas J. 1998, 96, 69–83. [Google Scholar]
  15. Reimold, W.U.; Koeberl, C.; Gibson, R.L.; Dressler, B.O. Economic mineral deposits in impact structures: A review. In Impact Tectonics; Springer: Berlin/Heidelberg, Germany, 2005; pp. 479–552. [Google Scholar]
  16. Christoph, F.; Jean-Michel, L.; Franz, B.; Balmino, G.; Franz, B. The latest combined global gravity field model including GOCE data up to degree and order 2190 of GFZ Potsdam and GRGS Toulouse (EIGEN 6C4). In Proceedings of the 5th GOCE User Workshop, Paris, France, 25–28 November 2014. [Google Scholar]
  17. Zingerle, P.; Pail, R.; Gruber, T.; Oikonomidou, X. The experimental gravity field model XGM2019e. ICGEM Potsdam. GFZ Data Serv. 2019. [Google Scholar] [CrossRef]
  18. Maus, S.; Barckhausen, U.; Berkenbosch, H.; Bournas, N.; Brozena, J.; Childers, V.; Dostaler, F.; Fairhead, J.D.; Finn, C.; von Frese, R.R.B.; et al. EMAG2: A 2-arcmin resolution Earth magnetic anomaly grid compiled from satellite, airborne, and marine magnetic measurements. Geochem. Geophys. Geosyst. 2009, 10, Q08005. [Google Scholar] [CrossRef]
  19. Amante, C.; Eakins, B.W. ETOPO1, 1 Arc-Minute Global Relief Model: Procedures, Data Sources and Analysis; NOAA Technical Memorandum NESDIS NGDC-24 (National Geophysical Data Center): Boulder, CO, USA, 2009. [Google Scholar] [CrossRef]
  20. Ratner, M. Natural Gas Discoveries in the Eartern Mediterranean; Congressional Research Service: Washington, DC, USA, 2016; Volume 7-5700, p. R44591. [Google Scholar]
  21. USGS 2010. World Petroleum Resources Project. Assessment of Undiscovered Oil and Gas Resources of the Nile Delta Basin Province, Eastern Mediterranean; Fact Sheets 2010-3027; USGS and Ministry of Defense USA: New Orleans, LA, USA.
  22. Stephen, C. Egypt’s gas gold rush. Petroleum Economist 2019, 28. [Google Scholar]
  23. Burroughs, W.J. Climate Change in Prehistory; Cambridge UP: Cambridge, UK, 2005; ISBN 10 0-521-82409-5. [Google Scholar]
  24. Kuper, R.; Kröpelin, S. Climate-controlled Holocene occupation in the Sahara: Motor of Africa’s evolution. Science 2006, 313, 803–807. [Google Scholar] [CrossRef] [PubMed] [Green Version]
  25. Drake, N.A.; Blench, R.M.; Armitage, S.J.; Bristow, C.S.; White, K.H. Ancient watercourses and biogeography of the Sahara explain the peopling of the desert. Proc. Natl. Acad. Sci. USA 2011, 108, 458–462. [Google Scholar] [CrossRef] [PubMed] [Green Version]
  26. Haynes, C.V. Geological Evidence of Pluvial Climates in the Nabta Area of the Western Desert, Egypt. In Prehistory of the Eastern Sahara; Wendorf, F., Schild, F., Eds.; Academic Press: New York, NY, USA, 1980; pp. 353–371. [Google Scholar]
  27. Wendorf, F.; Schild, R. Prehistory of the Eastern Sahara; Academic Press: New York, NY, USA, 1980; 414p. [Google Scholar]
  28. Haynes, C.V., Jr.; Maxwell, T.D.; Johnson, D.L.; Kilani, A. Research Note: Acheulian Sites near Bir Kiseiba in the Darb el Arba’in Desert, Egypt: New Data. Geoarchaeol. Int. J. 2001, 16, 143–150. [Google Scholar] [CrossRef]
  29. Wendorf, F.; Schild, R. Holocene Settlement of the Egyptian Sahara, Vol. 1, The Archaeology of Nabta Playa; Kluwer Academic/Plenum Publishers: New York, NY, USA; Boston, MA, USA; Dordrecht, The Netherlands; London, UK; Moscow, Russia, 2001; 707p. [Google Scholar]
  30. Vivian, C. The Western Desert of Egypt: An Explorer’s Handbook; American University in Cairo Press: Cairo, Egypt; New York, NY, USA, 2008; 459p. [Google Scholar]
  31. Dachy, T.; Briois, F.; Marchand, S.; Minotti, M.; Lesur, J.; Wuttmann, M. Living in an Egyptian Oasis: Reconstruction of the Holocene Archaeological Sequence in Kharga. Afr. Archaeol. Rev. 2018, 35, 531–566. [Google Scholar] [CrossRef]
  32. Caton-Thompson, G. Kharga Oasis in Prehistory; Athlone Press: London, UK, 1952; 213p. [Google Scholar]
  33. Mandel, R.D.; Simmons, A.H. Prehistoric occupation of Late Quaternary landscapes near Kharga Oasis, Western Desert of Egypt. Geoarchaeol. Int. J. 2001, 16, 95–117. [Google Scholar] [CrossRef]
  34. Smith, J.R.; Hawkins, A.L.; Asmerom, Y.; Polyak, V.; Giegengack, R. New age constraints on the Middle Stone Age occupations of Kharga Oasis, Western Desert, Egypt. J. Hum. Evol. 2007, 52, 690–701. [Google Scholar] [CrossRef]
  35. Kleindienst, M.R.; Smith, J.R.; Adelsberger, K.A. The Kharga Oasis Prehistory Project (KOPP), 2008 Field Season: Part I. Geoarchaeology and Pleistocene Prehistory. Nyame Akuma 2009, 71, 18–30. [Google Scholar]
  36. Wendorf, F.; Schild, R.; Close, A.E. Egypt during the Last Interglacial: The Middle Paleolithic of Bir Tarfawi and Bir Sahara East; Springer: New York, NY, USA, 1993; 596p. [Google Scholar]
  37. Bobrowski, P.; Lityńska-Zając, M.; Osypińska, M.; Jórdeczka, M. The Early Holocene Archaeological Evidence (Site E-05-1) in Bargat El-Shab (Western Desert Egypt). Archaeol. Pol. 2020, 58, 196–220. [Google Scholar] [CrossRef]
  38. Srienc, M.; Jórdeczka, M. Human Remains from Bargat El-Shab, Egypt, 2018. Available online: http://www.anthropology.uw.edu.pl/14/bne-14-07x.pdf (accessed on 14 September 2020).
  39. Czekaj-Zastawny, A.; Irish, J.D.; Kabaciński, J.; Mugaj, J. The Neolithic Settlements by a Paleo-lake of Gebel Ramlah, Western Desert of Egypt. In Desert and the Nile: Prehistory of the Nile Basin and the Sahara: Papers in Honour of Fred Wendorf; Kabaciński, J., Chłodnicki, M., Kobusiewicz, M., Winiarska-Kabacinska, M., Eds.; Poznań Archaeological Museum: Poznań, Poland, 2018; pp. 515–538. [Google Scholar]
  40. Klokočník, J.; Kostelecký, J.; Bezděk, A. Gravito-topographic signal of the Lake Vostok area, Antarctica, with the most recent data. Polar Sci. 2018, 17, 59–74. [Google Scholar] [CrossRef]
  41. Bakr, M.M.Y.; Wilkes, H. The influence of facies and depositional environment on the occurrence and distribution of carbazoles and benzocarbazoles in crude oils: A case study from the Gulf of Suez, Egypt. Org. Geochem. 2002, 33, 561–580. [Google Scholar] [CrossRef]
  42. Makaske, B. Anastomosing rivers: A review of their classification, origin and sedimentary products. Earth-Sci. Rev. 2001, 53, 149–196. [Google Scholar] [CrossRef]
  43. Ibraheem, I.M.; Haggag, M.; Tezkan, B. Edge Detectors as Structural Imaging Tools Using Aeromagnetic Data: A Case Study of Sohag Area, Egypt. Geosciences 2019, 9, 211. [Google Scholar] [CrossRef] [Green Version]
  44. Garfunkel, Z. Constrains on the origin and history of the Eastern Mediterranean basin. Tectonophysics 1998, 298, 5–35. [Google Scholar] [CrossRef]
  45. Kletetschka, G.; Wieczorek, M.A. Fundamental relations of mineral specific magnetic carriers for paleointensity determination. Phys. Earth Planet. Inter. 2017, 272, 44–49. [Google Scholar] [CrossRef]
  46. Klokočník, J.; Kostelecký, J.; Bezděk, A.; Cílek, V.; Kletetschka, G.; Staňková, H. Support for two subglacial impact craters in northwest Greenland from Earth gravity model EIGEN 6C4 and other data. Tectonophysics 2020, 780, 228396. [Google Scholar] [CrossRef]
  47. Klokočník, J.; Kostelecký, J.; Bezděk, A.; Kletetschka, G.; Staňková, H. A 200 km suspected impact crater Kotuykanskaya near Popigai, Siberia, in the light of new gravity aspects from EIGEN 6C4, and other data. Sci. Rep. (Nat.) 2020, 10, 6093. [Google Scholar] [CrossRef] [Green Version]
  48. El-Baz, F. Aeolian deposits and palaeo-rivers of the eastern Sahara. Significance to archaeology and groundwater exploration. Sahara 1998, 10, 55–66. [Google Scholar]
  49. Kletetschka, G.; Vondrák, D.; Hruba, J.; Prochazka, V.; Nabelek, L.; Svitavská-Svobodová, H.; Bobek, P.; Horicka, Z.; Kadlec, J.; Takac, M.; et al. Cosmic-Impact Event in Lake Sediments from Central Europe Postdates the Laacher See Eruption and Marks Onset of the Younger Dryas. J. Geol. 2018, 126, 561–575. [Google Scholar] [CrossRef]
  50. Prochazka, V.; Mizera, J.; Kletetschka, G.; Vondrak, D. Late Glacial sediments of the Stara Jimka paleolake and the first finding of Laacher See Tephra in the Czech Republic. Int. J. Earth Sci. 2019, 108, 357–378. [Google Scholar] [CrossRef]
  51. Kletetschka, G.; Hooke, R.L.; Ryan, A.; Fercana, G.; McKinney, E.; Schwebler, K.P. Sliding stones of Racetrack Playa, Death Valley, USA: The roles of rock thermal conductivity and fluctuating water levels. Geomorphology 2013, 195, 110–117. [Google Scholar] [CrossRef]
  52. Maxwell, T.A.; Issawi, B.; Haynes, C.V., Jr. Evidence for Pleistocene lakes in the Toshka region, south Egypt. Geology 2010, 38, 1135–1138. [Google Scholar] [CrossRef]
  53. Pick, M.; Pícha, J.; Vyskočil, V. Úvod ke Studiu Tíhového Pole Země (In Czech, Introduction to Study of the Gravity Field of the Earth); Academia Praha: Praha, Czech Republic, 1973. [Google Scholar]
  54. Getamap.net. Search for Anything… Anywhere. Available online: http://www.getamap.net/maps/egypt/ (accessed on 24 September 2020).
  55. Kobusiewicz, M.; Kabaciński, J.; Schild, R.; Wendorf, F.; Irish, J.D.; Gatto, M.C. Gebel Ramlah: Final Neolithic Cemeteries from the Western Desert of Egypt; Institute of Archaeology and Ethnology, Polish Academy of Sciences: Poznań, Poland, 2010; 276p, ISBN 978-83-89499-69-1. [Google Scholar]
  56. Bunbury, J.; Ikram, S.; Roughley, C. Holocene large lake development and desiccation: Changing habitats in the Kharga Basin of the Egyptian Sahara. Geoarchaeology 2018, 1–20. [Google Scholar] [CrossRef]
  57. Beadnell, H.J.L. An Egyptian Oasis: An Account of the Oasis of Kharga in the Libyan Desert, with Special Reference to Its History, Physical Geography and Water Supply; Murray: London, UK, 1909. [Google Scholar]
  58. Caton-Thomson, G.; Gardner, E.W. The prehistoric geography of Kharga Oasis. Geogr. J. 1932, 80, 369–406. [Google Scholar] [CrossRef]
  59. Gautier, A.; Schild, R.; Wendorf, F.; Stafford, T.W. One elephant doesn’t make a savanna. Palaeoecological significance of Loxodonta africana in the Holocene Sahara. Sahara 1994, 6, 7–20. [Google Scholar]
  60. Haynes, C.V., Jr. Geochronology of Wadi Tushka: Lost Tributary of the Nile. Science 1980, 210, 68–71. [Google Scholar] [CrossRef]
Figure 1. Tutorial: the strike angles θ [deg] combed (a) and chaotic (b); red color indicates their direction to the west and blue to the east of the local meridian, respectively.
Applsci 10 08950 g001
Figure 2. Tutorial: the strike angles are here also “combed”, but into a (semi)circular shape, creating a “halo” (on land) around the impact crater—in this case, Chicxulub, North Yucatan (partly on land, partly in shallow waters). The EIGEN 6C4 gravity field model was used. (a) An extensive area around the crater with highly combed values is affected by the impact event (generating post-impact changes concerning oil and gas deposits, groundwater, cenotes—the red dots in (b) depending on the size of the particular crater (in turn on size and energy of the impactor) and the local material [1]. It is not by chance that half of the impact craters known in North America possess economic minerals (e.g., [14,15]).
Applsci 10 08950 g002
Figure 3. Gas fields in Northern Egypt, mostly offshore, redrawn according to [20,22].
Applsci 10 08950 g003
Figure 4. The strike angles (for I < 0.3) overlapping a map composed from various sources about the gas fields in the Eastern Mediterranean. According to [21] and various internet sources. Redrawn composition/summary from several public domains.
Applsci 10 08950 g004
Figure 5. Where we are in Egypt: topography from ETOPO 1 together with the names of important places to introduce the area of our study: A Abu Minqar, ABS Abu Ballas Scarp-land, AM Abu Muhariq (Limestone) Plateau, B Bahariya, D Dakhla, Fr Farafra, Fm Faiyum, K Kharga, S Siwa, T Wadi Toshka. Red rectangle: the area of Kharga-Toshka (TK), evaluated in this study (Section 4.3). Black dots: areas with archaeological evidence falling within the maximum expansion of the Holocene occupation based on [24] (their figure 3c).
Applsci 10 08950 g005
Figure 6. Climate-controlled occupation in the Eastern Sahara during the main phases of the Holocene after [24] (their figure 3a–d). With the abrupt arrival of monsoon rains ~10,500 BP, the hyper-arid desert to the west of the Nile was replaced by savanna-like environments, while the Nile Valley was too moist for occupation. After ~7300 BP, desiccation of the Egyptian Sahara began again. Redrawn following the data from [24].
Applsci 10 08950 g006
Figure 7. The archaeological localities (black dots) over the map with the gravity disturbances Δg (mGal) from EIGEN 6C4: the positions of archaeological sites of the Holocene occupations between ~10,500 and ~7300 BP in the Eastern Sahara, Western Desert of Egypt, were utilized (after [24]).
Applsci 10 08950 g007
Figure 8. The surface topography in our area of interest (from ETOPO 1 model in (m)). The large black dot is for Zohar.
Applsci 10 08950 g008
Figure 9. Tzz [E]. The gravity model EIGEN 6C4 used everywhere in this study.
Applsci 10 08950 g009
Figure 10. The virtual deformations (vd) [–] are shown in blue, where compression takes place, and in red where dilatation occurs.
Applsci 10 08950 g010
Figure 11. The strike angles θ [deg] for I < 0.3.
Applsci 10 08950 g011
Figure 12. Highly combed areas of θ (I < 0.3) in context: a part of Egypt, Israel, Jordan, a part of Saudi Arabia, Lebanon, Cyprus, a part of Turkey, a part of Saudi Arabia, and the Eastern Mediterranean.
Applsci 10 08950 g012
Figure 13. The strike angles θ [deg] for I < 0.9.
Applsci 10 08950 g013
Figure 14. Magnetic anomalies [nT] according to the model EMAG 2.
Applsci 10 08950 g014
Figure 15. (a,b) The combed θ [deg] for (a) I < 0.3 and (b) I < 0.9 for gas (red dots) and oil (green dots) known and already used localities in the Nile delta and the Mediterranean Sea as far north as Zohar. (c,d) The combed θ [deg], I < 0.9, known and already used deposits (triangles show localities in preparation) for Western/Northern Egypt near Siwa (c) and for Suez/Sinai (d).
Applsci 10 08950 g015
Figure 16. (a) The strike angles in Egypt (I < 0.3, with EIGEN 6C4) and important present-day sites (blue rectangles). Wadi Toshka is shown by the red arrow. Black dots: archaeological sites based on [24] (their figure 3c), supplemented in this study by more detailed data for Kiseiba-Toshka in Southern Egypt (red rectangle; see Section 4.3 for the results). (b) Δg (mGal) for Egypt with EIGEN 6C4 with archaeological sites (black dots) and hypothetical paleolakes in the Egyptian Western Desert from [4]. The locations of the sites are based on [24] (their figure 3a–d). Here, we correlate their figure 3c (for the epoch ~9000–7300 BP), showing the maximum expansion of the Holocene occupation west of the Nile. (c) θ [deg], I < 0.9, for Egypt with EIGEN 6C4, together with archaeological sites and hypothetical paleolakes in Western and Southern Egypt.
Applsci 10 08950 g016aApplsci 10 08950 g016b
Figure 17. (ad) ETOPO 1 topography (m) of the area mainly between Kharga (town) and Toshka (depression) (a), Δg [mGal] (b), Tzz [E] (c), and vd [–] (d). The two lowermost red points on (b) indicate the location of Kiseiba and Nabta discussed in this study. A Middle Pleistocene (approx. 0.5 Ma) overflow of the Nile to the west through Wadi Toshka was proposed to account for the findings of lake remnants, fossil fish and paleochannel terminations at ~250 m asl to the south (Selima) and west (Bir Tarfawi, Bir Sahara) of our research area [52]. Note that, now, we do not include water input from the Nile increased by the dam (Lake Nasser) via Toshka for the hypothetical (and recent) paleolake (and lakes). The Toshka endorheic lakes at φ = 23–23.5° (see Google Earth for partly independent check and for time series) with the height of around 150 m asl are new and artificial. Water started to flow here in the late 1990s through a concrete canal. Since 2006, the lakes have been shrinking rapidly. It is very probable that in the intervals of the “green Sahara”, the lowlands between Kharga and Toshka were filled, most likely repeatedly, with water.
Applsci 10 08950 g017
Figure 18. (ad) The ETOPO 1 with selected contour lines for the heights 150, 200 and 250 m asl (ac). We recall that the estimated external accuracy in the heights in the ETOPO 1 model is ±20 m. The last figure (d) shows only the selected contour lines at 200, 170, 150 and 120 m asl (red for 200 m, pink for 120 m). (e,f) The position and extent of the huge hypothetical paleolake(s) between Kharga and Toshka, Southern Egypt (TK), versus ETOPO 1 topography and Δg (EIGEN 6C4). The squares show archaeological sites from Table 1. The blue dots on (e) are for the main modern Toshka lakes (or their present remnants).
Applsci 10 08950 g018aApplsci 10 08950 g018b
Figure 19. The positions of modern excavated wells (black dots) in the southern part of the Western Desert, indicating the location of known present-day groundwater. 1—Bir Abu Hussein, 2—Bir El-Shab, 3—Bir Ayed, 4—Bir Dibis, 5—Bir Kiseiba, 6—Bir Kurayim, 7—Bir Misaha, 8—Bir Murr, 9—Bir Nakhlai, 10—Bir Safsaf, 11—Bir Sahara, 12—Bir Tarfawi, 13—Bir Takhlis (locations plotted using the coordinates at [54]. The present-day Toshka lakes are shown as blue dots (the same as in Figure 18e).
Applsci 10 08950 g019
Figure 20. The strike angles θ [deg] locally, for the southern part of the probable Kharga-Toshka paleolake.
Applsci 10 08950 g020
Figure 21. (a,b) The profiles of ETOPO 1 topography (blue) and gravity disturbances Δg according to EIGEN 6C4 (red): (a) GSS from Gilf Kebir to Siwa and (b) from Kharga to Toshka.
Applsci 10 08950 g021
Table 1. Archaeological sites from the core area between Wadi Toshka and the Kiseiba Scarp with evidence of Holocene and Pleistocene occupation included in this study.
No.Site/Area *Active ** (BP)Latitude *** NLongitude
E
Height +
asl (m)
References
1El Adam Playa10,500–7300 a22°38′32″30°04′46″175[29]
2Bargat El-Shab Playa10,500–7300 b
7300–5500 c
22°24′14″30°37′49″215[37,38]
3Kiseiba (Pleistocene) °500,000–300,00022°40′40″29°59′10″200[28]
4Kiseiba (Holocene)10,500–7300 a22°44′49″30° 2′28″˂180[28,29]
5El Baalad Playa10,500–7300 b22°44′54″30°16′20″175[29]
6El Gebal El Beid Playa10,500–7300 a22°51′38″30°43′25″160[27,29]
7El Gebal El Feel Playa10,500–7300 d22°28′35″29°55′18″200[29]
8El Ghorab Playa10,500–7300 a
7300–5500 e
22°48′38″30°13′09″140[28,29]
9El Kortein Playa10,500–7300 a22°41′19″30°46′15″175[27,29]
10Gebel Nabta Playa10,500–7300 b
7300–5500 e
22°30′49″30°39′27″190[27,29]
11Nabta Playa10,500–7300 f
7300–5500 c
22°31′56″30°44′58″175[27,29]
12Ramlah Playa10,500–7300 f
7300–5500 c
22°41′32″30°30′04″140[39]
* Usually, a playa (the flat-floored bottom of an undrained desert basin that becomes at times a shallow lake) with a cluster of archaeological localities along its edges or close to its center. ** Two main periods of the Holocene occupation of the Eastern Sahara according to [24] (their figure 3b–d) and the previous study by Klokočník et al. [4], with the earlier period overlapping with the Early (~9500–7300 bp) and Middle (~7100–6600 bp) Neolithic and the later with the Late (~6500–5800 bp) and Final (~5700–4500 bp) Neolithic of the regional archaeological sequence [29]. *** Geodetic coordinates from Google Earth in the international WGS 84, north latitude N, east longitude E, position of each playa preferred to that of the associated archaeological localities; presented up to arc-seconds, although this precision is not realistic. + rounded to 5 m, accounting for the real accuracy of the topographic models available (Section 2.4.2). italics indicate heights estimated using Google Earth. asl (m) above (present) sea level in meters. ° location on a small plateau ca. 20 m above surrounding terrain. a both earlier and later part of the Early Neolithic. b only later part of the Early Neolithic (the local climatic optimum). c both Late and Final Neolithic. d only Middle Neolithic. e only Late Neolithic. f both earlier and later part of the Early Neolithic and Middle Neolithic.
Table 2. The values of Δg and Tzz modeled for various sizes, shapes and depths of a hypothetical oil basin.
Size a × b × c (km)Depth (km)Δg (mGal)Tzz [E]
100 × 70 × 52−275−125
3−264−110
50 × 30 × 52−252−188
3−235−162
100 × 70 × 22−117−59
3−112−46
50 × 30 × 22−111−90
3−103−69
10 × 10 × 12−28−96
Publisher’s Note: MDPI stays neutral with regard to jurisdictional claims in published maps and institutional affiliations.

