Article

Modified Gingival Index (MGI) Classification Using Dental Selfies

1
Department of Community Dentistry, Faculty of Dental Medicine, Hadassah School of Dental Medicine, The Hebrew University, Jerusalem 9190501, Israel
2
Department of Software Engineering, Azrieli College of Engineering, Jerusalem 9103501, Israel
*
Author to whom correspondence should be addressed.
Contributed equally.
Appl. Sci. 2020, 10(24), 8923; https://doi.org/10.3390/app10248923
Submission received: 31 October 2020 / Revised: 3 December 2020 / Accepted: 11 December 2020 / Published: 14 December 2020
(This article belongs to the Special Issue Personalized Medical Devices)

Abstract

:

Featured Application

iGAM app is the first m-Health app for monitoring gingivitis to promote oral health using self-photography. The innovation the paper proposes is a method that—based on dental selfies alone—can inform both the user and the dental healthcare provider whether the patient is suffering from gingivitis.

Abstract

Background: Gum diseases are prevalent in a large proportion of the population worldwide. Unfortunately, most people do not follow a regular dental checkup schedule, and only seek treatment when experiencing acute pain. We aim to provide a system for classifying gum health status based on the MGI (Modified Gingival Index) score using dental selfies alone. Method: The input to our method is a manually cropped tooth image and the output is the MGI classification of gum health status. Our method consists of a cascade of two stages of robust, accurate, and highly optimized binary classifiers optimized per tooth position. Results: Dataset constructed from a pilot study of 44 participants taking dental selfies using our iGAM app. From each such dental selfie, eight single-tooth images were manually cropped, producing a total of 1520 images. The MGI score for each image was determined by a single examiner dentist. On a held-out test-set our method achieved an average AUC (Area Under the Curve) score of 95%. Conclusion: The paper presents a new method capable of accurately classifying gum health status based on the MGI score given a single dental selfie. Enabling personal monitoring of gum health—particularly useful when face-to-face consultations are not possible.

1. Introduction

1.1. Dental Scientific Background

The two most common oral diseases among adults are dental caries (tooth decay) and periodontal inflammations (gum diseases) [1]. Caries are caused by bacteria present in dental plaque, which ferment sugars, producing acid which demineralizes tooth enamel, then the bacteria enter the tissues under the enamel [2]. Periodontal diseases [3] are classified as either gingivitis or periodontitis based on severity. Gingivitis is the reversible stage, only the gums are affected, exhibiting symptoms of redness, swelling, and bleeding. With professional treatment, and maintaining a regimen of daily oral hygiene, recovery time from gingivitis is usually about 10–14 days [4]. Gingivitis which goes untreated usually escalates to periodontitis, the irreversible stage of gum disease. Acids, which are the immune system’s response to the presence of toxic bacteria, cause a deterioration and finally destruction of the tooth-support tissues and can lead to teeth loss [5]. There are several pathways of reversing inflammation. The two modes most studied in the literature are (1) mechanical plaque removal, and (2) chemical plaque removal. It has been demonstrated [6] that alcohol-free mouthwash along with regular toothbrushing is capable of reducing gingival inflammation. The significant difference between caries and periodontal disease is that caries often causes pain even in the early stages, while gum infections are often asymptomatic until a quite advanced stage [7]. What the two diseases have in common is their progression and escalation, producing a situation where delayed care can necessitate complex and expensive treatment or lead to loss of teeth [1].
Dentists have developed numerous indices to assess the severity of gingivitis [8,9], based on one or more of the following criteria: gum coloration (redness), gum contour, bleeding presence, stippling, and crevicular fluid flow [10,11]. Another method for distinguishing unhealthy oral tissue from healthy tissue is bioimpedance, unhealthy tissue has been found to offer lower resistance to electrical current than healthy ones [12]. Most of the indices developed require both visual and invasive measures (probing of the gums with instruments) to assess gum health status and reach a rating. Exceptional is the Modified Gingival Index (MGI) [8] which is completely noninvasive (i.e., exclusively visual). A survey study demonstrated that the variety of gingivitis indices in common use are all strongly correlated, including in particular MGI [9]. The MGI (Table 1) uses a rating score between 0 and 4, with 0 indicating a tooth with healthy gums and 4 the most severe inflammation with spontaneous bleeding, for a precise definition of each rating see Table 1.
Numerous epidemiological studies concluded that gingivitis [8] is prevalent in children, adolescents, and adults [11,13,14,15] and more than 80% of the world’s population suffers from mild to moderate forms of gingivitis from time to time [1]. Treating gingivitis is relatively simple, mostly at home, based on oral hygiene maintenance methods, including brushing twice daily, mouthwash, interproximal flossing, and dental toothpicks when appropriate [16,17,18]. In the clinic, gingivitis is usually treated in a single visit to a dental hygienist to remove plaque and calculus (tartar, or hardened plaque) [19]. If a proper oral hygiene regimen is not maintained, gingivitis is likely to prolong and progress to periodontitis.
Despite the fact that routine checkups are essential for monitoring and maintaining oral health, most people do not follow a recommended checkup schedule [20]. The problem is intensified even beyond irregular checkups when people are instructed to practice social distancing and avoid all unnecessary contact, such as during the current COVID-19 pandemic. This calls for a paradigm shift and new protocols and new software tools that will enable patients to have their oral health monitored by a dental healthcare provider in a more accessible, user-friendly way, not requiring a major effort on their part (such as visiting a clinic).
Recently, we presented iGAM [21] which is the first mHealth app for monitoring gingivitis using dental selfies. In a qualitative pilot study, we showed the potential acceptance of iGAM to facilitate information flow between dentists and patients, which may be especially useful when face-to-face consultations are not possible. By using iGAM the patient’s gum health is remotely monitored. The patient is instructed by the app how to use it to take and upload weekly gum photographs, and the dentist can monitor gum health (MGI score) without the need for face-to-face meeting. The data is stored and transferred between the dentist and patient by a data storage server (Figure 1).
The goal of this paper is to take the next step with the iGAM app and use the patient dental selfies toward automatically classifying the patients’ gum health status by predicting the MGI score.

1.2. Machine Learning Background

Automated machine learning has proven to be a very effective accelerator for repetitive tasks in machine learning pipelines [22], aiding data preprocessing, and streamlining and successfully resolving tasks like model selection, hyperparameter optimization, and feature selection and elimination [23]. AutoML packages are enabling considerable advances in machine learning by shifting the focus of the researcher to the feature engineering aspect of the ML pipeline, rather than spending a large amount of time trying to find the best algorithm or hyperparameters for a given dataset [24]. In particular, AutoML-H2O trains a variety of algorithms (e.g., GBMs, random forests, deep neural networks, GLMs), providing diversity of candidate models, which can then be stacked—producing more powerful final models. Despite the fact that it uses random search for hyperparameter optimization, AutoML-H2O frequently outperforms other AutoML packages [25,26]. All machine learning training processes and testing performed in this paper were done using the AutoML-H2O [27]. Our goal is to develop a suite of features to be evaluated, that we tailored especially to the unique characteristics of our cropped single tooth images. Dental selfies taken by users vary widely due to differences between cameras used (variations between vendors and quality), lighting conditions, image perspective, and more. We aim to make our features robust against such variations. An advantage we can exploit is that we know there is an underlying significant degree of homogeneity of the content being depicted—teeth and gums; our overall purpose is that our suite of features should be correlative to the visual characteristics dentists use to establish the MGI score—redness, swelling, irregularity, and more.
This paper will present a method to analyze the dental images, extract the most relevant image features from the dental selfies (that correspond to the MGI), and use machine learning algorithms to classify the state of gum health.
The innovations of our proposed method mainly include three aspects. (1) Accurate method which predicts the gum health status using noninvasive selfie image alone, (2) light method that can be implemented on mobile devices, and (3) just 35 scalar features, tailored to the unique characteristics of dental selfies and robust against wide variation between cameras used, lighting conditions, image perspective, and more.
2. Materials and Methods

2.1. Dataset

The data used in this research study was collected between September 2019 and May 2020 at the Department of Community Dentistry Faculty of Dental Medicine, The Hebrew University—Hadassah School of Dental Medicine. The protocol was approved by Hadassah research ethics committee (IRB, 0212-18-HMO), and written informed consent was obtained from all participants. There was no compensation for participating. The participants were using the application developed by us, the iGAM app which is currently available on the Google Play store (https://play.google.com/store/apps/details?id=com.igmpd.igam). The application development process was described in a recently published article [21]. Following initial registration, the patient logs in, personal patient data (such as age, gender, etc.) is collected. In order to characterize the patient’s interest in the app, the patient is prompted to fill out a questionnaire about dental knowledge and behaviors, including oral hygiene habits. Participants were instructed to photograph themselves once a week for 8 weeks. Nevertheless, not everyone completed the full experiment, as will be described shortly. In the app, the flash was set up to turn on automatically and to simultaneously initiate a 10-s timer, giving the participant time to position the camera. A sound indicated that the phone had started taking photographs, and another sound signaled the end of the photographing time. Seventy-five participants took part in this group study. The majority were male (74.7%), native to Israel (97.3%), Jewish (100%), “single” (50.7%), nonsmoker (74.7%), and did not take medications (85.3%), 41.3% indicated their occupation as “student” and 28% were “secular”.
Regarding the inclusion and exclusion criteria, the inclusion criteria are as follows: the subject must be 18 years or older, must understand Hebrew, and have a smartphone with the Android operating system. Exclusion criteria: as outlined [21] the app had several initial versions, and tested with different mouth openers. Once the app was stabilized, and the second generation “optimal” mouth opener was used [21], there were no other exclusion criteria, any subject who successfully used the app and uploaded a photo, their dental selfie was included in the dataset.
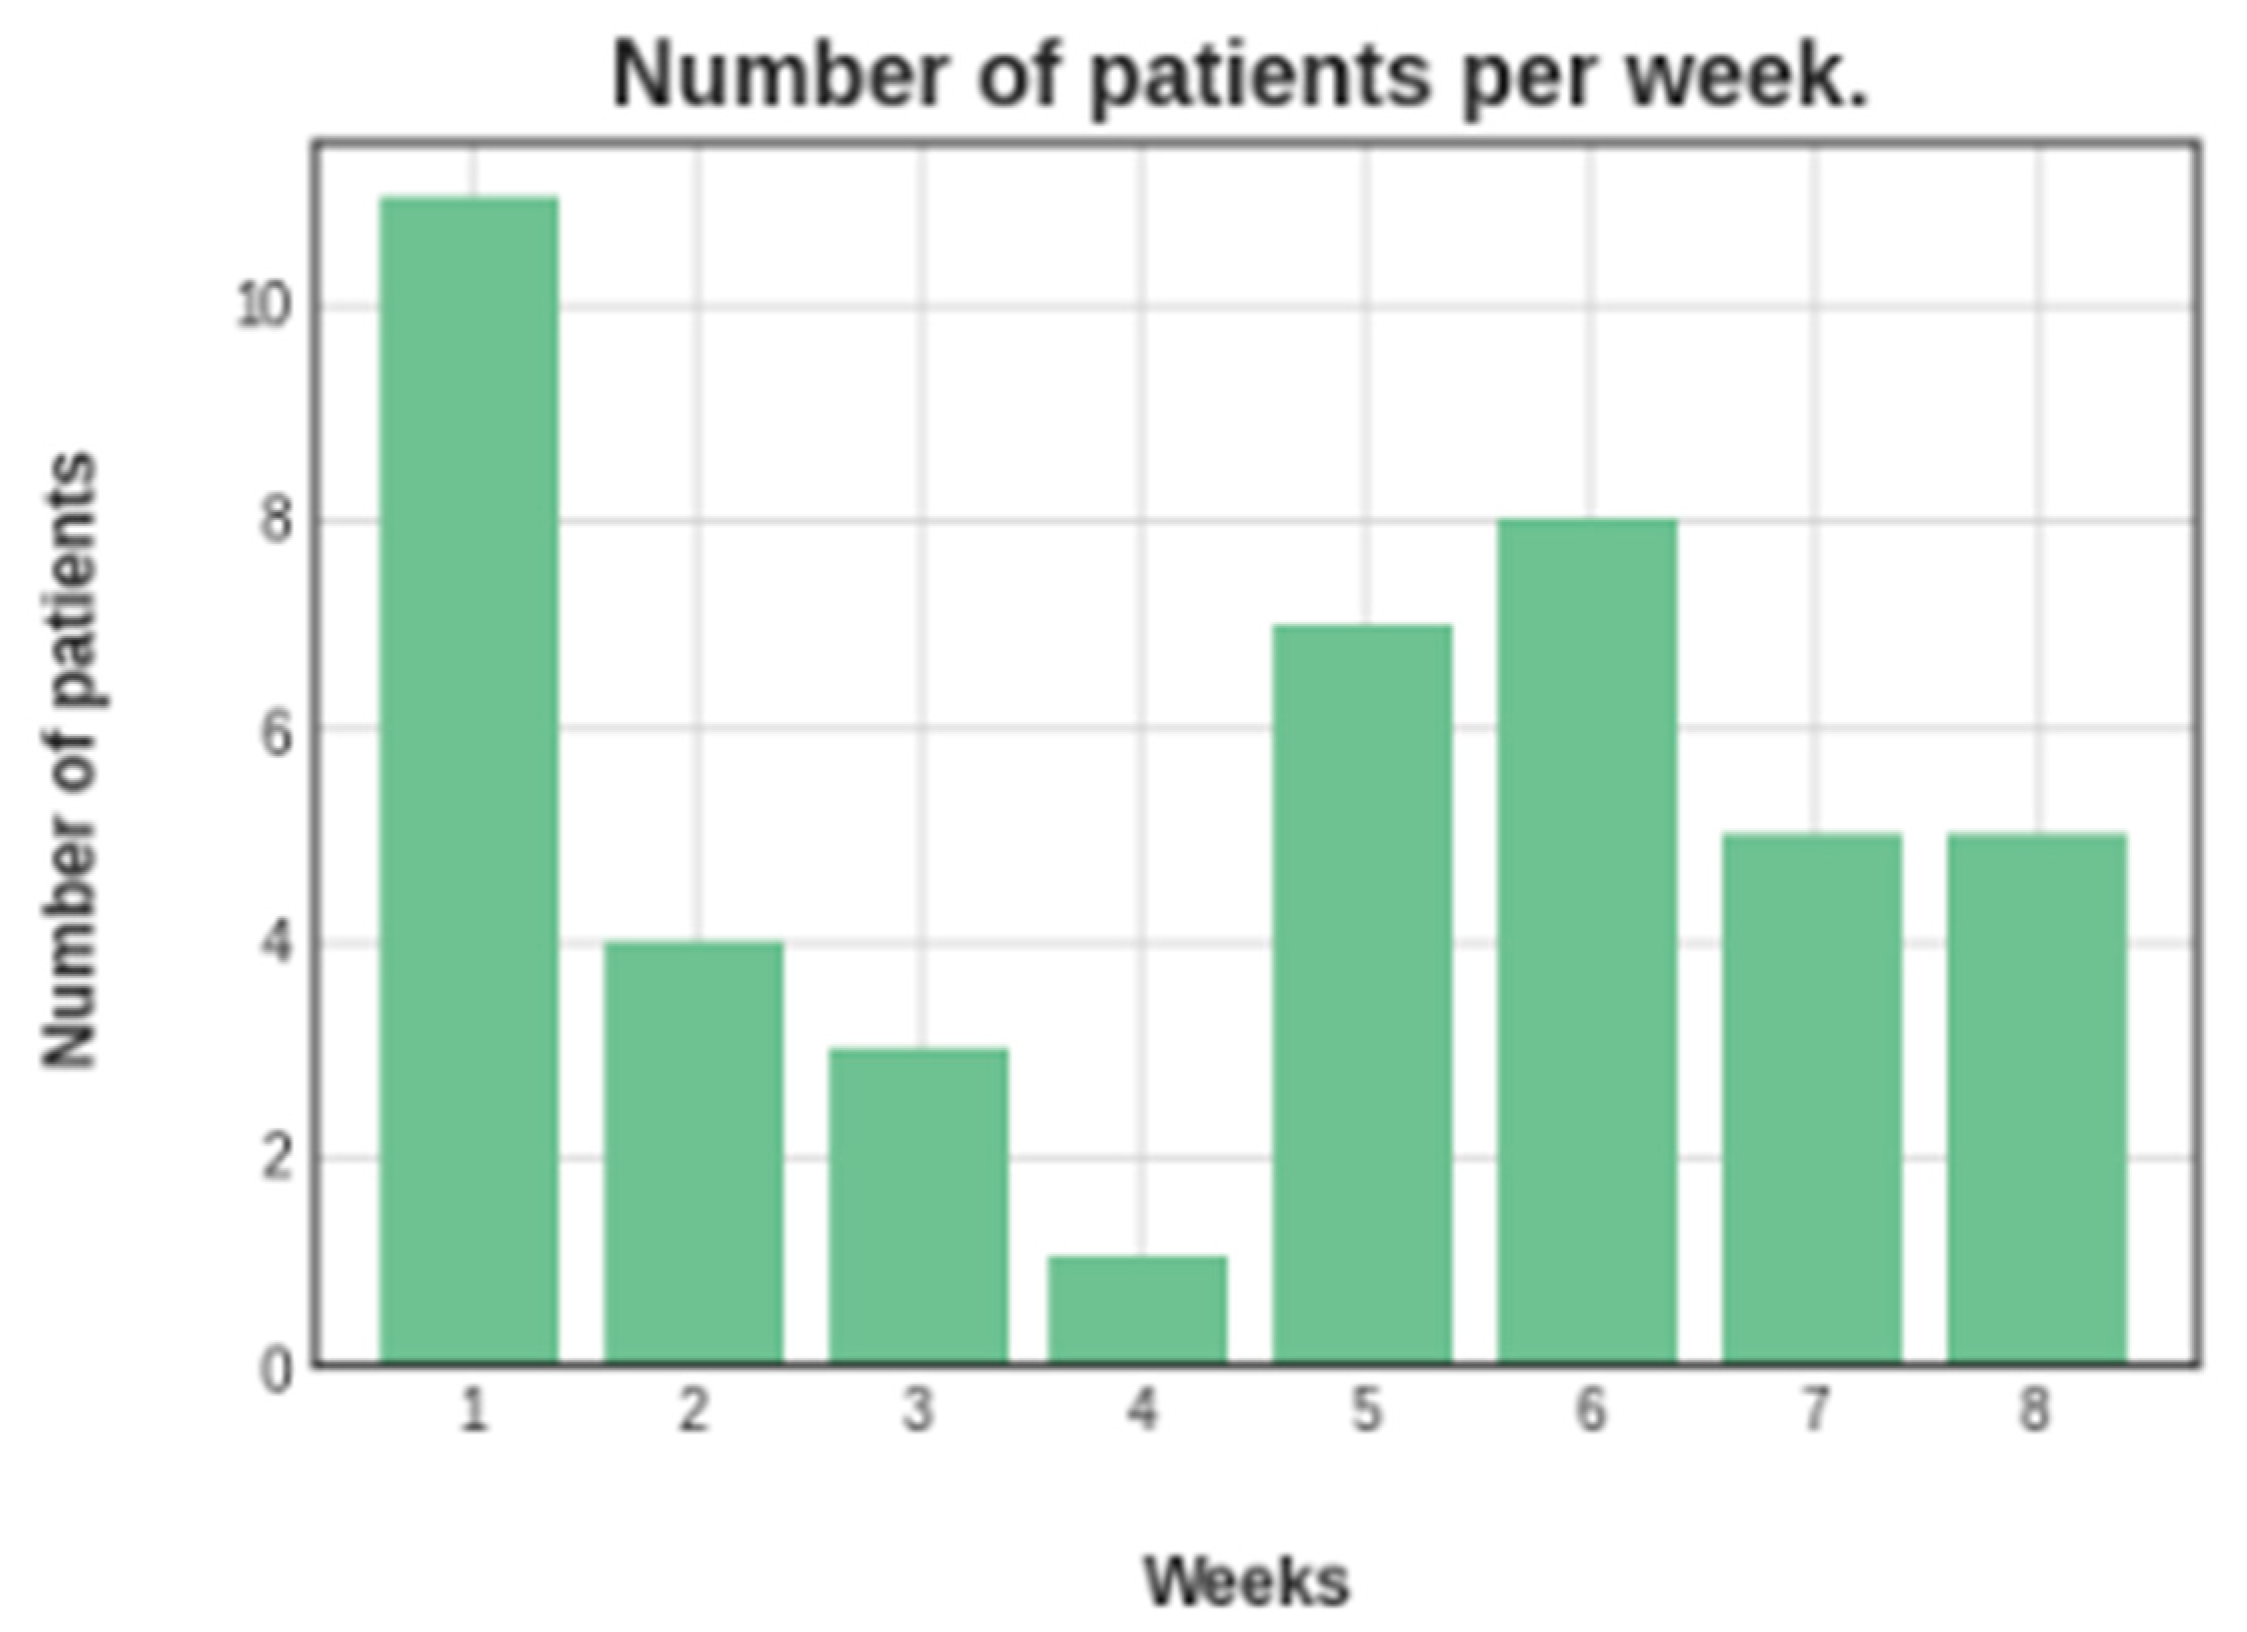
We ended up with 44 participants. In total we collected 190 dental selfies. The distribution of participants by length of participation is shown in Figure 2. A total of 11 participated for one week, four for two weeks, eight participated for six weeks, and five participants completed all eight weeks of the trial period.
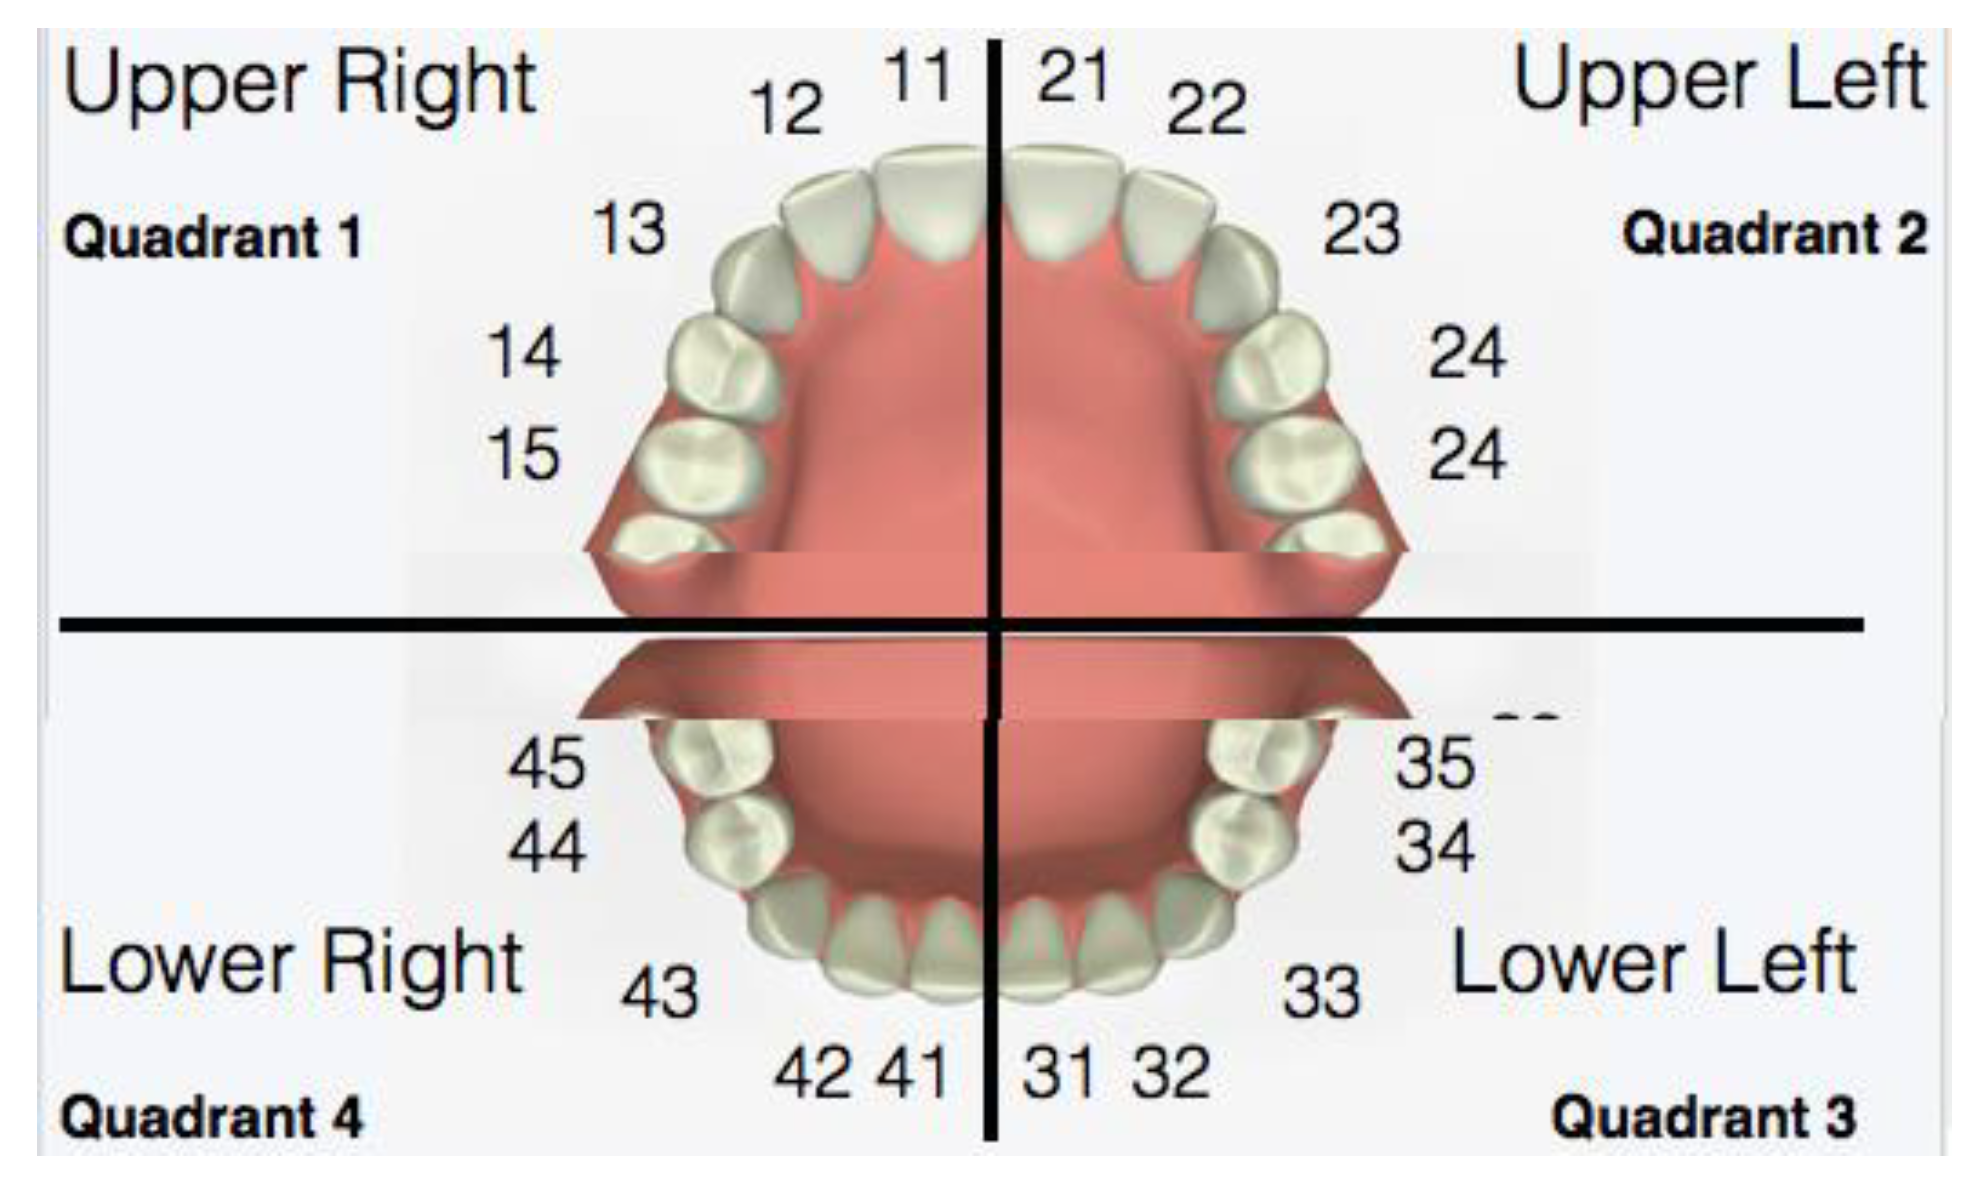
For each of the 190 dental selfies, a dentist marked bounding boxes (see Figure 3) around the eight front-most teeth (see Figure 4 for the notation)—the four central incisors (upper right: 11, upper left: 21, lower left: 31 and lower right: 41) and four lateral incisors (upper right: 12, upper left: 22, lower left: 32 and lower right: 42)—and each bound area was cropped as a separate image. Producing a total dataset of 1520 single tooth (and surrounding gum) images.
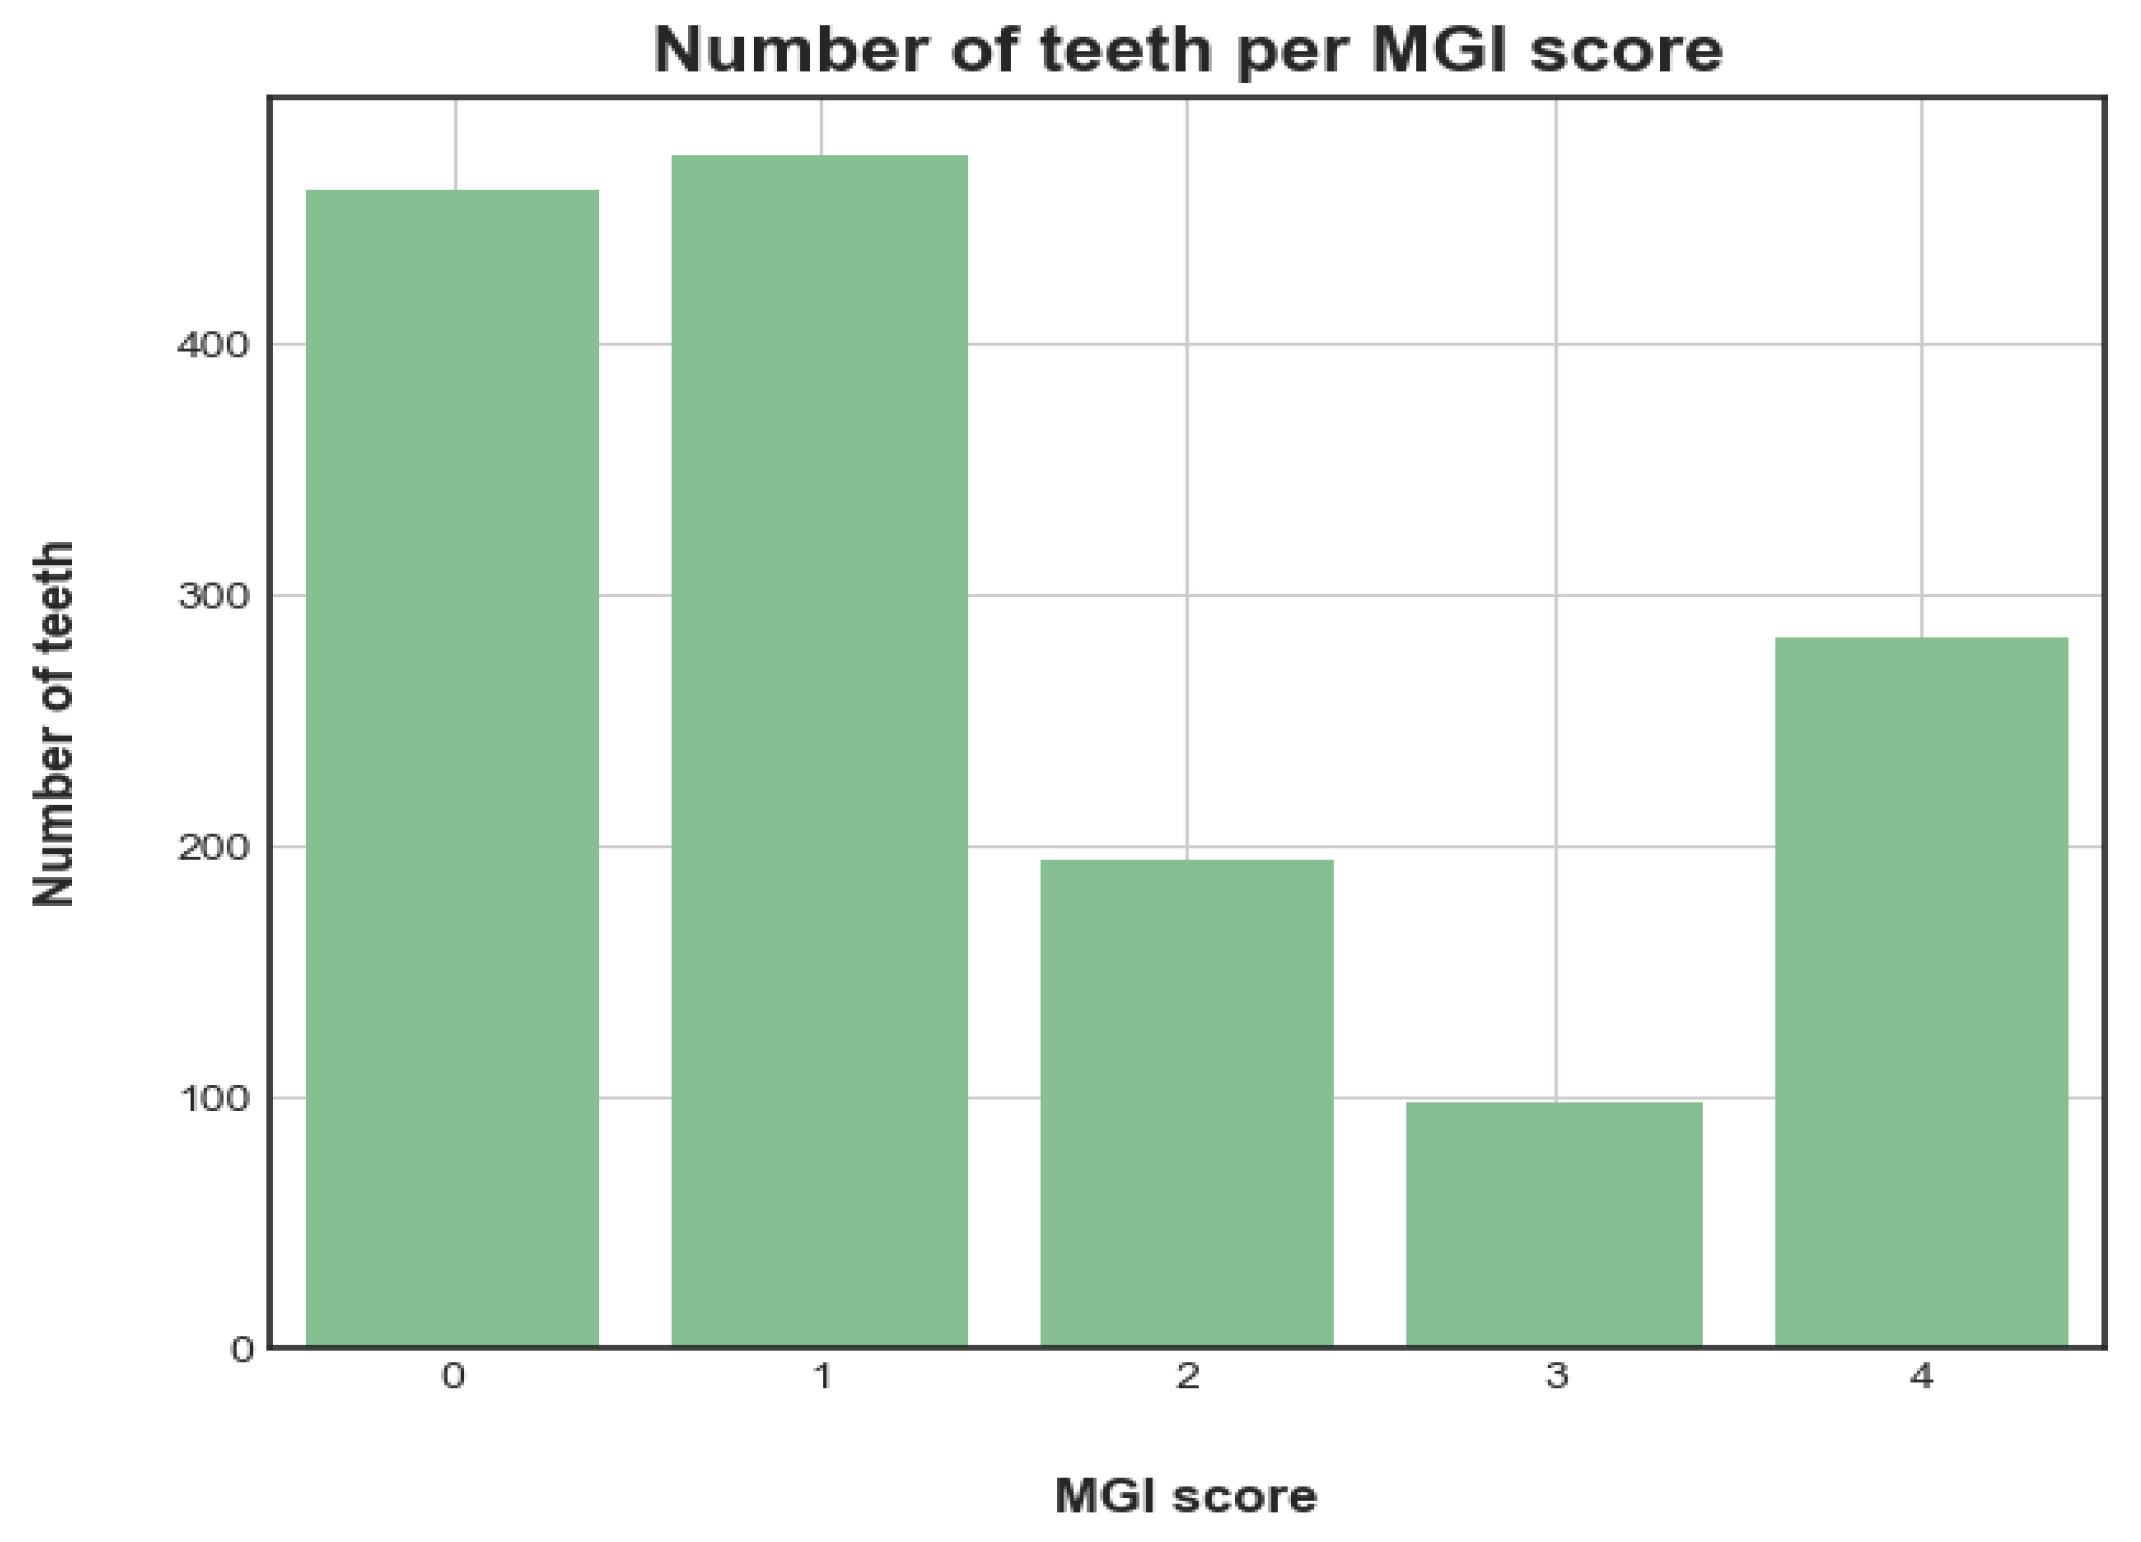
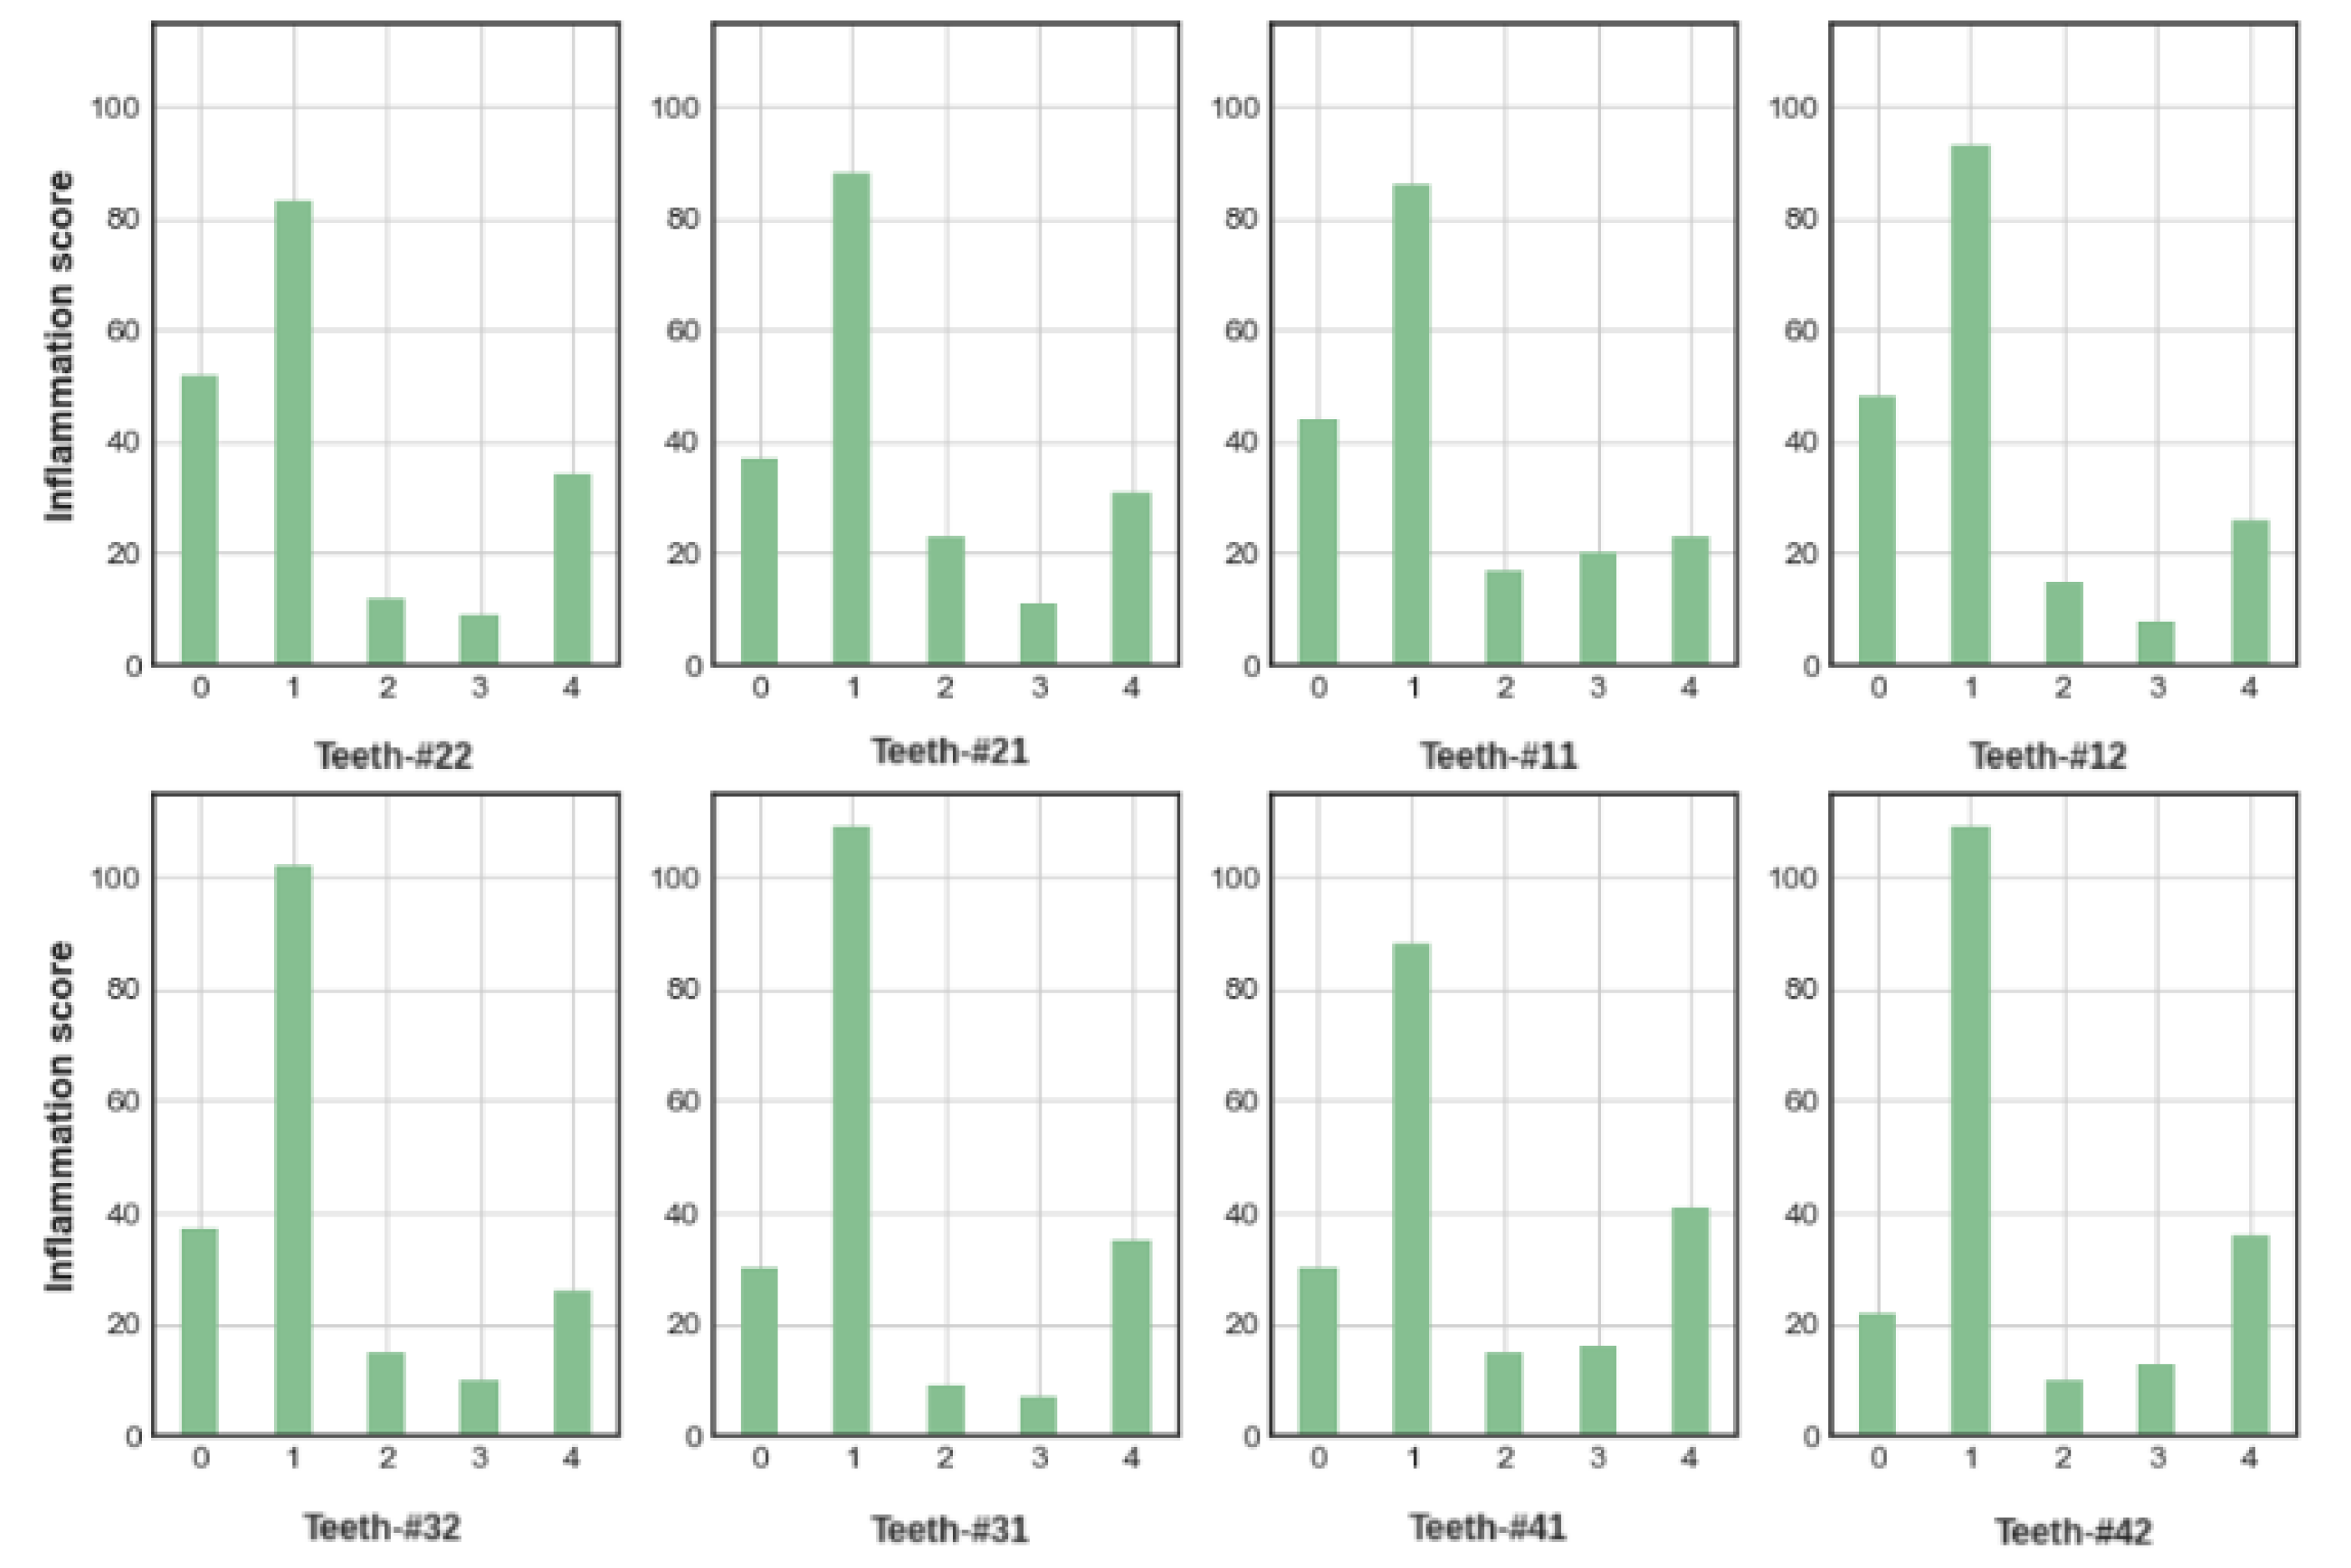
Next, Figure 5 and Figure 6 illustrate the distribution of MGI scores—overall, and per tooth position, indicating healthy, mild or severe inflammation, as was determined by a single board-certified examiner dentist that was blind to the participants.

2.2. Methods

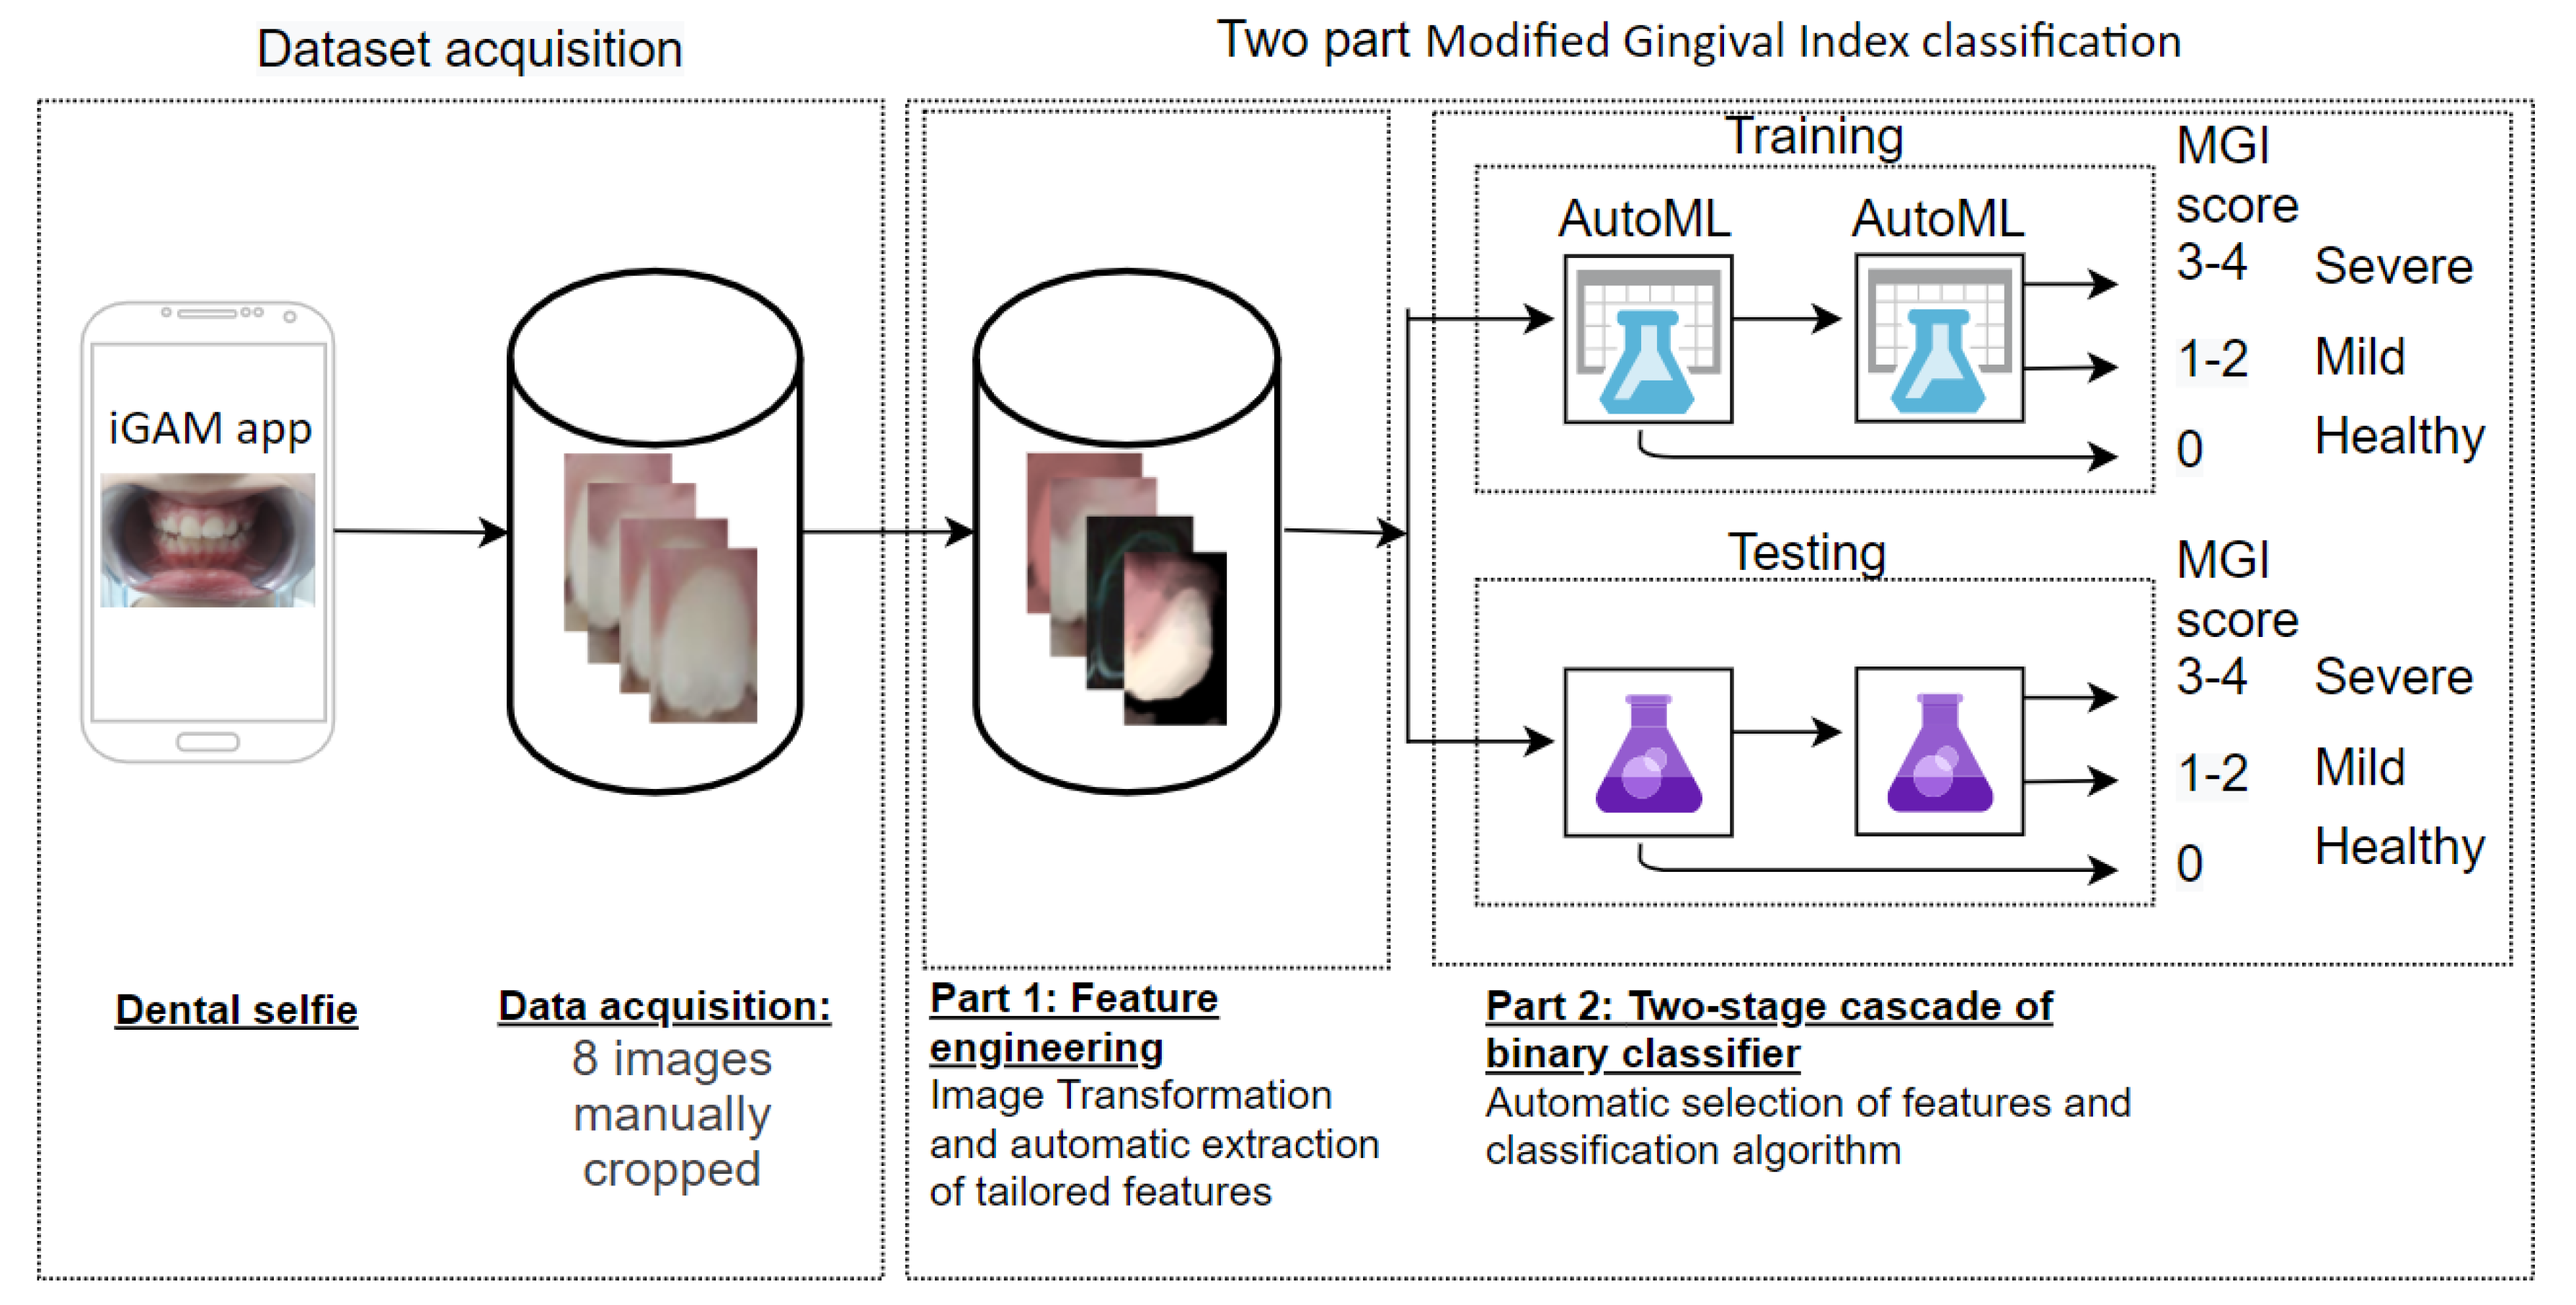
The input to our method is a cropped tooth image and the output is classification of the tooth gum health status (healthy, mild, or severe inflammation). Our proposed method (Figure 7) consists of two main parts: (1) feature engineering, extraction of just 35 features per image—specifically tailored to tooth images and the MGI properties. (2) Two-stage cascade of binary classifiers, for classifying gum health status based on the MGI score.
Next, is a detailed explanation of each of the two parts in our method.

2.2.1. Part 1 Image Transformation and Feature Engineering

The 35 features were extracted using the following 3-step process; Step 1: separate the image into two regions—the tooth region and gum region (Figure 8). Step 2: image transformation to achieve normalization of colors and hues, and edge enhancement. Step 3: feature extraction from the resulting transformed image. We will now describe these three steps more closely.
Step 1: image separation into two regions–we used the K-mean clustering algorithm with K = 2 to separate the image into its two most prominent clusters (regions)—the gum region and tooth region. See Figure 8 for an example of separation into two clear and distinct regions.
Step 2: image transformation—as mentioned, the dental selfies taken by users vary widely due to differences between cameras used, lighting conditions, image perspective, distance and zooming, lighting conditions, and more. Thus, we utilize six transformations to normalize image variation. Five of the six transformations we utilize are widely known from the literature. One transformation we developed specifically for normalizing dental images. The six are: Teeth Normalized (TN), Histogram Equalization Matching (HistMatch) [28], HSV (Hue), Bilateral Filter (BF) [29], Histogram of Oriented Gradients (HOG) [30], and Canny edge detector (CNY) [31]. These transformations can be divided into three: the first three (TN, HistMatch, and Hue) serve to normalize differences in lighting conditions between images, based on color-tone comparison. The fourth de-noises the image. The last two (HOG and CNY) were used to enhance the gradient, magnitude, and angle at the edge between the tooth and gum regions, as we assumed that the greater the contrast between gums and teeth the worse the inflammation (redness). Next is a short explanation about each of the transformations used: we start by describing the new transformation we developed, which we call teeth normalized (TN), tailored especially for images from a dental context—it normalizes the image colors by dividing each pixel’s value by the mean color value of the tooth region as determined by the K-mean clustering algorithm. We rely on the assumption that the difference in average tooth color between individuals, effectively normalizes color variation. Histogram Equalization Matching (HistMatch)—is a method which equalizes image contrast to a preselected randomly picked tooth image. Since the images were produced by different cameras and under different conditions the HistMatch transformation normalized all images to one scale. HSV representation (Hue)—HSV (hue, saturation, value) is an alternative form of encoding color (comparable to RGB), Hue transformation simply means using only the Hue channel (from the HSV encoding) of the image, as we assume that inflammation can be identified by the Hue of the color regardless of lightness and saturation. Bilateral filter (BF) [29]—is a nonlinear, edge-preserving, and noise-reducing method which normalizes and smoothens each pixel with the average value of its neighbors. Here, our aim is to clean the image of noise, while preserving the distinction between gum and tooth regions as much as possible. Histogram of Oriented Gradients (HOG)—is a method that captures the gradient and the orientation in a localized section of the image. As HOG enhances features from areas where contrast is high, it will focus on the edge between the gum and tooth regions, the higher the contrast—likely indicating worse gum health status. The last transformation is Canny (CNY) edge detector, one of the widely known edge detector algorithms; Here, also, the ‘stronger’ the edge identification—the higher the contrast—likely representing worse gum inflammation.
Step 3: feature extraction—the following features were extracted: first, we used two values for the gum region that the K-mean algorithm extracted during Step 1, (1) K-mean centroid (K-MEAN cent) and (2) std (K-MEAN var). We utilized LBP with rough histograms using three bins to approximate (3) edges (LBP (edges)), (4) flats (LBP (flats)), and (5) corners (LBP (corners)). Next, the following six features were extracted from the original image and from the five transformed images: (6) image mean (IM), (7) standard deviation (SD), (8) gradient-mean (GM), (9) magnitude-mean (MM), and (10) angle-mean (AM). It might be argued that the statistical measures (such as mean and standard deviation) depicting global characteristics of the entire image can hardly be used as meaningful features. However, in our case, because the images for which they are being computed are in fact relatively small, localized patches cropped from the original dental selfie—as seen in Figure 8—they are indeed significant. Thus, in total, our method uses just 35 features for each image.

2.2.2. Feature and Classifier Selection

The second part of our method consists of a cascade of two per-tooth-position binary classifiers. At the first stage we used binary classifiers to classify whether gums are healthy or inflamed. Class 0 (healthy gums) are the images that received an MGI score of 0 (i.e., no gingivitis) and Class 1 (inflamed) are all images with MGI scores 1 through 4 (some degree of inflammation). At the second stage of the cascade, another binary classifier classifies the level of inflammation as mild or severe, based on the MGI score. Class 0 (mild) = MGI score 1 or 2. Additionally, Class 1 (severe) = MGI score 3 or 4. The input to this second part is the 35 tailored features for each tooth image and the output is a per stage per tooth position accurate and robust classifier method accompanied by the dominant features (see part 2 in Figure 7). During the training phase, we utilized the AutoMl-H2O package to evaluate (by means of 5-fold cross-validation) and automatically select the most accurate classifier per tooth position per stage, and the five highest-contribution features per classifier. Then, testing was run only with the selected classifier-features combinations. The role of the first set of classifiers is to predict if the given tooth image gum health status is healthy or not (i.e., MGI score is zero or higher). The role of the second set of classifiers is to predict the severity of the gum inflammation: mild or severe, namely an MGI score of 1 or 2 vs. score of 3 or 4 (see part 2 of Figure 7).

3. Results

We randomly divided our 44 participants into two groups—39 for training and five for testing, resulting in a training dataset of 1336 tooth images and a test dataset of 184 tooth images. As described in the method section, just 35 features were extracted from each image. We utilized the H2O AutoML package with its default settings, to guarantee reproducibility, we set the max_model (the number of algorithms to be tested) to 30, and the seed to 1 (Source code for h2o.automl.autoh2o).
Next, we will report results, for each of the two stages of the cascade. First, training results will be presented: a table reporting the accuracy by the Average AUC (Area Under the Curve) score, achieved by the best performing classifier for each tooth-position in 5-fold cross-validation, and a histogram of the features selected—by contribution to accuracy of these classifiers. Then, test-set results will be presented in a table reporting the accuracy (AUC score) achieved by each tooth-position classifier-features combination.
Looking at Table 2, which sets out the statistics for the best-performing classifier per tooth position, you can see that XGBoost was found to be the most accurate classifier for six of the eight positions.
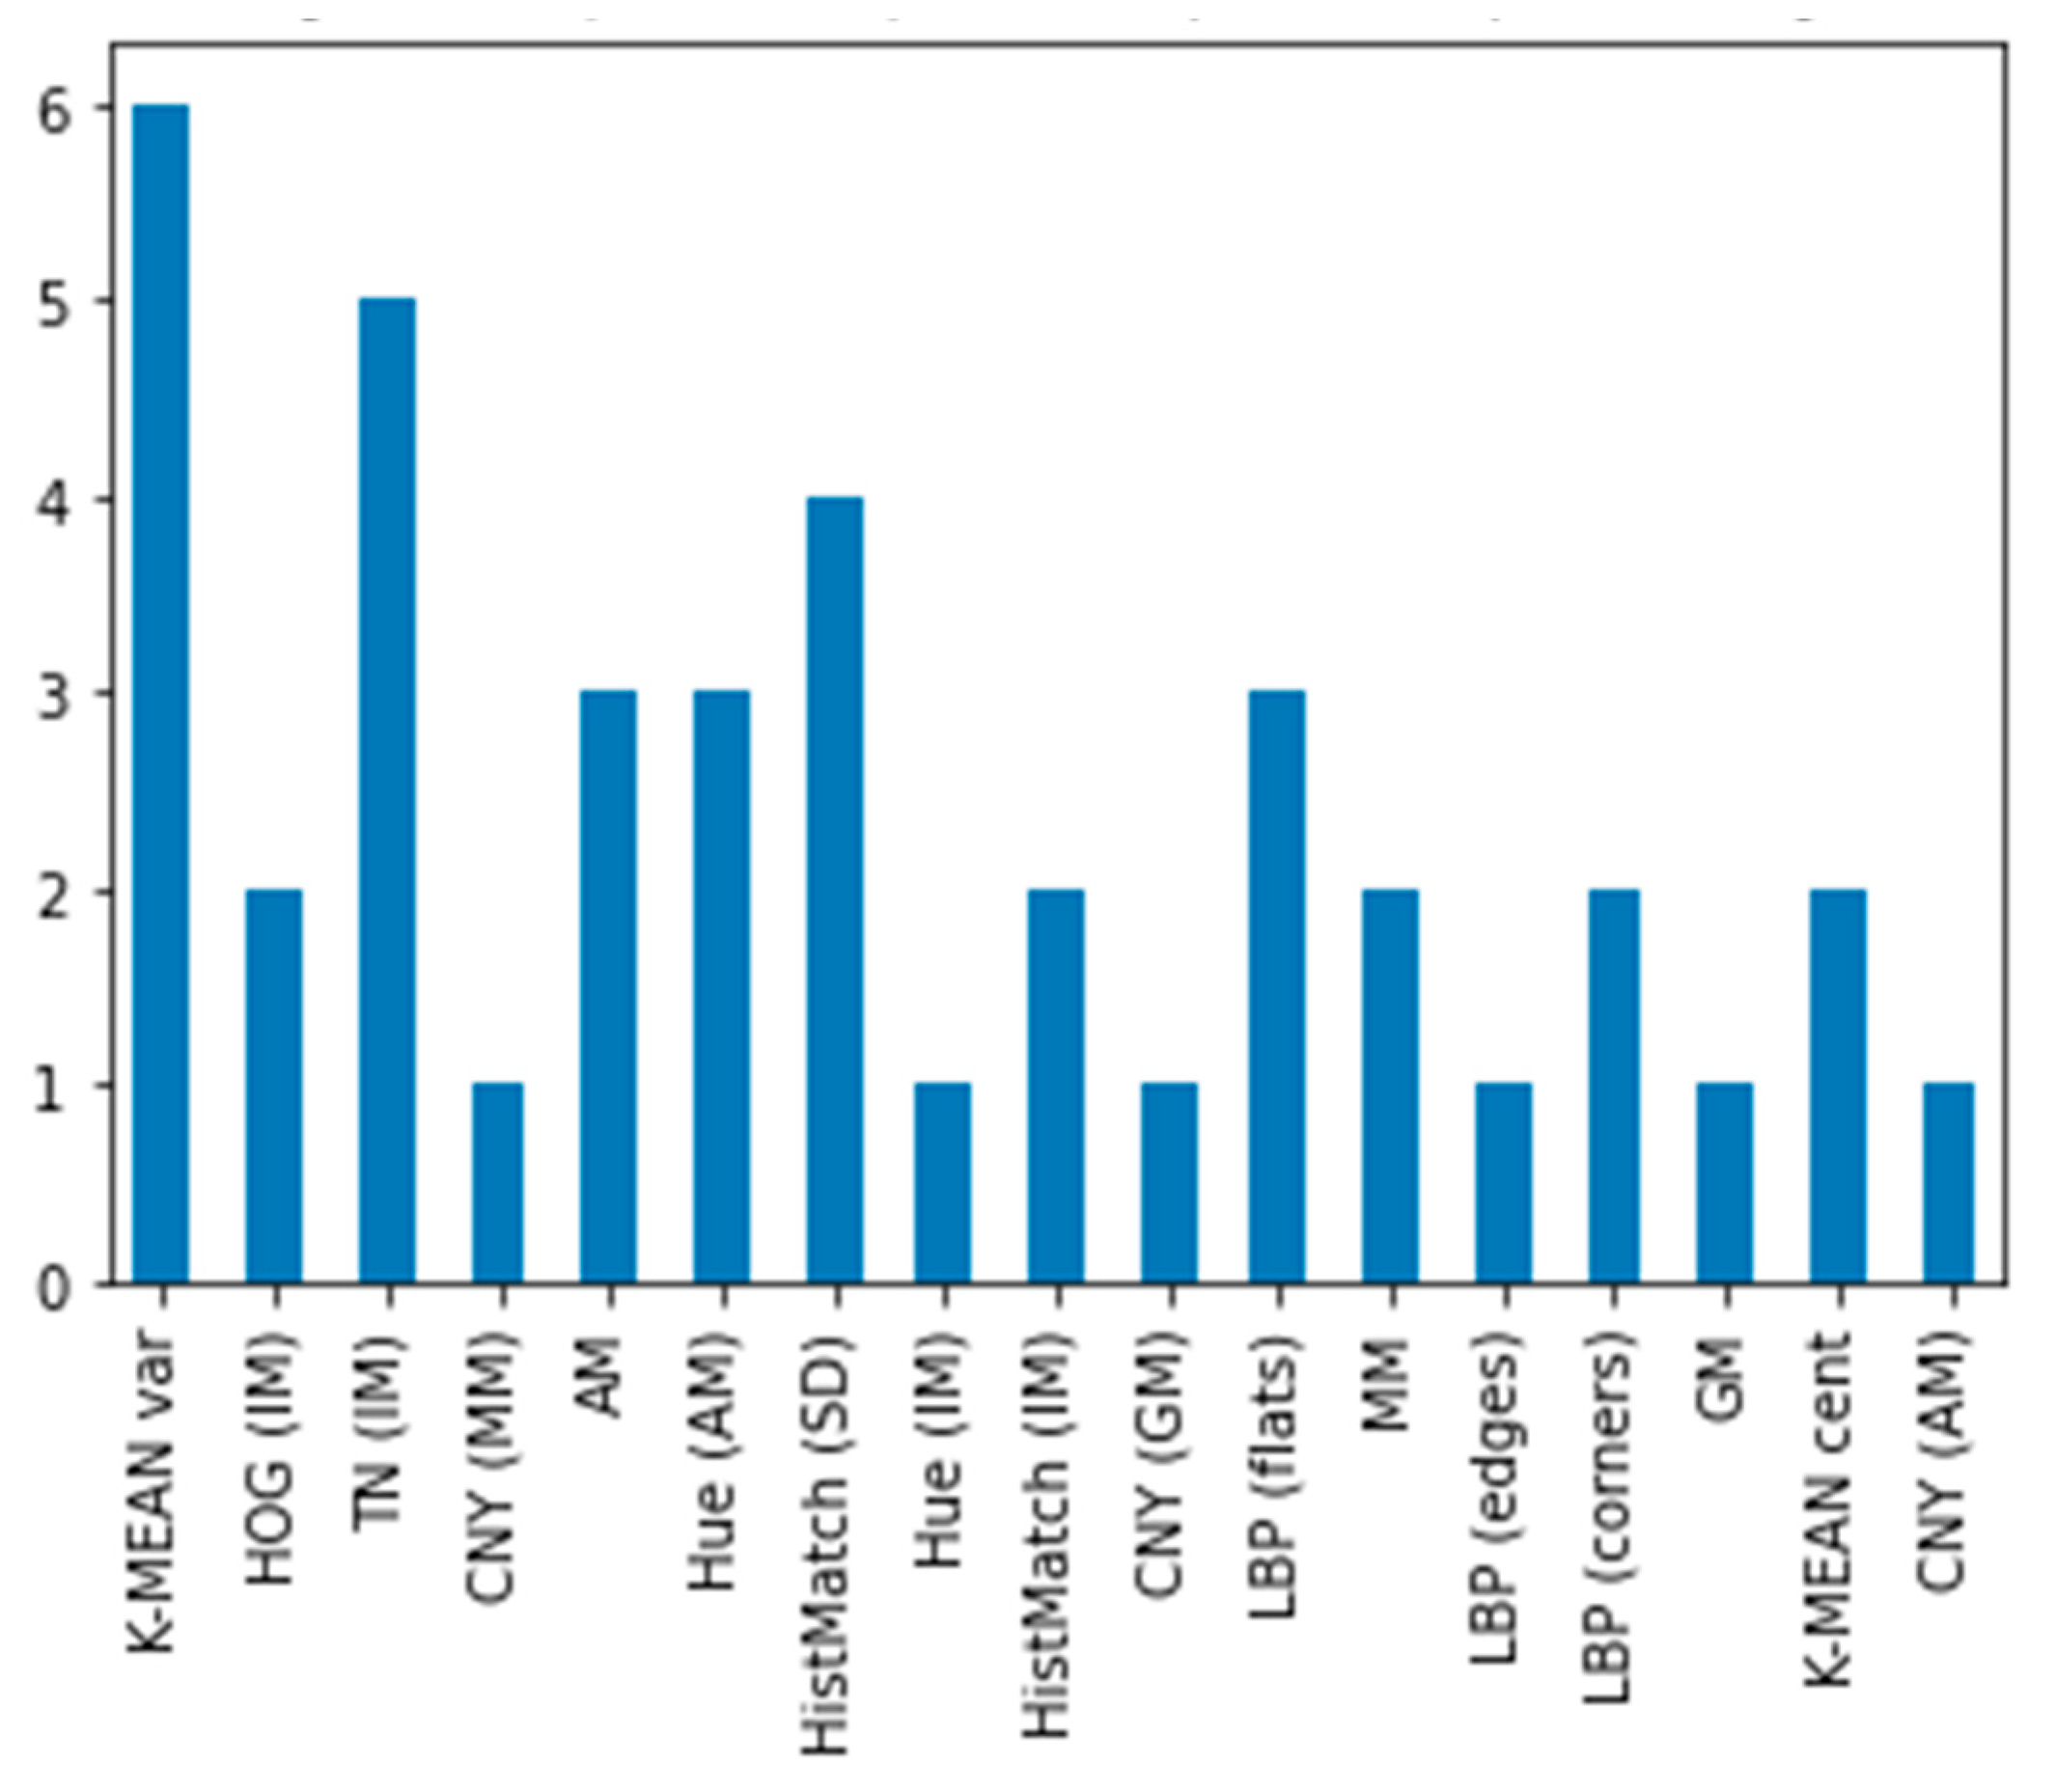
Regarding feature selection, the five features found to have the greatest contribution to successful classification during training were selected. Figure 9 presents the five features with greatest contribution, for the eight classifiers—one per tooth-position. K-mean var was found to be among the most contributing features for six of eight tooth positions. TN (IM)—the specialized dental-image feature we developed—was among the most contributing for five of eight positions. HistMatch (SD) had the third most positions and it was among the most contributing for four of eight.
Now, let us turn to the test-set results. Table 3 presents the AUC score results. It is noteworthy that although the test-set is quite small (about 20 images per tooth-position) the AUC score obtained ranges from 1.0 for positions #12 and #42 to 0.69, with just two positions scoring below 0.8. Additionally, note that the accuracy of our method is generally higher for the lateral incisors (position #s ending with 2) than the central incisors (those ending with 1), and higher for the lower teeth (position #s beginning with 3 and 4) than the upper teeth. Additional information regarding the performance of the first stage test-set, including F1at threshold scores and confusion matrices, can be found in Table A1 and Figure A1.
At the second stage of the cascade, another binary classifier classifies the degree of inflammation as mild or severe, based on the MGI score. Here, again, we will first report the 5-fold cross-validation results from training for the best performing classifiers and selected—most-contributing—features (Table 4), then we will show the test-set results for the classifier-features combinations (Table 5).
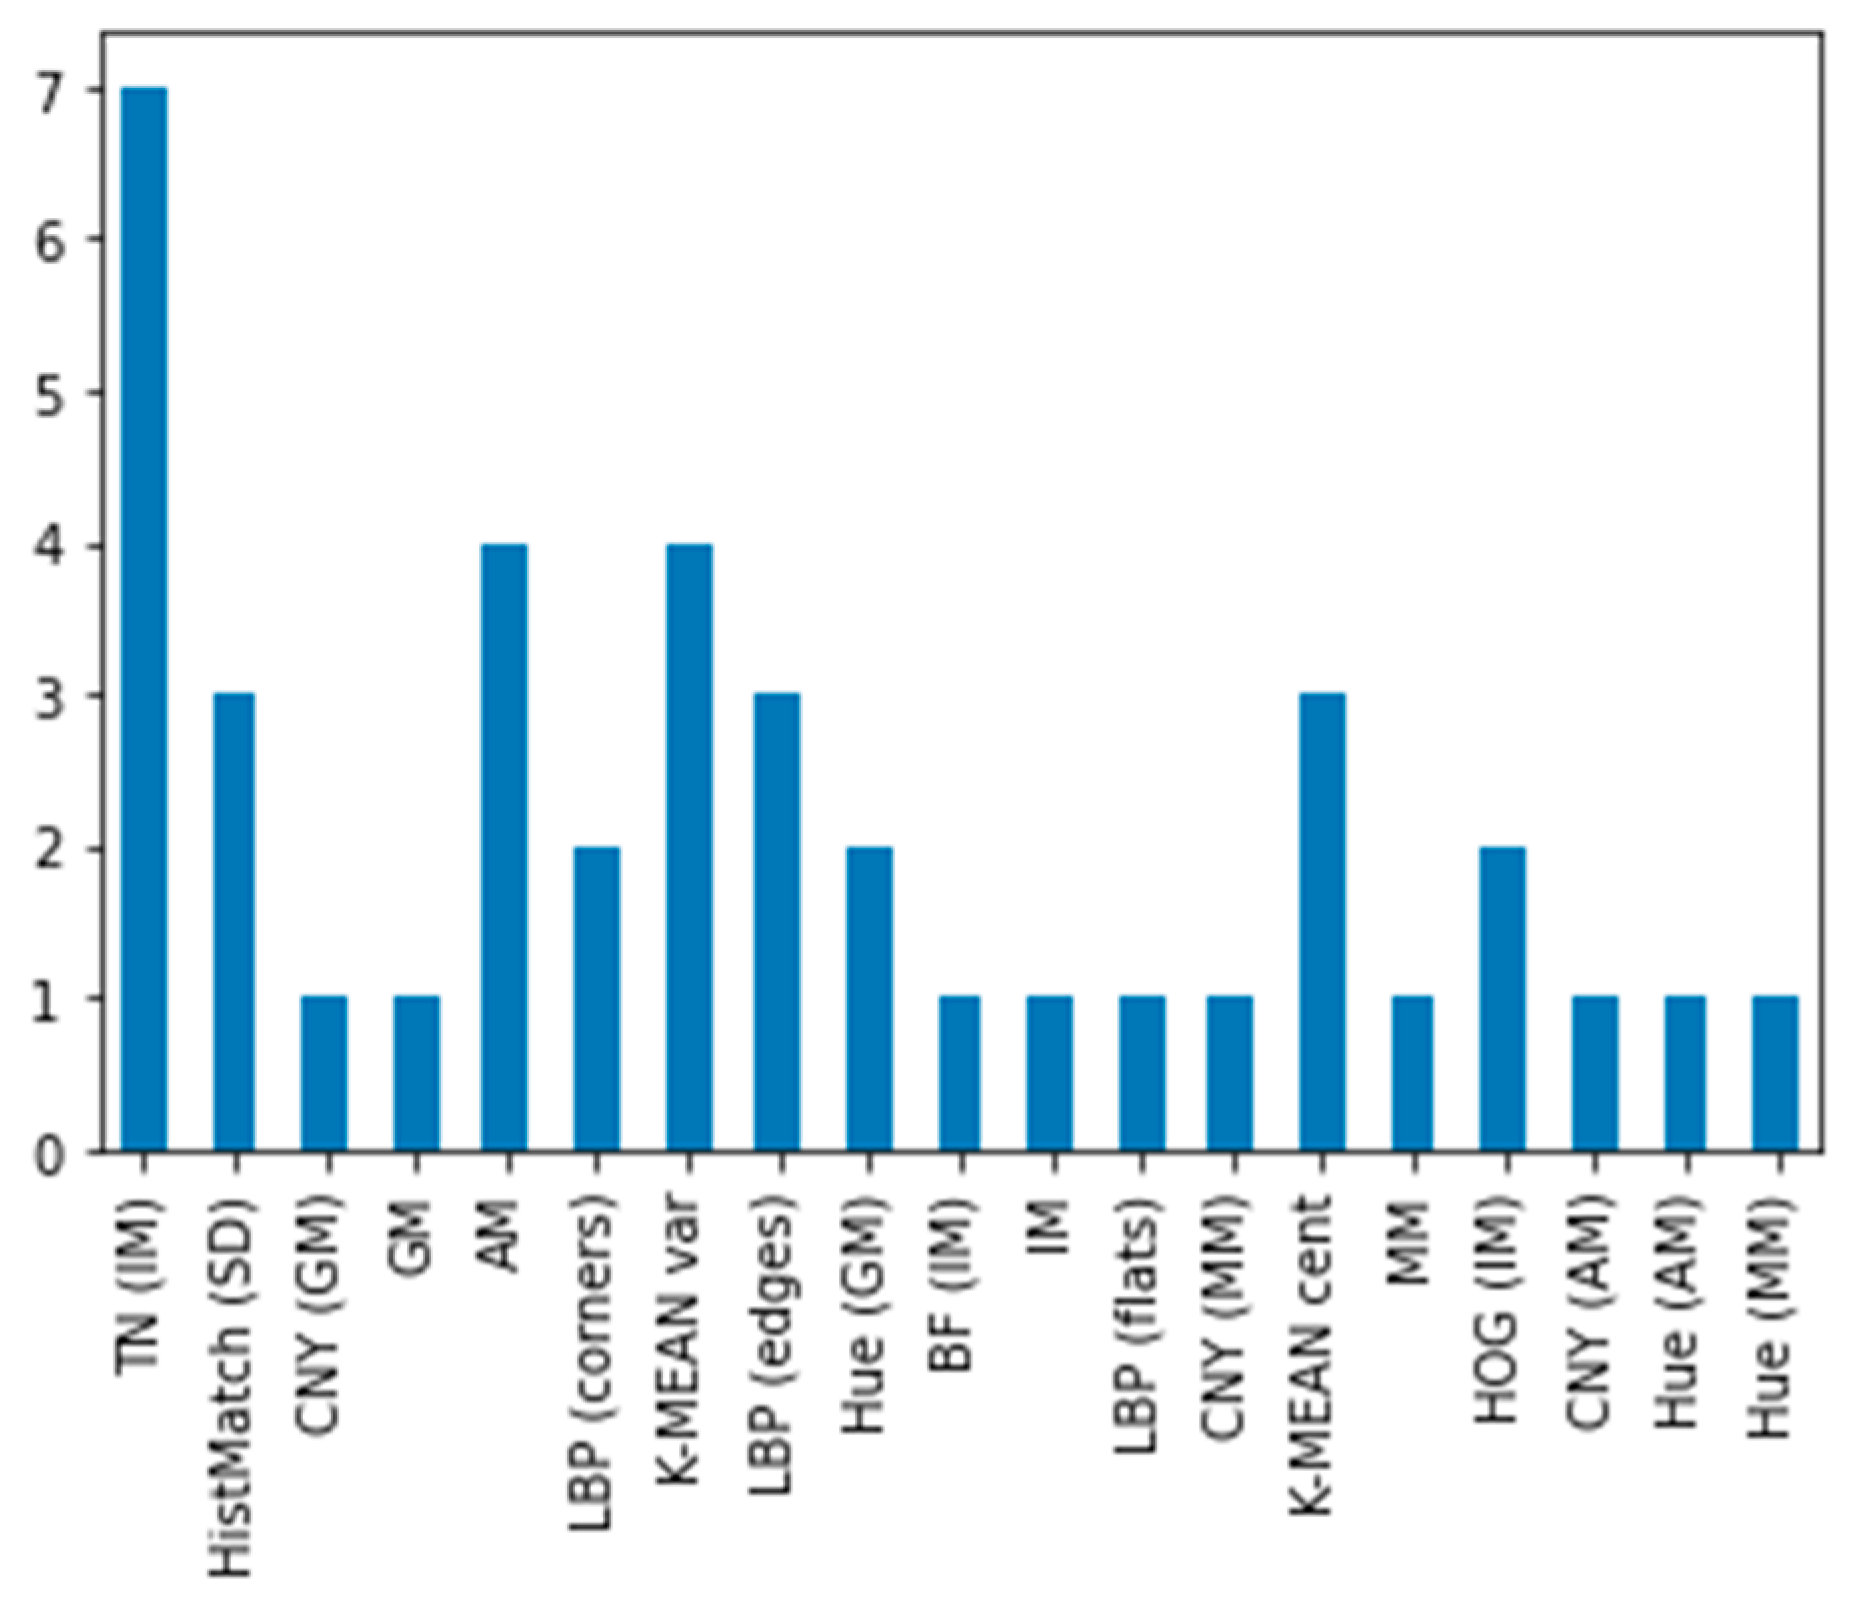
The most contributing features are presented in Figure 10. As evident, our unique dental-image feature, TN (IM) was found to be among the most contributing for seven of eight tooth position classifiers. k-mean (var) and angle-mean (AM) were among the most contributing for four of eight positions.
Test set results of the second stage of the cascade, as can be seen in Table 5, XGBoost classifier, which dominated the first stage, was still among the most accurate, but MLP outperformed XGBoost. We observe high accuracy for all teeth, with higher accuracy achieved for the lower teeth, the accuracy ranging between 1.0 and 0.84. Additional information regarding the performance of the second stage test-set, including F1atthreshold scores and confusion matrices, can be found in Table A2 and Figure A2.

4. Discussion

This study is the first to our knowledge that utilized an mHealth app (iGAM) to study the use of dental selfies to reduce gingivitis in the home setting. We present a new method capable of accurately classifying gum condition based on the MGI score. From the results presented it is evident that despite the small dataset our method produced accurate classification of gum condition. Our method can aid the diagnostic process, towards prognosis by automatically reporting whether gums are healthy or inflamed, based on dental selfies taken by the user, using an efficient and focused set of features. Among the classifiers considered in our testing, XGBoost was most accurate for the most cases overall (6/8 positions at the first stage of the cascade and another 3/8 at the second stage). This is not surprising, considering XGBoost has proven accurate and efficient in many contexts [32]. Moreover, XGBoost is computationally relatively light, making it ideal for implementation on mobile devices. MLP proved most accurate for four cases.
Our method uses a classifier per tooth per stage. The results of our lower teeth classifiers achieved higher accuracy than those for the upper teeth. In addition, lateral incisor classifiers were more accurate than central incisor classifiers. These results demonstrate the reliability of our method, since they correlate with clinical dental findings that the gums of the lower teeth tend to show inflammation and escalation first, due to proximity to the salivary glands and poor brushing technique [33].
As to the feature selection, we focused on a set of 35 features extracted per image, chosen specifically with the characteristics of our dental tooth images in mind (wide variability in lighting, perspective, cameras, and other qualities, with underlying similarity in content). The analysis by AutoML-H2O found the most contributing features for each of the classifiers (see Figure 9 and Figure 10). Note that our innovative feature tailored to the dental context—TN (IM)—was selected by AutoML-H2O for the most cases 5/8 positions at the first stage, and 7/8 at the second stage, proving its value.
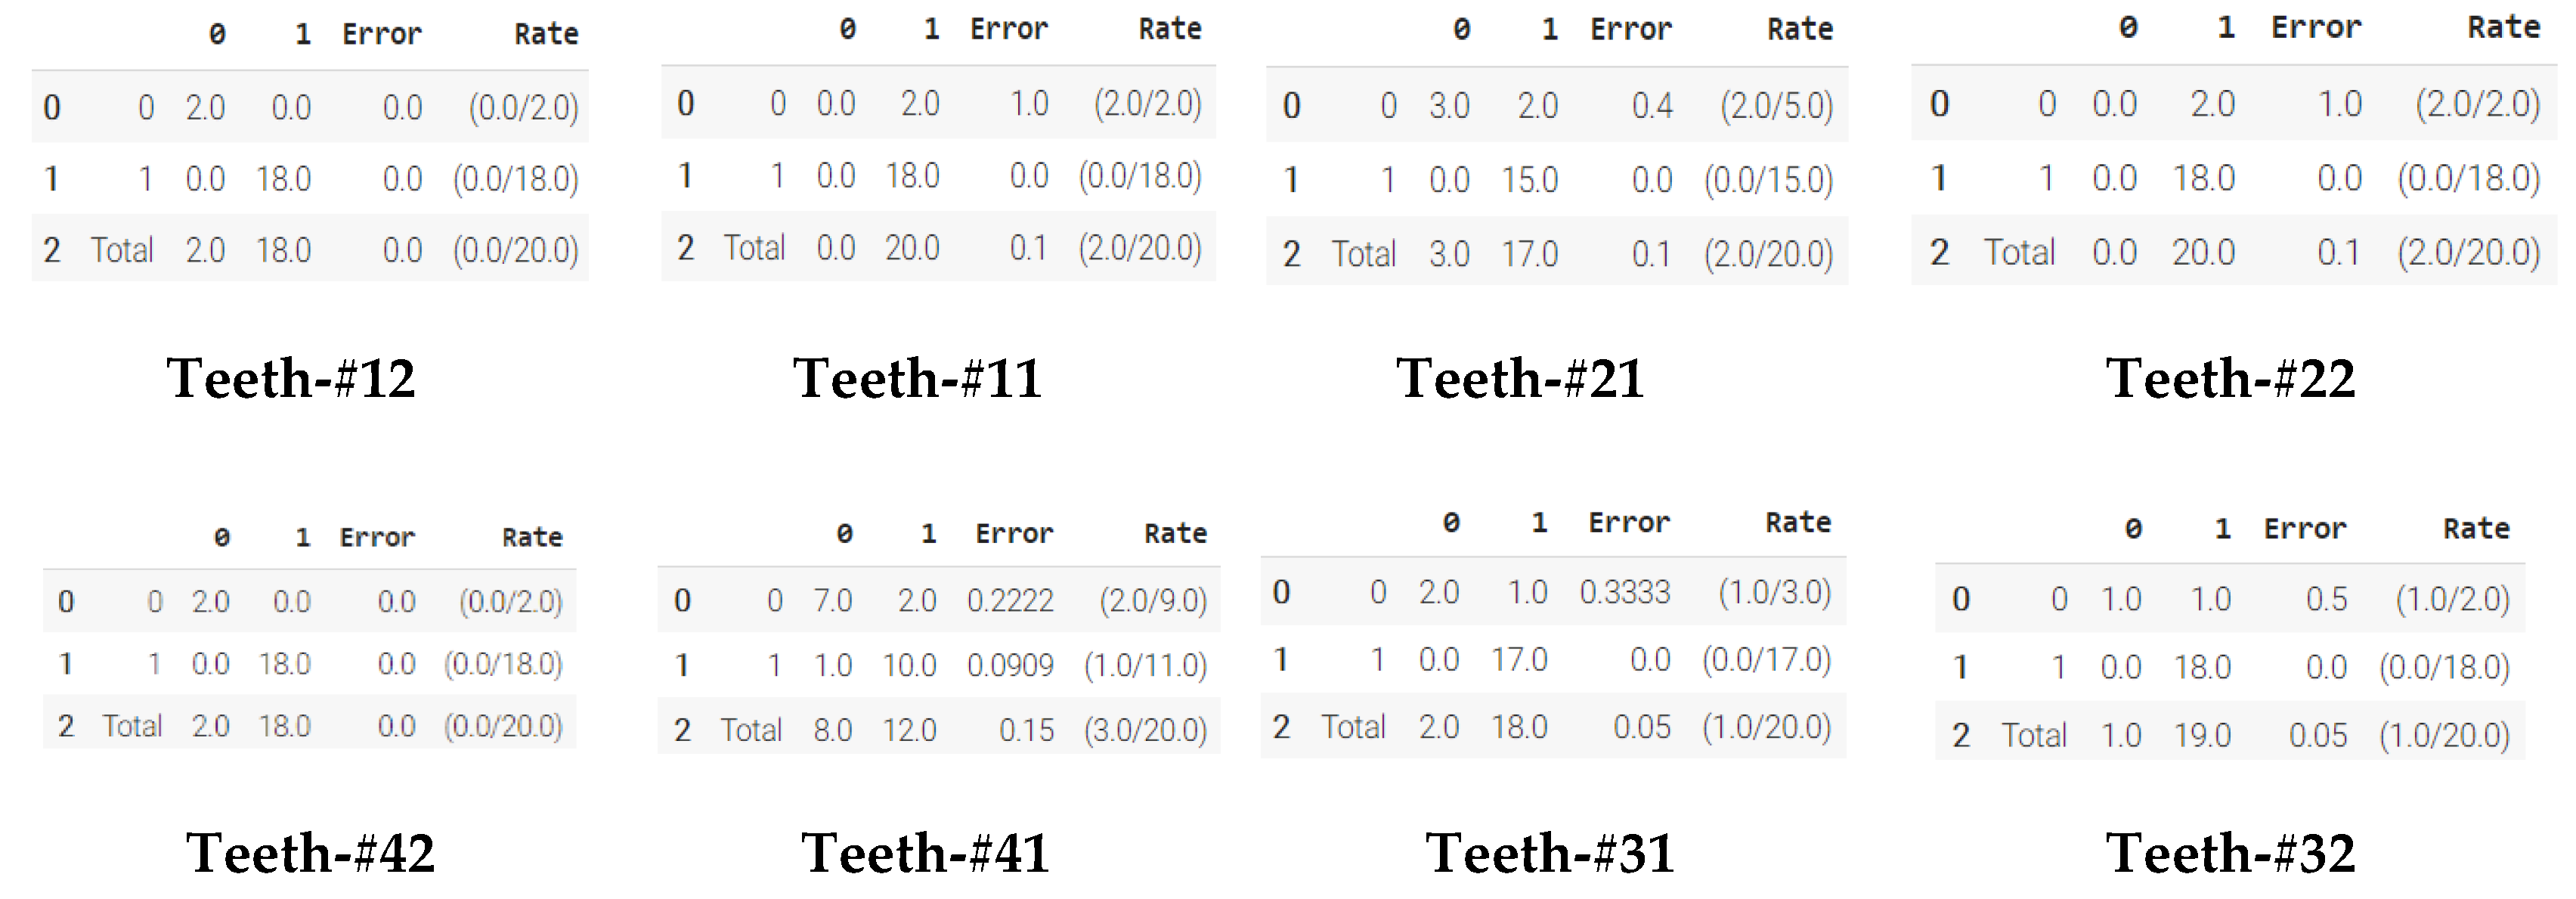
Despite the two-stage cascade, note that at the second stage, our accuracy for three of the four lower teeth—which as we mentioned are the more significant ones—is 1.0 (see Table 5 and Figure A2) which means the accuracy of the model overall is dependent on the accuracy of the first stage. Looking at the Confusion Matrices in Table A2 teeth positions #11 and #22 have an overall accuracy of 0.9, but have an accuracy of 0 for healthy gums—meaning the system is oversensitive. This can be considered an advantag—false positives rather than false negatives, so as not to miss any images where gums are inflamed, we prefer a dentist to have to unnecessarily inspect healthy gums, than that they might miss a case of inflammation.
The limitation for this research was the small dataset. We believe that the dataset size was a central reason we needed to train per-case classifiers. Since the attempt to train a single classifier for all teeth positions was unsuccessful, we trained a unique classifier-features selection per position. Moreover we could not train a single classifier to classify cases between three classes (healthy gums, mild inflammation, and severe inflammation), though in this case the cause may be the AutoML-H2O package, which while proving itself capable of achieving high accuracy for binary classification is known to underperform on multiclass classification tasks, leading us to adopt a two-stage cascade of binary classifiers [26]. To advance and improve our method we need to gather a more comprehensive dataset, and have MGI ratings from several dentists, allowing for a generalization of the model. Another avenue to be explored is the degree of correlation between gum condition at the frontal teeth and overall gum condition, especially in the molar teeth [32].
Another drawback of the implementation we explored in this paper is the need to manually mark a bounding box around each tooth for cropping single tooth images from dental selfies, at the next stage, to provide an end-to-end automated system, we intend to develop an automatic segmentation process, also implementing advanced methods such as deep learning.

5. Conclusions

iGAM app is the first m-Health app for monitoring gingivitis to promote oral health using self-photography [21]. The innovation of the paper is our proposal of a method that—based on dental selfies alone—can inform both the user and dental healthcare provider whether the patient is suffering from gingivitis, and alert them to any deterioration in gum health over time, and this information can easily be used by the periodontist for recommending the best course of treatment or hygiene to improve gum health or maintain healthy gums.

Author Contributions

Contributed equally. All authors have read and agreed to the published version of the manuscript.

Funding

This work was supported by Azrieli College of Engineering—Jerusalem Research Fund.

Conflicts of Interest

None of the authors have any conflict of interest. The authors have no personal financial or institutional interest in any of the materials, software, or devices described in this article.

Compliance with Ethical Standards

The study was approved by the Hadassah research ethics committee (IRB, 0212-18-HMO), and informed consent was obtained from all participants.

Appendix A

Herein we include additional results from the study, which are not strictly necessary to the argument of the main text, but nevertheless offer important insights and elaborate on the data presented in the main text.
Table A1 and Figure A1 present results of the first stage of the cascade.
Table A1. First stage of cascade; test-set performance: for each tooth position, the AUC and F1 at threshold score for the best performing classifier-features combination selected reported.
Tooth NumberF1 at ThresholdAUC Score
121.0 at 0.641.0
110.94 at 0.240.83
210.93 at 0.410.69
220.94 at 0.10.8
421.0 at 0.541.0
410.86 at 0.990.84
310.97 at 0.40.78
320.97 at 0.330.94
Figure A1. Test-set performance, per tooth-position binary classifier (healthy/inflamed) results at the first stage of the cascade. In the confusion-matrix class-0 indicates healthy gums (MGI score of 0) and class-1 inflamed (MGI scores 1 through 4).
Applsci 10 08923 g0a1
Table A2 and Figure A2 present results of the second stage of the cascade.
Table A2. Second stage of cascade; test-set performance: for each tooth position, the AUC and F1 at threshold score for the classifier-features combination selected are reported.
Tooth NumberF1 at ThresholdAUC Score
120.82 at 0.90.87
110.84 at 0.40.86
210.88 at 0.360.94
220.88 at 0.080.91
420.8 at 0.760.84
411.0 at 0.761.0
311.0 at 0.571.0
321.0 at 0541.0
Figure A2. Test-set per tooth-position binary classifier (mild/severe inflammation) results at the second stage of the cascade. In the confusion-matrix class-0 indicate healthy gums (MGI score of 0) and class-1 inflamed (MGI scores 1 through 4).
Applsci 10 08923 g0a2

References

  1. Lingström, P.; Mattsson, C.S. Chapter 2: Oral conditions. In Monographs in Oral Science; Karger Medical and Scientific Publishers: Basel, Switzerland, 2019; Volume 28. [Google Scholar]
  2. Conrads, G.; About, I. Pathophysiology of Dental Caries. Monogr. Oral Sci. 2018, 27, 1–10. [Google Scholar] [CrossRef] [PubMed]
  3. Wiebe, C.B.; Putnins, E.E. The periodontal disease classification system of the American Academy of Periodontology-An update. J. Can. Dent. Assoc. 2000, 66, 594–599. [Google Scholar] [PubMed]
  4. Barnes, C.M.; Russell, C.M.; Reinhardt, R.A.; Payne, J.B.; Lyle, D.M. Comparison of irrigation to floss as an adjunct to tooth brushing: Effect on bleeding, gingivitis, and supragingival plaque. J. Clin. Dent. 2005, 16, 71. [Google Scholar] [PubMed]
  5. Kumar, S. Evidence-Based Update on Diagnosis and Management of Gingivitis and Periodontitis. Dent. Clin. N. Am. 2019, 63, 69–81. [Google Scholar] [CrossRef]
  6. Cantore, S.; Ballini, A.; Mori, G. Anti-Plaque and Antimicrobial Efficiency of Different Oral Rinse in A 3-Days Plaque Accumulation Model. Evaluation of Biocompatibility and Osteoinductivity of Innovative Biomaterials for Regenerative Medicine Applications View Project. Available online: https://www.researchgate.net/publication/313222336 (accessed on 3 December 2020).
  7. Loesche, W.J. Microbiology of Dental Decay and Periodontal Disease, 4th ed.; University of Texas Medical Branch: Galveston, TX, USA, 1996. [Google Scholar]
  8. He, T.; Qu, L.; Chang, J.; Wang, J. Gingivitis models-relevant approaches to assess oral hygiene products. J. Clin. Dent. 2018, 29, 45–51. [Google Scholar]
  9. Rebelo, M.A.B.; de Queiroz, A.C. Gingival Indices: State of Art. In Gingival Diseases-Their Aetiology, Prevention and Treatment; BoD–Books on Demand: Norderstedt, Germany, 2011. [Google Scholar]
  10. Murakami, S.; Mealey, B.L.; Mariotti, A.; Chapple, I.L.C. Dental plaque–induced gingival conditions. J. Clin. Periodontol. 2018, 45, S17–S27. [Google Scholar] [CrossRef]
  11. Kinane, D.F.; Stathopoulou, P.G.; Papapanou, P.N. Periodontal diseases. Nat. Rev. Dis. Primers 2017, 3, 1–4. [Google Scholar] [CrossRef]
  12. Tatullo, M.; Marrelli, M.; Amantea, M.; Paduano, F.; Santacroce, L.; Gentile, S.; Scacco, S. Bioimpedance detection of Oral Lichen Planus used as preneoplastic model. J. Cancer 2015, 6, 976–983. [Google Scholar] [CrossRef] [Green Version]
  13. Sheiham, A.; Netuveli, G.S. Periodontal diseases in Europe. Periodontol. 2000 2002, 29. [Google Scholar] [CrossRef]
  14. Baelum, V.; Scheutz, F. Periodontal diseases in Africa. Periodontol. 2000 2002, 29. [Google Scholar] [CrossRef]
  15. Levin, L.; Margvelashvili, V.; Bilder, L.; Kalandadze, M.; Tsintsadze, N.; Machtei, E.E. Periodontal status among adolescents in Georgia. A pathfinder study. Peer J. 2013, 1, e137. [Google Scholar] [CrossRef] [PubMed] [Green Version]
  16. Chapple, I.L.; Van Der Weijden, F.; Doerfer, C.; Herrera, D.; Shapira, L.; Polak, D.; Madianos, P.; Louropoulou, A.; Machtei, E.; Donos, N.; et al. Primary prevention of periodontitis: Managing gingivitis. J. Clin. Periodontol. 2015, 42, S71–S76. [Google Scholar] [CrossRef] [PubMed] [Green Version]
  17. Van der Weijden, F.A.; Slot, D.E. Efficacy of homecare regimens for mechanical plaque removal in managing gingivitis a meta review. J. Clin. Periodontol. 2015, 42, S77–S91. [Google Scholar] [CrossRef] [PubMed]
  18. Schiff, T.; Proskin, H.M.; Zhang, Y.P.; Petrone, M.; DeVizio, W. A clinical investigation of the efficacy of three different treatment regimens for the control of plaque and gingivitis. J. Clin. Dent. 2006, 17, 138. [Google Scholar] [PubMed]
  19. Pastagia, J.; Nicoara, P.; Robertson, P.B. The Effect of Patient-Centered Plaque Control and Periodontal Maintenance Therapy on Adverse Outcomes of Periodontitis. J. Evid. Based. Dent. Pract. 2006, 6, 25–32. [Google Scholar] [CrossRef] [PubMed]
  20. Shahrabani, S. Factors affecting oral examinations and dental treatments among older adults in Israel. Isr. J. Health Policy Res. 2019, 8, 43. [Google Scholar] [CrossRef] [PubMed]
  21. Tobias, G.; Spanier, A.B. Developing a Mobile App (iGAM) to Promote Gingival Health by Professional Monitoring of Dental Selfies: User-Centered Design Approach. JMIR mHealth uHealth 2020, 8, e19433. [Google Scholar] [CrossRef]
  22. Real, E.; Liang, C.; So, D.R.; Le, Q.V. AutoML-Zero: Evolving Machine Learning Algorithms From Scratch. 2020. Available online: http://arxiv.org/abs/2003.03384 (accessed on 30 June 2020).
  23. Hanussek, M.; Blohm, M.; Kintz, M. Can AutoML outperform humans? An evaluation on popular OpenML datasets using AutoML Benchmark. 2020. Available online: https://arxiv.org/abs/2003.06505 (accessed on 13 March 2020).
  24. Zöller, M.-A.; Huber, M.F. Survey on automated machine learning. arXiv e-Prints 2019, 1–65. Available online: http://arxiv.org/abs/1904.12054 (accessed on 30 August 2020).
  25. Truong, A.; Walters, A.; Goodsitt, J.; Hines, K.; Bruss, C.B.; Farivar, R. Towards automated machine learning: Evaluation and comparison of AutoML approaches and tools. In Proceedings of the 2019 IEEE 31st International Conference on Tools with Artificial Intelligence (ICTAI), Portland, OR, USA, 4–6 November 2019. [Google Scholar]
  26. Halvari, T.; Nurminen, J.K.; Mikkonen, T. Testing the Robustness of AutoML Systems. Electron. Proc. Theor. Comput. Sci. 2020, 319. [Google Scholar] [CrossRef]
  27. LeDell, E.; Poirier, S. H2O automl: Scalable automatic machine learning. In Proceedings of the AutoML Workshop at ICML, Long Beach, CA, USA, 14–15 June 2019; Volume 2020. [Google Scholar]
  28. Jähne, B. Concepts, Algorithms, and Scientific Applications. In Digital Image Processing, 3rd ed.; Springer: New York, NY, USA, 1995. [Google Scholar]
  29. Tomasi, C.; Manduchi, R. Bilateral filtering for gray and color images. In Proceedings of the Sixth International Conference on Computer Vision, Bombay, India, 7 January 1998. [Google Scholar] [CrossRef]
  30. McConnell, R.K. Method of and Apparatus for Pattern Recognition. U.S. Patent No. 4,567,610, 28 January 1986. [Google Scholar]
  31. Canny, J. A Computational Approach to Edge Detection. IEEE Trans. Pattern Anal. Mach. Intell. 1986, 8, 679–698. [Google Scholar] [CrossRef]
  32. Chen, T.; Guestrin, C. XGBoost: A scalable tree boosting system. In Proceedings of the 22nd Acm Sigkdd International Conference on Knowledge Discovery and Data Mining, San Francisco, CA, USA, 13–17 August 2016; pp. 785–794. [Google Scholar] [CrossRef] [Green Version]
  33. Dawes, C. Why does supragingival calculus form preferentially on the lingual surface of the 6 lower anterior teeth? J. Can. Dent. Assoc. 2007, 72, 923–926. [Google Scholar]
Figure 1. Interaction between participant (patient), app admin (researcher, dentist), and data storage server (Firebase).
Applsci 10 08923 g001
Figure 2. The distribution of the 190 dental selfies—shows the number of participants per length of participation in our pilot study (number of weekly selfies sent using the app).
Applsci 10 08923 g002
Figure 3. A dental selfie (out of the 190 collected). The bounding box marked by the dentist around the upper right lateral incisor (tooth #12) shown outlined in black. (One of eight bounding boxes used to crop single tooth images from the selfie).
Applsci 10 08923 g003
Figure 4. The ISO 3950 Teeth notation system.
Applsci 10 08923 g004
Figure 5. Showing the distribution of MGI scores received by our 1520 single-tooth images. Our dataset included: 471 images rated 0 = healthy—no inflammation; 475 rated 1 = mild inflammation; 195 rated 2; 98 rated 3; 283 rated 4 = severe inflammation.
Applsci 10 08923 g005
Figure 6. Eight histograms, one for each of the eight tooth positions we dealt with. In each histogram the five bins are MGI score: 0 (no inflammation), 1–2 (mild inflammation), and 3–4 (severe inflammation).
Applsci 10 08923 g006
Figure 7. Overview of the method described in the paper. Dataset acquisition: eight single tooth images manually cropped from each dental selfie taken by iGAM users. Fed into two-part classification method: part (1) image transformation and feature engineering—extraction of features tailored to dental images; part (2) two-stage cascade of binary classifiers—Healthy/Unhealthy, Mild/Severe.
Applsci 10 08923 g007
Figure 8. Image separation into two regions—left: the original tooth image; right: the separation into two regions (clusters) produced by the K-mean algorithm.
Applsci 10 08923 g008
Figure 9. Feature contribution at the first stage of the cascade (healthy/inflammation). The histogram represents the five most contributing features for the most accurate classifier for each of the eight tooth-positions.
Applsci 10 08923 g009
Figure 10. Feature contribution at the second stage of the cascade (mild/severe inflammation). The histogram represents the five most contributing features for the most accurate classifier for each of the eight tooth-positions.
Applsci 10 08923 g010
Table 1. The Modified Gingival Index (MGI).
ScoreInflammationAppearance
0NormalNone
1Mild inflammationSlight changes in color and texture, but not in all portions of gingival marginal or papillary
2Mild inflammationSlight changes in color and texture in all portions of gingival marginal or papillary
3ModerateBright surface inflammation, erythema, edema, and/or hypertrophy of gingival marginal or papillary
4Severe inflammationErythema, edema, and/or marginal gingival hypertrophy of the unit or spontaneous bleeding, papillary, congestion, or ulceration
Table 2. Average AUC (Area Under the Curve) results of the best performing classifier, in the first stage of the cascade, best classifier per tooth-position selected during the training step in 5-fold cross-validation.
Tooth NumberClassifierAUC Score
12XGBoost0.99
11XGBoost0.92
21MLP0.76
22XGBoost0.85
42XGBoost0.98
41XGBoost0.88
31GBM0.72
32XGBoost0.95
Table 3. First stage of cascade; test-set performance: for each tooth position, the AUC score for the classifier-features combination selected is reported.
Tooth NumberAUC Score
121.0
110.83
210.69
220.8
421.0
410.84
310.78
320.94
Table 4. Average AUC results of the best performing classifier, in the second stage of the cascade, best classifier per tooth-position selected during the training step in 5-fold cross-validation.
Tooth NumberClassifierAUC Score
12GBM0.92
11XGBoost0.93
21MLP0.95
22XGBoost0.87
42XRT0.98
41XGBoost0.88
31MLP0.72
32MLP0.97
Table 5. Second stage of cascade; test-set performance: for each tooth position, the AUC score for the classifier-features combination selected is reported.
Tooth NumberAUC Score
120.87
110.86
210.94
220.91
420.84
411.0
311.0
321.0
Publisher’s Note: MDPI stays neutral with regard to jurisdictional claims in published maps and institutional affiliations.