Article

Safe Three-Dimensional Assembly Line Design for Robots Based on Combined Multiobjective Approach

1
The Faculty of Computer and Control, The University of Chinese Academy of Sciences, Beijing 100049, China
2
The Shenyang Institute of Computing Technology, Chinese Academy of Sciences, Shenyang 110168, China
3
The Institute of Automation and Information Systems, Technical University of Munich, 85748 Munich, Germany
*
Author to whom correspondence should be addressed.
Appl. Sci. 2020, 10(24), 8844; https://doi.org/10.3390/app10248844
Submission received: 13 November 2020 / Revised: 4 December 2020 / Accepted: 7 December 2020 / Published: 10 December 2020
(This article belongs to the Special Issue Industry 4.0 Based Smart Manufacturing Systems)

Abstract

:

Featured Application

A three-dimensional (3D) optimization approach to safe layout design for assembly lines with robots is proposed. The approach is applied to the layout design of an assembly line for robots and other devices. The layout design of assembly lines is the first priority issue that needs to be addressed at the early stage, because it influences not only the effectiveness of the project phase, but also the subsequent productivity, including space utilization and safety of the work environment. In addition, during the layout process, a safety indicator should also be employed as a critical indicator of the layout plan evaluation. A safe and effective facility layout design is key in improving the performance of manufacturing, which can ensure overall productivity and improve manufacturing efficiency.

Abstract

In advanced industrial automation, industrial robots have been widely utilized on assembly lines in order to reduce labor dependence. However, many related layout design approaches proposed are prone to generating unsafe layouts: there generally lacks a consideration regarding robots’ heights and assembly range, which will lead to costly collisions in the operation stage. In order to address the problem, we propose a three-dimensional (3D) optimization approach to a safe layout design for an assembly line with robots. We define modeling rules for robots to judge assembly ranges. A quantitative safety indicator is employed as a trigger for 3D collision detection in order to determine the positional relationship and status of the safe assembly collaboration. The optimization goals are established for minimizing the logistical cost and layout area in the model. A combined algorithm of differential evolution and nondominated sequencing genetic II is applied, which effectively enhances the poor diversity and convergence of the mainstream optimization method when solving this model. The benchmark tests and validation proved that our approach yields excellent convergence and distribution performance. The case study verifies that the safe layout model is valid and our approach can generate a safe layout in order to optimize economics and safety.

1. Introduction

In the context of “Industry 4.0” [1], the market demand is constantly changing. There is a trend that the customer needs personalized customization [2,3]. Therefore, traditional assembly lines, such as those at the Highland Park Ford Plant, need to be frequently replaced in order to meet new production demands [4]. The layout design of assembly lines is the first priority issue that needs to be addressed at the early stage of designing production systems [5], because it influences not only the effectiveness of the project phase, but also the subsequent productivity, including material flows, space utilization, energy consumption, and the safety of the work environment. In addition, during the layout process, a safety indicator should also be employed as a critical indicator of the layout plan evaluation. A safe and effective facility layout design is the key to improving the performance of manufacturing systems [6], which can ensure overall productivity and improve manufacturing efficiency [7].
Because of the complexity and practicality of the facility layout problems (FLP) [8], multiobjective optimization become a popular research topic. Lee [9], Chen [10], and Kia [11] noted that GAs are popular for facility layout design. Hernández Gress [12], Lenin [13], and Vitayasak [14] used Gas in order to effectively solve FLP. Dapa [15] verified that a GA can significantly outperform the bat algorithm and it improved the frog jumping algorithm in the multiline layout problem. The nondominated sorting genetic algorithm II (NSGA-II) [8] is an improved GA with excellent convergence and global search abilities. Emami [16] and Zhang [17] employed a variety of methods for comparison, and experiments verified that NSGA-II is useful. Zhang [17] verified that NSGA-II is superior to other improved methods of GAs. The research results verified that NSGA-II is suitable for facility layout design. However, the NSGA-II method has the limitation of poor convergence for complex problems and it is not suitable for the solution of multi-constraint and multi-variable layout design for specific application scenarios. Presently, it has been found that combining many multi-objective optimization methods can effectively improve the diversity performance of the layout and convergence effect of an algorithm. Tayal [18], Papakostas [19], Jolai [20], Guan [21], and Zeng [22] proposed a workshop model and an improved algorithm that is based on NSGA-II in order to achieve an excellent optimized layout for a multiobjective workshop facility.
In advanced industrial automation, industrial robots have been widely utilized on assembly lines in order to reduce labor dependence. Robots can perform assembly tasks, such as lifting and carrying heavy objects, in human-machine collaboration [23], which improve the working efficiency of the assembly line and create an intelligent assembly line. Replacing traditional industrial robots with intelligent ones increases the equipment costs, placing these robots arbitrarily and programing them in order to meet task requirements increases the labor costs. Hence, a safe three-dimensional (3D) overall layout for assembly lines between robots and other devices is one of the most critical issues in manufacturing. Leiber [24] presented a knowledge-based automated planning method for a multistation assembly line. This approach mainly included the scheduling of assembly lines, the selection of resources, and the determination of positions in a feasible layout from a theoretical perspective. This method is not applicable in scenarios with robotic assembly lines. Lim [25] employed five nature-inspired algorithms in order to optimize the layouts of robot work cells, but did not consider the logistical cost and relevant processes. The author took robots workcell layouts as a representative, with only the layout design between robots being considered; therefore, it is not suitable for assembly lines’ layout design. Michalos [26] approached assembly line balance and resource planning problems with a mixed approach that optimized the layout of the block of work cells. However, assembly lines inside work cells have not been designed for layout.
Customized indicators have been broadly researched in practical applications for improved algorithm performance. The researchers have considered robust indicators that are related to the layout design [9,27,28]. Safety indicators are essential for the design of facility layouts [29]. Moatari-Kazerouni [30] focused on the occupational health and safety indicators of operators. Neghabi [31] established a mathematical optimization model in order to consider compactness as an economic measure and distance as a safety indicator for achieving a safe area-matching layout that considers adjacency relationships. Notably, safety indicators can vary in different application scenarios with different research objects. Currently, few researches on safety layouts of assembly lines with robots have been done, which not only satisfy the safety of robot’s collaborative assembly, but also consider the security of the overall layout design of robots and other devices in assembly lines.
The above-mentioned researches have not taken into account the safety layout of the application scenarios of the assembly line with robots, a complete layout optimization of workstations, machines, robots, and 3D layout design that highlights safety is missing. In advanced industrial automation, industrial robots must be incorporated into layout models of assembly lines. A review of the literature suggests that many studies have focused on the layout design of assembly lines. Table 1 summarizes the state-of-the-art methods for solving FLPs with assembly lines and then compares layout optimization objects, constraints, and scopes of application. The results indicate that safety has rarely been considered in assembly lines with robots. Moreover, the 3D height information of layout equipment has not been investigated so far. Therefore, this paper proposes a safety layout optimization approach, named SE-NSGA2, which considers safe 3D layout design for assembly lines with robots. This approach considers the height of equipment and determines the safety of different assembly process routes. A quantitative safety indicator is used in order to ensure a safety layout plan for the output assembly line. Subsequently, the multi-objective combination method is based on the high-quality performance of NSGA-II and it integrates the DE algorithm in order to reduce repetitive planning and effectively increase the diversity of solutions. Our experimental and statistical results of optimal layout plan for assembly lines increase by 14.5%, and our approach can generate a safety layout in order to optimize economics and safety. When compared with the original NSGA-II method, the safe layouts increase by 20.63%.
This paper is structured, as follows: Section 2 establishes a safety layout model for assembly lines with robots and irregular shaped equipment, describes the assembly line layout problem, and defines the modeling rules of irregularly shaped equipment. Section 3 proposes the combined approach. Section 4 tests the performance of the proposed approach and uses a case study for the evaluation. Section 5 presents conclusions and future work.

2. Modeling of Assembly Line Layouts Based on the Safety Indicator

Many researchers have proposed layout design models [33], and a large number of researchers have proposed equal-area and unequal-area layout models, and a linear layout of sewing assembly line equipment of equal area [17], which lacks consideration of the layout of robot equipment in the assembly line. There are also some researchers who focus on the layout optimization of the robot cell [25], but the model only uses the oblique grid for the sequence pair method for the special scene of the robot cell, and is not suitable for the assembly line layout. We propose that the safety assembly model (SLM) is different from the model that has been proposed from the modeling object to the optimization goal. Moreover, a single optimization goal cannot meet the complex assembly line layout, and the two important indicators of the smallest logistics cost and the smallest floor space are considered to be multiple objectives for optimization, and the assembly line safety layout optimization model is established. The modeling object is an assembly line with industrial robots. The entire assembly line consists of three main components: workstations, traditional industrial robots, and industrial robots, which can replace or assist in assembling heavyweight parts. However, robots have large working range, many degrees of freedom, and the dangerous situation of arbitrary movement direction during work, which brings challenges in establishing safe assembly lines. We build an industrial robot simulation model while using the Monte Carlo method in order to simulate the actual physical process in a workspace. A quantitative safety indicator is added to the model for assembly line scenarios with robots in order to judge the collaboration assembly status and the position of robot arms. In safety layout design, hardware devices for safety protection, such as warning lights, electronic sirens, and safety sensors, are not considered. Instead, the location data of components in assembly lines are optimized in the early planning process, and the desired output is an optimal safe layout that ensures the safety of robots in operation.

2.1. Problem Description

This paper investigates the overall initial layout of an assembly line. The modeling process does not consider the dynamic assembly information, such as scheduling and obstacle avoidance among robots. The entire assembly line has three products at period t. The assumptions of the layout design are described, as follows: the available area is rectangular, and the irregular equipment parts that are connected to the ground are approximately rectangular. The center points of the equipment are on the same horizontal line in the same row. Figure 1 shows a schematic of the assembly line layout. The figure shows the devices and the relationships among various parameters that are involved in the mathematical model. Specifically, A, L, and W refer to the dimensions of the area, length and width, respectively. Li is the length of equipment i in the x direction. Wi is the width of equipment i in the y direction. Ml is machine l that is shown in the lower left corner of the layout, with the smallest abscissa xl and the smallest ordinate yl. The coordinates (xi, yi) denote the center point of the Mi coordinates. The coordinates (xj, yj) denote the same coordinates of Mj. δij is the net distance between Mi and Mj. Ld is the distance difference in the layout between the maximum abscissa xr and minimum abscissa xl. Wd is the distance difference between the ordinate of the maximum yr in the y direction and the ordinate of the minimum yl in the y direction. A is the width of the aisle between two equipment. A0 is the width between the first row and the edge space, and m represents the number of rows.

2.2. Modeling of Safe Layout

A safe layout model is essential in obtaining a safe layout plan. First, we establish modeling rules for the equipment in the layout of the assembly line and then use the minimum logistical cost and smallest actual floor space as the optimization goals. The general constraint conditions ensure that the equipment does not overlap and provide a foundation for layout safety. The safety indicator (γ) constraint further ensures the safety of equipment in the 3D layout. The safe layout model is output. A multiobjective optimization approach gives the best layout plan, and Section 3 provides a detailed description of this method.

2.2.1. Modeling Rules for Irregularly Shaped Equipment

The irregularly shaped equipment types on an assembly line include industrial robots and specially shaped machines and tools. The reasonable modeling of irregular 3D target objects is the basis of the quantitative safety indicator. Irregular devices, such as industrial robots, are widely employed in assembly lines. In the initial layout of an assembly line, in actual engineering, the maximum bounding box of a robot is utilized for multiobjective optimization, and the layout plan is output. If the distance between robots is too large, then it will be impossible to coordinate assembly, and adjustments will undoubtedly increase the design cost and time. These issues can result in a waste of layout space and affect the progress of assembly tasks. Assume that a robot base is employed for multiobjective optimization and a layout plan is output. If the center point of the base is too close to another base, then the possibility of an unsafe collision will be high, and the small collaborative assembly area may be problematic. From the algorithm implementation perspective, the inconsistency among entity input shapes can be difficult to consider in encoding and decoding tasks. Therefore, all of the optimized objects in this paper are quadrilaterals. In order to illustrate the modeling rules of robots, we use a KUKA KR210 R2700 robot as an example in this case study. We build an industrial robot simulation model while using the Monte Carlo method to simulate the actual physical process in a workspace, as shown in Figure 2. Based on the Denavit–Hartenberg (DH) parameter table, as shown in Table 2, the cloud point model of the robot workspace is constructed.
Figure 3a shows the 3D point cloud diagram of the assembly range of two robots. The point cloud overlap area is the collaborative assembly area of two robots. The initial position of the robot layout affects the size of the collaborative assembly area. Figure 3b–d show the ground projection, which has an extensive range of motion. When two horizontally adjacent robots are cooperatively assembled, the maximum range of the first robot’s assembly area passes through the center of that of the second robot, as shown in Figure 3b. At this time, the cooperative assembly ranges of the two robots reach maximums, and the skill of each robot is maximized. Figure 3c shows a case in which two robots are too close in the layout, and the active assembly area is small. Figure 3d shows a case in which the layout of two robots is too large, and the effective assembly area is small. The larger the overlap of the assembly areas, the higher the level of dexterity, and vice versa. Therefore, the length of the robot is Lr = A’B’ = C’D’ = E’F’ = G’H’ = Ri. In modeling, the vertical y-direction line spacing must meet the safe layout requirements, so the quadrilateral width of an optimized entity is Wr = E’H’ = F’G’ = 2R0. R0 is the base radius of a robot. Ri is the maximum movement radius in the actual assembly of the robot. The optimized entity of the robot is the quadrilateral E’F’G’H’, as shown in Figure 1.
The irregular parts of the special-shaped machine tools Mp and Mq that are shown in Figure 1 represent the special-shaped contact areas between the irregularly shaped equipment and the ground. The irregular shadow areas are treated as the effective areas, and a circle is drawn with the device center at the circle center. Half the longest diagonal ri is the radius, and the circumscribed rectangle of the circle is taken as the bounding box, which is the irregular optimized model for each piece of equipment.

2.2.2. Constraints

Common constraints: ① two related devices cannot be arranged in branches. ② There is no overlap between two devices. ③ For the spatial boundary constraints, the sum of the area of each machine, sum of the minimum safety distance, and width of each passage should be less than the total area. The layout should reasonably meet the relevant requirements and not exceed the length or width of the workshop area.
Customized constraints: set the constraint distance between the robot and other equipment to Sir. ① The constraint condition Srr between a robot and another robot is a requirement for cooperative assembly between the two robots. This constraint is necessary for ensuring that the coordinated assembly area Srr of the two robots, which is larger than the workpiece, has the size WS. The mathematical expression of the width of the cooperative assembly area is Srr = WS × βrr. Because collaborative assembly requires high dexterity for robots, the value of βrr is larger than βmr. ② The constraint condition Smr is established between a robot and a machine or workstation, because the robot must grab a workpiece from the machine or workstation. The corresponding mathematical expression is Smr = WS × βmr, and the value of βmr is small as long as the workpiece is successfully grabbed. βij is the safety factor, which is a constant, and the empirical range is (1, 1.5). The assembly work is complicated when the β value is large. The dexterity of cooperation between two robots is high in this case, but, when β is small, the assembly work is comparatively simple, and the cooperation level may be low.

2.2.3. Safety Indicator

Definition 1.
The safety indicator γ focuses on collision detection by the threshold condition to evaluate the robot assembly status. The physical hardware safety and robot control security planning are not considered. When the safety indicator reaches the threshold condition, the collision detection is performed via point cloud calculations. The quantitative expression of the safety indicator is given in (1), and the parameter is shown in Figure 1. When γ < 0, the robot does not perform cooperative assembly and only needs to perform rough collision detection. When γ ≥ 0, the robots are assembled collaboratively, or the robots select workpieces from a machine, and detailed collision detection needs to be performed. The safety level is a product of the safety factor and the device spacing. A safety factor (FS) that reflects the shape of optimized layout entities is established. The quantitative expression is given in (2). A high value of the safety factor allows the use of irregular entity shapes, and a high level of collision detection is required to obtain high accuracy. Ri is the maximum working radius.
γ = ( ( R i + R j ) / 2 S i r δ i   ×   i = 0 i = 2 F S i
F S i = O p t i m i z e d   m o d e l   a r e a a c t u a l   a r e a   1
{ i f   γ 0 ,       detailed   collision   detection   i f   γ <   0 ,       rought   collision   detection  

2.2.4. Objective Functions

A multiobjective layout model is established with the optimization goals of minimizing the logistical cost LC and the actual floor space α. In multiobjective optimization, the optimization effect is best when the minimum values are simultaneously considered. Equations (3) and (4) show the logistics cost and layout area. Mi is the number of pieces of equipment. n is a large amount of the equipment. In the planning period t from Mi to Mj, Cij is the unit material handling cost per unit distance, Dij is the distance, and Pij is the demand amount.
Min L C = min t = 1 t i = 1 n j = 1 n ( C ij P ij D ij )
D ij = | x i x j | + | y i y j |
Min α = i = 0 n L d × W d
L d = ( L r + L l ) / 2 + ( x r x l )
W d = ( W r + W l ) / 2 + ( y r y l )

3. A Combined Multiobjective Approach for Safety Layout: SE-NSGA2

Definition 2.
The approach SE-NSGA2 is design based on the framework of the NSGA-II to integrate the DE strategy, it is a combined safety layout approach. First, the NSGA-II method is applied to optimize the sequence of assembly equipment, and then the DE strategy is employed to optimize the equipment spacing. Second, based on the output equipment spacing, the safety indicator constraint is utilized as a judgment condition, and 3D collision detection is performed to verify the feasibility of the layout design. Last, the output is a safe layout plan. In this section, we detail a description of NSGA-II and DE and describe the SE-NSGA2 approach.

3.1. Principle of NSGA-II

NSGA-II, which was proposed by Deb, is one of the current mainstream multiobjective optimization methods and a classic method for production scheduling. This method is an improvement to the NSGA. Notably, the original shared function is replaced by calculating the crowding distance, which significantly reduces the time complexity of the algorithm. The procedure of the NSGA-II is shown, as follows:
Step 1:
Randomly initialize the parent population Pt at t = 0. The nondominated sorting is performed for the parent population in order to initialize the nondominated relationship for each individual and specify the virtual fitness values.
Step 2:
Use the binary tournament method in order to select individuals, perform crossover and mutation operations, and generate a new generation of population Qt.
Step 3:
Combine Pt and Qt to generate the combined population Rt = PtQt.
Step 4:
Perform nondominated sorting for Rt, calculate the crowding degree of the nondominated set, and use the elite retention strategy in order to select the first N individuals to form the new generation population Pt+1.
Step 5:
Jump from step 2 to step 4, loop until the maximum number of iterations is reached, and output the optimized solution set that meets the relevant conditions.

3.2. Principle of DE Strategy

Storn [34] proposed the DE algorithm, which is the fastest evolutionary algorithm that is currently available. The DE algorithm has a simple structure and it provides rapid convergence. The disadvantage is that this algorithm easily falls to local optima during convergence. The main principle of the DE algorithm is to randomly select three individuals δp1, δp2, and δp3 from the population M. The difference vector between the two individuals δp2 and δp3 is applied as the source of random change for δp1. The difference vector is weighted, and a summation rule is employed for the third individual in order to obtain mutant individuals. The expression of the mutation operation (5) is
v i j ( t + 1 ) = δ p 1 j ( t ) + F ( δ p 2 j ( t ) δ p 3 j ( t ) )
The mutant individual and the individual target δij (t) are involved in parameter mixing in order to generate the test individual uij (t + 1), as expressed in (6).
u i j ( t + 1 ) = { v i j ( t + 1 ) r a n d 1 i j C R   o r   j = r a n d ( i ) x i j ( t ) r a n d 1 i j C R   o r   j = r a n d ( i )  
The resulting fitness values are compared. If the fitness value of the test individual is better than the fitness value of the target individual, then the test individual replaces the target individual in the next generation. Otherwise, the target individual is saved. The algorithm performs iterative calculations, retains the excellent individuals, eliminates the weak individuals, and guides the search process in order to approximate the optimal global solution. The F scaling factor is the core parameter of the algorithm; it controls the optimization ability of the algorithm. If the value of F is small, then the algorithm will tend to local searches. Conversely, a large F could cause the algorithm to avoid local optima, but the convergence speed will be slow. CR is a cross-mutation operator. A large CR indicates a high cross-mutation probability. M is the population size and, if it is less than 4, then the mutation cannot be performed. Rand1ij ∈ [0, 1], F ∈ [0, 1], CR ∈ [0, 1], and M ∈ [4, ∞). The procedure of the DE is shown, as follows:
Step 1:
Randomly initialize the parent population Pt, and calculate the fitness value of each individual.
Step 2:
Mutation and crossover to obtain the intermediate population Qt.
Step 3:
Combine Pt and Qt to generate the combined population Rt = PtQt.
Step 4:
Select a new generation of the population.
Step 5:
Repeat steps 2 to 4 until the conditions or the maximum number of iterations is reached, and output the optimized solution set that meets the relevant conditions.

3.3. Principle of SE-NSGA2

The core principle of SE-NSGA2 is to produce a preliminary solution set and validate the solution set. First, a DE strategy was introduced in order to cross-mutate the spaces between two devices to generate the next-generation population and complete the population consolidation process that is based on NSGA-II. The DE strategy has a large number of genetic parents, which effectively improves the global search ability of the traditional algorithm and avoids local optima. The combined approach can effectively reduce the number of repeated individuals in the Pareto set and enhance the performance of NSGA-II that is based on the corresponding convergence level and distribution. The safety indicator is determined based on the initial optimized output solution set, and the unsafe layout solutions are determined by collision detection to ensure that the optimal solution set that is output is a safe layout solution. Figure 4 shows the procedure of the proposed SE-NSGA2. The procedure of the SE-NSGA2 is shown, as follows:
Step 1:
Randomly initialize the parent population Pt at t = 0. Nondominated sorting is performed for the parent population in order to initialize the nondominated relationship for each individual and specify the virtual fitness values.
Step 2:
Use the binary tournament method to select individuals, perform crossover and mutation operations, and generate a new generation of population Qt.
Step 3:
The placement sequence of the equipment is genetically obtained by partially mapped crossover (PMX), and the spacing sequence for equipment is genetically obtained by the DE operator in order to generate a new generation of population Qt’.
Step 4:
Combine Pt and Qt to generate the combined population Rt = PtQtQt’.
Step 5:
Perform nondominated sorting for Rt, calculate the crowding degree of the nondominated set, and use the elite retention strategy for selecting the first N individuals to form the new generation population Pt+1.
Step 6:
Jump to step 2 through step 5, loop until the maximum number of iterations is reached, and then output the optimized solution set that meets the relevant conditions.
Step 7:
Verify the safe layout thresholds, discard unsafe extreme solutions, and obtain the Pareto set.

3.3.1. Chromosome Encoding and Decoding

The equipment layout problem for an assembly line is transformed into a multiobjective optimization problem. The classic method of scheduling is applied to layout design by redefining the chromosome sequence. For the optimization of continuous parameters in layout design, the layout optimization problem and goals are redefined, and the chromosome sequence is set as [{M1, …, Mi, …, Mm, …, Mj...., Mn}, {δ1, …, δi, …, δm, …, δj, …, δn−1}]. The set of Mi is the placement sequence of equipment and the set of δij is the spacing sequence for equipment. Automatic line wrapping is used in order to ensure that the layout fits within the width W of the layout area, which is, (A0 + A (m−1) + W) ⁄ 2> 0. At this time, f(P) = T, and T is constant. The objective function of the logistical cost F involves obtaining the minimum value. The objective function of area utilization α is to obtain the maximum value; therefore, the value of the minimum target fitness minus T and the maximum value of the target fitness plus T can eliminate unqualified chromosomes and retain high-quality chromosomes. The solution formula for the equipment center point coordinates in the x-direction is given in (7), and that in the y-direction is given in (8).
x j = x i +   ( L i + L j ) / 2 + δ i j
y j = y i ( m 1 ) × A + A 0

3.3.2. Crossover and Mutation

The arrangement of the equipment is optimized by partially mapping a two-point crossover process. The DE strategy is utilized for the crossover and mutation of the equipment spacing δij. The DE strategy accelerates the convergence speed of the algorithm and ensures diversity. Three core parameters mainly determine the optimization capability and search efficiency of the DE strategy: the scaling factor F, cross-mutation operator CR, and population size M. The corresponding range is [0.1, 1.8]. Boundary judgment is performed in order to avoid crossing the boundaries. If operators are out of bounds, then they are discarded, and new operators are generated.

3.3.3. Verification

Verification is a critical step in our approach. Unsafe layout plans are discarded in this step. The γ safety indicator reflects the assembly statuses of the robots. Accurate collision detection is needed when two robots are involved in cooperative assembly. Collision detection is based on a database that stores factory configuration data and historical data for assembly processes. The effectiveness of the initial layout plan can be verified for actual production. Unsafe extreme solutions are discarded in order to ensure that the new best Pareto solution set is the solution that meets the constraints of the safety index. The best layout design method is determined according to the target weights or user preferences. The safety indicators that are to be considered in the design of human-machine collaborative work scenes are visual monitoring, robot force, impedance control, safety zone setting, and collision detection [35]. We focus on collision detection by the threshold condition.
In safety layout modeling, the layout of equipment is based on a global coordinate system; additionally, rough collision detection uses the AABB method, coordinated assembly occurs for irregular equipment, and other intricate tasks are performed. AABB collision detection cannot meet the accuracy requirements of many layouts that require precise detection. When robots are involved in cooperative assembly or grasp complex curved objects, a grid collision detection method can be employed. When a robotic arm is grasping concave objects, an implicit function collision detection method for complex curved surfaces is used. A safety indicator can be used in order to effectively ensure the safety of the layout plan for the Pareto solution set.
Rough collision detection: axis-aligned bounding box collision detection [36] is a method that has the advantages of applying a constant direction and providing a fast detection speed. The construction of bounding boxes for nonrotating objects parallel to the coordinate axis is fast, and the detection results are quickly updated. This approach is ideal for collision detection for regular devices on assembly lines.
Detailed collision detection: mesh collision detection methods and implicit function collision detection methods are available for complex surfaces [37]. For complex concave surfaces, the voxel feature points of an object to be detected are optimized, which can prevent the voxel point leakage phenomenon. The implicit function surface at time t is given in (9). Tt(t) represents the transformation matrix, for which the voxels that are obtained by surface detection are translated from the initial time to time t. Tx(t) represents the transformation matrix, for which the voxels that are obtained by surface detection are rotated from the initial time to time t. Ms(S) represents the collection of voxels for the tool surface. According to the Gaussian theorem, the polynomial equation of an order complex coefficient only has n roots. Therefore, the number of roots can reflect the number of collisions. If no root is obtained, then no collision occurs.
F ( x , y , z , t ) = U t = 0 t T t ( t ) T x ( t ) M s ( S ) t 2

4. Experimental Results and Analysis

Two experiments are designed in order to test the performance of the SE-NSGA2. In the first experiment, the benchmark test function verifies that the proposed approach SE-NSGA2 has excellent convergence and distribution performance. In the second experiment, the case study verifies that the safety layout model is valid, and the SE-NSGA2 can generate a safe and useful layout where economics and safety reach the best equilibrium. Our experimental and statistical results of optimal layout plan for assembly lines increase by 14.5%, and the safety performance of assembly line layout increased by 20.63%.

4.1. Performance Comparison with Approach

The population size is 100, the maximum number of iterations is 10,000, the crossover probability is 0.8, and the mutation probability is 0.1. Two objective functions and six decision variables are established. When the DE strategy parameters are F = 0.5 and CR = 0.3, the global search algorithm yields the best convergence speed and search ability.
The benchmark functions ZDT1 and DTLZ1 are applied to evaluate the performance of NSGA-II [8], MOCell [38]. and SE-NSGA2 in order to verify the performance of SE-NSGA2. NSGA-II and MOCell are two mainstream multi-objective optimization methods, which have a good performance of the convergence effect. The NSGA-II [8] is that GAs evolutionary algorithm has a strong global optimization capability. The proposed approach SE-NSGA2 is an improved approach of NSGA-II method. The MOCell algorithm [38] has received wide attention due to its diversity performance. Therefore, the benchmark functions ZDT1 and DTLZ1 are applied in order to evaluate the performance of NSGA-II [8], MOCell [38], and SE-NSGA2.
The inverted generational distance (IGD) is an evaluation index that reflects the overall performance of the algorithm. The smaller the value, the better the overall convergence and distribution performance. The IGD expression (10) is
IGD ( P , Q ) = v P d ( v , Q ) / | P |
P is the set of the Pareto front uniformly distributed, |P| is the number of the solution set, Q is the optimal solution set in the Pareto front, and d(v, Q) is the smallest Euclidean distance from v to Q in the Pareto front. The smaller the value of d(v, Q) is, the better the convergence of the algorithm is. If this value is large, the distribution is scattered. The MOCell, NSGA-II, and SE-NSGA2 algorithms were compared based on the test function. Table 3 presents the statistical quantitative results of the IGD values for 30 independent runs. The smaller the value, the better the performance of the corresponding method. The data in Table 3 directly indicate that SE-NSGA2 performs better than the other methods, and the distribution and convergence of the solution set are better.
Three objective functions are established in order to observe and verify the algorithm performance based on convergence and diversity. Figure 5 shows a 3D visualization of the Pareto front sets. The statistical results of the Pareto front are compared. The figure shows that the distribution and convergence of MOCell are worse than those of NSGA-II and SE-NSGA2. The Pareto sets of NSGA-II and SE-NSGA2 have dense points in the plot and, as indicated in Table 3, the IGD value of SE-NSGA2 is smaller than the value of NSGA-II, which is, SE-NSGA2 yields convergence and distribution results. Moreover, when compared with the original algorithm, the proposed method increases the diversity and produces better distribution and convergence results with fewer overlapping solutions.

4.2. Case Study of Safe Layout

An automotive assembly line is selected as an example, in which the diversity of safety layout, safety, and economic benefits has been verified. The assembly line has ten pieces of equipment, including three robots. Table 4 shows the equipment information. In the planning period t from Mi to Mj, Dij is the distance. Table 5 presents the material transportation cost per unit distance Cij during period t. Table 6 lists the demand for the assembly parts Pij. The available layout area length is L = 22 m, the width is W = 12, and the line spacing is A = 1 m. The distance from the first line to the available edge is A0 = 1.5 m. The net distance between two facilities is δij ∈ [0.1, 1.8]. The actual maximum motion range of the robotic arm is 5.2 m, which is shy of the rated maximum motion range of 5.4 m, as shown by the assembly range of the cloud points in Figure 3. The assembly line includes the KUKA KR210 R2700 robots M4, M5, and M6, with a maximum working radius of 2.7 m and a robot base radius of 0.33 m. The experimental environment is Windows 10 system, Python 3.7.1, and Anaconda3.
Table 7 shows the process routes of the three assembly parts. The process quality, throughput, success rate, and downtime are assumed to be ideal. The process elements include machines and workstations. There is no robot for the P1 process element. For P2, M5, and M6 robots take the workpiece from the machine for cooperative assembly. In the process for P3, the M5 and M6 robots take the workpiece from the machine and perform the assembly.
Many researchers have verified that heuristic algorithms and heuristic algorithms are effective in solving the layout design problem. The proposed approach was compared with two mainstream multiobjective optimization methods. NSGA-II [8], MOCell [38], and SE-NSGA2 are used in order to solve the safety layout design of the assembly line. Optimization object is the same assembly line, and the compared environment is fair.
The diversity of a safe assembly line layout is verified. Comparative experiments prove that the safe layout model and SE-NSGA2 approach can effectively increase the number of optimal layout plans. Table 8 shows the statistical results of the experiment over 30 independent runs. The data in the table indicate that the SE-NSGA2 approach is superior to other methods based on the number of optimal plans and diversity of plans. The comparison experiment uses the general layout model (GLM) [17] and the safety layout model (SLM). When optimizing an assembly line layout with robots, if only the maximum working range of each robot is considered, then collaborative assembly cannot be achieved. Therefore, the comparison experiment selects the robot base as the optimized entity in order to ensure the operation requirements of collaborative assembly. In the general layout model, the Pareto optimal plans of three algorithms have little difference in percentage, but the Pareto solutions of SE-NSGA2 are not superior to others of diversity. The results are related to the determination of safety indicators in the proposed approach. The general layout model does not consider the assembly collaboration of robots and the safe assembly of robots with other devices. In the safe layout model, the SE-NSGA2 Pareto solution set has the most diverse plans, and the percentage of SE-NSGA2 optimal plans is superior to that of NSGA-II is 14.5%.
The safety performance of a safe assembly line layout is verified. The 3D scene is connected to the database in a data-driven manner in order to verify the feasibility and rationality of safe layouts and verify the effectiveness of safe layout plans. Irregularly shaped equipment modeling rules consider the 3D height information, which can reduce the risk of collision and increase the layout safety. The generated Pareto front set corresponds to the layout plan. There will be many unsafe layout solutions in the Pareto front if a multiobjective optimization method with irregularly shaped equipment is not employed. The P1, P2, and P3 products correspond to the determined process flows. Among them, the P1 Pareto front is a safe layout plan, and no collision occurs during assembly verification. The process flows that correspond to P2 and P3 include potential collisions during the assembly process. We focus on the interactions between two robots and between machines and robots in order to assess these collisions.
Because the coordinates of the center point of the collision area are constantly changing, the collision point is continuously covered, which is not easy for readers to observe. Therefore, we undertake statistical experiments to draw the projected area of the ground, as shown in Figure 6, and the number of collisions in the unsafe layout, as shown in Figure 7. Based on 30 independent operations, the ground projection areas where collisions occur in the Pareto front are shown in Figure 6. If multiple collisions occur in each layout plan during the verification stage, then only the largest area of one collision will be counted. The solution statistics for the SE-NSGA2 approach are employed in order to obtain the initial solution set before γ safety indicator screening. Based on the results, the SE-NSGA2 approach has the smallest collision area, which is, the possibility of collision is the smallest used the SE-NSGA2. The unsafe layout of P2 products mainly occurs between robots and other devices, and the possibility of collision in MOCell method is 80.2% higher than that in SE-NSGA2, as shown in Table 7. The unsafe layout of the P3 product mainly occurs between two robots. The collision probability of the NSGA2 method is 79.7% higher than that of the SE-NSGA2, and the collision probability of the MOCell method is 77.9% higher than that of the SE-NSGA2. P3 products are more likely to produce unsafe layouts than P2 products. In other words, the collaborative assembly of robots in the assembly of complex products will increase the possibility of unsafe layouts. The safety indicator that is proposed in this paper can filter out unsafe layouts, after γ safety indicator screening, all of the plans in the Pareto front are safe layouts by 3D validation.
After 30 independent operations, Figure 7 shows the comparison of the number of collisions in the Pareto front solution set obtained by mathematical statistics. Among them, SE-NSGA2 has the least number of collisions. The demand for P2 products and P3 product parts each account for 50%, as shown in Table 6. In the NSGAII method, the average number of collisions in the p2 stage is 5.18, and the average number of collisions in the p3 stage. The number of times is 7.20. The possibility of collision on the assembly line is 20.63%. The safety indicator that is proposed in this paper can filter out unsafe layouts and produce safe layouts. Overall, the safety of the assembly line layout is increased by 20.63%. SE-NSGA2 has significant advantages in the multiobjective optimization of assembly line safety. The layout improvement index is I, i is the number of collisions, and μ is the number of statistical experiment. The expression is (11).
I = i = 1 N i / μ
Safe layouts are a prerequisite to guaranteeing optimize economics. These safe layouts can ensure the safety of the assembly work. It is not necessary to adjust the robot positions after continuous testing during assembly work to find the best posture for each robot in the assembly line and achieve a safe layout. In the experiment, if a collision occurs, the penalty cost is increased 10. 
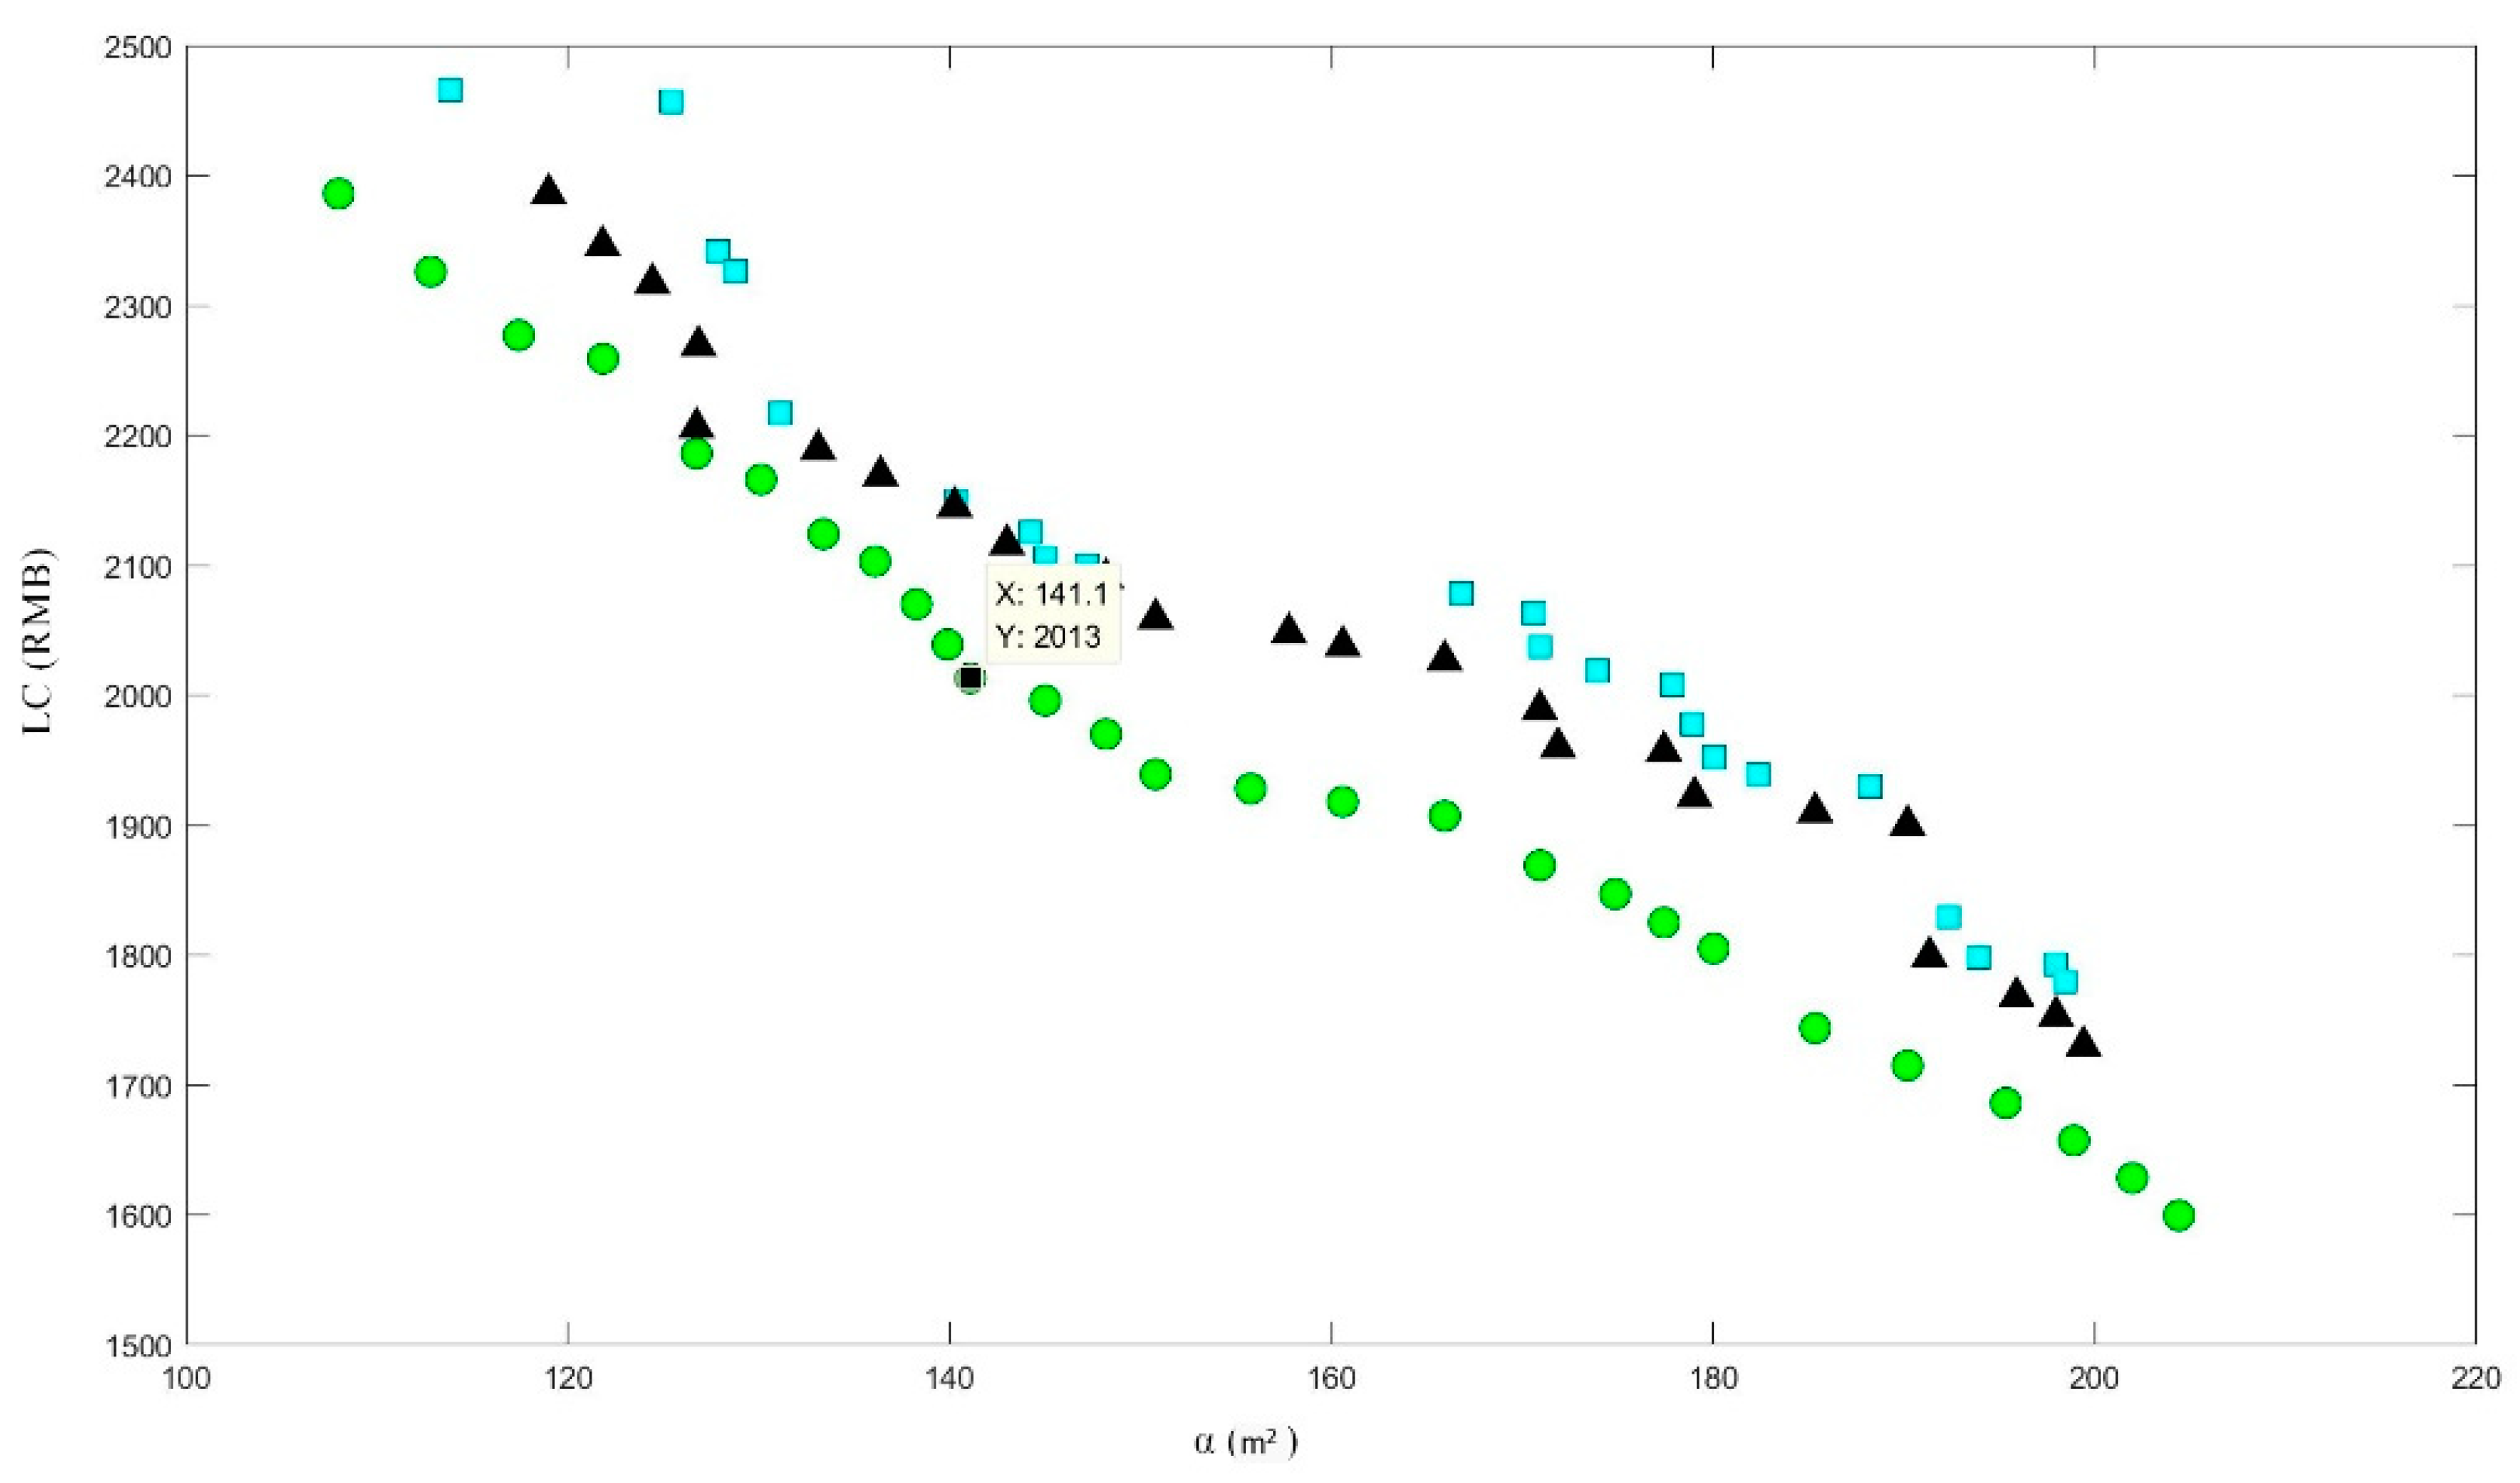
Figure 8 shows the schematic diagram of Pareto set is shown in. It can be seen from Figure 8 that the distribution and diversity performance of SE-NSGA2 is better than the layout plan set of the MOCell and NSGA-II methods. Moreover, the convergence effect of SE-NSGA2 is better than other methods. The two optimization goals of floor space and logistics cost are inversely proportional. P and Q are partial plans that are selected from the Pareto optimal front solution set for this approach. Table 9 presents safety layout information.
Because assembly line layout is a complex problem, it is difficult to obtain one optimal solution in the Pareto solution set, as shown in Figure 6 and Table 9. It is necessary to determine the final layout design plan for an assembly line according to the target weights or user preferences. This layout scheme can reflect the characteristics of the Pareto solution set. When the material cost is low, the area that is occupied is generally high.
SE-NSGA2 is an effective way to aid in decision-making and solve multiobjective problems. In the experiment, we assumed that the weighting factors of the two goals were equivalent. It is reasonable to integrate expert knowledge and experience and assembly line requirements in practical applications and assign optimization target weights. The 3D scene is connected to the database in a data-driven manner in order to verify the feasibility and rationality of safe layouts and verify the effectiveness of safe layout plans.
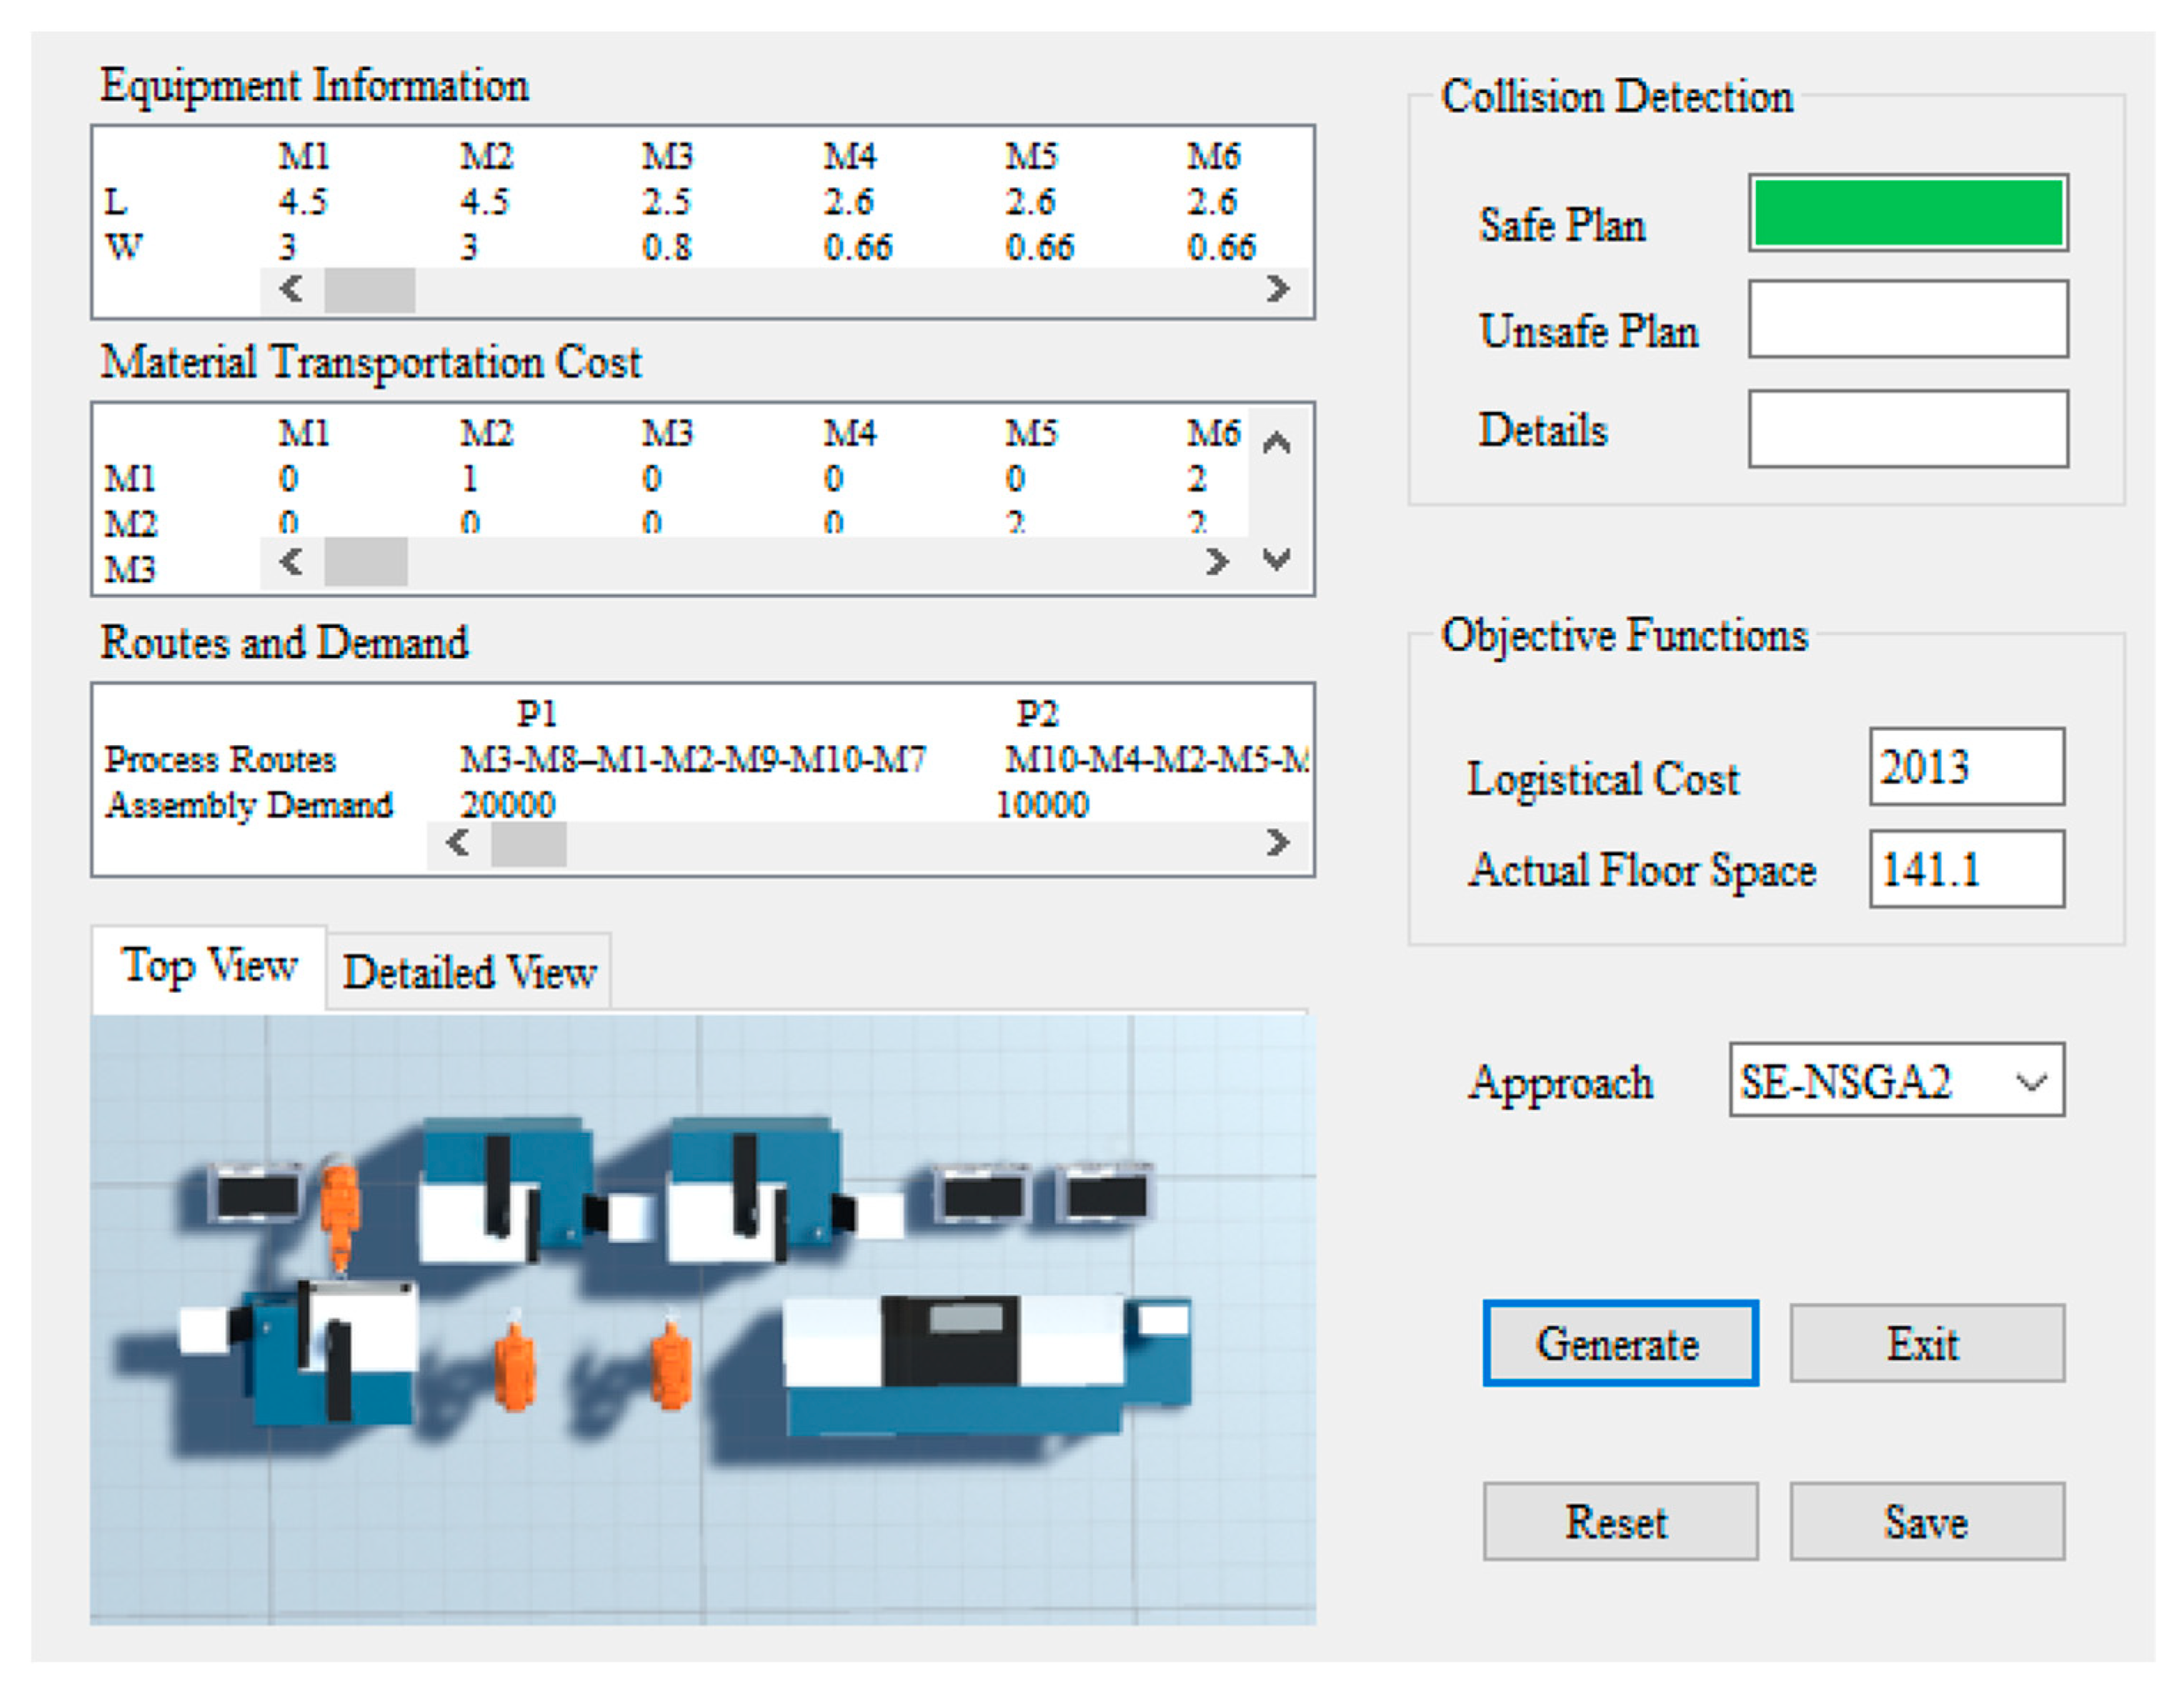
A user interface is designed to facilitate the non-professionals operation. The software has completed the national project acceptance and achieved a satisfactory user experience. According to the chosen approach, an assembly line layout design is generated by clicking a generated button. The SE-NSGA2, NSGA-II, and MOCell approaches can be selected. The top view and detailed view of the layout can be viewed in the visualization window. 3D collision detection verification is performed on the layout design plan in order to ensure a safe layout plan. When the layout design is safe, it is displayed in green. In the user interface, when the plan is unsafe, it is displayed in red. Simultaneously, the equipment name of the unsafe layout and ground projection coordinates of the first collision is displayed in the details. The collision occurs between the end-of-arm tooling of robot M5 and robot arm of M6, and the ground projection point where collisions occur is (9.25, 3), as shown in Figure 9. Layout plan P is optimal, and it is generated with SE-NSGA2. Figure 10 shows a user interface of the 3D visualized top view layout.

5. Conclusions and Outlook

This paper proposes a systematic optimization approach in order to generate a safe layout plan for assembly lines with robots. The modeling rules for robots and irregular equipment are presented, and a combined SE-NSGA2 method that is based on NSGA-II and the DE strategy is used for generating the initial optimal plan set. Subsequently, we define the verification process, propose a quantitative safety indicator, and assess the cooperative assembly statuses of robots. Finally, 3D safety collision detection is performed in order to verify the safety and effectiveness of the layout scheme.
When compared to state-of-the-art algorithms, our approach has superior performance based on the convergence and distribution results. The case study involves an industrial assembly line with ten pieces of equipment, including three robots, and the established model and improved methods are verified to be safe and useful. Our experimental and statistical results of optimal layout plan for assembly lines increase by 14.5%, and our approach can generate a safety layout to optimize economics and safety. The safe layouts increase by 20.63% when compared with the original NSGA-II method.
Although our approach works well in the experiments, improvement is still needed in future work. First, we plan to expand the types of robots in order to increase the complexity of the modeling. Second, the modeling of operators employs the anthropometric tool RAMSIS [39]. In addition, we will apply mixed-reality visualization for training and to display and verify the layout changes during operations. This approach could increase the intuitiveness of decision makers and aid in effectively producing optimal layouts.

Author Contributions

Methodology, S.W. and H.W.; software, S.W; validation, S.W.; visualization, S.W.; supervision, R.G. and B.V.-H. All authors have read and agreed to the published version of the manuscript.

Funding

This research was funded by the National Science Foundation, under grant No. 2019ZX04014001-004; the Industrial Major Project of Liaoning Province, under grant No. 2019JH1/10100007; the Shenyang High-level Talents Innovation and Entrepreneurship, under grant No. 2019-SYRCCX-C-08; and the China Scholarship Council Scholarship under grant No. 201904910641.

Conflicts of Interest

The authors declare no conflict of interest.

References

  1. Vogel-Heuser, B.; Bauernhansl, T.; Ten Hompel, M. Handbuch Industrie 4.0 Bd.4; Springer: Berlin/Heidelberg, Germany, 2017. [Google Scholar] [CrossRef]
  2. Michniewicz, J.; Reinhart, G.; Boschert, S. CAD-Based Automated Assembly Planning for Variable Products in Modular Production Systems. Procedia CIRP 2016, 44, 44–49. [Google Scholar] [CrossRef] [Green Version]
  3. Ocker, F.; Kovalenko, I.; Barton, K.; Tilbury, D.; Vogel-Heuser, B. A Framework for Automatic Initialization of Multi-Agent Production Systems Using Semantic Web Technologies. IEEE Robot. Autom. Lett. 2019, 4, 4330–4337. [Google Scholar] [CrossRef]
  4. Bortolini, M.; Ferrari, E.; Gamberi, M.; Pilati, F.; Faccio, M. Assembly system design in the Industry 4.0 era: A general framework. IFAC-PapersOnLine 2017, 50, 5700–5705. [Google Scholar] [CrossRef]
  5. Moslemipour, G.; Tian, S.L.; Rilling, D. A review of intelligent approaches for designing dynamic and robust layouts in flexible manufacturing systems. Int. J. Adv. Manuf. Technol. 2012, 60, 11–27. [Google Scholar] [CrossRef]
  6. Tarkesh, H.; Atighehchian, A.; Nookabadi, A.S. Facility layout design using virtual multi-agent system. J. Intell. Manuf. 2009, 20, 347–357. [Google Scholar] [CrossRef]
  7. Vitayasak, S.; Pongcharoen, P.; Hicks, C. A tool for solving stochastic dynamic facility layout problems with stochastic demand using either a Genetic Algorithm or modified Backtracking Search Algorithm. Int. J. Prod. Econ. 2017, 190, 146–157. [Google Scholar] [CrossRef] [Green Version]
  8. Deb, K.; Pratap, A.; Agarwal, S.; Meyarivan, T. A fast and elitist multiobjective genetic algorithm: NSGA-II. IEEE. Trans. Evol. Comput. 2002, 6, 182–197. [Google Scholar] [CrossRef] [Green Version]
  9. Moslemipour, G.; Lee, T.S.; Loong, Y.T. Performance Analysis of Intelligent Robust Facility Layout Design. Chin. J. Mech. Eng. 2017, 30, 407–418. [Google Scholar] [CrossRef]
  10. Chen., G.; Rogers., J. Managing Dynamic Facility Layout with Multiple Objectives. In Proceedings of the PICMET2009, Portland, OR, USA, 2–6 August 2009; pp. 1175–1184. [Google Scholar]
  11. Kia, R.; Khaksar-Haghani, F.; Javadian, N.; Tavakkoli-Moghaddam, R. Solving a multi-floor layout design model of a dynamic cellular manufacturing system by an efficient genetic algorithm. J. Manuf. Syst. 2014, 33, 218–232. [Google Scholar] [CrossRef]
  12. Gress, E.S.H.; Mora-Vargas, J.; del Canto, L.E.H.; Díaz-Santillán, E. A genetic algorithm for optimal unequal-area block layout design. Int. J. Prod. Res. 2010, 49, 2183–2195. [Google Scholar] [CrossRef]
  13. Lenin, N.; Kumar, M.S.; Islam, M.N.; Ravindran, D. Multi-objective optimization in single-row layout design using a genetic algorithm. Int. J. Adv. Manuf. Technol. 2013, 67, 1777–1790. [Google Scholar] [CrossRef] [Green Version]
  14. Vitayasak, S.; Pongcharoen, P.; Hicks, C. Robust machine layout design under dynamic environment: Dynamic customer demand and machine maintenance. Expert Syst. Appl. X 2019, 3, 1–15. [Google Scholar] [CrossRef]
  15. Dapa, K.; Loreungthup, P.; Vitayasak, S.; Pongcharoen, P. Bat algorithm, genetic algorithm and shuffled frog leaping algorithm for designing machine layout. In Multi-Disciplinary Trends in Artificial Intelligence; Springer: Berlin/Heidelberg, Germany, 2013; Volume 8271, pp. 59–68. [Google Scholar]
  16. Emami, S.; Nookabadi, A.S. Managing a new multi-objective model for the dynamic facility layout problem. Int. J. Adv. Manuf. Technol. 2013, 68, 2215–2228. [Google Scholar] [CrossRef]
  17. Zhang, X.J.; Wang, L.C.; Chen, Y. Multi-Objective Optimization for Multi-Line and U-Shape Layout of Sewing Assembly Line in Apparel Industry. IEEE Access 2019, 7, 107188–107200. [Google Scholar] [CrossRef]
  18. Tayal, A.; Singh, S.P. Designing Flexible Stochastic Dynamic Layout: An Integrated Firefly and Chaotic Simulated Annealing-Based Approach. Glob. J. Flex. Syst. Manag. 2016, 18, 89–98. [Google Scholar] [CrossRef]
  19. Papakostas, N.; Moneley, J.O.; Hargaden, V. Integrated simulation-based facility layout and complex production line design under uncertainty. CIRP Ann. 2018, 67, 451–454. [Google Scholar] [CrossRef]
  20. Jolai, F.; Tavakkoli-Moghaddam, R.; Taghipour, M. A multi-objective particle swarm optimisation algorithm for unequal sized dynamic facility layout problem with pickup/drop-off locations. Int. J. Prod. Res. 2012, 50, 4279–4293. [Google Scholar] [CrossRef]
  21. Guan, J.; Lin, G. Hybridizing variable neighborhood search with ant colony optimization for solving the single row facility layout problem. Eur. J. Oper. Res. 2016, 248, 899–909. [Google Scholar] [CrossRef]
  22. Zeng, Q.; Shen, L.; Pan, Q.D. Multi-objective optimization method for workshop facility layout based on NSGA II. CEA 2012, 48, 223–228. [Google Scholar]
  23. Michalos, G.; Makris, S.; Tsarouchi, P.; Guasch, T.; Chryssolouris, G. Design Considerations for Safe Human-robot Collaborative Workplaces. Procedia CIRP 2015, 37, 248–253. [Google Scholar] [CrossRef]
  24. Michalos, G.; Fysikopoulos, A.; Makris, S.; Mourtzis, D.; Chryssolouris, G. Multi criteria assembly line design and configuration—An automotive case study. CIRP J. Manuf. Sci. Technol. 2015, 9, 69–87. [Google Scholar] [CrossRef]
  25. Lim, Z.Y.; Ponnambalam, S.G.; Izui, K. Nature inspired algorithms to optimize robot workcell layouts. Appl. Soft Comput. 2016, 49, 570–589. [Google Scholar] [CrossRef]
  26. Leiber, D.; Hammerstingl, V.; Wei, F.; Reinhart, G. Automated design of multi-station assembly lines. Procedia CIRP 2019, 79, 137–142. [Google Scholar] [CrossRef]
  27. Drira, A.; Pierreval, H.; Hajri-Gabouj, S. Design of a robust layout with information uncertainty increasing over time: A fuzzy evolutionaryapproach. Eng. Appl. Artif. Intell. 2013, 26, 1052–1060. [Google Scholar] [CrossRef]
  28. Nematian, J. A robust single row facility layout problem with fuzzy random variables. Int. J. Adv. Manuf. Technol. 2014, 72, 255–267. [Google Scholar] [CrossRef]
  29. Hosseini-Nasab, H.; Fereidouni, S.; Ghomi, S.M.T.F.; Fakhrzad, M.B. Classification of facility layout problems: A review study. Int. J. Adv. Manuf. Technol. 2018, 94, 957–977. [Google Scholar] [CrossRef]
  30. Moatari-Kazerouni, A.; Chinniah, Y.; Agard, B. Integrating occupational health and safety in facility layout planning, part I: Methodology. Int. J. Prod. Res. 2015, 53, 3243–3259. [Google Scholar] [CrossRef]
  31. Neghabi, H.; Tari, F.G. A new concept of adjacency for concurrent consideration of economic and safety aspects in design of facility layout problems. J. Loss Prev. Process Ind. 2016, 40, 603–614. [Google Scholar] [CrossRef]
  32. Allahyari, M.Z.; Azab, A. A Novel Bi-level Continuous Formulation for the Cellular Manufacturing System Facility Layout Problem. Procedia CIRP 2015, 33, 87–92. [Google Scholar] [CrossRef] [Green Version]
  33. Hu, B.; Yang, B. A particle swarm optimization algorithm for multi-row facility layout problem in semiconductor fabrication. J. Ambient. Intell. Humaniz. Comput. 2018, 10, 3201–3210. [Google Scholar] [CrossRef]
  34. Storn, R. Differential evolution—A simple and efficient heuristic for global optimization over continuous space. J. Glob. Optim. 1997, 11, 341–359. [Google Scholar] [CrossRef]
  35. Cagan, J.; Shimada, K.; Yin, S. A survey of computational approaches to three-dimensional layout problems. Comput. Aided Des. 2002, 34, 597–611. [Google Scholar] [CrossRef] [Green Version]
  36. Jimenez, P.; Thomas, F.; Torras, C. 3D collision detection: A survey. Comput. Graph. 2001, 25, 269–285. [Google Scholar] [CrossRef] [Green Version]
  37. Wang, S.; Guo, R.F.; Wang, H.L. The implicit function collision detection method for five-axis machining complex surfaces. Mini-Micro Syst. 2017, 38, 2171–2176. [Google Scholar] [CrossRef]
  38. Nebro, A.J.; Durillo, J.J.; Luna, F.; Dorronsoro, B.; Alba, E. MOCell: A cellular genetic algorithm for multiobjective optimization. Int. J. Intell. Syst. 2009, 24, 726–746. [Google Scholar] [CrossRef] [Green Version]
  39. Meulen, P.; Seidl, A. Ramsis—The Leading Cad Tool for Ergonomic Analysis of Vehicles. In Digital Human Modeling, Proceedings of the International Conference on Digital Human Modeling (ICDHM 2007), Beijing, China, 22–27 July 2007; Springer: Berlin/Heidelberg, Germany, 2007; pp. 1008–1017. [Google Scholar]
Figure 1. Schematic of the assembly line layout.
Applsci 10 08844 g001
Figure 2. Robot entity and simulation model. (a) Schematic description of the KUKA KR210 R2700 robot architecture; and, (b) a simulation model of the KUKA KR210 R2700 robot using the Monte Carlo method in MATLAB 2018a.
Applsci 10 08844 g002
Figure 3. Point cloud diagram of two robots’ assembly range. (a) A 3D view of work range; (b) a top view of two robots’ assembly maximum range; (c) a top view of two near robots’ assembly work range. The overlapped area is large, but the collaboration assembly work range is smaller than (b); and, (d) top view of two robots’ minimum range of assembly work.
Applsci 10 08844 g003aApplsci 10 08844 g003b
Figure 4. The procedure of the proposed SE-NSGA2.
Applsci 10 08844 g004
Figure 5. Statistical results of the Pareto front in comparison.
Applsci 10 08844 g005
Figure 6. Comparison of the safety and optimization levels of layouts.
Applsci 10 08844 g006
Figure 7. Comparison of the number of collisions.
Applsci 10 08844 g007
Figure 8. Schematic diagram of Pareto set comparison.
Applsci 10 08844 g008
Figure 9. Detailed view of unsafe layout by NSGA-II.
Applsci 10 08844 g009
Figure 10. Top view of safe and optimal layout by SE-NSGA2.
Applsci 10 08844 g010
Table 1. Comparison based on the characteristics of the facility layout problems (FLP).
AuthorOptimization ObjectCustomized ConstraintsSolution Results
StationMachineRobotSafetyRobust2D3D
Tayal [18]-----
Lim [25]----
Papakostas [19]-----
Guan [21]-----
Allahyaria [32]-----
Kia [11]-----
Vitayasak [14]-----
Dapa [15]-----
Lenin [13]-----
Moslemipour [9]----
Hu [33]------
Michalos [24]----
Leiber [26]----
Drira [27]----
Zeng [22]-----
Zhang [17]-----
SE-NSGA2-
√ forced on, - not forced on.
Table 2. Parameters of KUKA KR210R2700.
LinkΑ (°)a (mm)d (mm)θ (°)
1903300[−185, 185]
2011500[−140, −5]
3901150[−120, 168]
4−9000[−350, 350]
59000[−125, 125]
6000[−350, 350]
Table 3. Statistical results of the IGD.
Test FunctionNSGA-IISE-NAGA2MOCell
ZDT11.8758 × 10−21.6865 × 10−21.7515 × 10−2
DTZ14.9333 × 10−24.1731 × 10−26.9575 × 10−2
Table 4. Equipment information.
IDE 1F 2N 3R0, Rmax (m)Size (L, W(m))
M1, M2, M10M 4Processing Workpiece30, 04.5, 3
M3, M8, M9S 5Place Workpiece30, 02.5, 0.8
M4R 6Grab10.33, 2.72.6, 0.66
M5, M6R 6Grab Assembly20.33, 2.72.6, 0.66
M7M 4Combine Processing10, 08, 2.6
1 E (equipment); 2 F (function); 3 N (number); 4 M (machine); 5 S (station); 6 R (robot).
Table 5. Material transportation cost per unit distance.
R 1Cost of Facility (Cij)
M1M2M3M4M5M6M7M8M9M10
M10100020100
M20000220001
M30000001010
M40000540002
M50200030000
M62000300200
M70020000100
M80020001000
M90010000010
M101100200010
1 R (relationship between equipment).
Table 6. Demand for assembly parts.
P 1Assembly Parts (Pij)
P1P2P3
t20,00010,00010,000
1 P (during the period).
Table 7. Process route for assembly parts.
TypeElementProcess Routes
P1M 1, S 2M3-M8-M1-M2-M9-M10-M7
P2GR 3, M 1, S 2M10-M4-M2-M5-M9-M6-M1-M8-M3
P3AR 4, GR 3, M 1, S 2M4-M10-M2-M5-M6-M7-M3-M8
1 M (machine); 2 S (station); 3 GR (grab robot); 4AR (assembly robot).
Table 8. Statistical results with compared approach.
ModelApproachComparison Results
P 1 (%)DO 2 (N.)
GLM 3MOCell [39]41.423
NSGAII [8]43.324
SE-NSGA243.821
SLM 4MOCell [39]41.123
NSGAII [8]41.823
SE-NSGA256.327
1 P (percentage of Pareto optimal plans); 2 DO (decision output from Pareto set); 3 GLM (General layout model); 4 SLM (Safety layout model).
Table 9. Display of partial plans.
N 1L 2Mi 3Center Point CoordinatesLC 4Α 5
P19, 4, 2, 1, 8, 3(1.57, 7), (4.25, 7), (7.9, 7), (12.55, 7), (16.15, 7), (18.75, 7)2013141.1
210, 5, 6, 7(4.25, 3), (8, 3), (10.75, 3), (16.15, 3)
Q13, 4, 10, 2, 1(1.25, 7.8), (3.9, 7.8), (7.55, 7.8), (12.15, 7.8), (16.75, 7.8)2164134.4
28, 9, 5, 6, 7(1.25, 3.8), (3.85, 3.8), (6.5, 3.8), (9.2, 3.8), (15.2, 3.8)
1 N (plan set); 2 L (number of assembly line); 3 Mi (number of equipment); 4 LC (cost of layout, 103, unit. RMB); 5 α (layout area, unit. m2).
Publisher’s Note: MDPI stays neutral with regard to jurisdictional claims in published maps and institutional affiliations.

