1. Introduction
During last years, Fourier Transform Infrared (FTIR) micro-spectroscopy has been widely used to investigate different types of biomedical samples, as tissues [
1,
2,
3], biological fluids [
4,
5,
6], and cells [
6,
7,
8,
9]. One of the main biomedical applications of FTIR micro-spectroscopy concerns the possibility to discriminate cancer cells from their normal counterpart according to specific spectral changes. Shen et al. discriminated liver cancer cells from normal liver cells according to the intensity ratios of some specific FTIR peaks related to cellular components [
10]. Li et al. compared FTIR spectra of normal and several heterogeneous ovarian cancer cell lines and tissues, and they found spectral markers (consisting of relative FTIR band intensities) that were able to discriminate cancer samples from normal samples [
11]. Kong et al. used FTIR to distinguish between human astrocytes, microglia, glioma, and glioblastoma cells in vitro; they found that the protein secondary structure was an indicator to distinguish tumor cells from glial cells [
12]. As these spectral differences are very small, multivariate statistical techniques, like Principal Component Analysis (PCA), are commonly used to analyze and successfully discriminate the spectral data [
13,
14]. In fact, PCA transforms N original variables (as the absorption values for the N wavenumber values in a group of all the M measured FTIR spectra) into a new set of N variables, called principal components (PCs), each one is a linear combination of the original variables. The PCs maintain all the variance of the original data, but the first PC contains the most of the variance in the dataset, and each subsequent PC contains less variance. The value that each PC takes for each spectrum is called the score for that PC. A score plot, reporting the score values of two different PC for all the M cellular spectra, describes differences among the M spectra, allowing separation of them into clusters based on similarities or differences in the spectral characteristics. The accuracy of FTIR micro-spectroscopy in the identification of pathological samples with respect to healthy samples has suggested the possibility of using this technique as a diagnostic tool in the clinical practice [
15].
However, a right use of FTIR technique requires that samples are deposited on suitable substrates, which must be transparent or reflective to the IR radiation, whereas IR absorbing materials are to be avoided as substrates. Although thick glass slides (about 1 mm thickness) are widely used in cytology and histology, they absorb incident radiation at wavenumbers lower than 2000 cm
−1, i.e., in the fingerprint region, where the absorption peaks of most cellular components (DNA, lipids, and proteins) are included [
16]. Moreover, glass coverslips, which are thin glass slides (about 0.17 mm thickness) usually used to cover biological samples deposited onto thick glass slides, absorb IR radiation at wavenumbers lower than 1500 cm
−1, and, consequently, they cannot measure the fingerprint region [
17].
On the contrary, suitable substrates for measuring the cells samples’ absorption in the fingerprint region are calcium fluoride (CaF2) crystals and IR-reflective substrates, such as MirrIR low-emissivity (low-e) substrates. The former are thick mid-IR transparent slides, whereas the latter consist of thick glass slides over which a thin Ag/SnO2 coating has been deposited. The IR absorption measurement with such two substrates is carried out in transmission (as for CaF2) and transflection (as for low-e) mode. However, both such substrates are more expensive than glass and coverslip slides (particularly as far as CaF2 is concerned); this is a drawback for the adoption of FTIR micro-spectroscopy in the clinical diagnostics, because the conventional diagnostic techniques make use of biological samples deposited on cheap substrates.
However, FTIR micro-spectroscopy is able to measure not only the fingerprint region but also the so-called high wavenumber region between 2500 and 3700 cm
−1, corresponding to absorption bands related to lipid, protein, and nucleic acid vibrational modes. Such a spectral range has not been frequently investigated because it is characterized by few broad and/or overlapping bands; therefore, it was considered that it did not contain useful information for diagnostic purposes. Several years ago, Bassan et al. [
16] investigated the possibility to discriminate cells of different types within breast tissue by means of FTIR measurements in the 3100–3700 cm
−1 spectral range. Recently, Rutter et al. found that glass coverslip is able to discriminate different types of cell lines deposited over them according to FTIR spectra in the 2700–3100 cm
−1 wavenumber region [
17].
In this paper, we explore the possibility to discriminate cells of different type according to their infrared absorption spectrum in the 2750–3000 cm−1 spectral range, which is dominated by spectral features related to lipid and protein vibrational modes. Our investigation was carried out for two types of cell lines (normal and cancerous ones) grown on four different substrates: conventional glass slide, glass coverslip, CaF2 window, and low-e glass slide. We found that the two types of cells can be discriminated for all the four types of substrate, both by means of PCA technique (according to PC1 component) and by ratiometric analysis, according to the relative intensity of peaks at 2956 and 2924 cm−1. In particular, CaF2 and low-e substrates are able to provide large separation capability according to PCA technique, whereas low-e and glass slides yield a large discrimination according to ratiometric analysis. The cheapness and availability of these substrates (mainly conventional glass slides) support the proposal of the FTIR technique in medical diagnostics.
2. Materials and Methods
2.1. Cell Lines and Growth Substrates
Two types of cells were chosen to investigate the capability of FTIR spectra, to discriminate them in the high wavenumber spectral range. They came from Human Keratinocyte (HUKE) and neuroblastoma (SH-SY5Y) cell lines, and they were used as in vitro model of normal and cancer cells, respectively. Each cell line was grown in a suitable medium; in particular, HUKE cells were grown in Epilife medium, supplied with Keratinocyte Medium Supplement, at 37 °C, with 5% CO2 and 1% penicillin, and SH-SY5Y cells were cultured in DMEM medium, supplemented with 20% fetal bovine serum, 1% penicillin, and 1%L-glutamine. The samples for FTIR measurements were obtained by seeding the cultured cells on four types of polylysine-coated substrates: (i) IR transparent CaF2 disks (Crystran Ltd., Dorset, UK), (ii) MirrIR low-e slides (Kevley Technologies, Chesterland, OH, USA), (iii) microscope glass slides (Fisher Scientific, Rodano, Italy), and (iv) glass coverslip slides (Fisher Scientific, Rodano, Italy). The cells were not confluent, so that sufficient inter-cellular spaces for measurement of the background signal were left.
One day before FTIR measurements, the cells were fixed in paraformaldehyde 3.7% and rinsed in deionized water, to remove residual PBS from the cell surface. Then, the samples were stored in a desiccator until measurements.
2.2. Spectral Measurements and Analysis
The FTIR spectra were carried out by means of a FTIR Microscope HYPERION 2000 connected to a Vertex 70 Bruker interferometer (Bruker Optik GmbH). The spectra were measured in the transmission mode for cells grown on CaF2, microscopy glass, and coverslip substrate, and in the reflection mode for cells grown on low-e substrate, with a MCT (mercury cadmium telluride) detector (cooled in liquid N2) and a 15× objective. Each spectrum was recorded in the high wavenumber range of 2500–4000 cm−1, at the resolution of 4 cm−1, with 64 scans. The sampling area was about 80 × 80 μm size, including 3–4 cells of each type. The background signal of each substrate was collected in a spatial region free of cells. For each experiment, about 30 cells were measured. Data acquisition was done by means of Opus 6.5 software (Bruker Optik).
Each FTIR spectrum was firstly corrected by using RMie-EMSC algorithm of Bassan et al. [
18] in the Matlab software; then the spectra were normalized to the intensity of Amide A peak at about 3300 cm
−1, by means of the Opus software, in order to minimize the contribution of scattering and the absorption from cells having different thickness, respectively.
The Principal Components analysis was performed with ChemoSpec package of R software (version 3.4.1, R Core Team, Vienna, Austria, 2017) [
19]. Ratiometric analysis was performed by calculating the intensity ratio between two specific absorption peaks (at 2924 and 2956 cm
−1) for each normalized single spectrum. Successively, the mean value and standard deviation were calculated for each set of values of the investigated intensity ratios, related to the two types of cells grown on each substrate. The statistical difference between the cancerous group and the normal group was assessed by the t-test method. All statistical analyses were performed by SigmaPlot software (version 12.5, Systat Software).
3. Results and Discussion
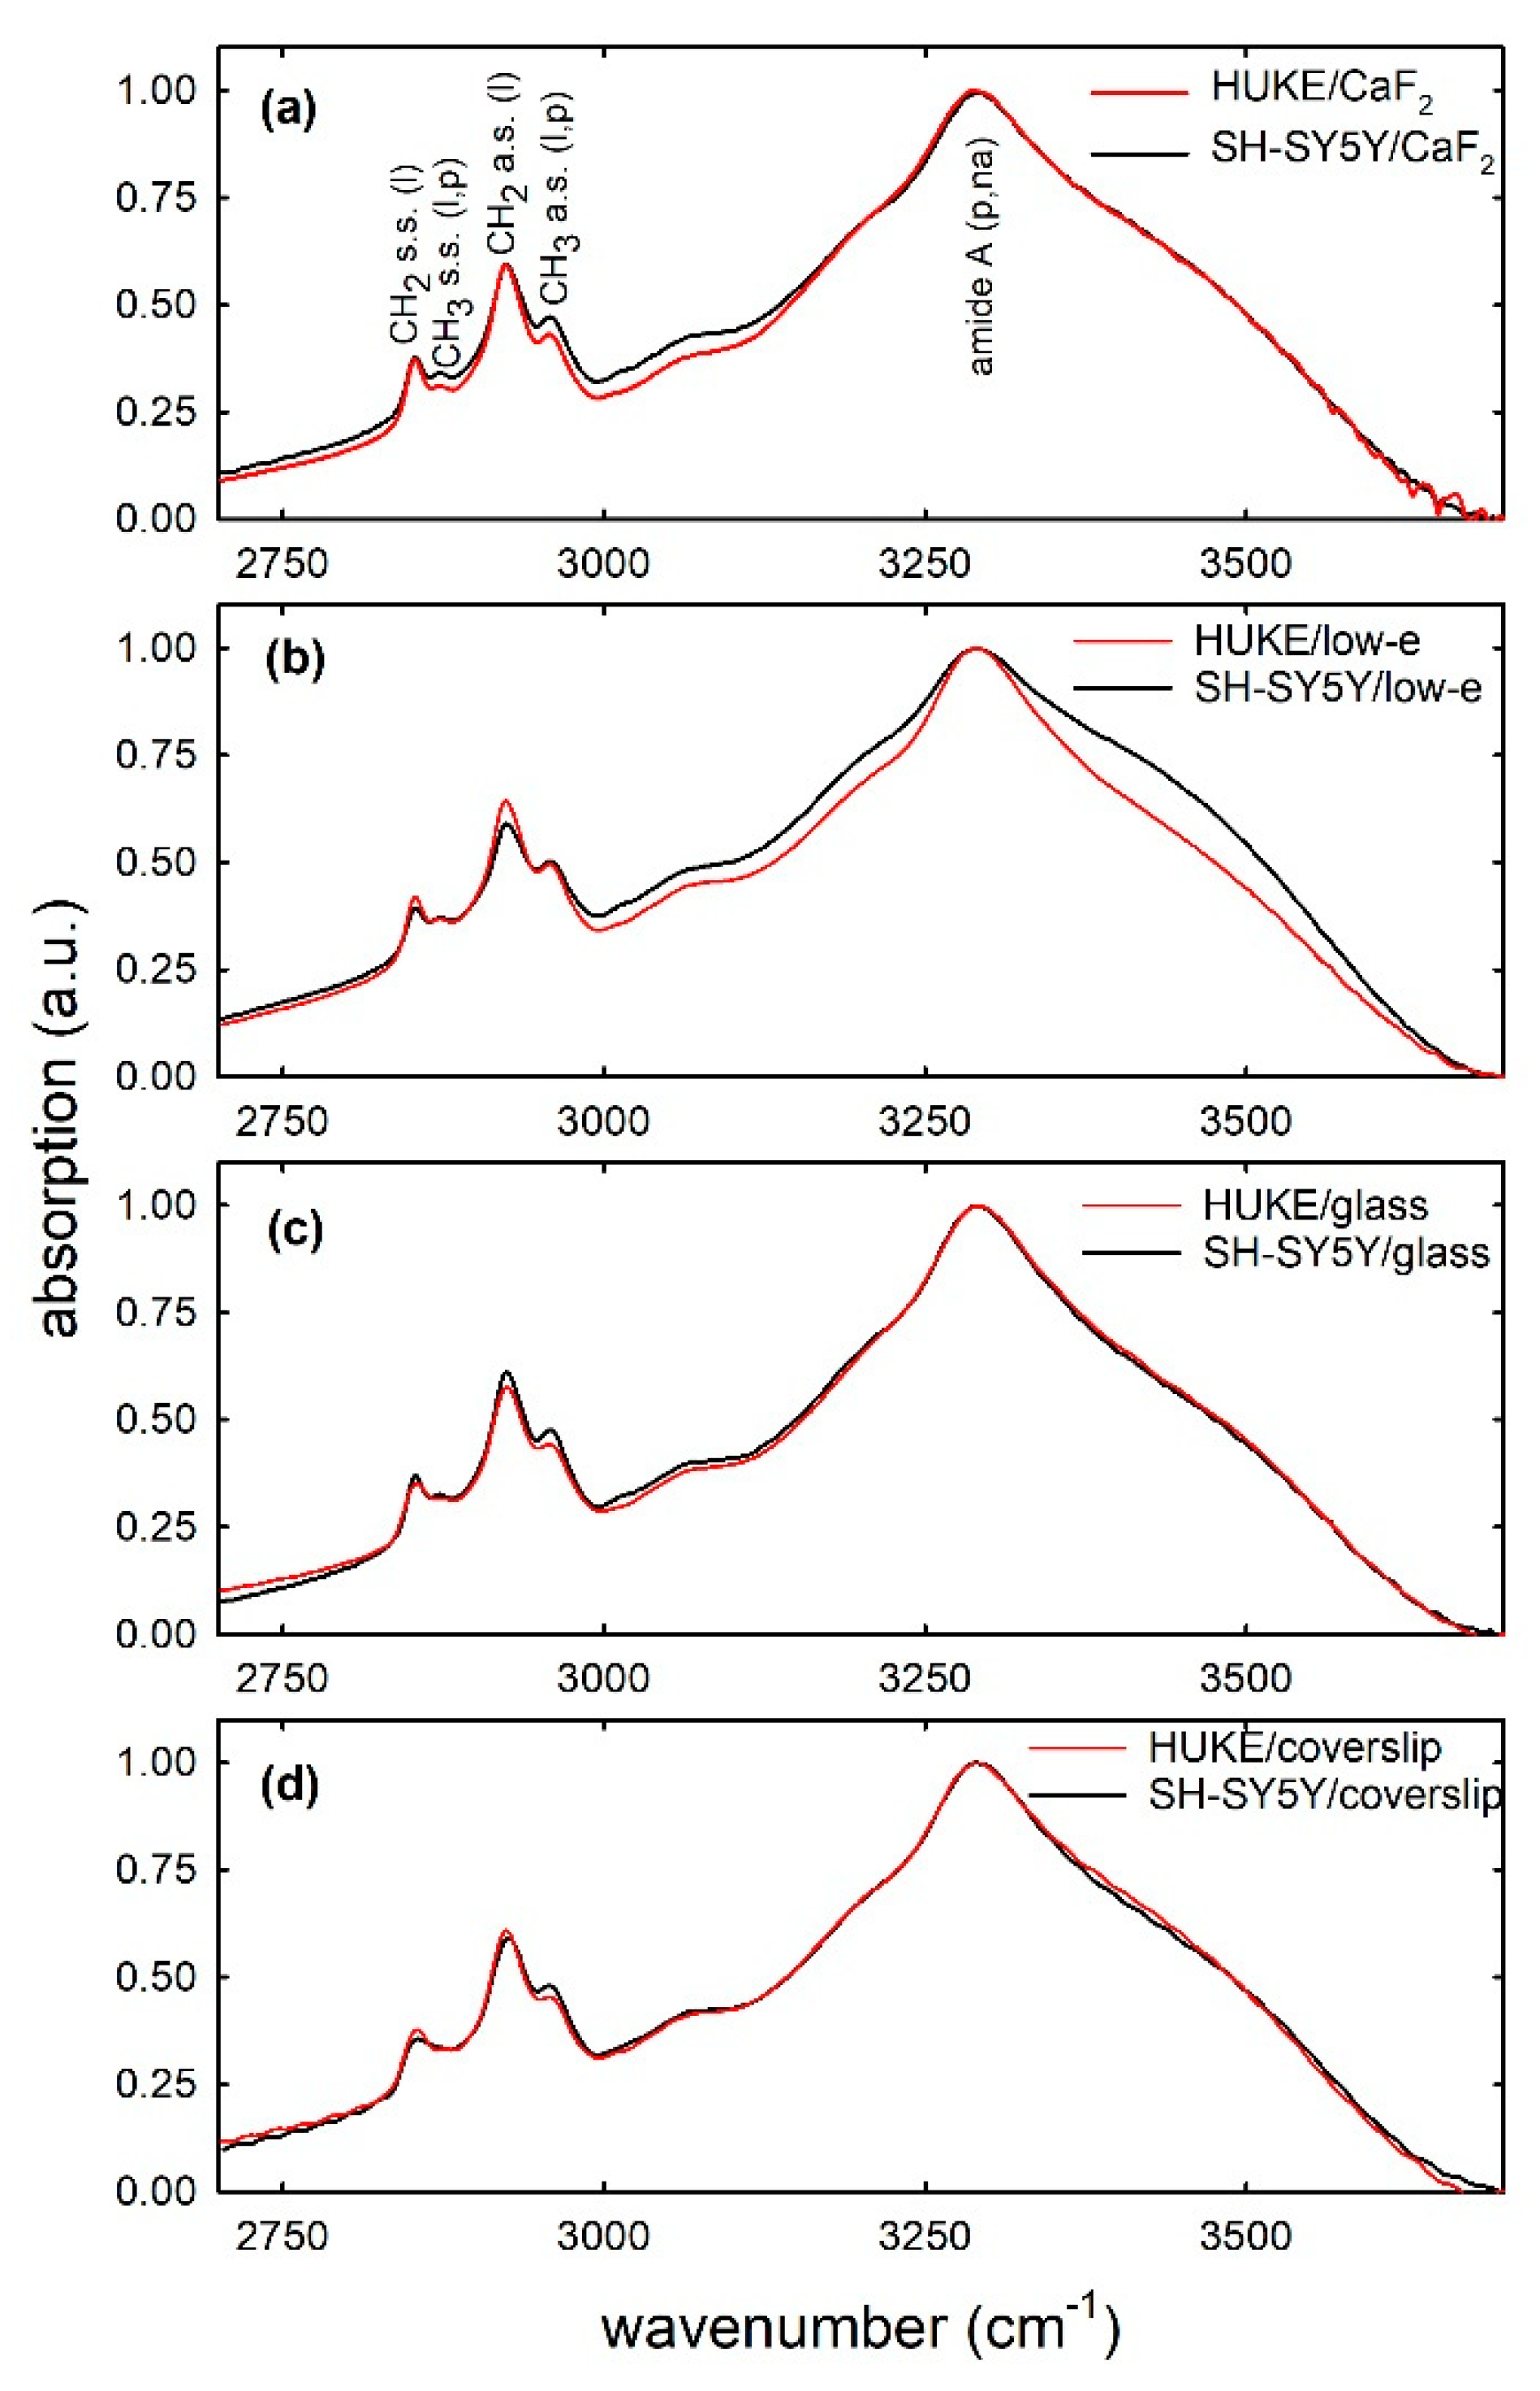
To assess whether the HUKE cells can be discriminated from the SH-SY5Y, we compared the FTIR spectra of the two types of cells grown on the mentioned four substrates. The comparison of the mean normalized spectra is reported in
Figure 1, whereas the distributions of the normalized spectra are shown in the
Supplementary Materials. Such spectra are characterized by several absorption features, which were assigned according to the published literature [
2,
20]; the most prominent ones are labeled in
Figure 1. In particular, the broad and intense band centered at about 3300 cm
−1 is mainly related to the amide A (N-H stretching mode of proteins amino acids and nucleic acids). The peaks observed at about 2956 and 2870 cm
−1 are assigned, respectively, to the asymmetric and symmetric stretching mode of the CH
3 groups of cellular proteins and lipids. The bands at 2924 and 2850 cm
−1 are assigned, respectively, to the asymmetric and symmetric stretching of the CH
2 groups of lipids.
The mean spectra are quite similar each other, and they are also similar to those obtained by other authors for keratinocyte and neuronal cell lines. In particular, FTIR spectra of human keratinocyte HaCaT cell lines and oral keratinocytes isolated by tissue samples, both grown on MirrIR slides, were obtained by Meade et al. [
21] and by Chiu et al. [
22], respectively. FTIR spectra of neuroblastoma cells SH-SY5Y grown on MirrIR slides were investigated by Ricciardi et al. [
23].
Interestingly, a comparison among the spectra in
Figure 1 for each substrate evidences that the main differences between the HUKE cell and SH-SY5Y cell spectra are related to the relative intensity of some peaks, as those centered at 2956 and 2924 cm
−1. Such a behavior suggests that a different relative content of protein and lipid components characterizes and discriminates a cellular type from the other one. The absorption intensity change of the lipid peak at 2920 cm
−1 in malignant cells with respect to normal ones was observed by Rutter et al. [
17]; however, the results of these authors cannot be effectively compared to the results in
Figure 1, because of the different cellular types and normalization methods.
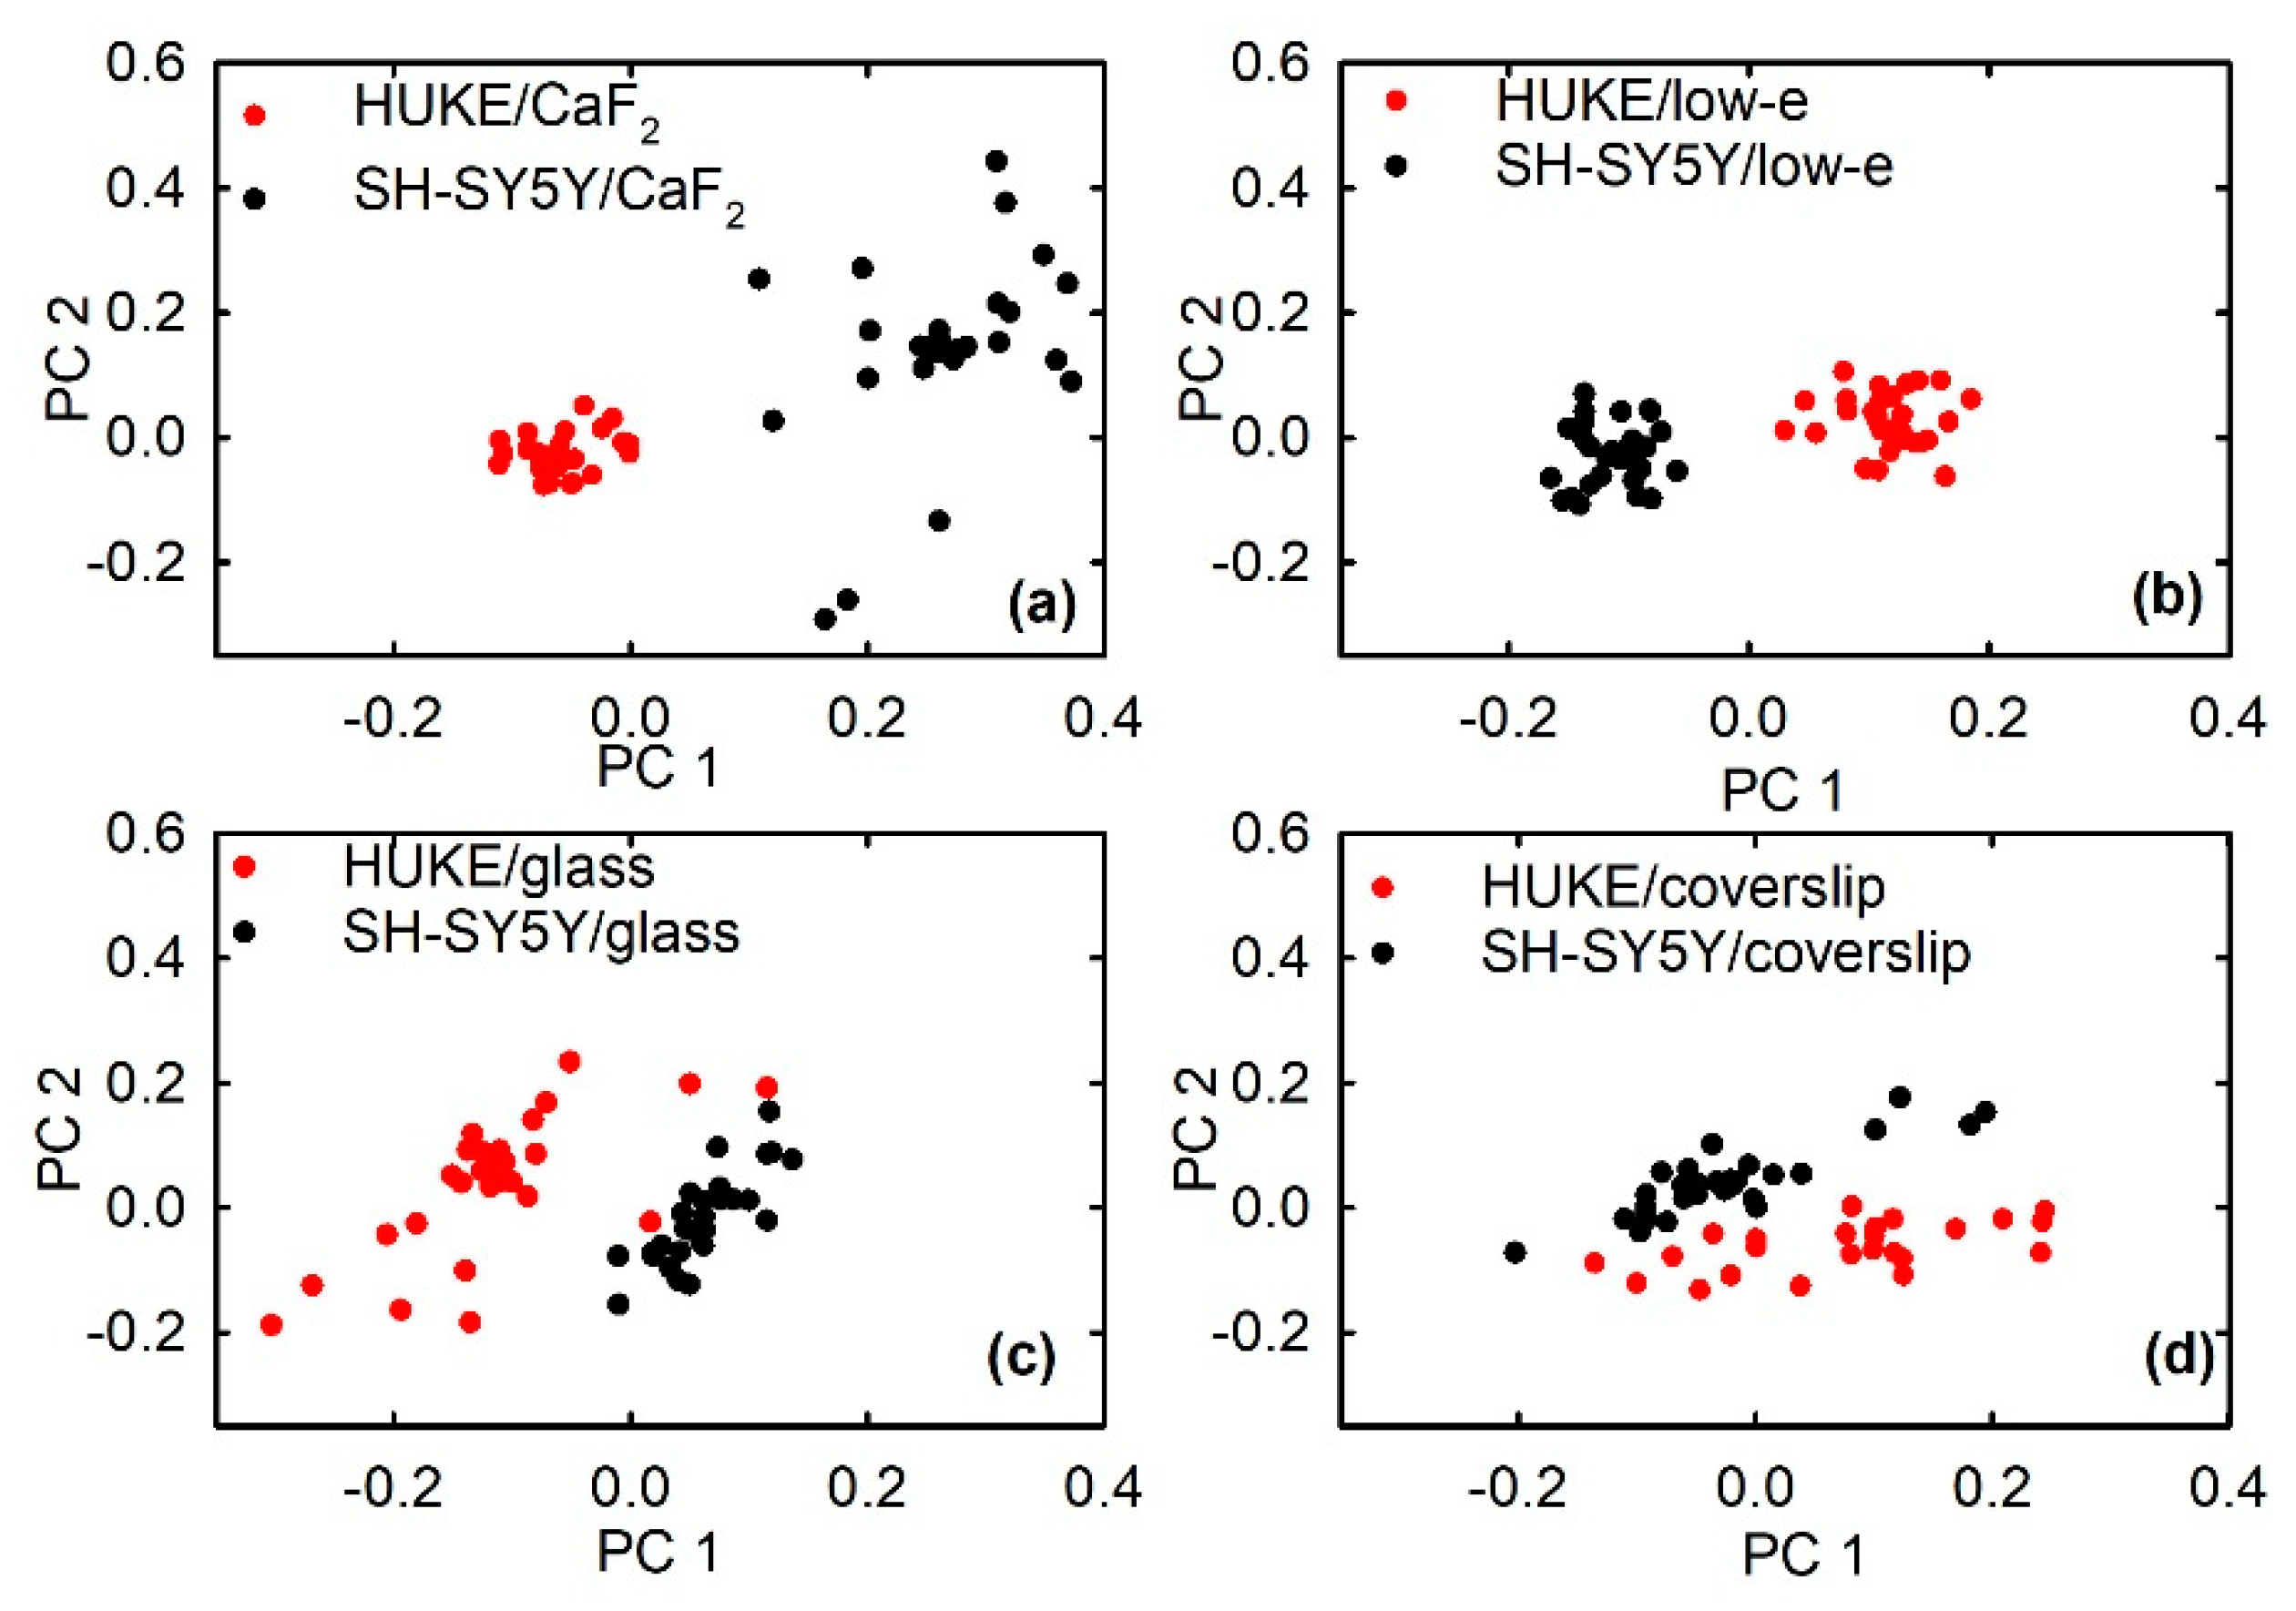
PCA technique was used to assess whether FTIR is able to discriminate between the two types of cells grown on the four substrates. In particular, the spectral range between 2750 and 3000 cm
−1, including absorption peaks related to lipid and protein components, was investigated by means of PCA.
Figure 2 shows the PCA score plots for the two types of cells grown on the four substrates. It is clearly visible that HUKE and SH-SY5Y are separated according to PC1 component, although the separation grade is different according to the substrate type. In order to estimate such a separation grade for each growth substrate, we used the difference between the average values of the distributions of PC1 values of the two types of cells. The estimated values are reported in
Table 1. As evident in
Table 1, the separation between HUKE and SH-SY5Y cells was statistically significant for PC1 component regardless of growth substrate. Although CaF
2 and low-e substrates are able to provide large separation capability, HUKE and SH-SY5Y can be also discriminated when grown on the glass and coverslip slides.
The capability to discriminate different types of cells grown on glass and coverslip slides is interesting in view of a clinical application of FTIR for diagnostic purposes, because such slides are widely used in clinical settings for histological and cytological analyses. The possibility to discriminate different types of cells measured by FTIR spectroscopy was also demonstrated by Rutter et al. [
17]; in particular, they found that three types of cells (two from cancer cell lines and one from peripheral blood) deposited on coverslip can be discriminated by PC1 component of PCA technique. Instead, we have shown that such a discrimination is also possible for different types of cells grown on glass slides, even with a larger separation grade with respect to coverslip. In addition, the spectra in Reference [
17] were obtained with Synchrotron based FTIR, which involves an infrared beamline as synchrotron light source. Such beamlines are large systems mainly located away from hospitals, where diagnostic analyses are performed. In our case, FTIR measurements were carried out by means of an apparatus consisting of an IR microscope coupled to a FTIR interferometer; it can be easily located as a facility in a hospital setting.
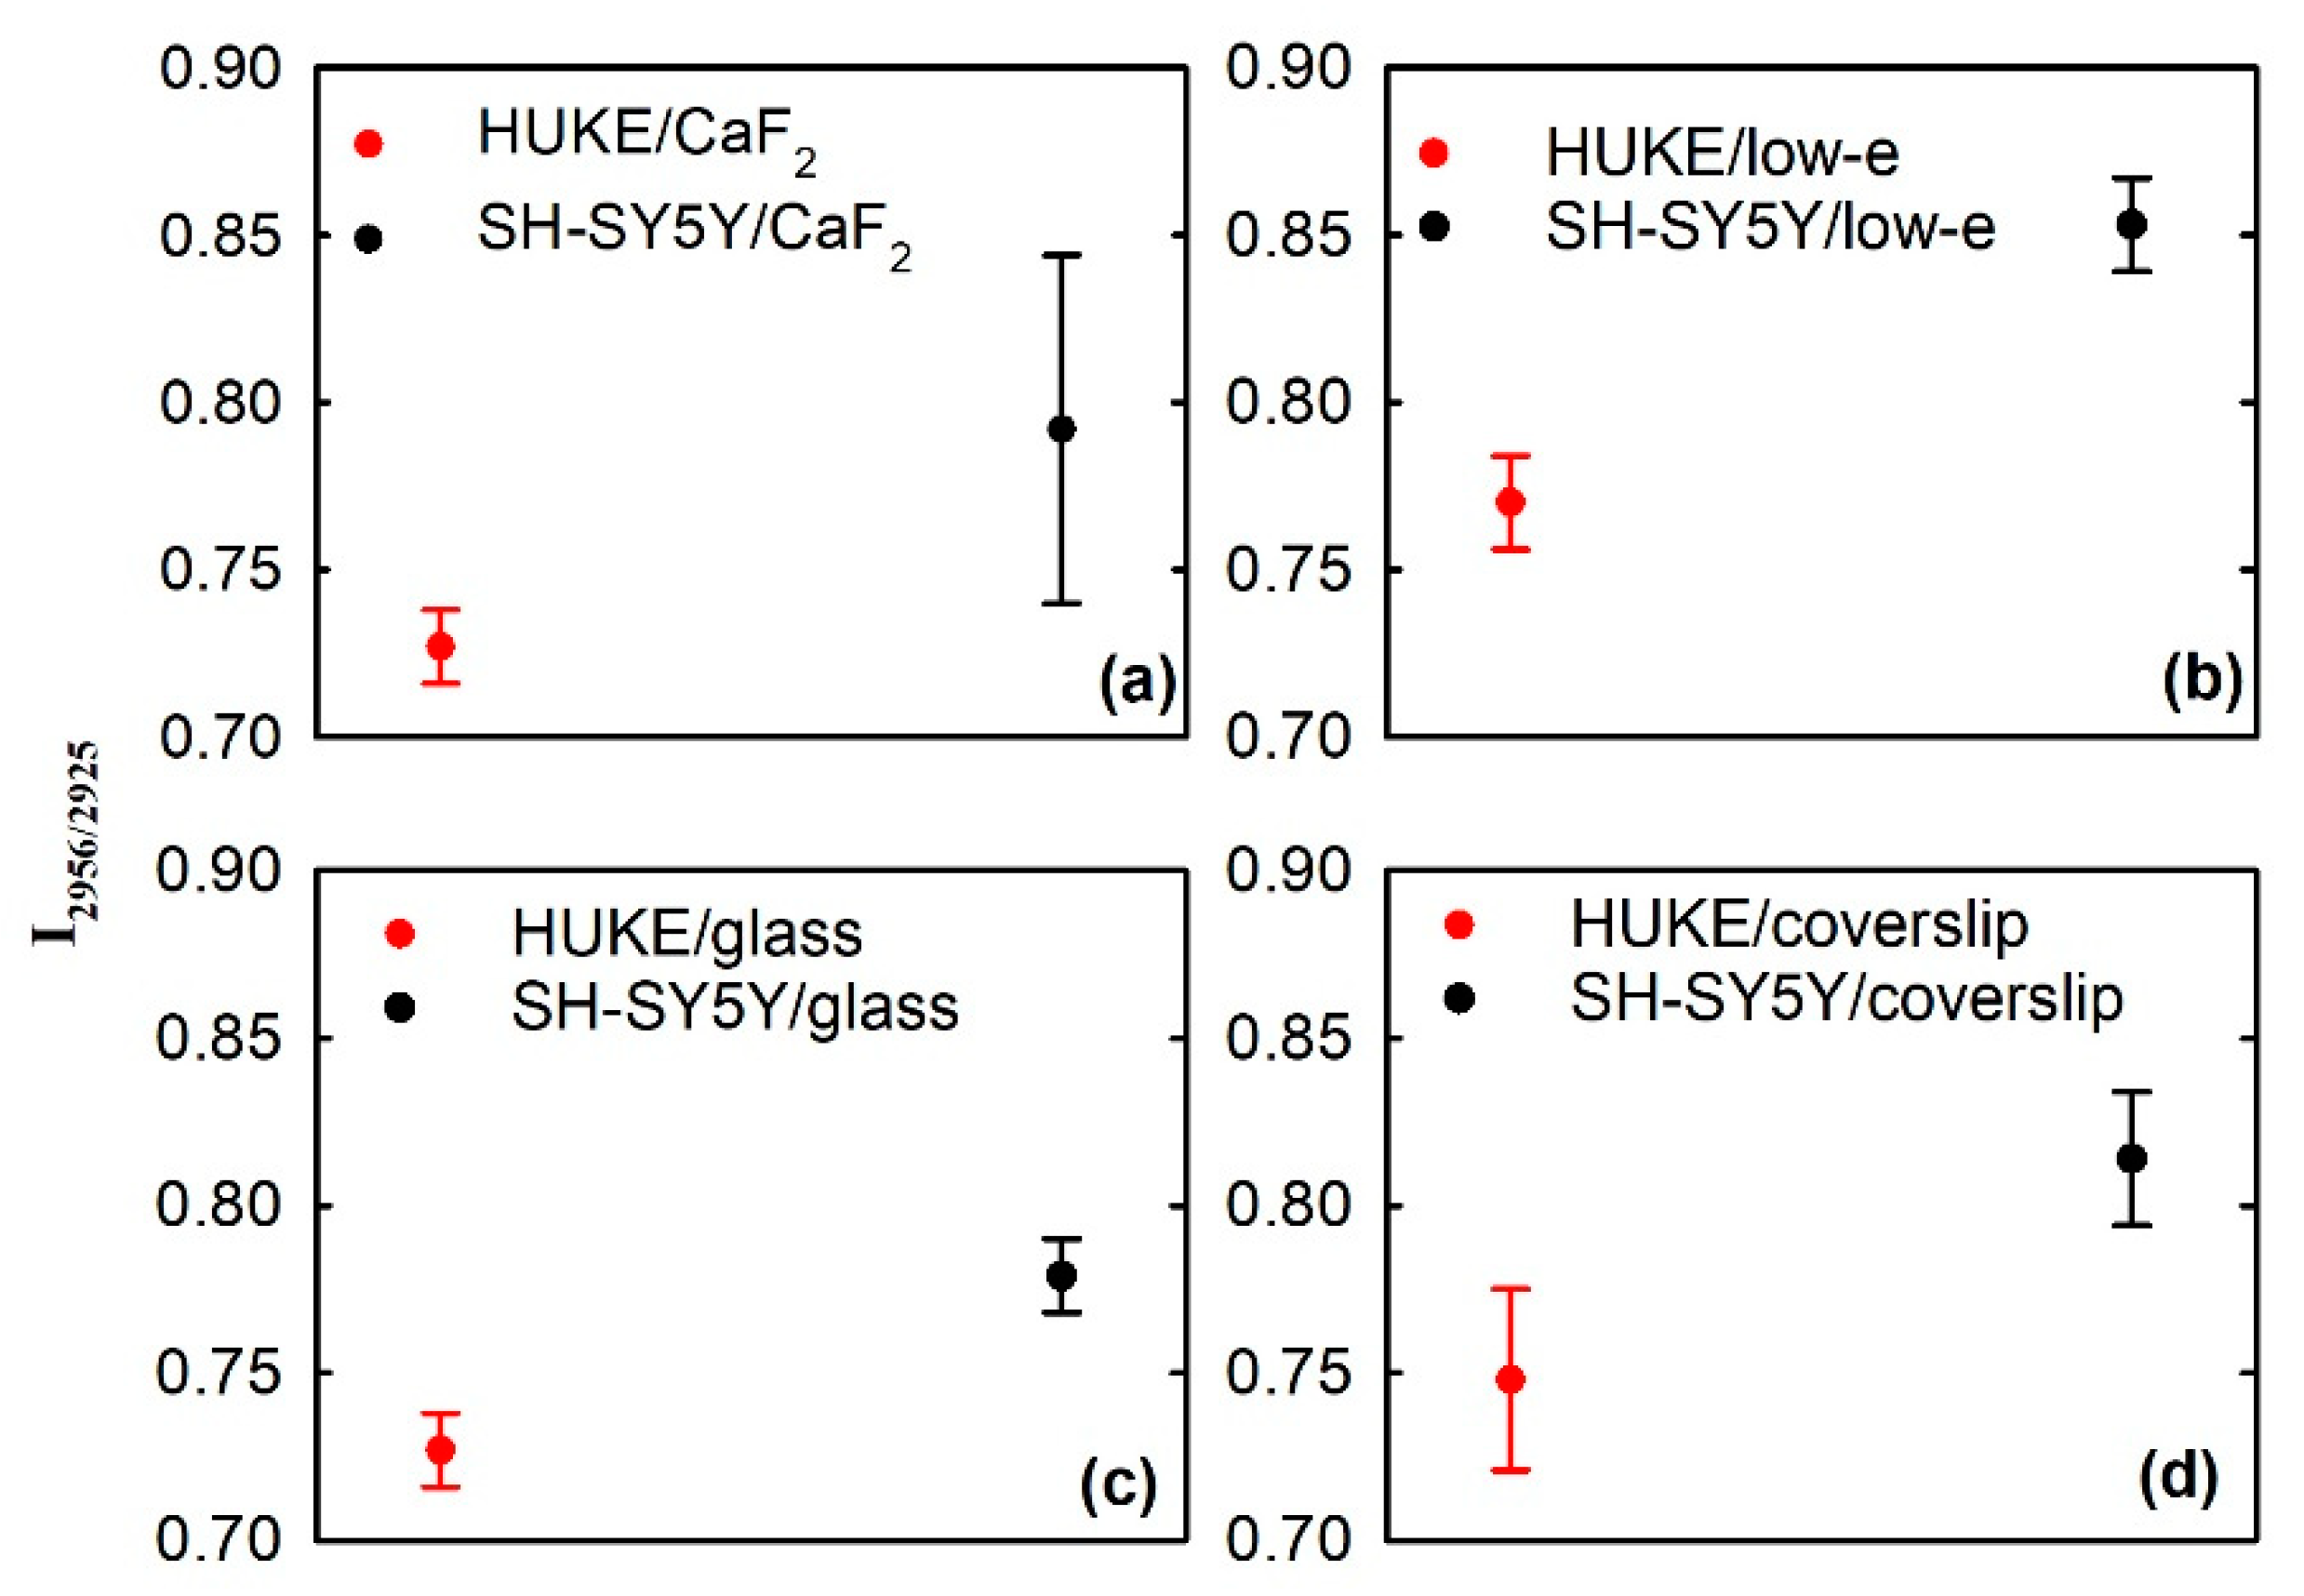
It is important to investigate whether univariate analysis can give information similar to those obtained by PCA about differences in the spectra of the two types of cells. Since the main differences between the HUKE and SH-SY5Y spectra occur for the relative intensity of peaks at 2956 and 2924 cm−1, we examined the intensity ratio I2956/2924 of these two peaks for the two types of cells. Because of the attribution of such peak, I2956/2924 is proportional to the relative content of proteins with respect to lipids in the investigated sample.
Figure 3 shows the average values of I
2956/2924 for the two cell lines grown on the investigated substrates; for each substrate, such a value results in being larger for SH-SY5Y cells than for HUKE cells. The difference of average values is statistically significant in all cases, although it is larger for cells grown on low-e slides with respect to the other substrates. In addition, the distribution of I
2956/2924 values results quite broad in the case of SH-SY5Y cells grown on CaF
2 substrate. The differences between the average values of I
2956/2924 for the two cell lines are reported in
Table 2. It is evident that the separation between HUKE and SH-SY5Y cells was statistically significant, regardless of growth substrate, although low-e and glass substrates are able to provide large separation capability.
These results shown in
Figure 3 suggest that the lipid content, assessed with respect to the protein content, is larger in HUKE cells than in SH-SY5Y cells. It is not in contrast with the well-known fact that lipid metabolism and lipogenesis increases in cancerous cells with respect to normal ones [
24]. In fact, I
2956/2924 is proportional to the protein/lipid ratio content in two different cells type, which are not the normal and cancerous counterpart of the same type of cells. This feature is a promising result in view of diagnostic application of FTIR for cancer detection, because we have found that the absorption spectra are able to discriminate cells with different amount of protein/lipid ratio. Overall, this result suggests that, in addition to PCA technique, also the univariate ratiometric analysis, limited to the high wavenumber range, is able to discriminate different cells according to the relative content of cellular components.
An important issue to be addressed concerns the choice of suitable substrates to perform FTIR spectra. By performing PCA and ratiometric analysis, we deduce that low-e and glass slides can give a suitable discrimination of HUKE and SH-SY5Y cells. Furthermore, CaF2 and coverslip substrates are also able to provide a sufficient discrimination; however, they are characterized by a broad distribution of I2956/2924 values for SH-SY5Y cells (as for the former) and by significant overlapping of PC1 values related to the two cell types (as for the latter). The obtained results are promising for the perspective of diagnostic application of FTIR technique, because they show that different types of cells can be discriminated also when they are deposited on low-cost slides, such as glass and coverslip, which are widely used in clinical diagnostics.
4. Conclusions
This work shows that FTIR spectra in the high wavenumber range (2750–3000 cm−1) are able to discriminate two different types of cells, as HUKE and SH-SY5Y cells. In this spectral range, the FTIR spectra are mainly characterized by peaks due to the asymmetric and symmetric stretching mode of the CH3 groups of cellular proteins and lipids (at about 2956 and 2870 cm−1, respectively), as well as by bands assigned to the asymmetric and symmetric stretching of the CH2 groups of lipids (at 2924 and 2850 cm−1, respectively). In particular, the obtained results suggest that the lipid content, assessed with respect to the protein content, is larger in HUKE cells than in SH-SY5Y cells.
The discrimination between the two types of cells occurs regardless of the substrate on which they were grown. In particular, thick glass slides, thin glass coverslip, CaF
2 crystals, and low-e slides were tested. By considering the results of PCA and ratiometric analysis, best discrimination occurs for cells grown on thick glass and low-e slides. The results obtained for thick glass slides are interesting because of the physical sturdiness, low cost, and large availability of such substrates; in fact, they are routinely used in clinical environment for cytological and histological diagnosis. The proposal to consider FTIR spectra in the high wavenumbers range for discriminating different types of cells has previously been reported by other authors [
16,
17]. Our findings not only support such a proposal, but also they are an important step towards the application of FTIR micro-spectroscopy for clinical diagnosis, particularly because they were obtained by a benchtop FTIR microspectrometer, which can be easily integrated into hospital environments. The next step to better promote the use of FTIR in diagnostics should concern the possibility of discriminating with this technique cells of the same type but with different degrees of pathology.


