Article

Polymer Type Identification of Marine Plastic Litter Using a Miniature Near-Infrared Spectrometer (MicroNIR)

1
Norwegian Institute for Water Research, 0349 Oslo, Norway
2
Shirshov Institute of Oceanology, Russian Academy of Sciences, 117997 Moscow, Russia
*
Author to whom correspondence should be addressed.
Appl. Sci. 2020, 10(23), 8707; https://doi.org/10.3390/app10238707
Submission received: 1 November 2020 / Revised: 27 November 2020 / Accepted: 30 November 2020 / Published: 4 December 2020
(This article belongs to the Section Environmental Sciences)

Abstract

:
Plastic pollution in the marine environment has turned into an important research topic in recent decades. Until recently, studies were often based on visual assessment only, which is not enough to draw any conclusion about the chemical nature of found plastic items and could lead to incorrect results. Standardized, fast, and efficient low-cost methods for marine plastic litter identification are urgently needed to monitor the occurrence and distribution worldwide. In this paper, we demonstrate that a miniaturized handheld near-infrared spectrometer—MicroNIR—can be used for on-site identification of different plastic polymers. A database containing polymer spectra of the most produced and reported polymer types in the marine environment was created including polyethylene (PE), polypropylene (PP), polyethylene terephthalate (PET), polystyrene (PS), polyvinyl chloride (PVC), polyamide (PA), polycarbonate (PC), polyurethane (PUR), and Silicone. Using spectral match value (SMV, included in the instrument software) for spectra analysis resulted in an accurate classification of all nine polymer types. The method was used for the identification of marine macro-, meso-, and microplastic litter collected on beaches in sediments and seawater and enabled the correct identification of marine plastic litter for macro-, meso- (96%), and microplastics (73%) with exception of totally black items and items less than 1 mm in size. The method and instrumentation presented here are very well suited to support “Citizen Science” marine litter monitoring projects during beach cleaning and similar activities.

1. Introduction

Contamination of the World Oceans by synthetic non-biodegradable litter has become a high-profile environmental concern. Of this debris, plastics make up the largest quantity, which is related to increased production of anthropogenic materials and growing dependence on plastic products [1]. Global production rates for 2003 were estimated at 299 million tons [2], while in 2018, this increased to more than 350 million tons [3]. According to recent forecasts, only 23% of plastic produced in 2020 will be recycled. Taken together, these numbers indicate the risk of increased plastic pollution.
Plastics in the environment can be classified by size into macro- (over 25 mm), meso- (25–5 mm), and microplastics (<5 mm). Microplastics may enter the ocean directly as primary products such as granules, pellets, fibers, and powders or through the fragmentation of macroplastics under the influence of biological, chemical, and physical processes producing microplastics. This type of microplastic is often referred to as secondary microplastics [4]. It is important to establish the origin, trajectory, and fate of plastics in the environment in order to understand not only the sources but also consequences for the environment, including wildlife. At this stage, harmful effects of plastic pollution on wildlife have already been described, but further information is needed [5]. These effects can be very different depending on the size, shape, and chemical composition of the plastic. For example, it has been shown that daphnia can swallow microplastic particles from polyvinyl chloride [6], which leads to a decrease in offspring and in body size. There is also strong evidence of the harmful effects of especially meso plastics particles on fish, seabirds, and animals [1]. Marine animals often confuse such particles with food. Seabirds are known to swallow different mesoplastics, especially transparent and white particles but also fibers, which accumulate in the digestive system, and eventually could lead to death [7]. In addition, particles of meso- and microplastics in the ocean are often chemically contaminated (absorbing heavy metals, persistent organic pollutants), that is, enhanced by the degradation of plastic in the marine environment [8].
Research on meso- and macroplastics is often limited to visual identification. As an example, recent studies of microplastic pollution of the beaches and in surface waters [9] only used visual methods for the qualitative analysis of collected plastic particles. Resin identification codes (RIC) can aid with the identification of the type of plastic. All commercial plastic products have triangular symbols indicating the type of material (plastic polymer) from which the product is made (Table 1). This is helpful for the identification of large marine litter items without any special equipment. About 73% of produced plastic in 2018 was from category RIC 1–6 of unified product labeling system (Table 1). All other types of plastic placed in one category RIC 7. Results of beach cleaning programs show that 70–80% of collected items represent various packaging and are made from plastic with RIC 1–6 [1]. This is most likely due to the fact that about 60% of plastics are less dense than surface seawater and can float freely on the surface and be washed ashore [10]. Production of polymers with RIC 7 increases year by year and their share in worldwide plastic production becomes larger replacing those with RIC 1–6. From 2015 to 2018, the share of produced plastic with RIC 1–6 decreased from 85 to 73%. This will lead to higher pollution with more complex plastic polymers from category RIC 7, including a broad number of polymer types.
RIC identification is not suitable for meso- and microparticles, as the RICs are not visible. Results of beach cleaning programs showed that more than 20% of found items are of unknown origin of polymer type, especially smaller fragments (meso- and microplastics), because they do not have RICs and only visual identification was performed. Visual identification alone is not enough to draw any conclusions on the chemical nature of the marine litter, and this makes source assignment impossible for meso- and microplastics. Raman or Fourier transform infrared (FTIR) spectroscopy is often used in combination with visual identification under the microscope in laboratory settings [11]. A common disadvantage of these methods is that they are expensive, require qualified staff, and have to be placed in the laboratory and thus cannot be used in the field.
Marine litter engages the general public, but this unexploited capacity has not been utilized to its full extent in, for example, the Citizen Science [12,13]. Standardized methods—sampling and identification—of marine plastic litter should be developed in such a way that the results can be fed into international monitoring strategies to map plastic pollution distribution. Only with large scale monitoring and source identification will mitigation measures be efficient. The development of easy to use “plug and play devices” to identify polymer types down to the microplastic range (1 mm) is expected to help bridge science to society. Recently, a number of hand-held near-infrared spectrometers were developed [14,15,16] that could be a good alternative to very expensive, large, and complicated techniques, i.e., FTIR. Some of these instruments have already been applied to polymer identification in line with the complex methods of classes classification. Examples are an identification system of plastic solid waste based on NIR spectroscopy in combination with support vector machine [15], with machine learning models [16] or hyper spectral imaging [17].
In this paper, we describe our experience in the application of a simple method to detect polymer type down to the micro range (1 mm) using a portable NIR spectrometer MicroNIR that is expected to be a major step towards large-scale monitoring of marine plastic litter.

2. Materials and Methods

2.1. Spectrometers

Two different spectrometers were used in the study:
  • A bench-top Fourier Transform Infrared Spectrometer (Spotlight 400 FTIR, Frontier ATR; PerkinElmer, Waltham, MA, USA), working in the range of 650–4000 nm, equipped with an attenuated total reflection.
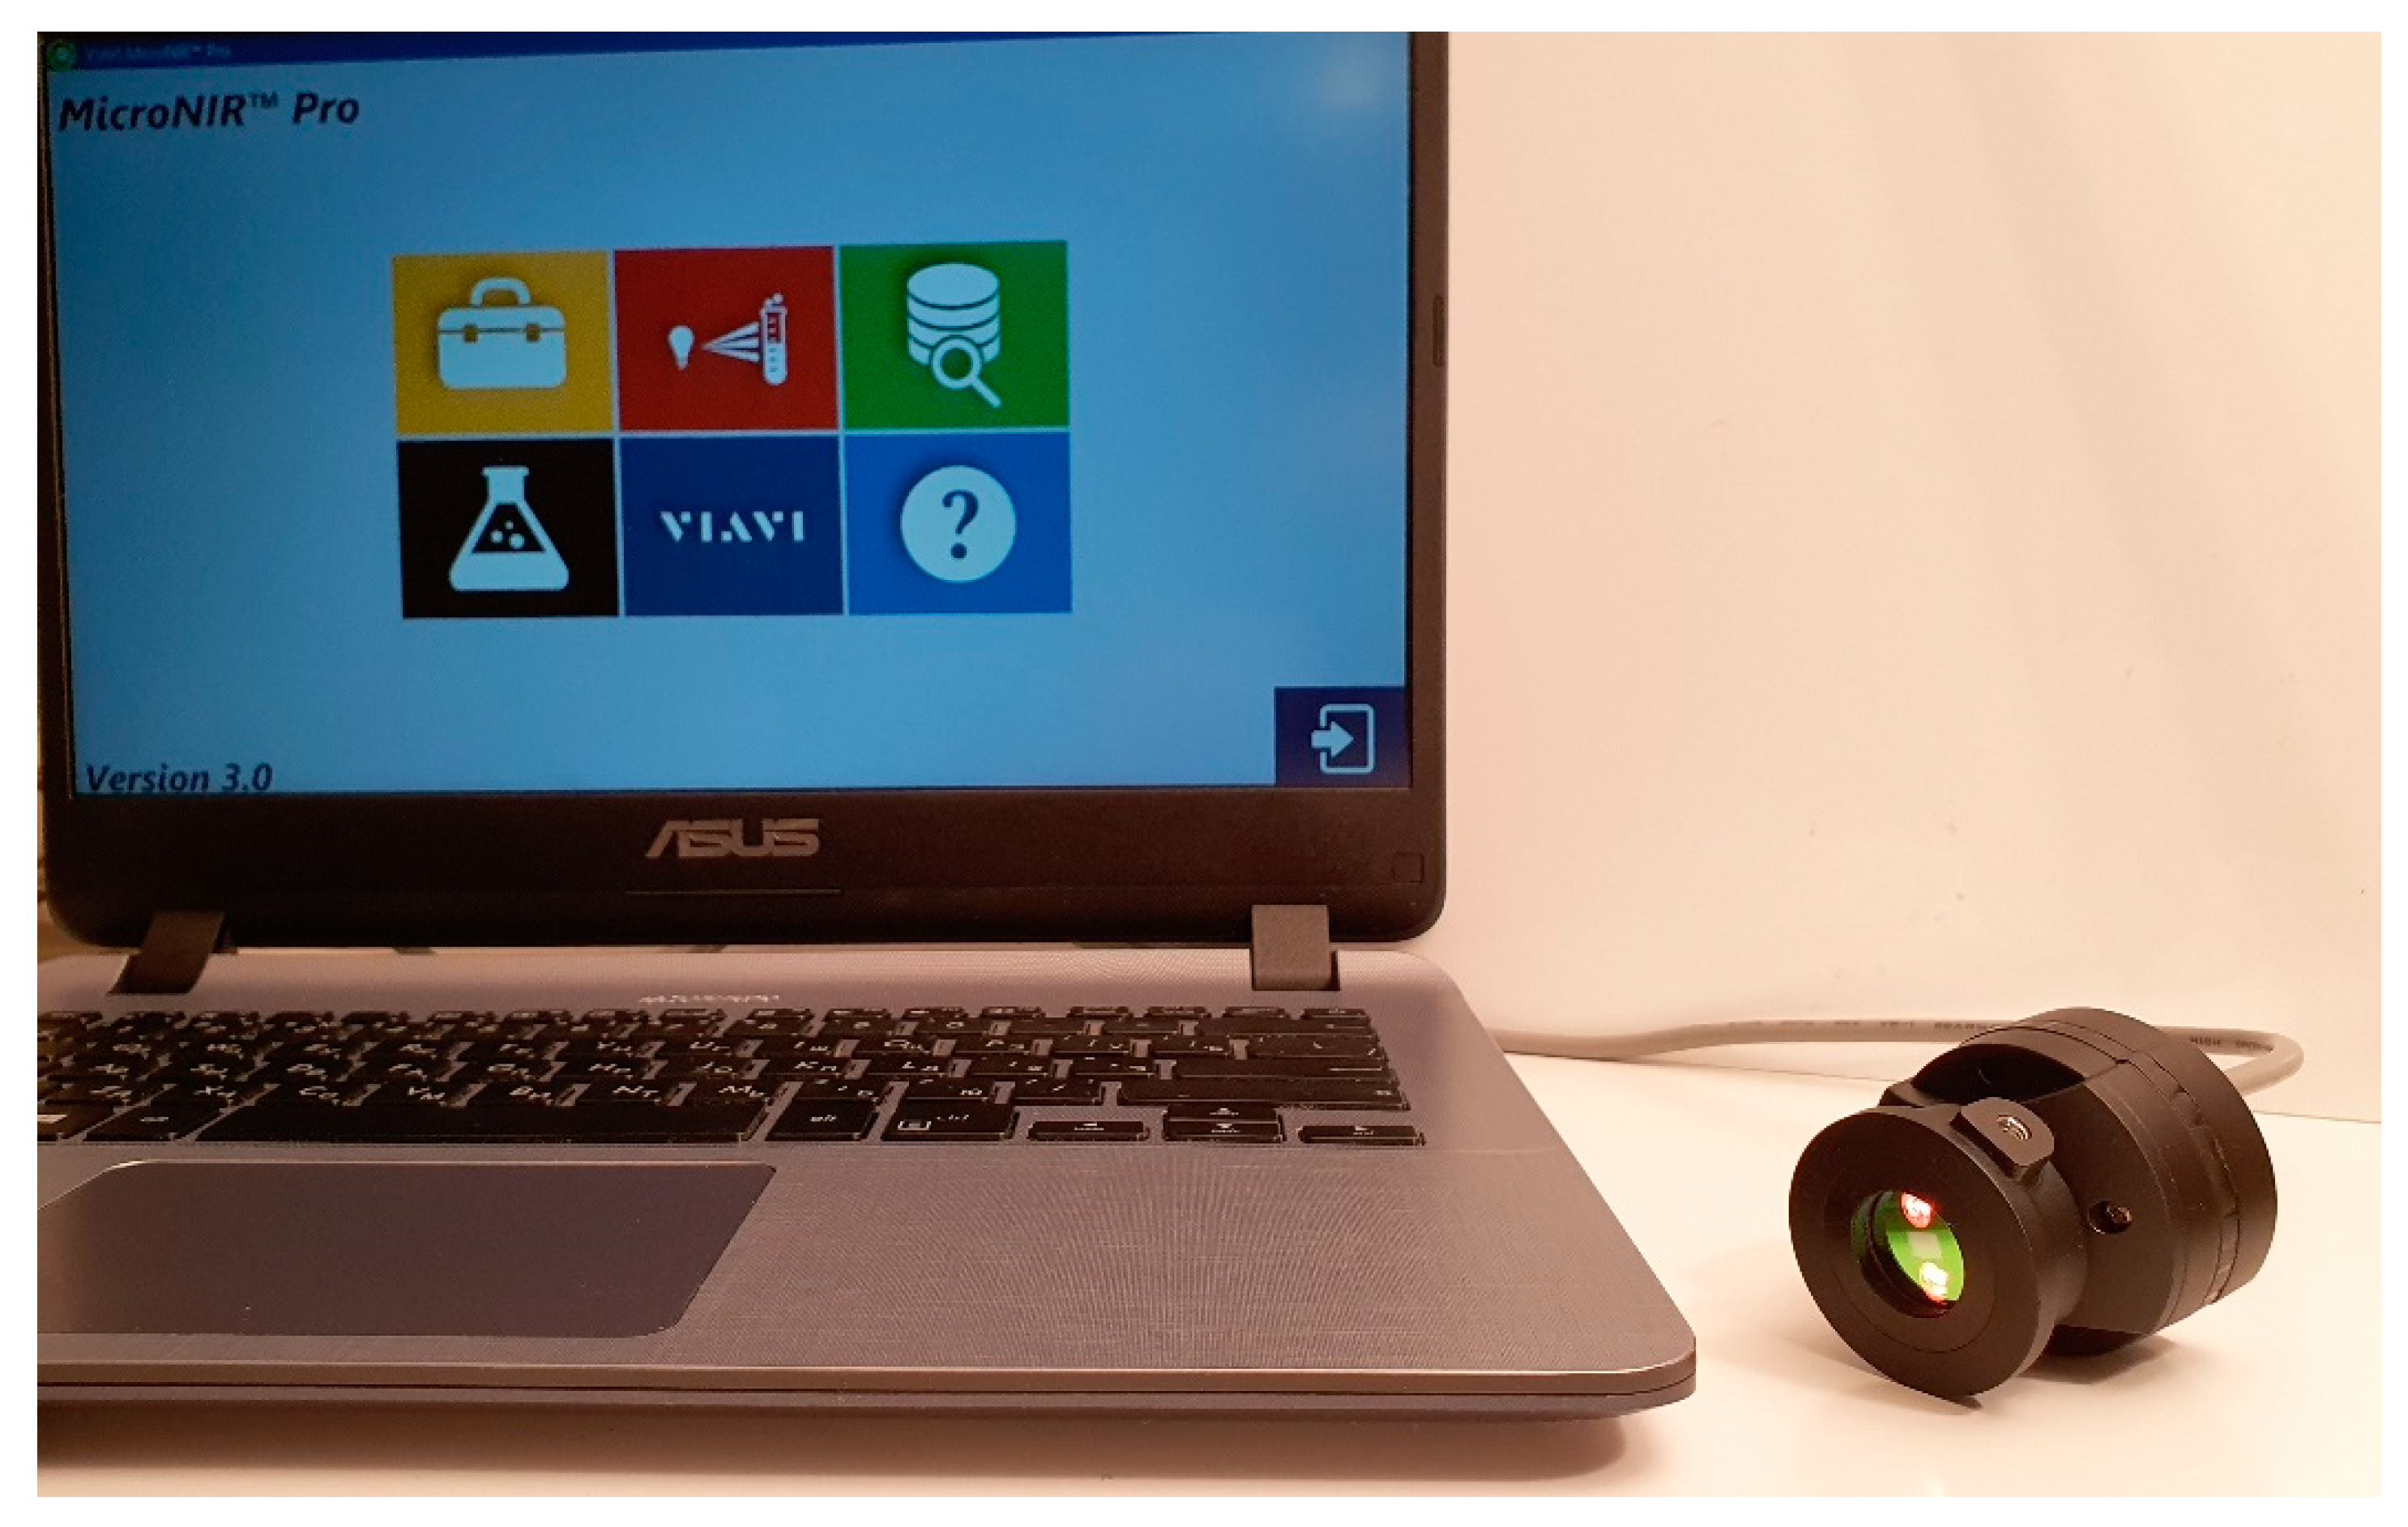
  • An ultra-compact device MicroNIR 1700ES (Figure 1), working in the range of 908–1676 nm, distributed by Viavi Solutions—Milpitas, CA, USA.
The MicroNIR dimensions are 45 mm in diameter and 42 mm in height, weighing about 60 g, and it is equipped with a 128-pixel detector array, which records data with a nominal spectral resolution of 6.25 nm. The system is composed by two small tungsten light bulbs as the radiation source and a linear-variable filter (LVF) directly connected to a linear indium gallium arsenide (InGaAs) array detector. The MicroNIR can be directly connected to a USB port of any laptop.
FTIR was used to ground-truth the applicability of a pocket NIR spectrometer for plastic type identification, as it is the most commonly used method for chemical characterization of potential plastics [11,18].

2.2. MicroNIR Library and Method of Identification

All spectra were collected using the MicroNIR Pro software version 3.0 (Viavi Solutions Inc., Santa Rosa, CA, USA) in the spectral range of 908–1676 nm. A 99% diffuse reflectance panel was used for the full range reference value, and a zero reference was taken by moving the MicroNIR into the open air. All spectra of small items (<2 cm) and transparent items were taken against the 99% diffusive reflectance panel.
To create a library, a minimum of ten spectra were collected for each polymer type. To study the spectra and methods transferability, three different MicroNIR spectrometers connected and powered by different computers and laptops were used to collect data from a set of 10 polymer types (Table 1).
Spectra processing and data analysis were performed using the MicroNIR Pro software. Standard normal variate (SNV) and second derivatives were applied to all spectra. Spectral match value (SMV) was used for further data analysis. SMV is a simple method to perform classification of different materials for identification [19]. Several spectra of different polymers were acquired and added to the different polymer libraries, and the mean spectra for each polymer type was calculated. The individual polymer libraries were compiled into an overall method, correlation coefficients were calculated for each polymer type library, and a cross-correlation table was created.
Measurement of new unknown samples takes several seconds; the method is easy to use also with little pre-knowledge of NIR spectrometry. The result of the measurement is presented with threshold coefficients, where the highest value indicates the best match.

2.3. Polymer Materials

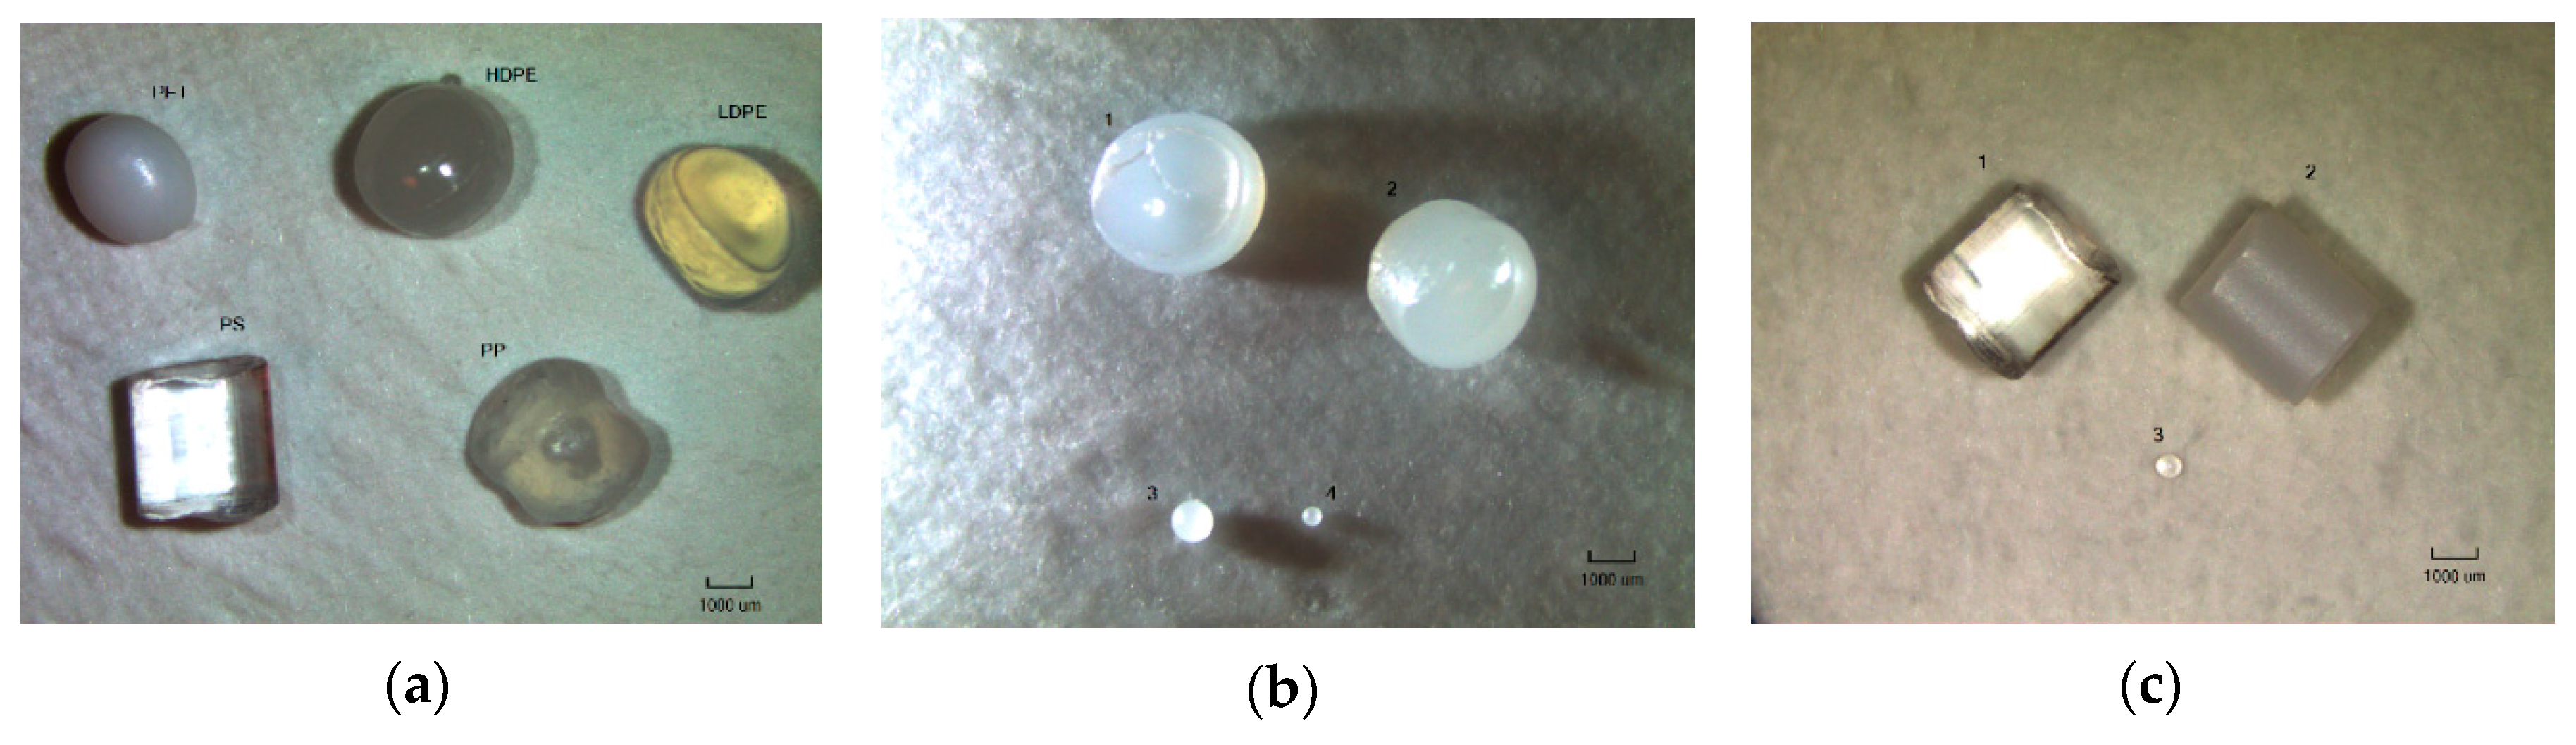
2.3.1. Industrial Reference Polymers

To create a library of reference material (RM) spectra, the most common 10 polymer materials were selected as samples: polyethylene terephthalate (PET), high density polyethylene (HDPE), polyvinyl chloride (PVC), low density polyethylene (LDPE), polypropylene (PP), polystyrene (PS), polyamide (PA), polycarbonate (PC), polyurethane (PUR), and Silicone (Table 2). Information on the prevalence of a different type of plastic in the marine environment was also taken into account. Each polymer type was represented by material from 2–3 different manufacturers and by items with different sizes, ranging from 0.25 mm powder to 1.5 cm fragments (Table 2, Figure 2). All used reference materials were transparent or white with exception of light-gray PET pellets. In case of spherical particles and pellets, spectra of one to ten items together were collected. The spectra of wood and cotton often found in marine samples were also added to the library. Two methods of identification were created based on the reference material library, RM_1 with 6 polymers with RIC 1–6 and RM_2 with 9 polymers with RIC 1–7.

2.3.2. Household Plastics

The methods of identification were tested on standard household plastic (HP) with known RIC (Table 3). Both transparent samples and color-added samples were identified. Household plastics with copolymer composition (copolymers of PS and PA) were also tested using the MicroNIR.
Obtained spectra of household plastic were added to the database, and a new method (HP_1) was created to control if color additives affect the classification of different polymer types.

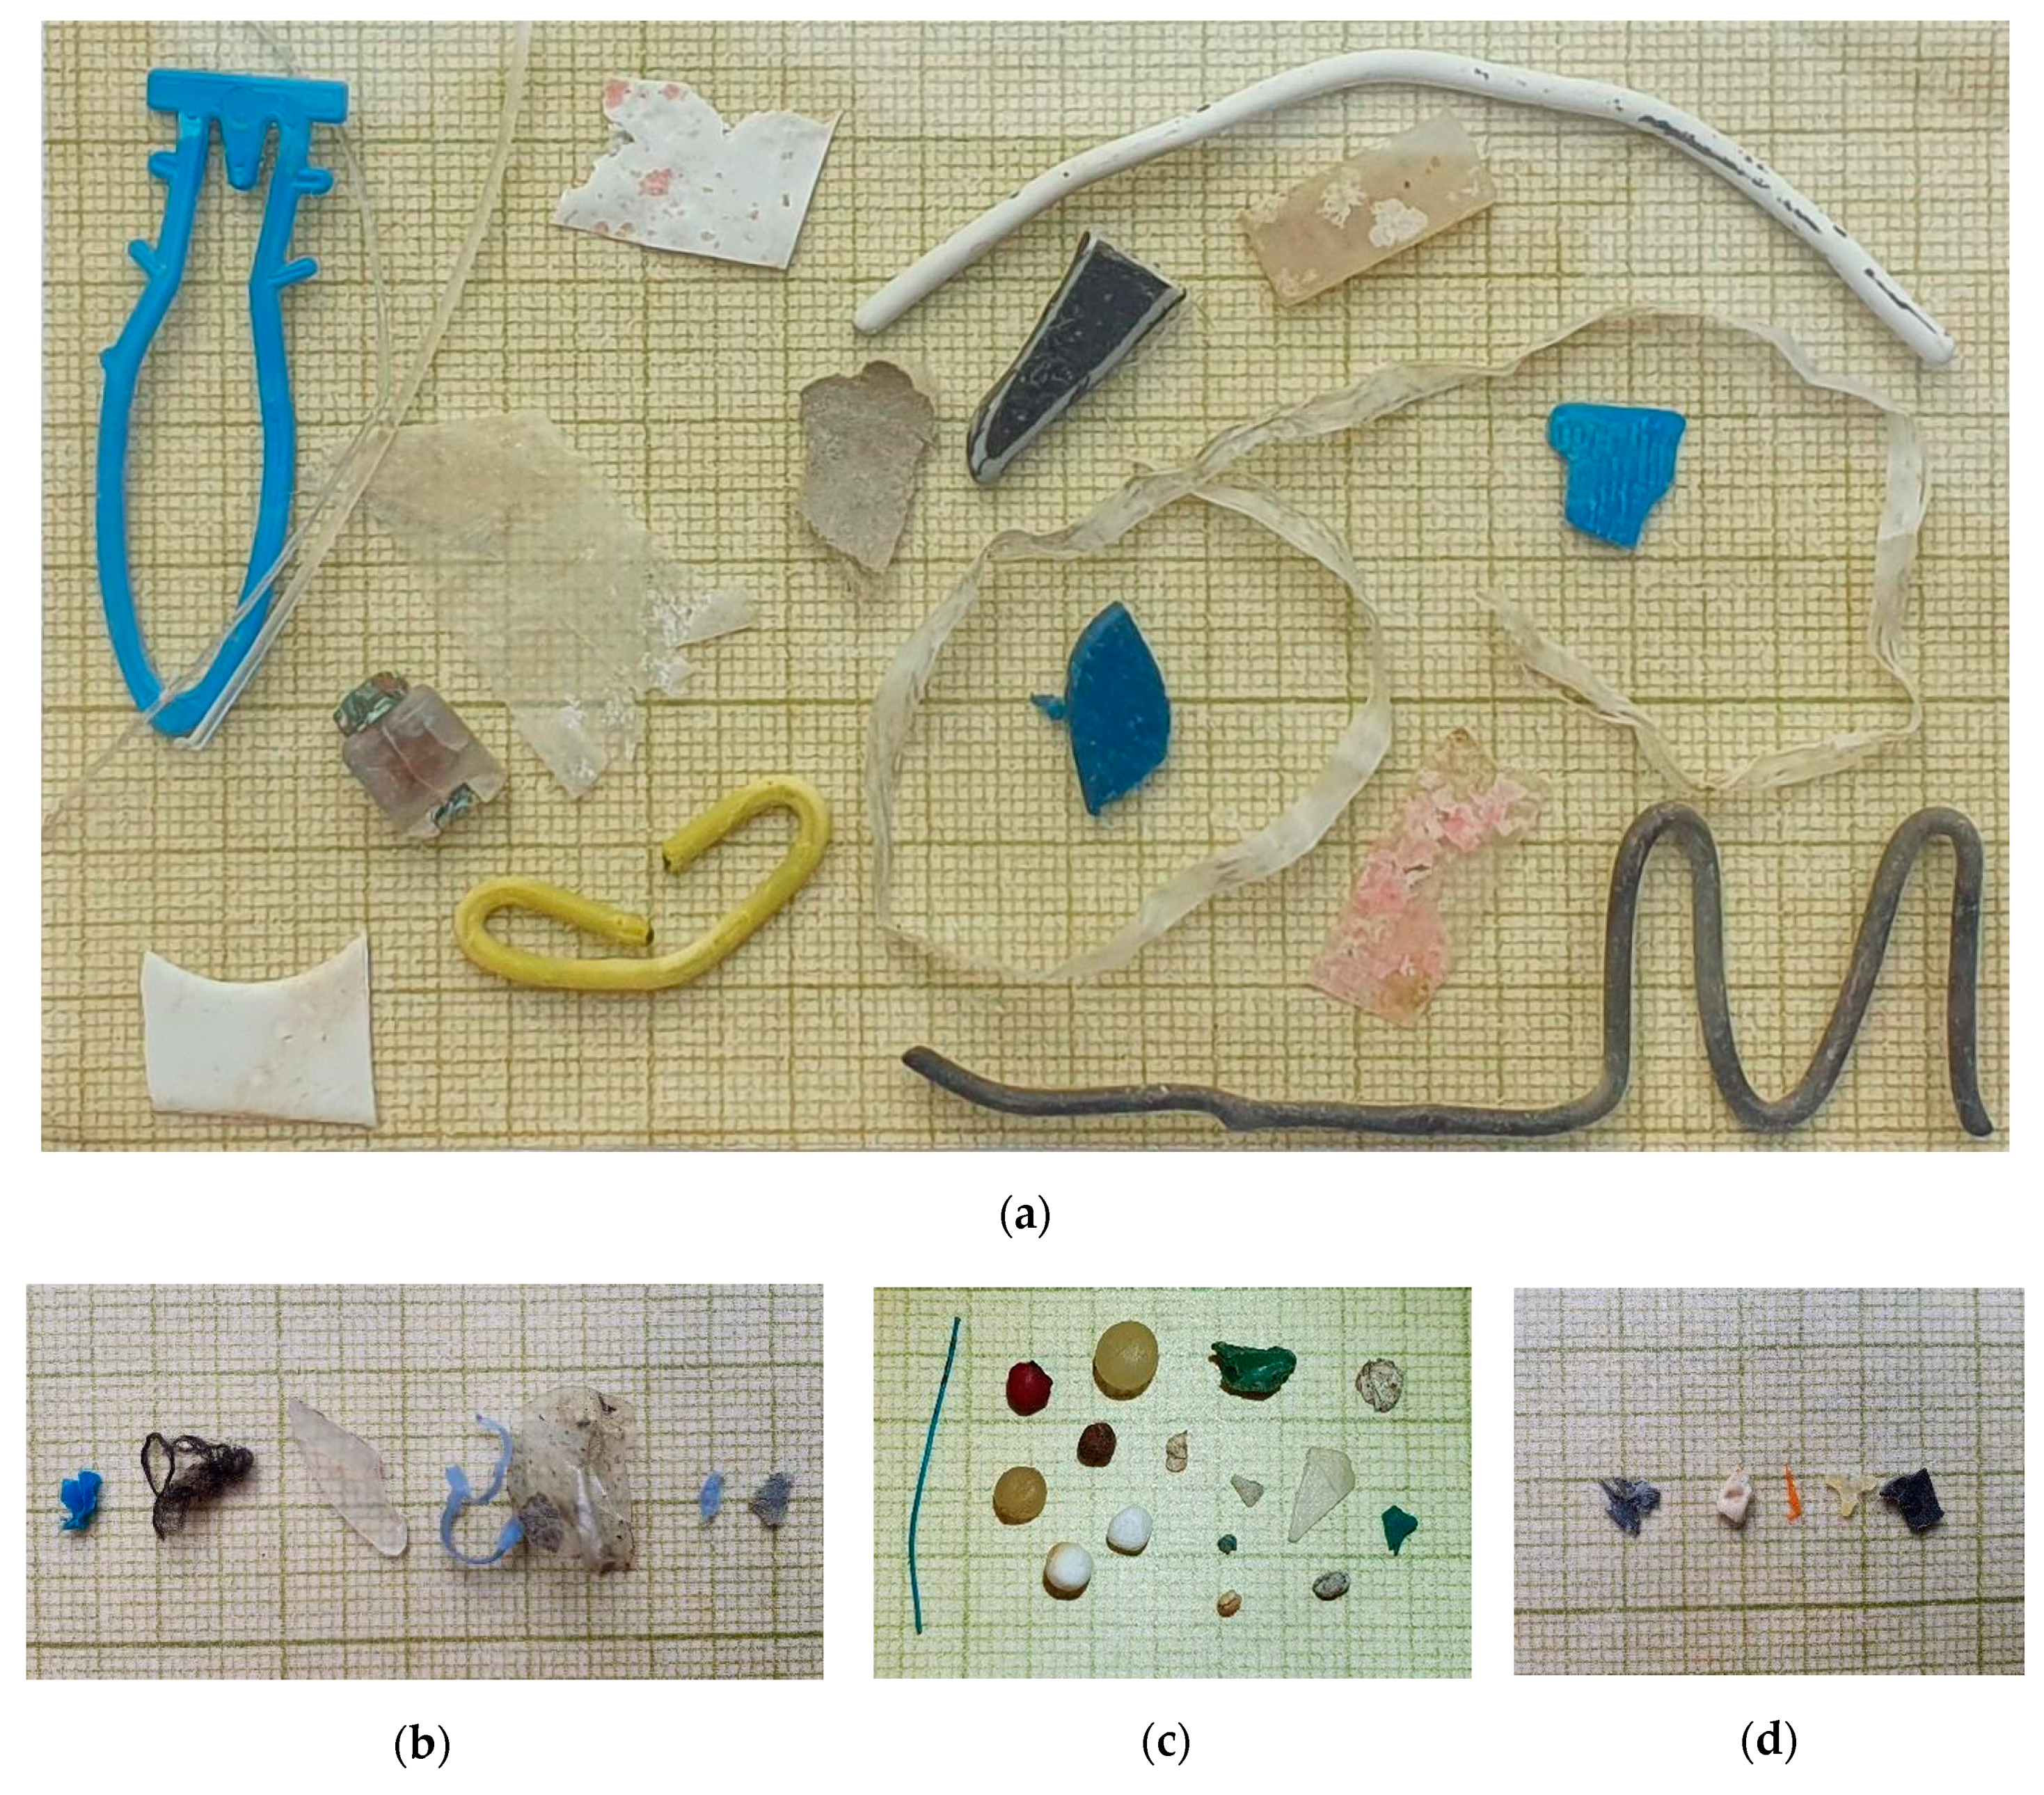
2.3.3. Environmental Samples

The method was applied to determine composition of marine plastic litter collected at different occasions:
  • On the beach and in coastal seawater on Crete in 2019 (35°24′24.56″ N, 25°1′6.55″ E). Size of fragments 1–15 cm (Figure 3a); without any kind of sample washing or pretreatment.
  • In the marine sediment in the Eurasian Arctic during the 78 cruise of the R/V “Akademik Mstislav Keldysh” in 2019. Size of fragments 0.4–7 cm (Figure 3b). Plastic samples were extracted from the sample matrix by washing the sediment on sieves (1 mm) with filtered distill water.
  • On Oslofjord beaches in 2019. Size of particles 1–5 mm (Figure 3c). Plastic samples were extracted from the matrix by density separation using a saturated solution of NaI.
  • On the sea surface water—floating particles, collected by neuston net in the Eurasian Arctic [21] and in the Atlantic Ocean in 2019 during the 78th and 79th cruises of the R/V “Akademik Mstislav Keldysh”. Size of particles 0.2–30 mm (Figure 3d). Plastic particles were extracted from the matrix by washing on sieves (0.2 mm) with filtered distilled water.
The accuracy of the identification by MicroNIR on site was verified using a Perkin Elmer ATR-FTIR bench top spectrometer in the laboratory.

3. Results

The reproducibility and data transferability were evaluated by collecting spectra of several reference material polymers from different manufacturers, with different particles size, and distance to the instrument’s lamps and detector by three different MicroNIR instruments connected to three different laptops. As shown in Figure 4, the different conditions of spectra acquisition do not affect the results and data obtained with different instruments, and computers can easily be merged in one database.

3.1. Libraries and Methods of Identification

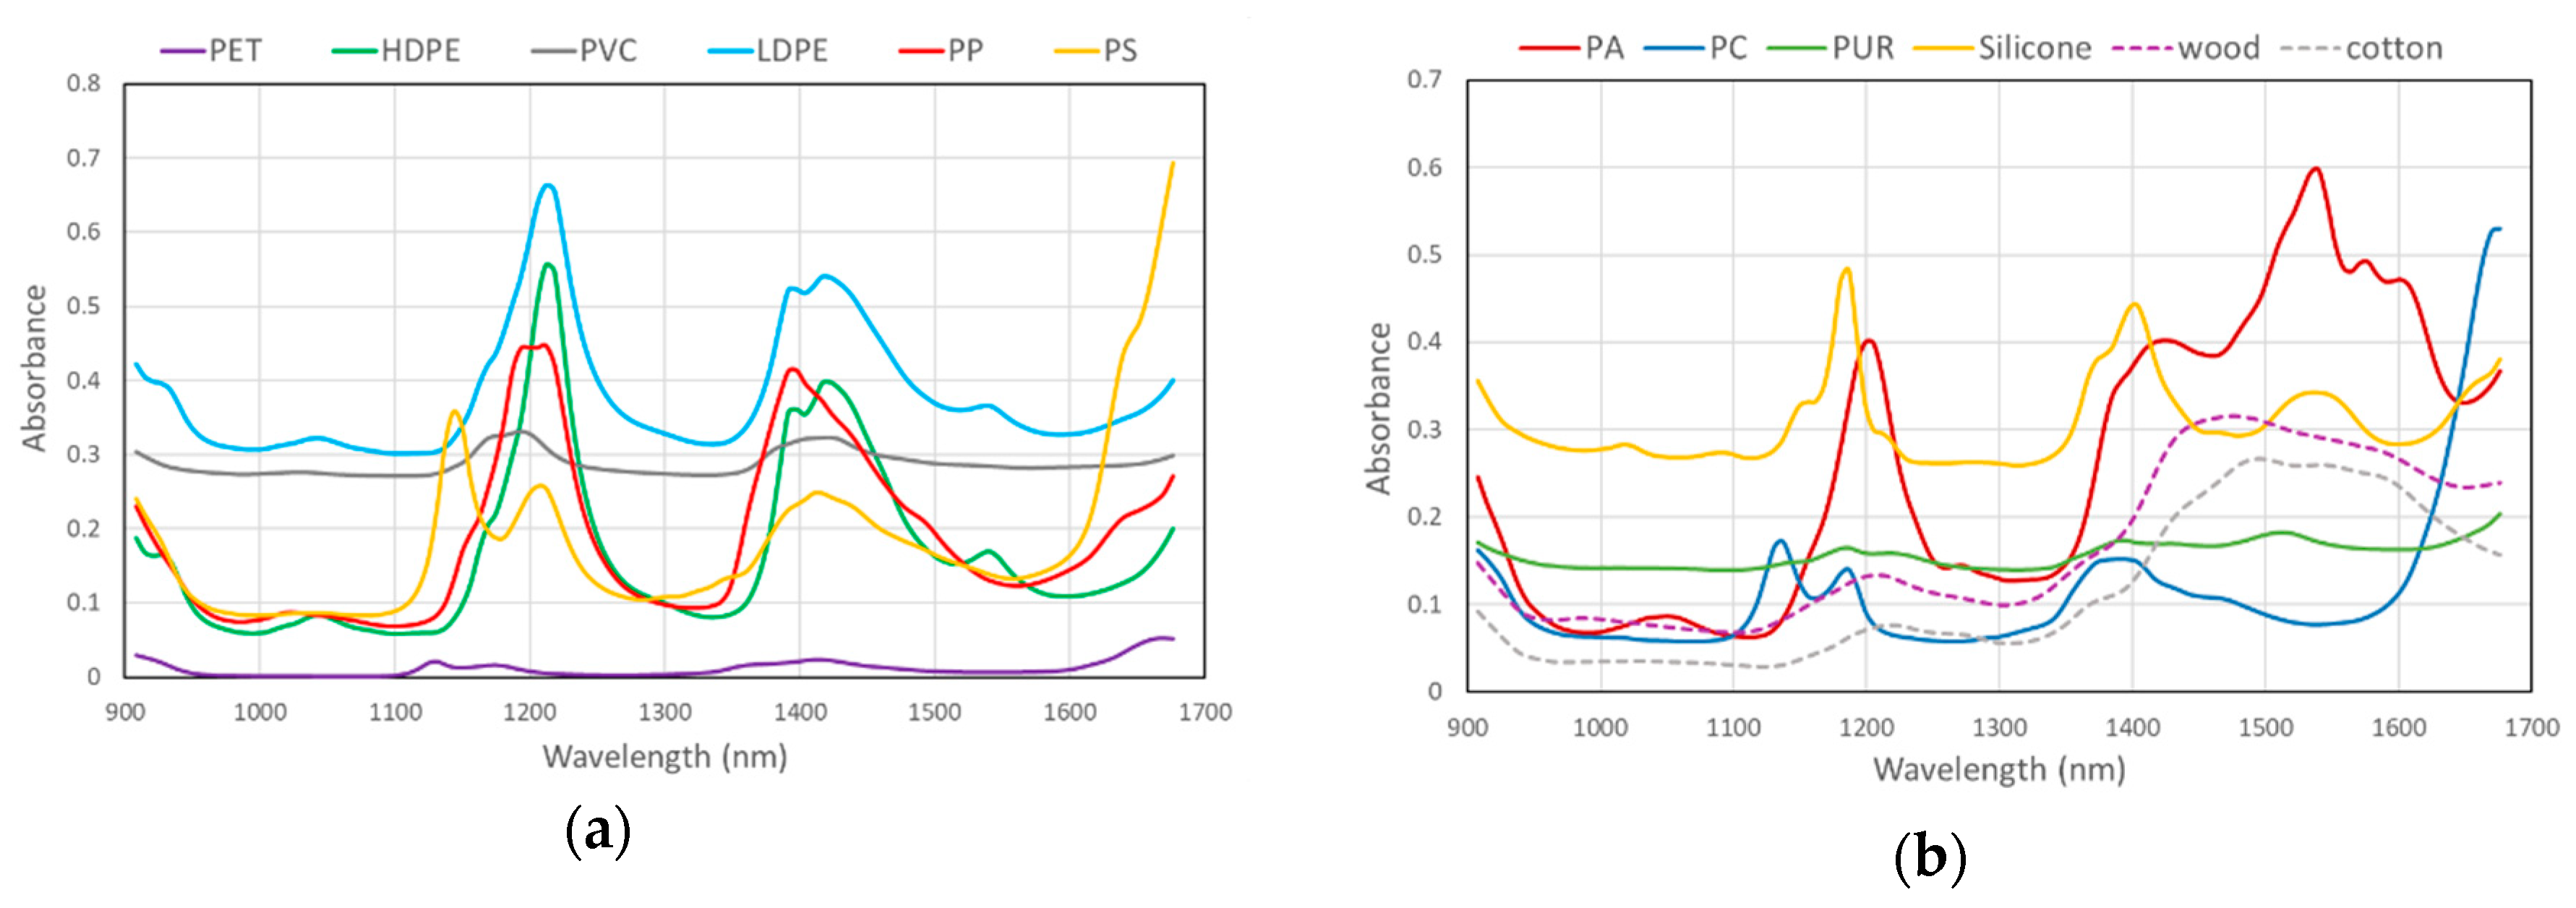
3.1.1. Reference Materials Library

The initial library consisted of six main polymer types (RIC 1–6, method RM_1). Application of SMV to raw spectra did not obtain adequate polymers separation, as some spectra were very similar in this wavelength range (Figure 5). For example, the threshold coefficient for PE and PP needed to be set to 0.95. Processing the spectra first by SNV followed by applying a second derivative function, largely improved separation capacity.
It was also shown that HDPE and LDPE could only be differentiated using a very high threshold coefficient (>0.995, Table 4). Therefore, we decided to join HDPE and LDPE in one type, PE. The highest correlation coefficient between other polymers was found for PP and HDPE, LDPE—0.53 and 0.60, respectively.
As the second step, the other four polymers (from category RIC 7) but representing the second most produced and most frequently found in marine environments were added to the library. These were PUR, PA, PC, and Silicone, resulting in a nine-polymer library, method RM_2. For this method, the highest correlation was found between PET and PC (0.61) and for PE and PP (0.56) (Table 5). The method applied resulted in complete classification of all nine polymer types included in the library. Correlation coefficients between polymer types with RIC 1–6 were not changed significantly after the addition of the other four polymers to the library (Table 4 and Table 5).
Spectra of wood and cotton were also added to the library as they are often found and are sometimes difficult to distinguish from plastic items. Spectra of these materials differ significantly from spectra of studied polymers (Figure 5); the addition of items in the library did not affect identification of other polymers. The presence of wood and cotton in the database is useful in case of studies of plastic in seawater, since they present very often in samples, and this will reduce any uncertainty in identification.

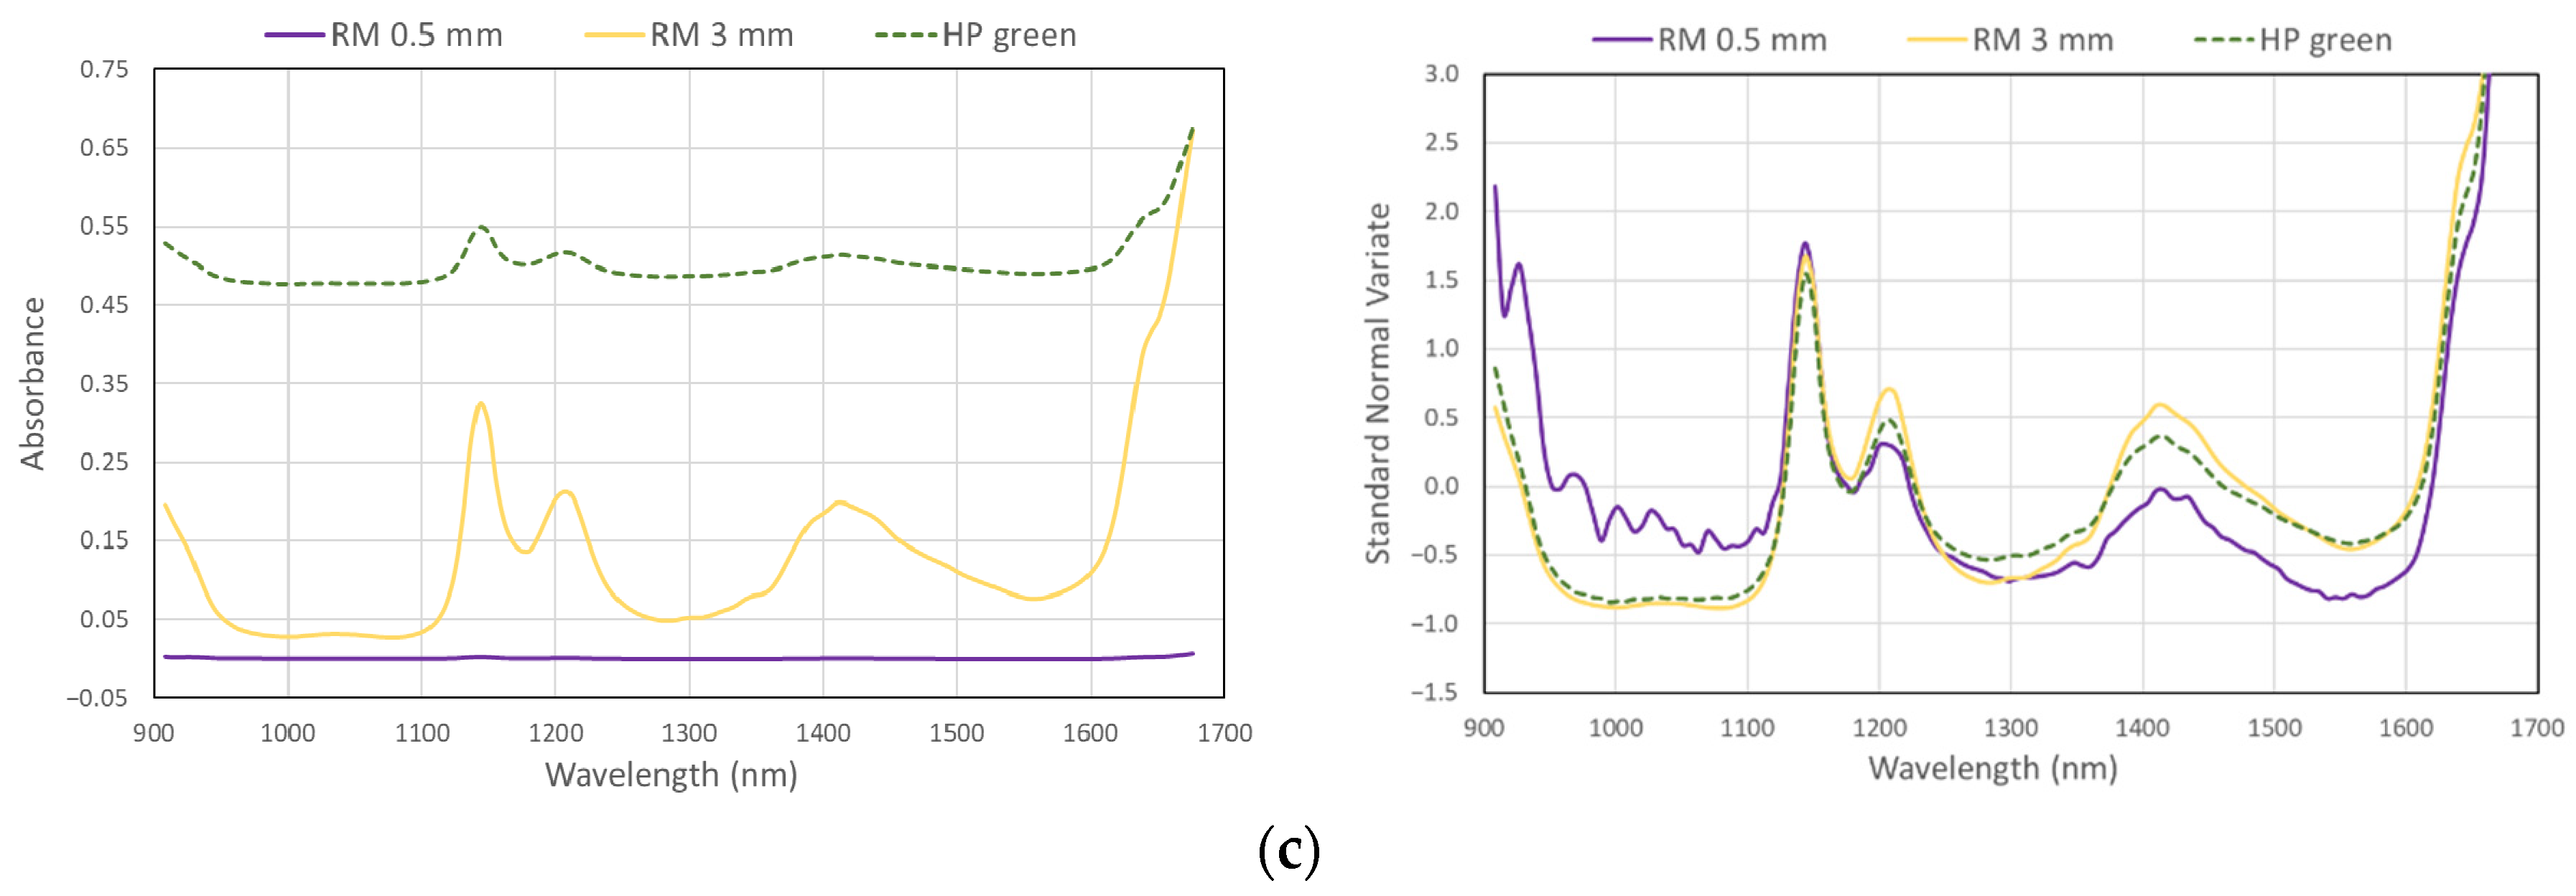
3.1.2. Minimum Size for Detection with MicroNIR

Minimum size of particle for polymer type identification with MicroNIR was found to be around 0.45 mm, wherein the particle should be placed exactly in the center of the diffuse reflectance panel and between two MicroNIR lamps (Figure 6).

3.1.3. Household Colored Plastic Library

To examine the effect of plastic color and/or any additivities on plastic type identification, method PM_2 was used to identify the composition of normal household plastic. Many different colored plastics and a variety of polymers were tested in the household (Table 3). Using the MicroNIR and method PM_2, we were able to identify all samples except for totally black items. Dark blue, dark green, dark silver, and dark brown items, although resulting in low signals from the MicroNIR, were correctly classified after spectra processing, and the characteristic peaks are clearly visible (Figure 6).
A new method for polymer type identification, HP_1, was created based only on household samples. Correlation coefficients between different polymers in the method HP_1 were very similar to the method RM_2 (Table 5 and Table 6). For both methods, the highest coefficient was found between PET and PC, and the lowest between PET and PS. The main difference between the two methods was found for PVC. This can be explained by a lower number of PVC household items included in the library and by the fact that polymer composition of PVC, which often includes copolymers.

3.1.4. Copolymer Type Identification

Several copolymers with known composition were tested. Two copolymers of PS were included: acrylonitrile butadiene styrene (ABS) a wide used copolymer made from 15–35% acrylonitrile, 5–30% butadiene, and 40–60% styrene, and styrene-acrylonitrile (SAN) consisted of 70–80% of styrene and 20–30% of acrylonitrile. Identifications using the MicroNIR resulted in PS as the identification result with 0.92 and 0.93 threshold coefficients, correspondingly. Another example of copolymer composition identification was tested using synthetic material with 80% of nylon and 20% of elastane, which was identified as PA. These results showed that the main component of the copolymer was identified by using the MicroNIR.

3.2. Marine Plastic Litter Identification

Eighteen plastic fragments consisting of different colors and sizes were isolated from beach and coastal water during a beach cleaning (Figure 2a, Table 7). Through visual assessment, it was not possible to define what original product was or what type of polymer the fragments consisted of except for one fragment of a PET bottle and several fishing lines. Using the MicroNIR, we were able to quickly establish seven different polymer types on site. We were able to correctly identify the polymer type of 17 of the 18 fragments with exception of one black fragment of PVC (Table 7), which was confirmed by ATR-FTIR. Although some of the fragments were dirty and/or old (weathered), this did not affect the ability of the instrument to identify them.
The developed method was further applied on 14 plastic fragments found in sediment in the Eurasian Arctic Ocean. These samples were measured on board the R/V “Akademik Mstislav Keldysh” during the 2019 Arctic expedition cruise. The size of fragments varied from 0.4 to 7 cm. All fragments polymer composition was correctly identified using the MicroNIR and consisted of eight PE fragments, four PP, one PET, and one PVC confirmed by FTIR in the laboratory following the cruise.
In addition, 41 plastic fragments in sand samples from Norwegian beached around the Oslo fjord were analyzed using MicroNIR. Average size of found items was 3.5 mm, with a size range of 1–5 mm; all fragments were relatively clean. MicroNIR analysis correctly identified the composition of 40 fragments, where PE had 25 items, PP 13, and PS two. Comparison with ATR-FTIR showed that MicroNIR analysis gave correct results for all fragments with the exception of one undefined black sample of PE.
In Table 8, the results of analysis using both MicroNIR and ATR_FTIR of 47 plastic floating items collected by surface trawling in the Eurasian Arctic are given. Three meso plastic fragments with size 10–30 mm and another 44 items in the microplastics range with sizes from 0.2–5 mm and average 2.5 mm were examined. Although many particles were covered with organic matter, 28 particles were defined correct on board the R/V “Akademik Mstislav Keldysh” using the MicroNIR, 17 items were not classified including to black fragments, nine thin fibers, and eight fragments with either length < 1 mm or extremely dirty fragments.
Finally, 66 floating meso and micro plastic particles (average size 4.6 mm, range 1.2–12 mm) were collected by trawling in the Atlantic Ocean. Identification was only done with MicroNIR on board, and no confirmation analysis was performed. Here, 47 particles were identified of which 34 were PE, 11 PP, and two PVC. In total, 19 particles were undefined including eight black fragments, six fibers, and five small items with lengths less than 1.5 mm and a width < 1 mm.

4. Discussion

Using the handhold MicroNIR spectrometer, two libraries of polymer material spectra and two methods of polymer type identification were created. One spectral library based on industrial reference materials and the other on household plastic with known polymer composition according to RIC codes. Correlation coefficients between studied polymer types are very similar for both libraries. The spectral database and method created from household plastic samples (with known polymer composition based on RIC) worked well as the method created from virgin reference polymer materials and pre-production pellets for polymer type identification of plastic litter. Color and other additives did not affect the efficiency of the polymer identification, the method also found that most dark colored plastics could be correctly identified using MicroNIR with the exception of completely black materials. Furthermore, the identification of samples with a copolymer composition resulted in correct identification of the main component of the copolymer although with weaker correlation coefficients with the spectra of the polymer present in the spectral library.
In this study, we have defined results of polymer identification with correlation coefficient > 0.7 as true and results with correlation coefficient < 0.4 as a lower limit, indicating that there is no match with the items and polymers included in the library. Results with coefficients between 0.4–0.7 may indicate that the sample might be a copolymer with no easily distinguishable primary polymer type (if these single polymers composition is less than 50%). For example, the evaluation of a sample from Crete that looked like a kitchen oilcloth and was made of two different layers (an unknown fabric and PVC) resulted in the low correlation coefficient, 0.48 due to a “mixed” spectra of the combination of materials.
This work shows that MicroNIR can be excellently used on site, down to the microplastic range. The lower particle size that can be detected was found to be 0.45 mm for reference materials. For real environmental samples the lower size limit was somewhat higher, and it was only possible to identify fragments larger than 1 mm. The reason for this could be related to the marine litter items being covered by organic matter, and especially for smaller particles, this results in distorted NIR spectra, which is critical for polymer identification. Although no further investigations in this study were done, procedures for organic matter removal and decomposition before measurements with MicroNIR are available [11]. One drawback of the use of MicroNIR on site is that it was not possible to identify thin fibrous materials. However, if fibers are long enough, the material can be concentrated by rolling the fiber into a ball and placing it in the middle of the MicroNIR camera window. This will allow the sampler to acquire spectra with enough quality to correctly identify the polymer composition.
In this work, a total of 186 items of marine plastic litter, with different colors and sizes, were studied. The MicroNIR along with the created databases and methods were able to correctly identify 96% of the larger marine macro- and mesoplastic litter (42 of 44 fragments) with exception of two black items. Seventy-three percent (104 of 142 items) of the smaller microplastic litter items were correctly identified with the MicroNIR method. Undefined items were mostly black (8%), fibers (10.5%), or fragments, which were either <1 mm or very dirty particles (8.5%). The results, however, indicate that MicroNIR can be excellently used to identify marine plastic litter with size >1 mm even on site or on board of research vessels. In addition, the use of the MicroNIR is easy and efficient when the right methods and databases are established and could be an excellent tool to be used in Citizen Science projects, adding extra value to marine registration protocols by filling the knowledge gap on the origin and sources of meso- and larger microplastics.
The focus of the study was to create a method of identification of the nine most used polymer types—PET, PE, PP, PVC, PS, PA, PC, PUR, and Silicone. Combining results from five different randomly performed studies revealed that PE fragments amounted to 51% of all found plastic items: PP—24%, PVC—9%, PET—5%, PS, PA, PUR—3–4% each, and PC—1%, showing the potential of using MicroNIR methods for marine litter identification. To improve results of copolymer identification, more polymer types could be added to the library, for example, Acryl, Teflon, and ABS. Several other options to achieve even better correlation coefficient for larger datasets containing more polymers or copolymers including the use of more advanced statistics (including principal component analysis) have only been partly examined. Iterative development of this instrument allows the stored spectra of the samples to be re-analyzed with new methods or larger databases.
Comparison of the described application of MicroNIR with another common technique such as FTIR spectroscopy [11,18] shows both advantages and disadvantages of the MircoNIR method. The use of MicroNIR in the field—at beaches and on-board vessels—showed good results for marine plastic litter identification, correctly identifying 96% of macro- and mesoplastics and 73% of microplastics. However, MicroNIR is not able to identify totally black items and items smaller than 1 mm. Conventional IR spectroscopy cannot capture spectra of completely black objects that absorb the signal [17]. For black items and items smaller than 1 mm, using more advanced methods, i.e., FTIR, is needed. FTIR is also needed for identification of copolymer composition where high resolution allows a detection of differences between spectra.
On the other hand, fast and inexpensive plastic identification methods are needed to support the growing number of marine litter studies. The inclusion of plastic type identification within these studies is greatly needed to support knowledge and direct mitigation strategies towards combating identified materials [11,21]. Recently, usage of miniature devices for plastic identification is actively developing for different purposes, mainly for plastic waste identification [14,15,16]. Previous studies with MicroNIR have focused on pharmaceutical analysis [22,23], narcotic material identification [24], and authentication of seafood [25].
The method presented here for the identification of marine plastic litter with MicroNIR is a fast, easy, and efficient low-cost method that can be used in the field, and it does not need qualified personnel to operate it. In this way, plastic identification with MicroNIR is very well suited to support “Citizen Science” projects, as shown here for the marine environment. The development of a handheld, easy-to-use NIR camera for the identification of polymers in the meso- and micro range (>1 mm) could also play a major role to gather more reliable data for source identification and subsequent mitigation of plastic and litter pollution to the environment.

Author Contributions

Conceptualization, S.P. and B.v.B.; methodology and analysis, S.P. and I.Z.; writing—original draft preparation, S.P.; writing—review and editing, I.Z. and B.v.B.; visualization, S.P.; supervision, B.v.B.; funding acquisition, B.v.B. All authors have read and agreed to the published version of the manuscript.

Funding

This research was funded by the Norwegian Ministry of Climate and Environment project RUS-19/0001 “Establish regional capacity to measure and model the distribution and input of microplastics to the Barents Sea from rivers and currents (ESCIMO)”; NIVA internal project 16130:3 microplastic; Skattefund project 291115; the Ministry of Science and Higher Education of the Russian Federation, themes 0149-2019-0003 and 0149-2019-0008; RFBR grant 19-55-80004.

Acknowledgments

Authors are grateful to Evgeny Yakyshev (NIVA), Amy Lusher (NIVA), Anna Gebruk (University of Edinburgh), and Ksenia Silvestrova (SIO RAS) for donations in kind of marine litter samples used in the study, to Emiliano Genorini (VIAVI Solutions) for technical support with MicroNIR Pro software and to Amy Lusher (NIVA) for discussion of this work.

Conflicts of Interest

The authors declare no conflict of interest.

References

  1. Thevenon, F.; Carroll, C.; Sousa, J. Plastic Debris in the Ocean: The Characterization of Marine Plastics and Their Environmental Impacts, Situation Analysis Report; IUCN: Gland, Switzerland, 2014; 52p. [Google Scholar] [CrossRef] [Green Version]
  2. Plastics—The Facts 2014/2015. An Analysis of European Plastics Production, Demand and Waste Data, Plastics Europe. Available online: https://www.plasticseurope.org/application/files/5515/1689/9220/2014plastics_the_facts_PubFeb2015.pdf (accessed on 7 May 2020).
  3. Plastics—The Facts 2019. An Analysis of European Plastics Production, Demand and Waste Data, Plastics Europe. Available online: https://www.plasticseurope.org/application/files/9715/7129/9584/FINAL_web_version_Plastics_the_facts2019_14102019.pdf (accessed on 7 May 2020).
  4. Li, J.; Liu, H.; Chen, J.P. Microplastics in freshwater systems: A review on occurrence, environmental effects, and methods for microplastics detection. Water Res. 2017, 363, 362–374. [Google Scholar] [CrossRef] [PubMed]
  5. Bucci, K.; Tulio, M.; Rochman, C.M. What is known and unknown about the effects of plastic pollution: A meta-analysis and systematic review. Ecol. Appl. 2020, 30, e02044. [Google Scholar] [CrossRef]
  6. Schrank, I.; Trotter, B.; Dummert, J.; Scholz-Böttcher, B.M.; Löder, M.G.; Laforsch, C. Effects of microplastic particles and leaching additive on the life history and morphology of Daphnia magna. Environ. Pollut. 2019, 255, 113233. [Google Scholar] [CrossRef]
  7. Wilcox, C.; Van Sebille, E.; Hardesty, B.D. Threat of plastic pollution to seabirds is global, pervasive, and increasing. Proc. Natl. Acad. Sci. USA 2015, 112, 11899–11904. [Google Scholar] [CrossRef] [PubMed] [Green Version]
  8. Turner, A. Heavy metals, metalloids and other hazardous elements in marine plastic litter. Mar. Pollut. Bull. 2016, 111, 136–142. [Google Scholar] [CrossRef] [PubMed] [Green Version]
  9. Cózar, A.; Martí, E.; Duarte, C.M.; García-De-Lomas, J.; Van Sebille, E.; Ballatore, T.J.; Eguíluz, V.M.; González-Gordillo, J.I.; Pedrotti, M.L.; Echevarría, F.; et al. The Arctic Ocean as a dead end for floating plastics in the North Atlantic branch of the Thermohaline Circulation. Sci. Adv. 2017, 3, e1600582. [Google Scholar] [CrossRef] [PubMed] [Green Version]
  10. Plastics Europe Market Research Group (PEMRG) and Conversion Market & Strategy GmbH, 2018. Available online: https://www.plasticseurope.org/en (accessed on 25 November 2020).
  11. Kershaw, P.J.; Turra, A.; Galgani, F. (Eds.) Guidelines for the Monitoring and Assessment of Plastic Litter and Microplastics in the Ocean; GESAMP Joint Group of Experts on the Scientific Aspects of Marine Environmental Protection; IMO/FAO/UNESCO-IOC/UNIDO/WMO/IAEA/UN/UNEP/UNDP/ISA: London, UK, 2019; 123p. [Google Scholar]
  12. Rambonnet, L.; Vink, S.C.; Land-Zandstra, A.M.; Bosker, T. Making citizen science count: Best practices and challenges of citizen science projects on plastics in aquatic environments. Mar. Pollut. Bull. 2019, 145, 271–277. [Google Scholar] [CrossRef] [PubMed]
  13. Citizen Science Projects on Plastic Pollution. Available online: https://www.arocha.org/wp-content/uploads/2018/01/citizen-science-projects.pdf (accessed on 15 October 2020).
  14. Yan, H.; Siesler, H.W. Hand-held near-infrared spectrometers: State-of-the-art instrumentation and practical applications. NIR News 2018, 29, 8–12. [Google Scholar] [CrossRef]
  15. Zhu, S.; Chen, H.; Wang, M.; Guo, X.; Lei, Y.; Jin, G. Plastic solid waste identification system based on near infrared spectroscopy in combination with support vector machine. Adv. Ind. Eng. Polym. Res. 2019, 2, 77–81. [Google Scholar] [CrossRef]
  16. Sagitto Combines Spectroscopy with Machine Learning Models, 2020 Sagitto Ltd. Available online: https://cloud.sagitto.com/ (accessed on 20 November 2020).
  17. Karlsson, T.M.; Grahn, H.; van Bavel, B.; Geladi, P. Hyperspectral imaging and data analysis for detecting and determining plastic contamination in seawater filtrates. J. Near Infrared Spectrosc. 2016, 24, 141–149. [Google Scholar] [CrossRef]
  18. Prata, J.C.; da Costa, J.P.; Duarte, A.C.; Rocha-Santos, T. Methods for sampling and detection of microplastics in water and sediment: A critical review. TrAC Trends Anal. Chem. 2019, 110, 150–159. [Google Scholar] [CrossRef]
  19. VIAVI Solutions Inc. MicroNIR Pro v3.0. User Manual; VIAVI Solutions Inc.: Santa Rosa, CA, USA, 2019; 308p. [Google Scholar]
  20. Hurley, R.R.; Lusher, A.L.; Olsen, M.; Nizzetto, L. Validation of a method for extracting microplastics from complex, organic-rich, environmental matrices. Environ. Sci. Technol. 2018, 52, 7409–7417. [Google Scholar] [CrossRef] [PubMed] [Green Version]
  21. Yakushev, E.; Gebruk, A.; Osadchiev, A. Microplastics in the Eurasian Arctic–the legacy of Atlantic waters and Siberian rivers. Commun. Earth Environ. 2020. accepted. [Google Scholar]
  22. Friedrich, D.M.; Hulse, C.A.; von Gunten, M.; Williamson, E.P.; Pederson, C.G.; O’Brien, N.A. Miniature near-infrared spectrometer for point-of-use chemical analysis. In Photonic Instrumentation Engineering; International Society for Optics and Photonics, SPIE: Washington, DC, USA, 2014; Volume 8992, p. 899203. [Google Scholar]
  23. Alcalà, M.; Blanco, M.; Moyano, D.; Broad, N.W.; O’Brien, N.; Friedrich, D.; Siesler, H.W. Qualitative and quantitative pharmaceutical analysis with a novel hand-held miniature near infrared spectrometer. J. Near Infrared Spectrosc. 2013, 21, 445–457. [Google Scholar]
  24. Sun, L.; Hsiung, C.; Pederson, C.G.; Zou, P.; Smith, V.; von Gunten, M.; O’Brien, N.A. Pharmaceutical Raw Material Identification Using Miniature Near-Infrared (MicroNIR) Spectroscopy and Supervised Pattern Recognition Using Support Vector Machine. Appl. Spectrosc. 2016, 70, 816–825. [Google Scholar] [CrossRef] [PubMed] [Green Version]
  25. O’Brien, N.; Hulse, C.A.; Pfeifer, F.; Siesler, H.W. Near infrared spectroscopic authentication of seafood. J. Near Infrared Spectrosc. 2013, 21, 299–305. [Google Scholar] [CrossRef] [Green Version]
Figure 1. Ultra-compact near infrared (NIR) spectrometer MicroNIR 1700ES.
Applsci 10 08707 g001
Figure 2. Plastic reference material used in the study: (a) PET, HDPE, LDPE, PS, PP; (b) HDPE in different sizes: 1, 2—3–4 mm, 3—0.9 mm, 4—0.45 mm; (c) PS in different sizes: 1, 2—3–4 mm, 3—0.5 mm.
Applsci 10 08707 g002
Figure 3. Examples of marine plastic litter collected at: (a) beach and coastal seawater on Crete; (b) marine sediment in the Eurasian Arctic Ocean; (c) Oslofjord beaches; (d) sea surface water in the Eurasian Arctic Ocean.
Applsci 10 08707 g003
Figure 4. Raw spectra (a) and processed spectra, standard normal variate (SNV) (b) of 7 polymer types reference material (RM) with different particles size, distance to the instrument’s lamps and detector, taken by three different MicroNIR instruments and laptops merged in one database.
Applsci 10 08707 g004
Figure 5. Raw spectra of polymers with RIC 1–6 (a) and polymers with RIC 7 together with wood and cotton spectra (b).
Applsci 10 08707 g005
Figure 6. Raw spectra (left) and processed spectra (SNV, right) of different size reference material (RM) and colored household plastic samples (HP), examples for HDPE (a), PP (b), and PS (c).
Applsci 10 08707 g006aApplsci 10 08707 g006b
Table 1. Worldwide production of different polymer types and their discovery on beaches.
Full NameShort NameRICDensity, g/cm3Worldwide Production, %Found on the Beaches, % of Total LitterProducts
Polyethylene terephthalatePET11.3–1.47.79Bottles for water, soft drinks, juices, cleaners, polyester fabric, etc.
Polyethylene high densityHDPE20.93–0.9712.211Toys, milk bottles, shampoo bottles, pipes, houseware, etc.
PolyvinylchloridePVC31.3–1.4510-Window frames, profiles, floor and wall covering, pipes, cable insulation, etc.
Polyethylene low densityLDPE40.91–0.9417.517Bags, trays and containers, agricultural film, food packaging film, etc.
PolypropylenePP50.895–0.9219.324Food packaging, sweet and snack wrappers, hinged caps, microwave containers, pipes, automotive parts, etc.
Polystyrene
Expanded polystyrene
PS
EPS
60.96–1.026.47Food packaging, building insulation, electrical and electronic equipment, inner liner for fridges, eyeglasses frames, etc.
PolyurethanePUR7
(other)
0.87–1.427.9-Building insulation, pillows and mattresses, insulating foams for fridges, etc.
Polyamide
Polycarbonate
Silicone
PA
PC
7
(other)
1.13–1.4
1.2
0.95–1.2
∑ = 19-Fishing lines, nylon fabric (PA); eyeglasses lenses, roofing sheets (PC); medical implants, surgical devices, membranes, protective coatings, etc.
Table 2. Polymer types and sizes of the reference materials used in the library.
Polymer TypeSize, mm
PET2–3 1
HDPE0.45 2, 0.9 2, 3–5 1
PVC0.25 3
LDPE3–5 1
PP1 1, 2–4 1
PS0.5 4, 3–4 1
PUR5–15 4
PA0.25 3, 3 1
PC3–4 1
Silicone5–0 4
1 Pellets, reference materials from Örebro University and BASEMAN project [20]; 2 spherical particles from Cospheric LLC; 3 Powder, Goodfellow Cambridge Limited; 4 industrial polymers with known composition.
Table 3. Types and colors of household plastic samples tested by MicroNIR and used for the library.
TypeColor
PETTransparent, white, orange, pink, red, light and dark blue, light and dark green, brown
HDPETransparent, white, yellow, orange, pink, red, light and dark blue, light and dark green, silver
PVCWhite, brown, gray
LDPETransparent, white, light blue, light green
PPTransparent, white, yellow, orange, pink, red, light and dark blue, light and dark green, brown, silver
PSTransparent, white, red, light and dark blue, light green
PURWhite, yellow, red, violet, blue, green
PATransparent, white, yellow, pink, light green
PCWhite, orange, pink, violet, blue, brown
SiliconeTransparent, yellow, pink, red, violet, light blue, light green
Table 4. Cross-correlation table for method RM_1, reference materials library, RIC 1–6.
PETHDPEPVCLDPEPPPS
PET1.00
HDPE−0.061.00
PVC−0.010.061.00
LDPE−0.080.9950.091.00
PP−0.190.530.210.601.00
PS−0.370.17−0.120.190.231.00
Table 5. Cross-correlation table for method RM_2, reference materials library, RIC 1–7.
PETPEPVCPPPSPURPAPCSilicone
PET1.00
PE−0.071.00
PVC−0.010.071.00
PP−0.370.560.211.00
PS0.070.18−0.120.221.00
PUR0.040.040.03−0.120.251.00
PA−0.120.350.470.030.130.011.00
PC0.61−0.24−0.100.390.140.43−0.111.00
Silicone0.04−0.21−0.150.33−0.040.45−0.070.451.00
Table 6. Cross-correlation table for method HP_1, household plastic library, RIC 1–7.
PETPEPVCPPPSPURPAPCSilicone
PET1.00
PE−0.011.00
PVC0.300.101.00
PP−0.070.490.401.00
PS−0.290.110.070.201.00
PUR−0.170.010.270.350.231.00
PA0.050.370.530.450.140.061.00
PC0.54−0.250.360.100.130.31−0.101.00
Silicone0.04−0.180.120.410.060.49−0.030.451.00
Table 7. Results of plastic fragments identification found on the beach and in coastal seawater on Crete.
ColorSizeMicroNIRATR-FTIR
1whitemacroPS0.99PS0.99
2transparentmacroPA0.98PA0.98
3transparentmacroPA0.96PA0.96
4transparentmacroPA0.94PA0.97
5whitemacroPE0.99PE0.99
6dark bluemesoPE0.90PE0.98
7transparentmacroPP0.97PP0.97
8transparentmacroPP0.88PP0.95
9bluemacroPP0.93PP0.99
10dark bluemesoPP0.80PP0.98
11transparentmacroPET0.85PET0.98
12transparentmesoPC0.94PC0.99
13whitemacroPVC0.87PVC0.76
14yellowmacroPVC0.86PVC0.73
15blackmacroundefined0.11PVC0.77
16graymacroPVC0.48PVC0.66
17dark graymacroPVC0.95PVC0.87
18whitemacroPVC0.76PVC0.87
Table 8. Results of microplastic identification found in the surface waters of Eurasian Arctic.
PolymerNumber of Defined ItemsMorphology
MicroNIR on BoardFTIR
PE1315all fragments
PP787 fragments, 1 fiber
PUR374 fragments, 3 fibers
PVC26all fragments
PET161 fragment, 5 fibers
PA03all fragments
PS22all fragments
Publisher’s Note: MDPI stays neutral with regard to jurisdictional claims in published maps and institutional affiliations.

