Article

Evolution of Whispering Gallery Modes in Li-Doped ZnO Hexagonal Micro- and Nanostructures

1
Materials Physics Department, Faculty of Physics, Complutense University of Madrid, 28040 Madrid, Spain
2
Laser Processing Group, Instituto de Óptica (IO-CSIC), Consejo Superior de Investigaciones Científicas, Serrano 121, 28006 Madrid, Spain
*
Author to whom correspondence should be addressed.
Appl. Sci. 2020, 10(23), 8602; https://doi.org/10.3390/app10238602
Submission received: 12 November 2020 / Revised: 27 November 2020 / Accepted: 27 November 2020 / Published: 1 December 2020
(This article belongs to the Special Issue Laser Spectroscopy)

Abstract

:

Featured Application

The investigated materials have great potential for integrated optoelectronic devices. The possibility to integrate them into the same material as optical resonator and light guide opens the door to the fabrication of highly compact devices.

Abstract

The formation of optical cavities in Li-doped ZnO nanostructures was investigated. By means of the vapor–solid method, long micro- and nanostructures with a hexagonal cross-section were grown. These morphologies were favorable for Fabry-Pérot and whispering gallery modes to appear. A variety of structures with different sections was studied using µ-photoluminescence in both the transverse electric (TE) and transverse magnetic (TM) polarizations, showing well-pronounced optical resonant modes. The results showed a dominance of whispering gallery modes that were in good agreement with the calculated refractive index. The quality factor (Q) and finesse (F) were estimated, which demonstrated the quality of Li:ZnO structures as optical cavities.

1. Introduction

ZnO is a well-known material with applications in very different fields from photonics to cosmetics. A wide bandgap, relatively high refractive index, large exciton binding energy, and non-ohmic behavior are behind many of these applications. A very good review about this material and its applications was published by Özgür et al. [1]. In particular, the lasing capabilities at room temperature have received a lot of attention in the last few years, with special attention being paid to hexagonal structures, rods, plates, or nails at the micro- and nanoscale [2,3]. Resonant cavities play an important role in a variety of devices, such as musical instruments or microwave generators; however, in the last few years, the need for miniaturized devices has focused the attention on optical micro- and nanocavities. Dielectric whispering gallery resonators are the focus of this application. Typically, they are microstructures with disk, cylindrical, or spherical shape, in which the light circulates around the lateral walls, causing multiple internal reflections. This effect usually leads to high Q factors, and consequently, low lasing threshold powers. The wurtzite crystal structure offers unique properties for creating microcavities for this purpose [2,3,4,5,6,7].
In elongated structures, such as the hexagonal rods obtained using ZnO, different resonant modes may appear. The easiest is, of course, the Fabry-Pérot mode that is established along the structure due to the reflection at both ends of the structure. However, although there are papers that report the use of Fabry-Pérot modes for optical applications [8], these modes are not optimal for lasing or resonant cavity applications due to the low reflectivity for normal incident light of the end facets. Much better conditions are obtained when the confinement is produced in the cross-section of the structure. The resonant modes would then be established on the perimeter of the rod and propagate along the structure. As shown in the scheme of Figure 1, in a hexagonal cavity, three types of optical modes can be set, each with a different optical path, hence giving rise to different resonance conditions.
In most cases, the observed resonances are compatible with whispering gallery modes (WGM1) and quasi-whispering-gallery modes (WGM2). The corresponding equations for the wavelength position of the resonances, depending on the polarization (TM—transverse magnetic, TE—transverse electric) and the optical mode, may be written as [5,9,10]:
λ T M = n · δ o p N + 6 π · a r c t a n ( 1 n 3 n 2 4 ) ,
λ T E = n · δ o p ( N 3 ) + 6 π · a r c t a n ( n 3 n 2 4 ) ,
for WGM1, and:
λ Q u a s i T M = n · δ o p N + 3 π · a r c t a n ( 1 n n 2 4 3 ) ,
λ Q u a s i T E = n · δ o p ( N 3 2 ) + 3 π · a r c t a n ( n n 2 4 3 ) ,
for WGM2, where N is the interference order, n the refractive index and δop is the optical path.
Previous work has shown wave-guiding behavior in Er- and Li-codoped ZnO that were assigned to Fabry-Pérot and whispering gallery modes [11]. Then, we had a particular interest in investigating the behavior of the Li-doped structures when no rare earth (RE) dopant is present. Furthermore, some works have reported an improvement in microsphere optical resonant cavities with Li doping [12]. In this work, the evolution of the whispering gallery modes found at the cross-section of ZnO:Li elongated structures was studied. It was found that not all the possible resonant cavities in these structures had the same behavior. In this paper, the evolution and quality of the resonant peaks in relation to the size and shape of the resonant cavity and to the reflectance efficiency of the facets are described. It was shown that doing measurements that mapped the evolution of the optical resonant modes along the length of the structure will helped to identify the regions with resonant cavities that had better performance for applications such as lasing [2,3,13,14], sensors [12], immunosensors [15], or optical filters [16,17,18].

2. Materials and Methods

The micro- and nanostructures were grown using the vapour–solid method (VS). The initial precursor material was composed of ZnS (90 wt%) (Sigma-Aldrich, 99.99% purity, Saint Louis, MO, USA) and Li2O (10 wt%) (Alfa Aesar, 99.5% purity, Haverhill, MA, USA). The powders were homogenized by milling them for 5 h at 180 rpm in a centrifugal ball mill (Retsch S100, Haan, Germany) and compacted to form disk-shaped samples. Then each sample was placed in a horizontal tubular furnace (C.H.E.S.A. Microtest, Madrid, Spain) at 950 °C for 10 h under a constant N2 flow.
For an initial content below 10 wt%, the resonances are less defined. In a previous work [19], it was shown that the incorporation of Li in the growth process of the ZnO structures produces a change in the morphology. It is for a Li2O starting content of 10 wt% when the best results in terms of obtaining intense and defined optical resonant modes are found. Therefore, this study was focused on the structures obtained starting with a 10 wt% of Li2O.
The optical resonances were measured by recording the photoluminescence signal coming from different points of the nanostructures. The system used to perform the µ-photoluminescence (µ-PL) measurements was a confocal microscope Horiba Jobin Yvon LABRAM-HR (HORIBA Jobin Yvon, Villeneuve d’Ascq, France). A He-Cd laser was used to excite the sample with a wavelength of 325 nm. The laser was focused onto the sample using an LMU-40X-NUV Thorlabs objective (0.47 Numerical Aperture - NA), and the scattered light was also collected using the same objective. The excitation and collection points on the sample were the same. The collected PL signal was analyzed using a 600 lines/mm grating and recorded with an air-cooled charge-coupled device (CCD) camera. For obtaining the µ-PL maps, a step size of 2 µm was employed. The PL spectra were analyzed using Labspec 5.0 software (France, Labspec version 5.0). All the measurements were done at room temperature. Morphological images and thickness measurements were recorded using an FEI Inspect (FEI Company, Eindhoven, Netherlands) scanning electron microscope (SEM) in secondary electron (SE) mode operating at accelerating voltages of 15–20 keV.

3. Results and Discussion

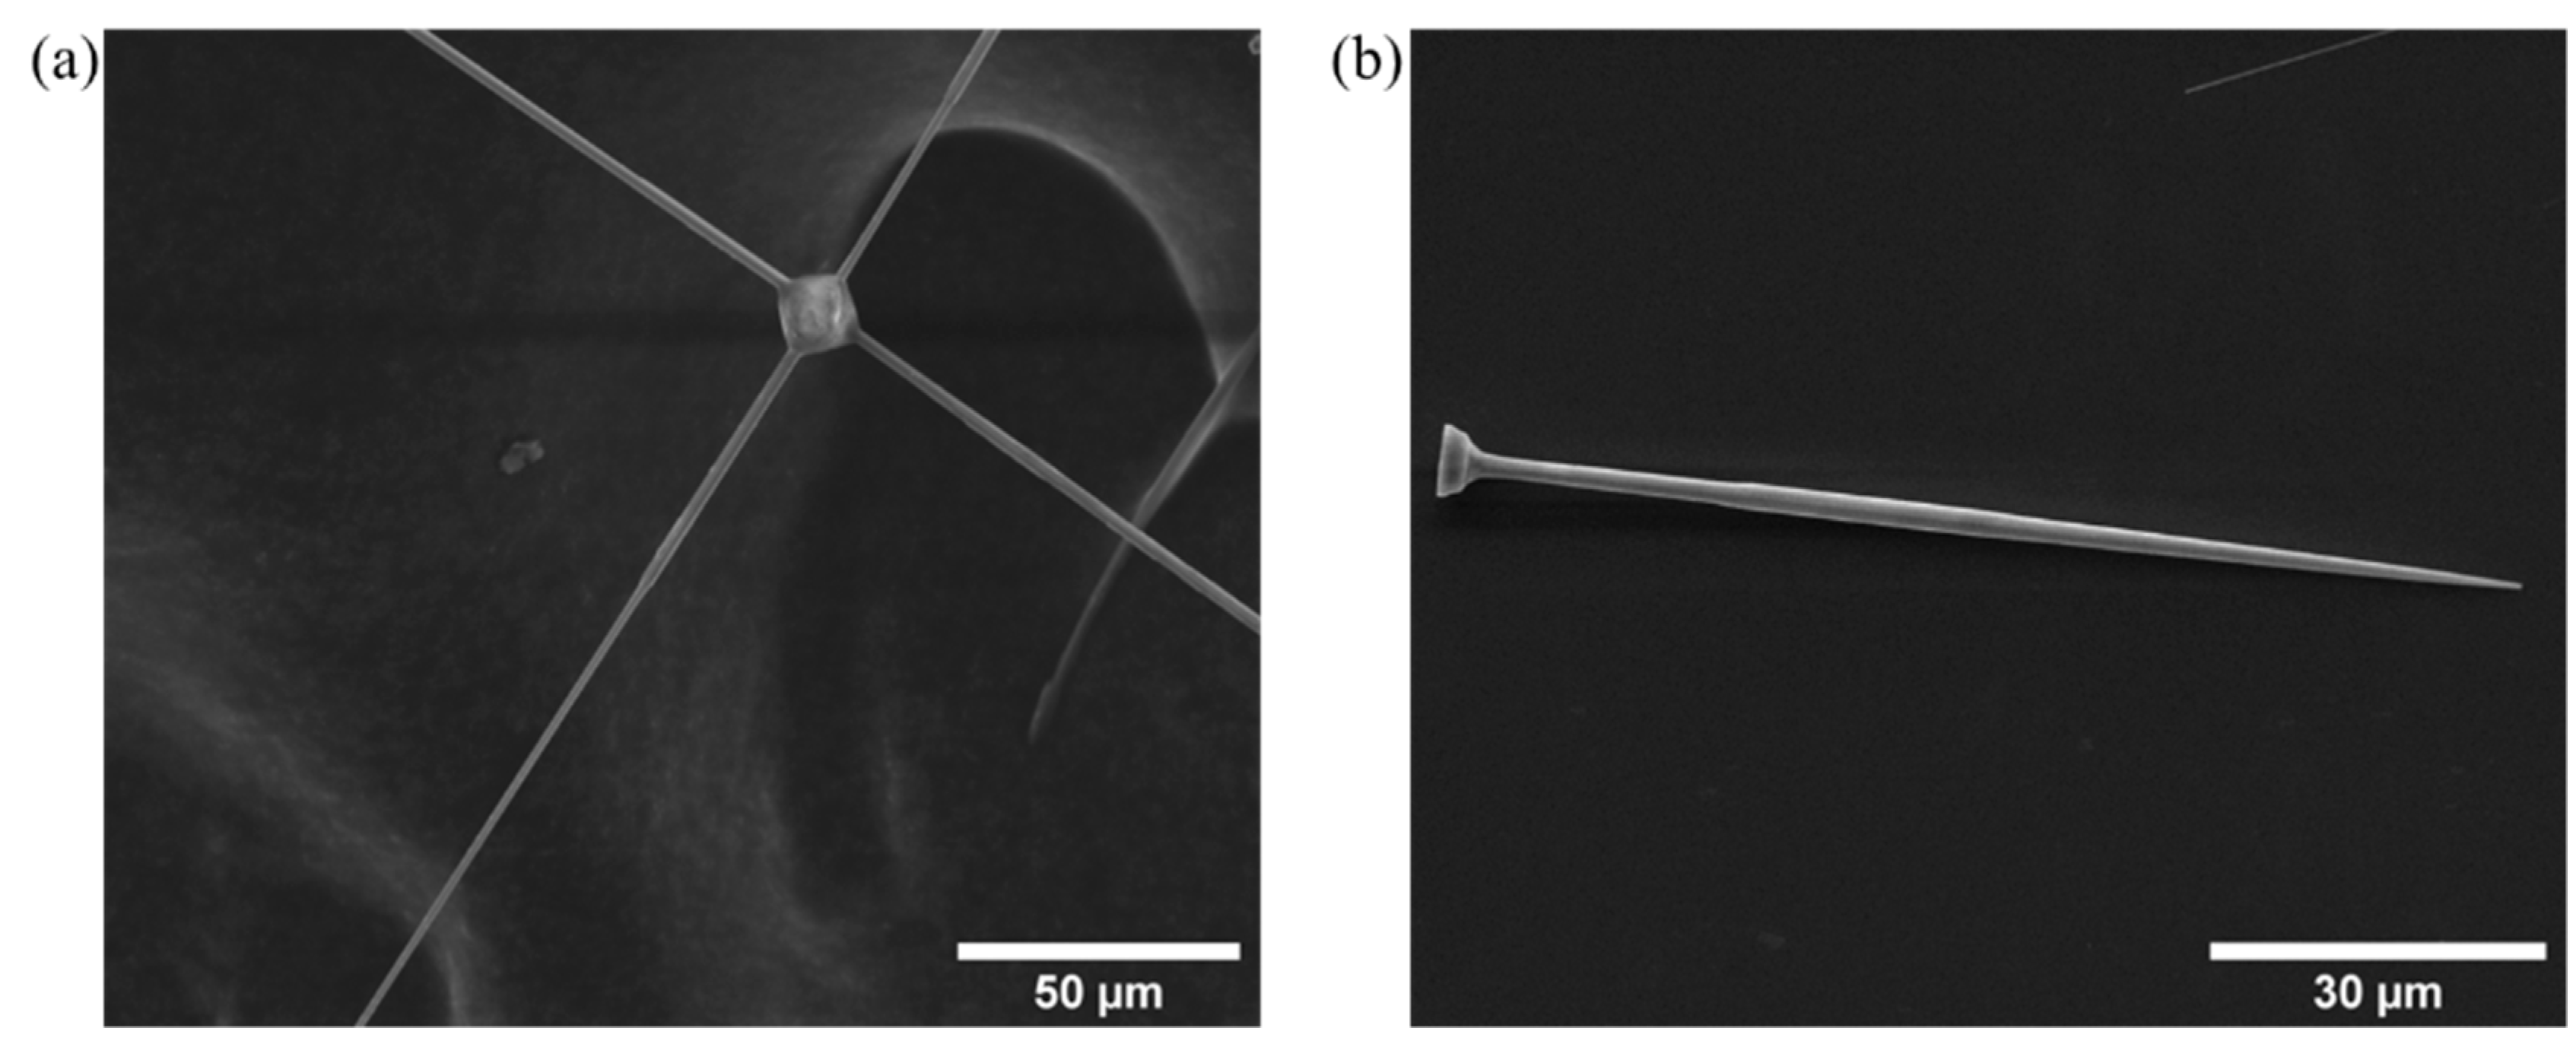
Two main morphologies were studied, as shown in Figure 2. Figure 2a shows long tapered rods that appeared to grow from a central ball. The rods had a hexagonal section ranging 1 to 2 μm, tens of microns in length, and forming an angle of 90° to each other. The rods emerged from the vertices of a central, almost square-shaped ball. X-ray microanalysis and X-ray diffraction showed that these balls were formed of Li2SO4, constituting the only regions in which residual S could be detected [19]. As shown in Figure 2b, the second morphology studied consisted of long tapered nails, with a hexagonal cross-section size between 1 and 2 μm and lengths around 100 μm. The heads of the nails were also hexagonal with varying cross-section sizes (2 to 5 μm approximately) and around 1 μm in height.
Both kinds of structures showed interesting behavior as resonant cavities, which were formed at the transversal section of the structure. Although the behaviors of both kinds of structures were different, some common features are worthy of highlighting prior to a more detailed analysis. Changes in the shape and size of the optical cavity produced a change in the position of the optical resonances; then, rod tapering had a visible effect on the resonant behavior. An increase in the diameter led to a shift of the resonant peak toward longer wavelengths and a decrease led to a shift toward shorter wavelengths. On the other hand, the smaller the cavity, the sharper and more separated the resonant modes.
Let us begin the analysis of the rods. 
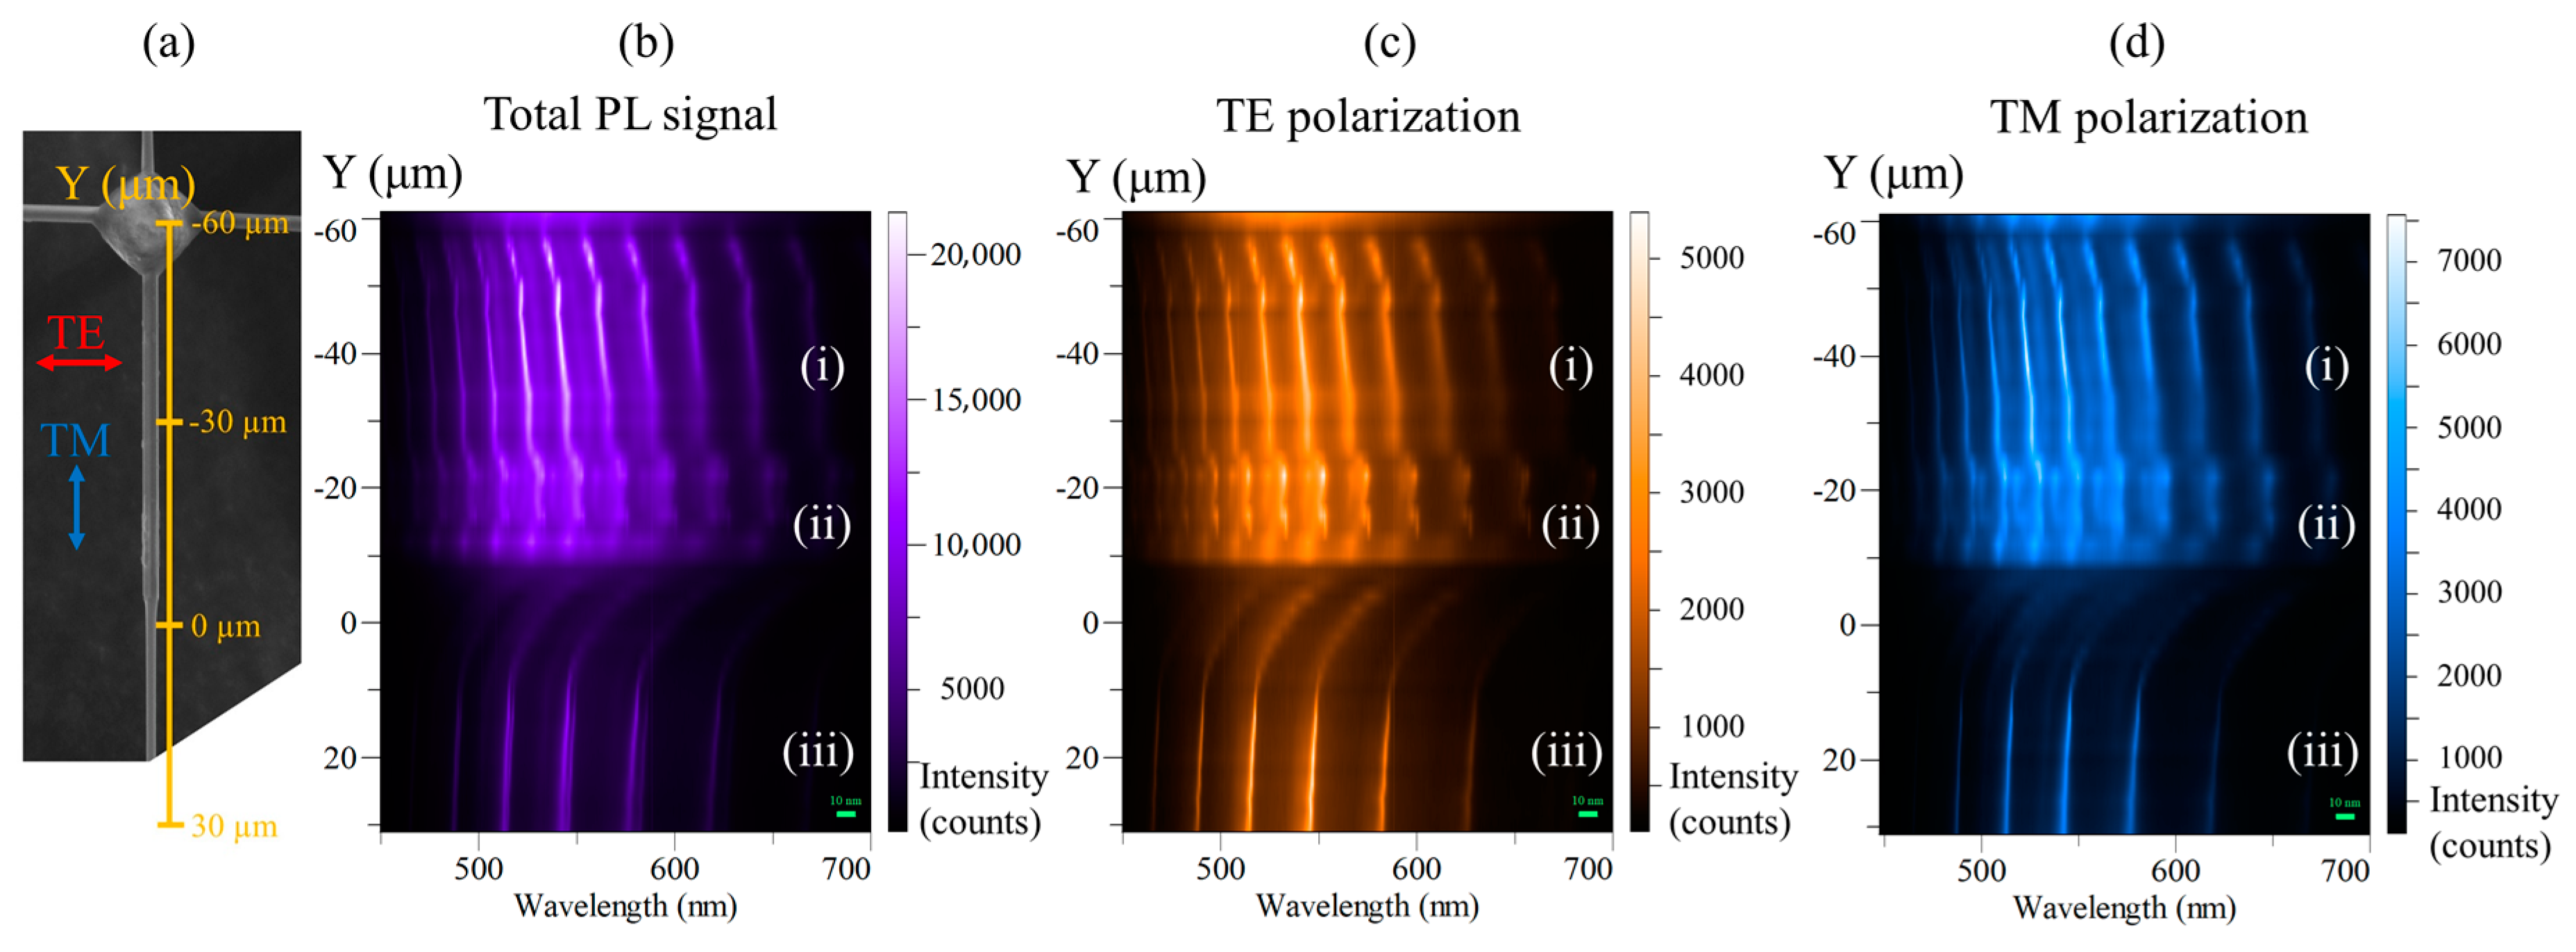
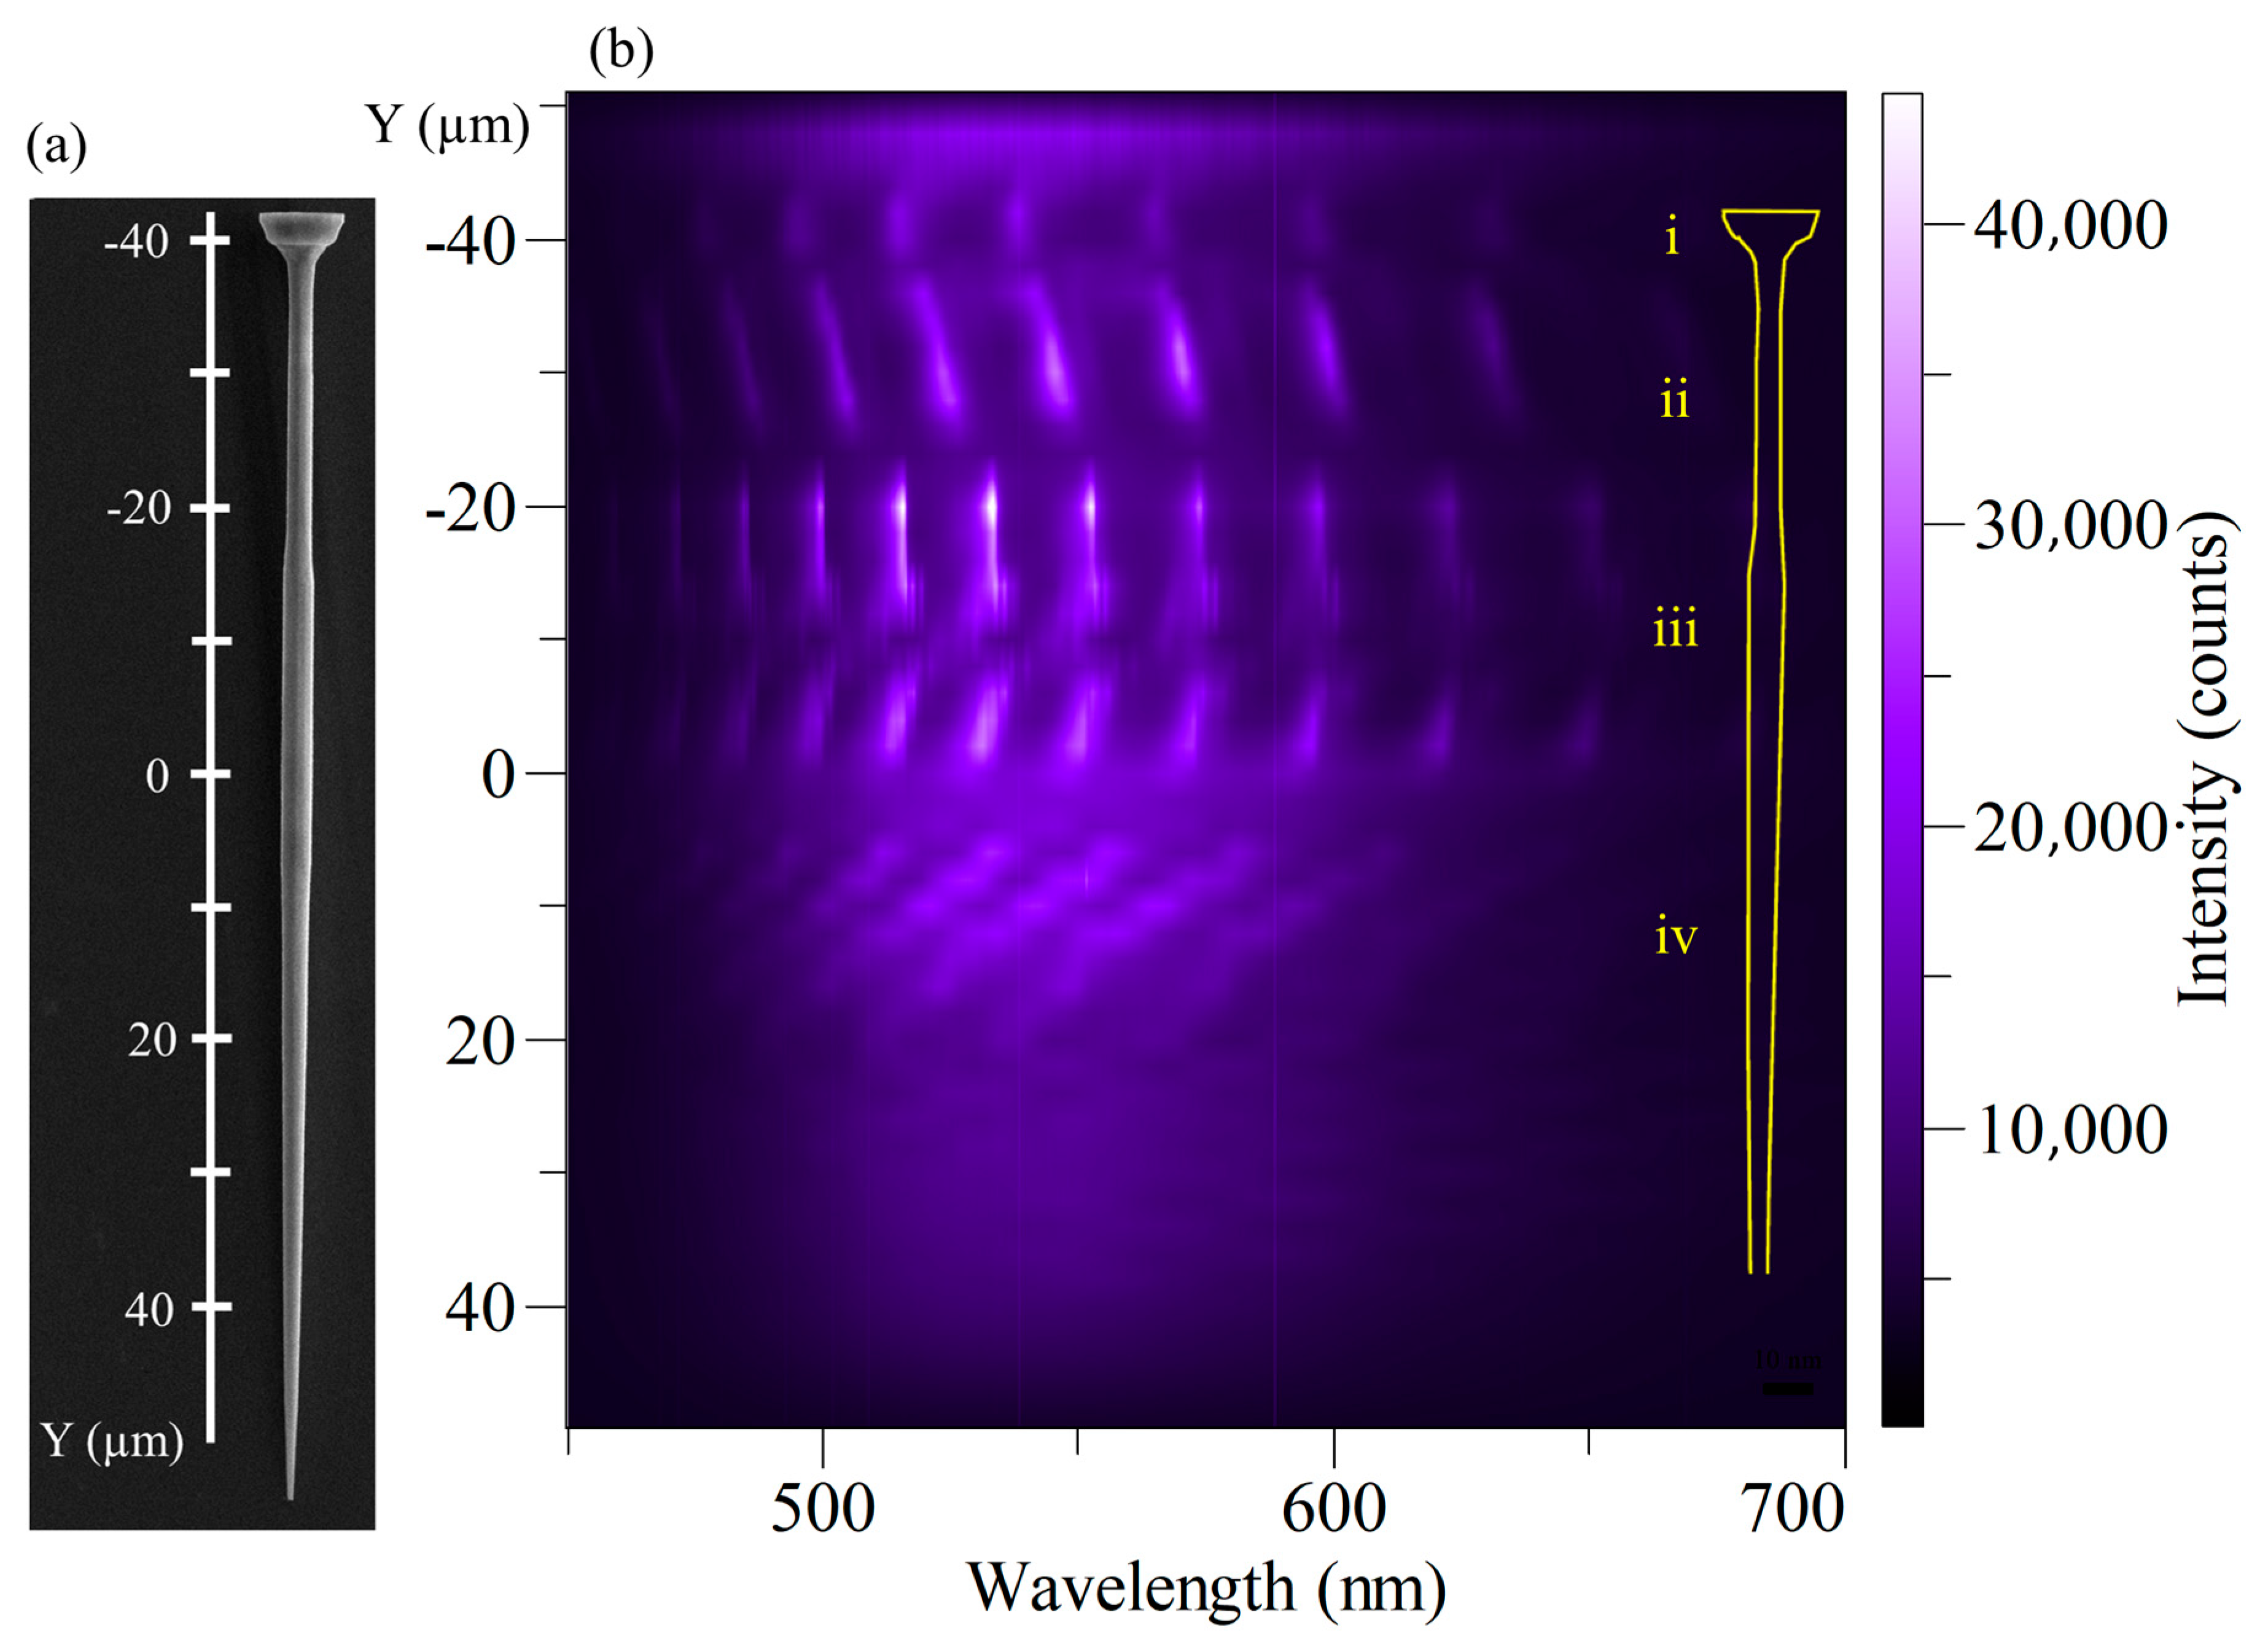
Figure 3a shows one of these rods in detail, where two regions with different cross-sections were clearly observed along the rod axis (Y-axis in the maps). The zero of the length scale was placed at the point at which the size of the cross-section began to change more rapidly to accommodate the second section of the rod (Figure 3a). Figure 3b–d shows how the resonant maxima varied along the length of the structure. The position on the structure is represented in the vertical axes of these graphs, following the scale indicated in Figure 3a. On the horizontal axis, the wavelength of the PL spectra is represented, whereas the intensity is the intensity associated with each wavelength for each point on the structure. These optical resonance maps were obtained for the total PL signal (b) and both TE and TM polarizations (c and d, respectively). The TE polarization was considered to be perpendicular to the c-axis of the structure, whereas the TM polarization was parallel to the c-axis (see Figure 3a for reference).
When the maps for all polarization conditions were compared, it was inferred that the total PL signal could be decomposed into the two polarizations (TE and TM), and for both, optical resonant modes could be detected. That is, we could use the TE and TM polarized signals to discriminate the different resonant peaks and apply the formulas mentioned in the introduction. It was also seen that the evolution of the optical modes along the structure was the same for all the polarization conditions, although the positions of the peaks were slightly different for the TM and TE polarizations, as will be seen later. As it has been said before, the positions of the resonant maxima will change depending on the size of the optical cavity section.
In all the polarization conditions, the maps show three different regions, labeled (i) to (iii) in 
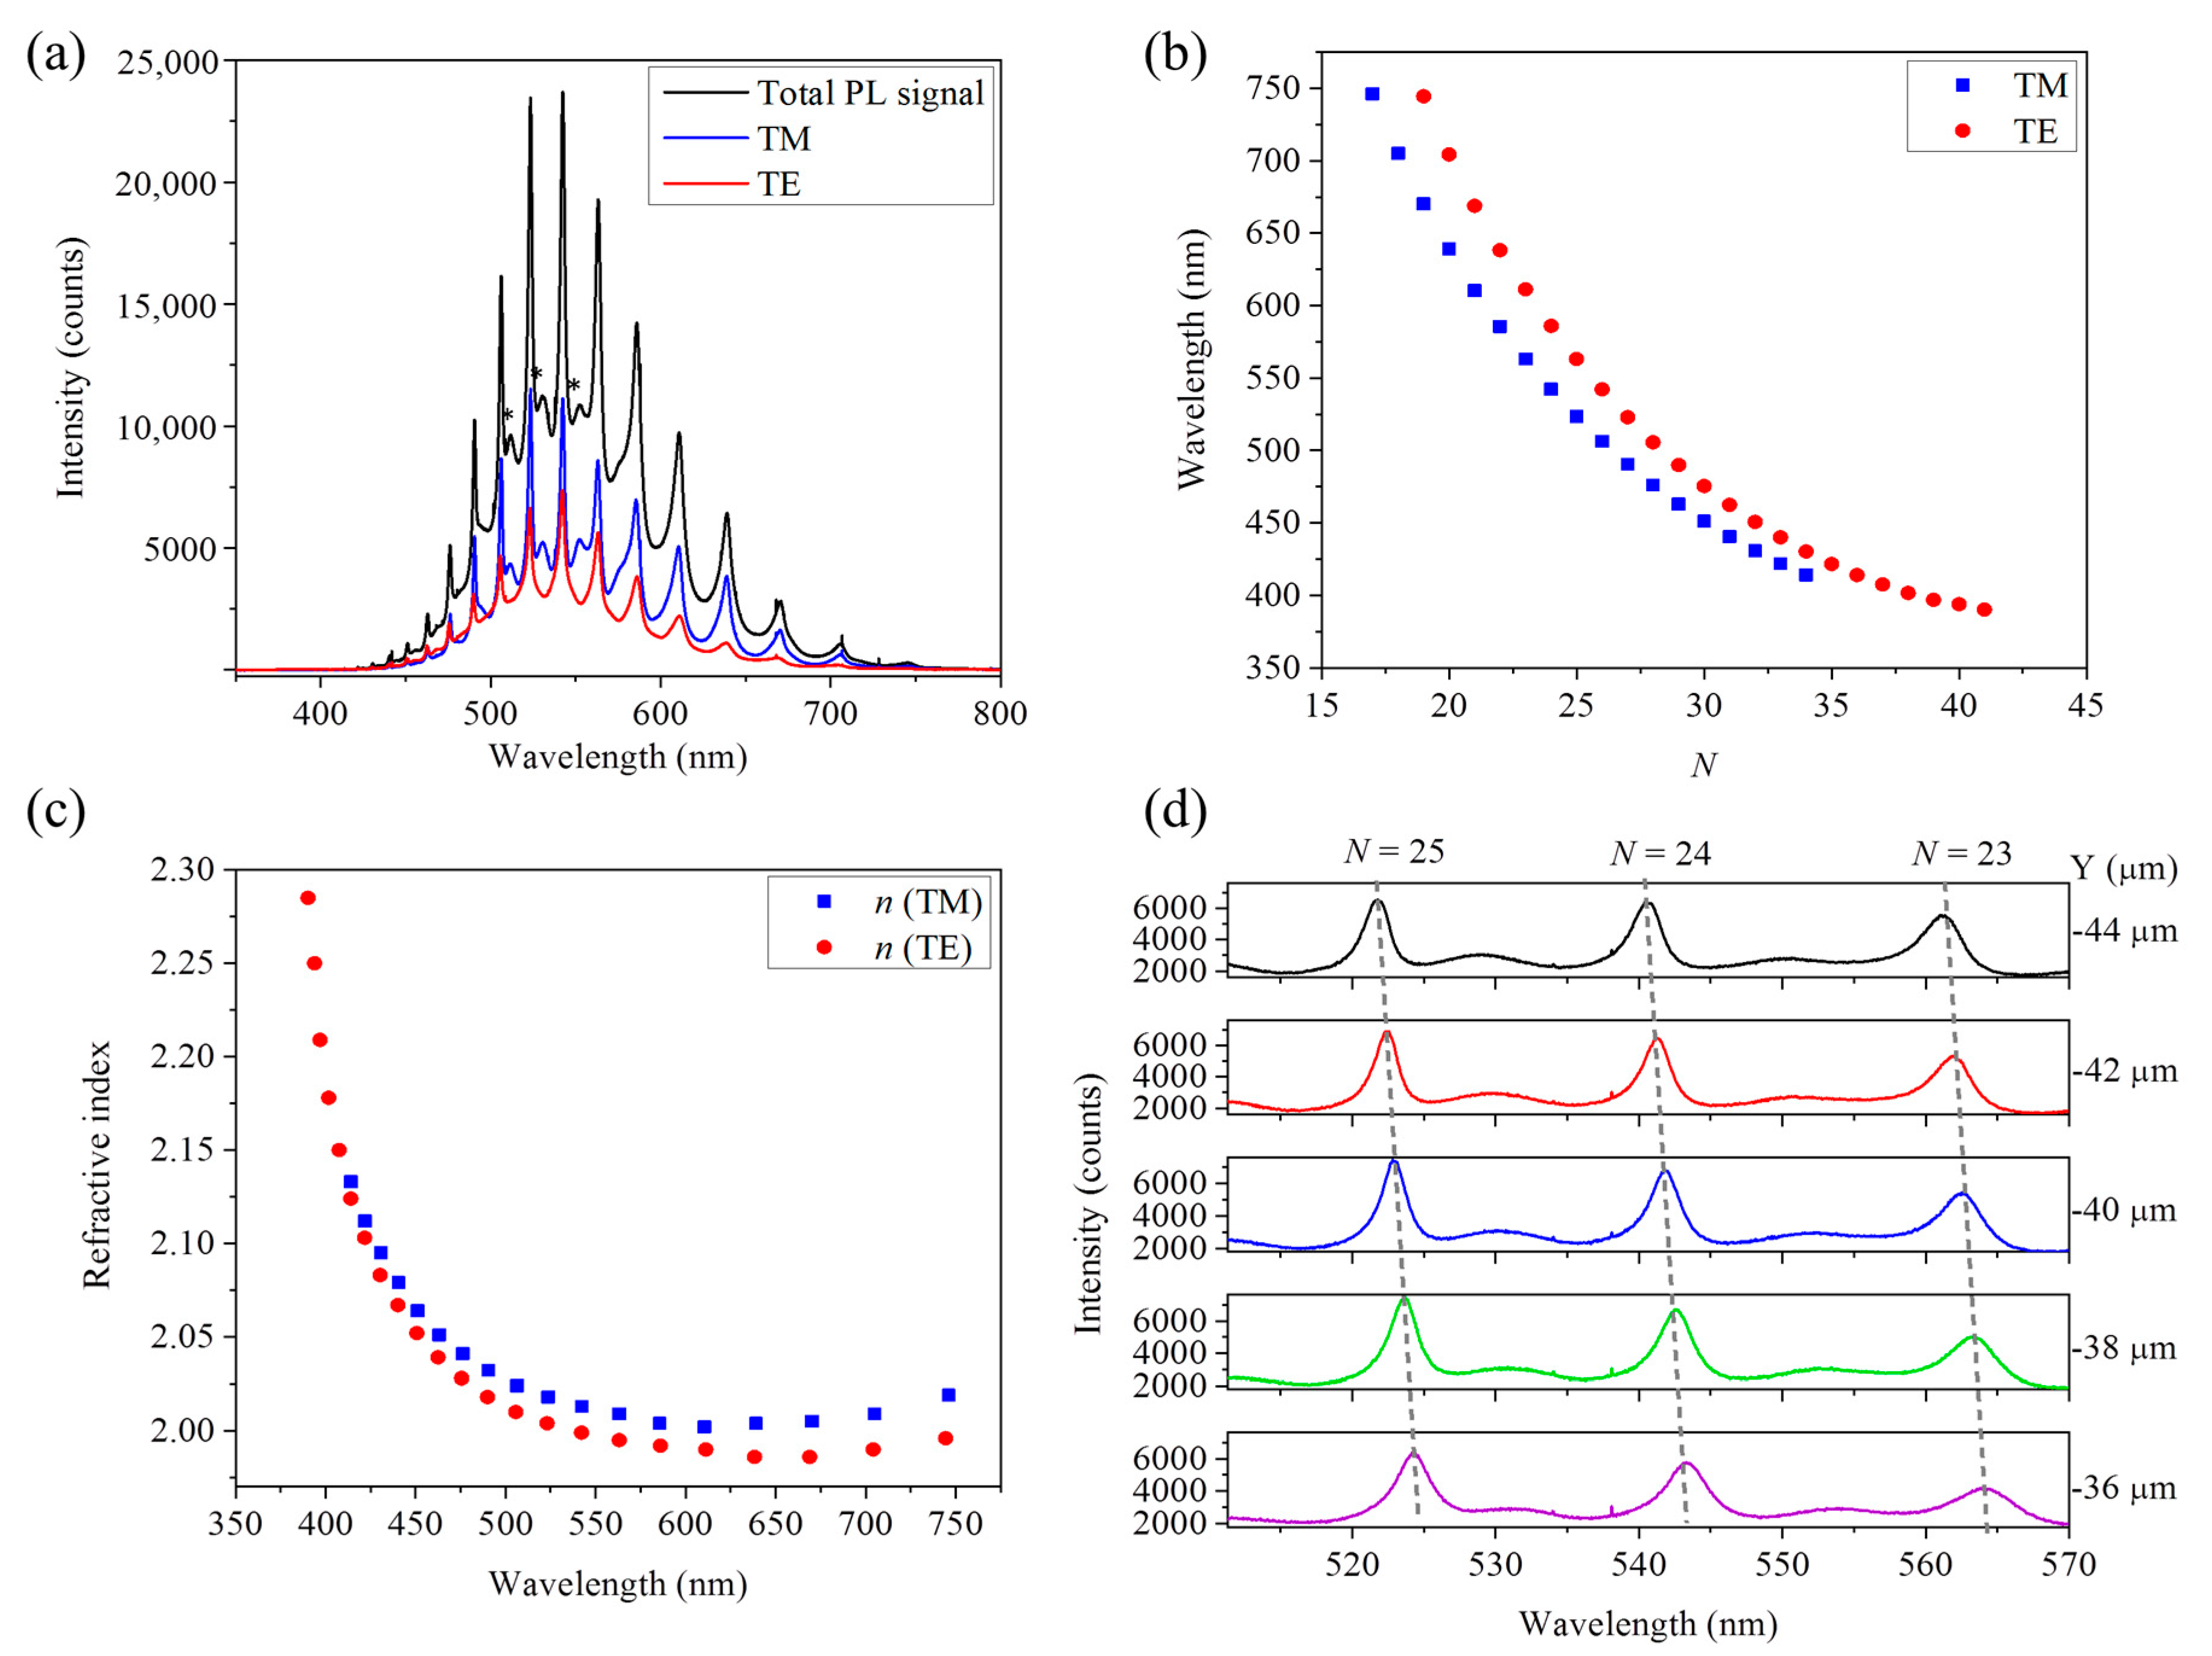
Figure 3b–d. The first region (i) corresponds to the thickest part of the rod, close to the central ball. In this region, the resonant peaks shifted toward longer wavelengths (in the map, moving from −60 µm toward −30 µm), that is, this section of the structure increased smoothly in size. In order to analyze the resonant peaks in this region, the spectra recorded at the middle point (−40 µm) were selected and are shown in Figure 4a. The length side “a” of the cavity at this point, measured using an SEM image, was 1.34 µm. It can be seen in the spectra of Figure 4a that both the TE and TM polarizations presented optical resonant modes and the positions of the TM peaks were slightly shifted toward shorter wavelengths.
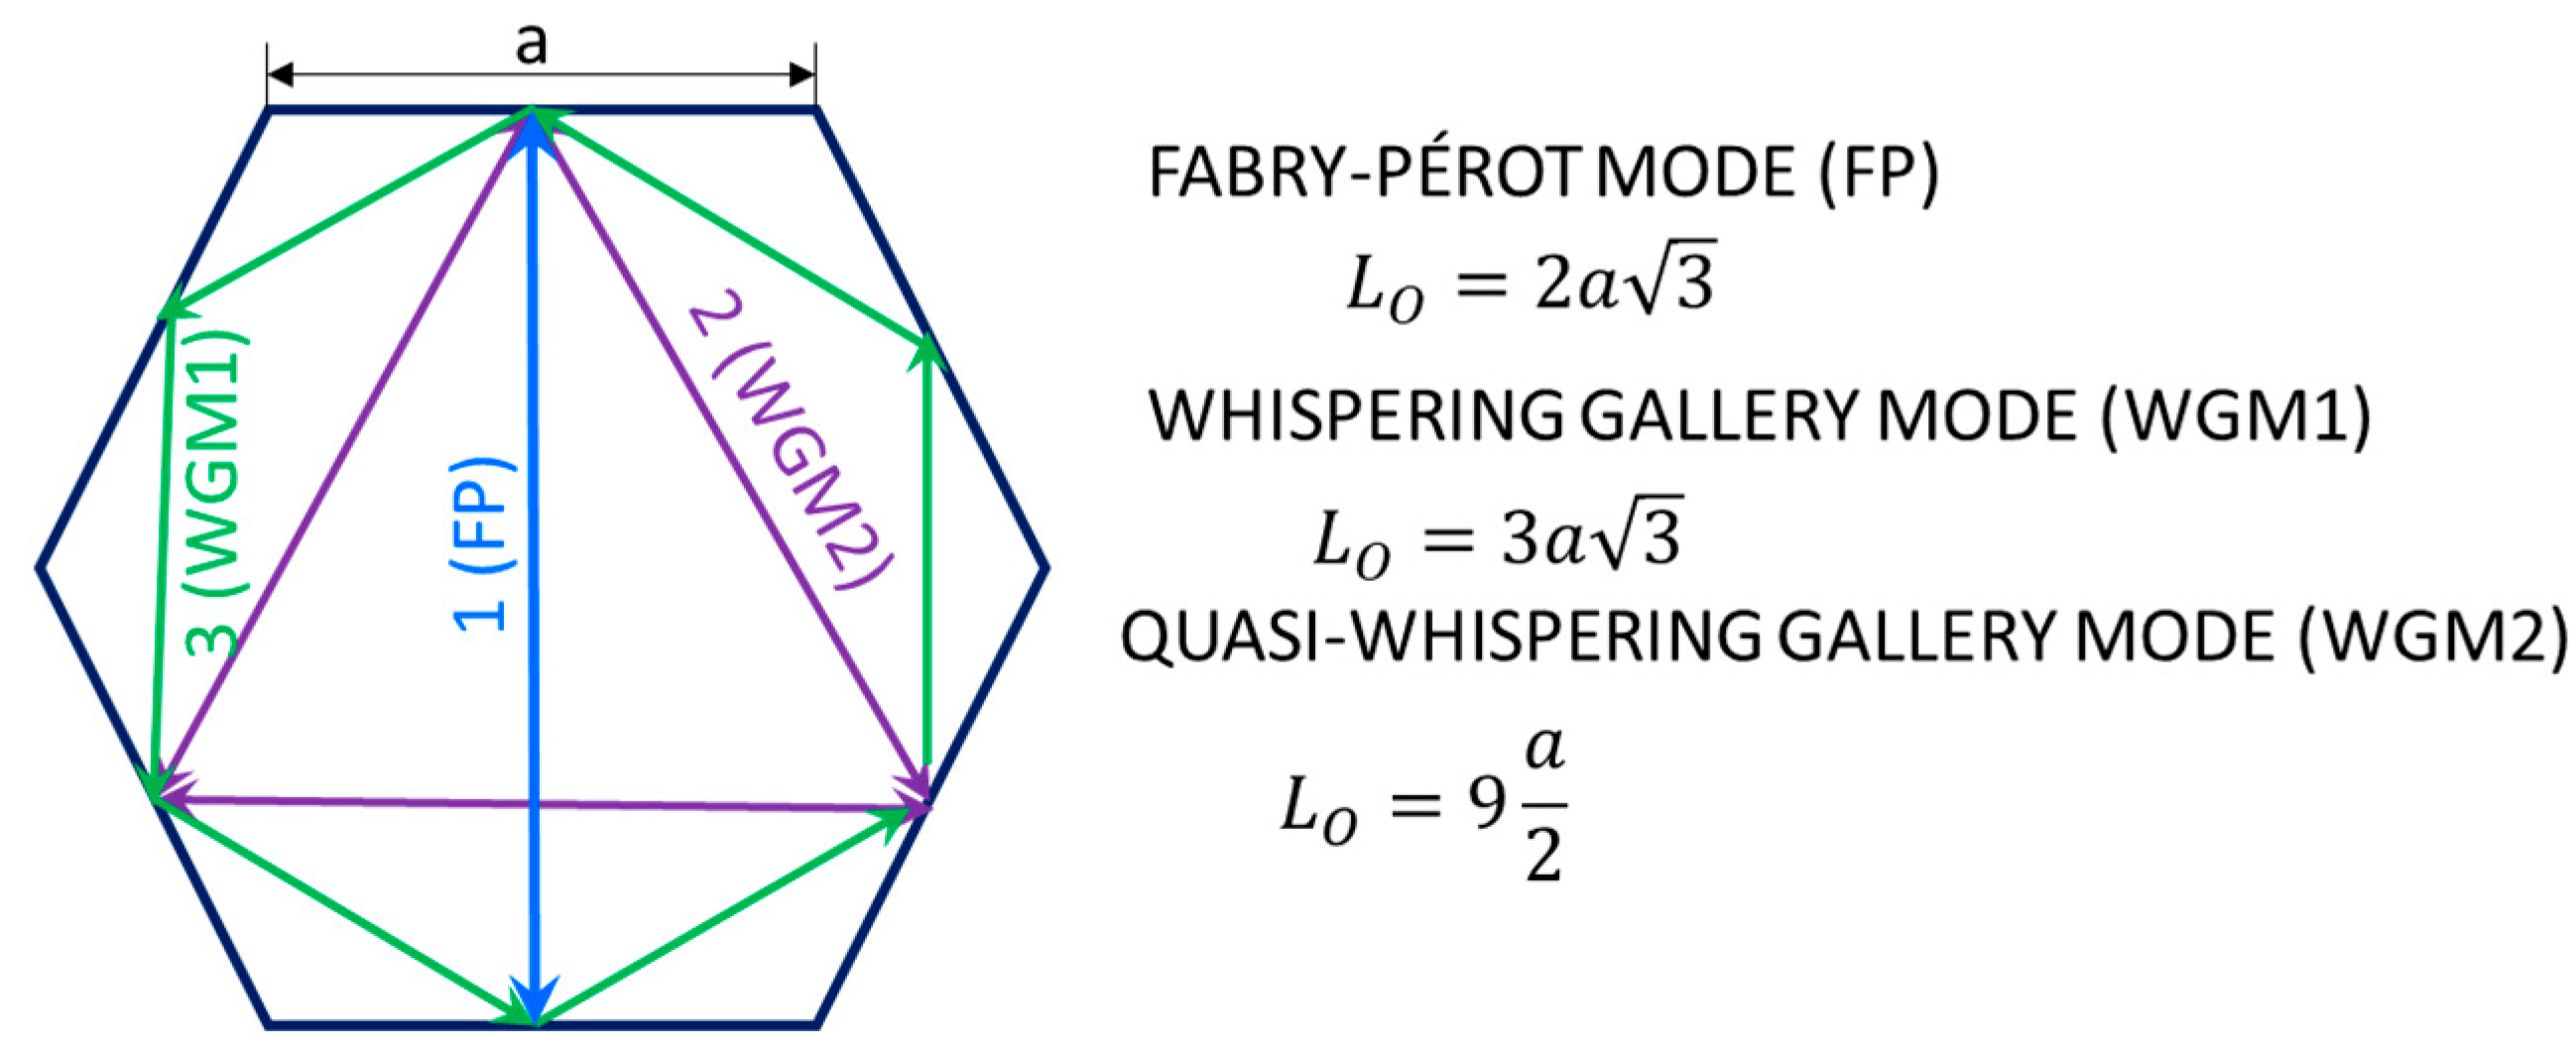
Let us try to understand what type of optical resonant modes were established in this cavity. As it was described in the introduction, three types of resonant modes can appear: Fabry-Pérot modes, whispering gallery modes (WGM1), and quasi-whispering gallery modes (WGM2). The two types of whispering gallery modes are more favorable, as the confinement of the light is based on the total internal reflection (TIR). For ZnO, with an initial estimation of the refractive index around 2 in the visible range, the critical angle for the TIR is:
θ c = a r c s i n ( n a i r n Z n O ) = 30 ° .
The incident angle for the quasi-WG modes was 30° (WGM2 in Figure 1), which is quite close to the condition for TIR. Then, the most favorable conditions for the optical confinement were found for the WG modes (WGM1 in Figure 1, angle of incidence of 60°). Furthermore, the WG optical path (L0 = 6.96 μm) fits well with the separation of the resonant peaks observed in Figure 4a. Less intense modes that are marked with an asterisk were associated with the quasi-WG modes (incidence of 30°, less confinement due to TIR, and broader peaks).
Then, Equations (1) and (2) were used to analyze the peaks of TM and TE polarizations, respectively. However, the refractive index that appears in these equations is also a function of the wavelength. In our case, for ZnO, we used the formula reported by Bond for bulk material [20]:
n 2 = 2.81418 + 0.87968 λ 2 λ 2 0.3042 2 0.00711 λ 2 ,
in order to have an initial value of the refractive index as a function of the wavelength. Then, performing the calculations as described, for example, in [5], the interference order N (Figure 4b) and an estimation of the refractive index n (Figure 4c) can be obtained for the wavelength position of the resonant modes and the calculated optical path.
As has been mentioned, the change in the size of the optical cavity produced a change in the position of the optical resonances. This is shown in part d of Figure 4, where the spectra obtained at points located at different positions of the rod showed a slight shift toward longer wavelengths, indicating that there was a small increase of the cross-section size as the distance from the start of the structure (i.e., the ball) became longer. This information is clearly visible in the maps of Figure 3b–d, i.e., the displacement of the same order N along the structure was related to a change in the cross-section or in the size of the resonant cavity. Then, stronger changes in the size of the cavity were observed as discontinuities in the optical resonant modes’ evolution maps.
In region (ii), which is what we called the transition region (Figure 5a), the modes associated with the quasi-WG were more intense and better defined than in the first region, blurring the resonances associated with WGM1 (Figure 5b). This could be related to the roughness of the structure in this region, as can be seen in the SEM image of Figure 5a. The larger roughness caused both changes in the thickness and reflection angle, favoring the confinement of the quasi-WG. Then, in the TM and TE spectra, there were two sets of peaks, making it difficult to distinguish between the WG and the quasi-WG modes. Furthermore, the dispersion of the optical path length gave rise to a shift and/or broadening of the resonance peaks that, as can be appreciated in Figure 5b, were not so well separated [21]. Consequently, in this region, no accurate calculation of the order of the resonance or the refractive index was possible.
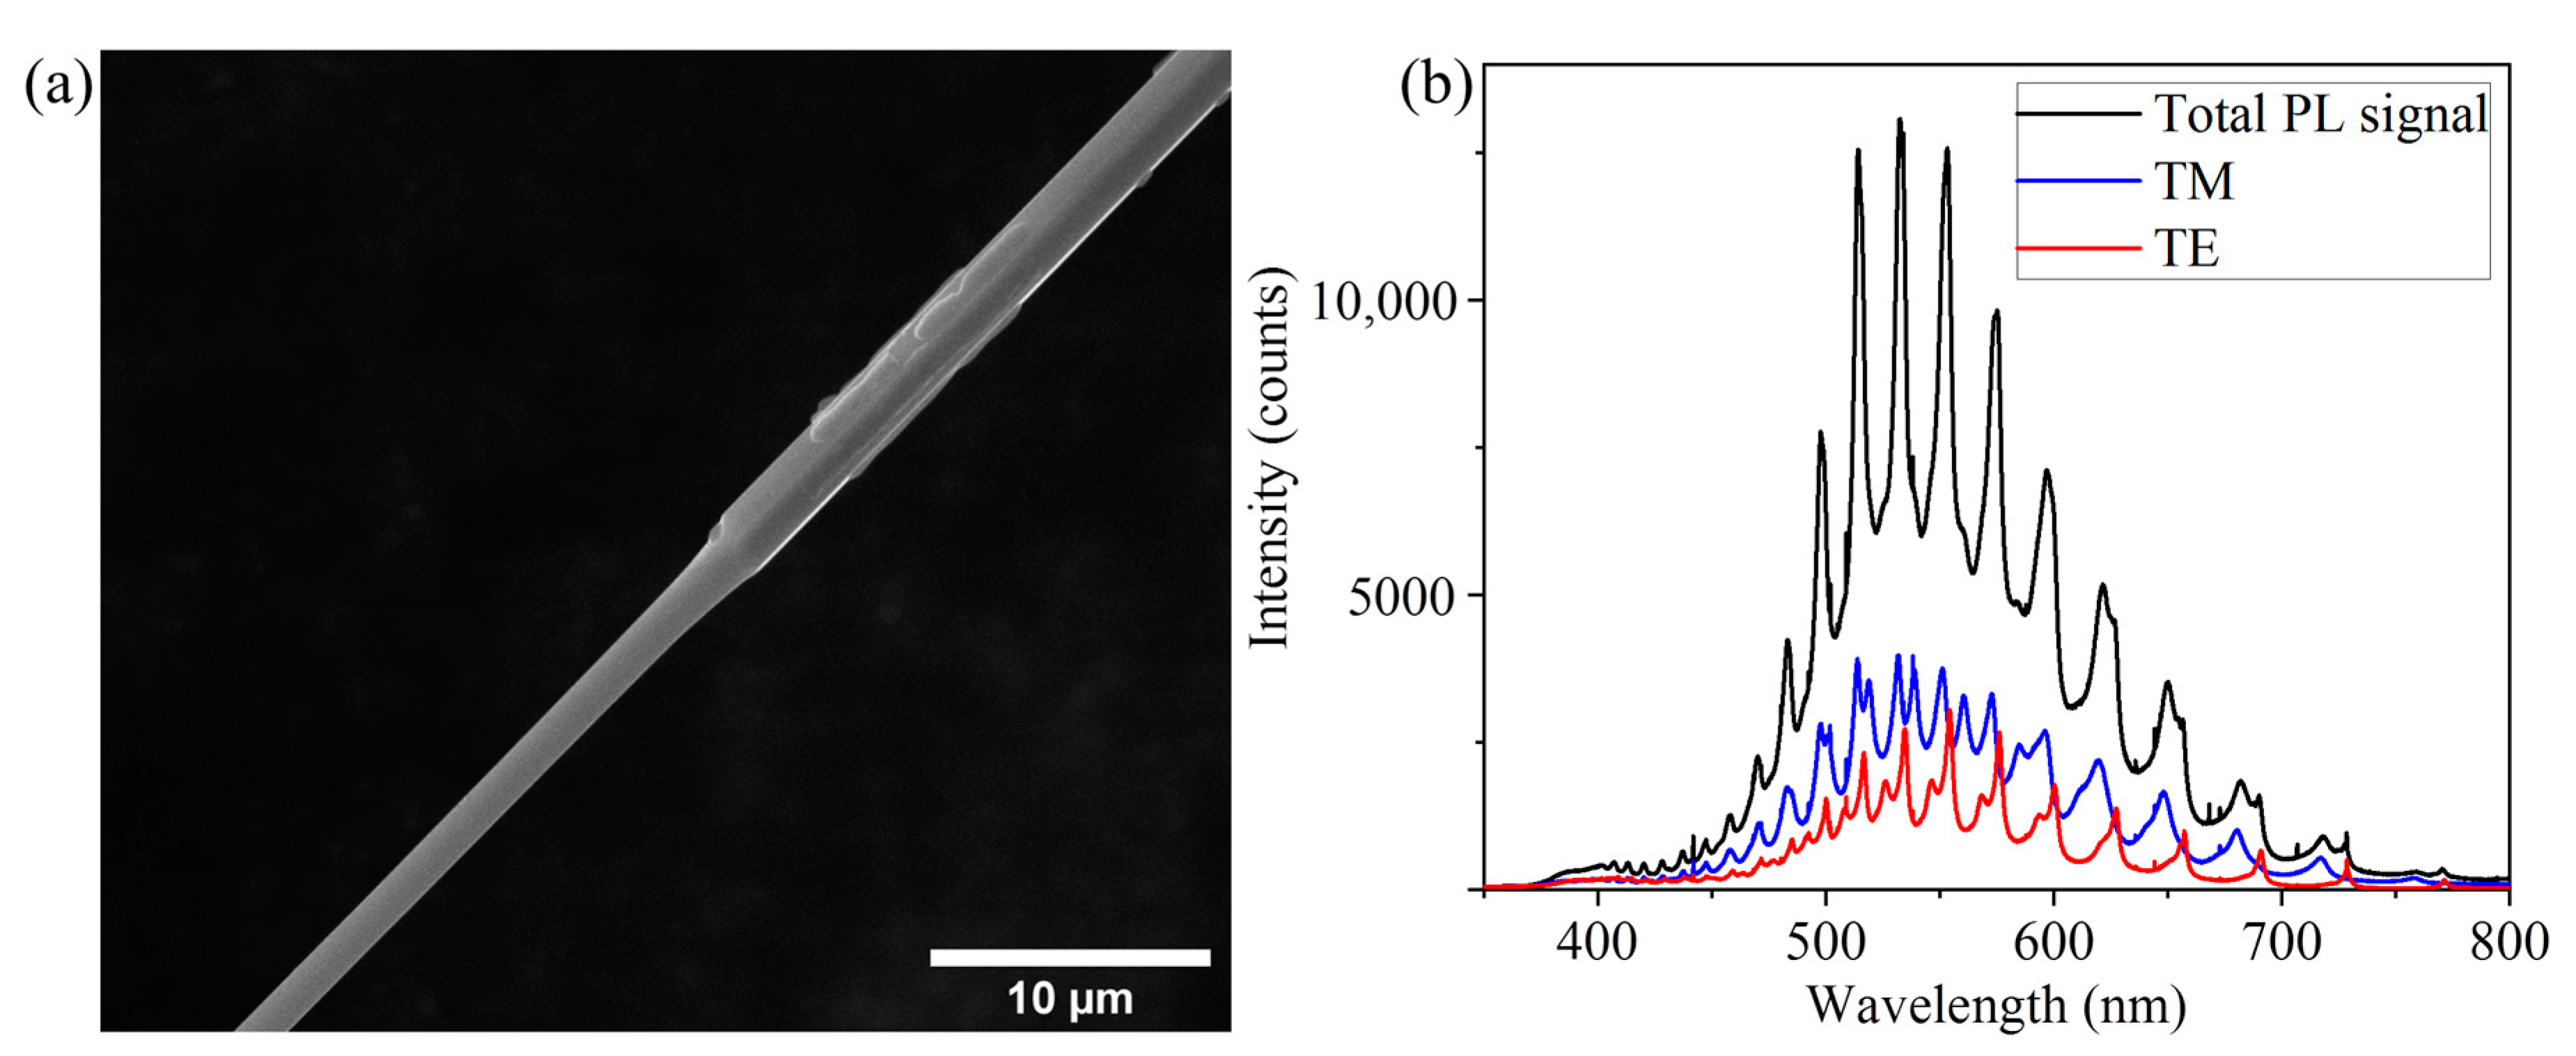
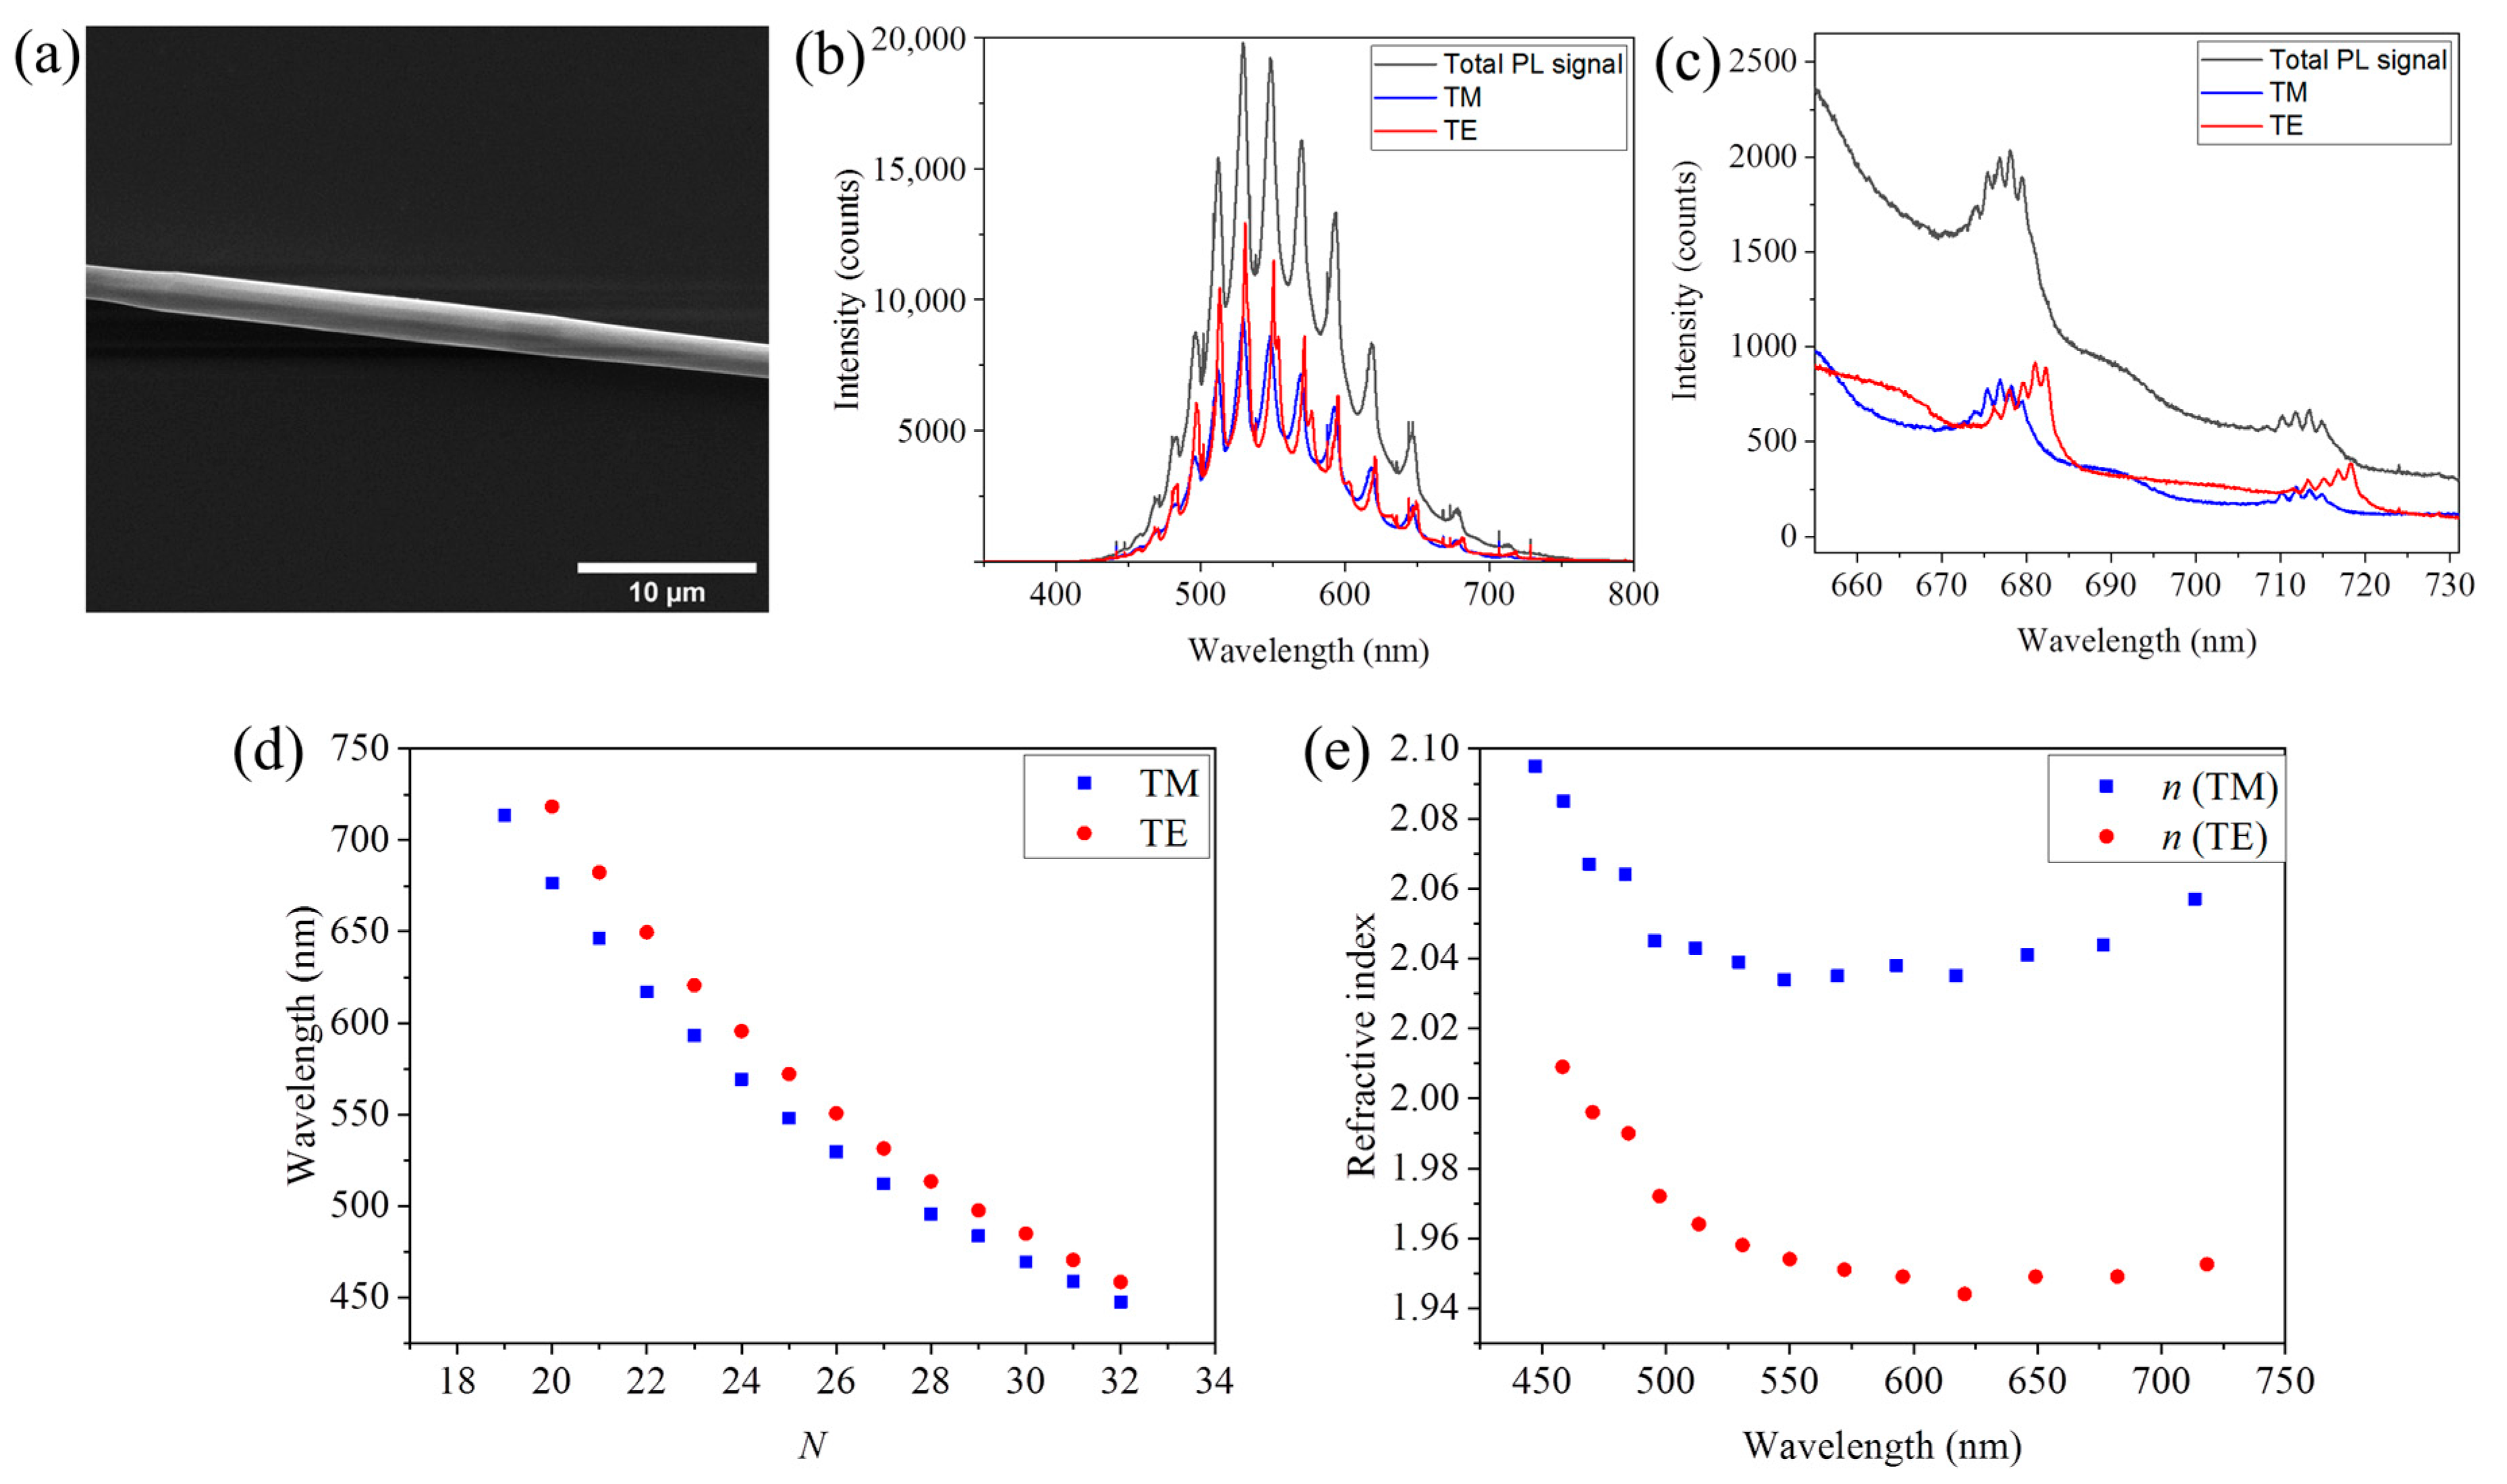
The third region (iii) corresponds to the thinner part of the rod (Figure 6a). It had a hexagonal cross-section that tapered down toward the end of the rod. As can be seen in Figure 6, the thinner the rod (i.e., the smaller the size of the cavity), the sharper and more separated the resonant peaks.
Compared to the observations in the first region (i), in this region (iii) of the rod, the difference between the positions of a given resonance order for both polarizations was larger (see the spectra in Figure 6b) due to the smaller cross-section. The peaks were also sharper than in region (i). We have already mentioned the possible influence of the roughness when describing the transition region (ii). It is likely that the roughness was also behind these differences. Similar calculations were performed with spectra at the selected point (with a side length “a” of 0.72 µm), and the order N and refractive index were obtained (Figure 6c,d, respectively). It can be seen that the obtained values of the refractive index were quite similar to those calculated for region (i).
The second kind of morphology investigated shows more variations in the optical modes observed along the length of the structure (Figure 7). As described above, it consisted of long nails, typically with a variable cross-section and a hexagonal head. Figure 7a shows a general view of one of these nails, where the different cross-section sizes along the nail are clearly seen.
However, in the optical resonances map (Figure 7b), the situation was a little bit more complicated. Thanks to this map, regions where some defects were inside the structure that were not visible in the SEM image could be identified, where these were affecting the performance of the optical cavities. For example, in the middle of region (ii), and in region (iii), there was a discontinuity in the map, indicating that at those points, no optical resonant modes were established. Then, we could conclude that the optical resonant map was useful for identifying not only changes in the size of the cavity but also points where some kinds of defects were reducing the performance of the optical cavity.
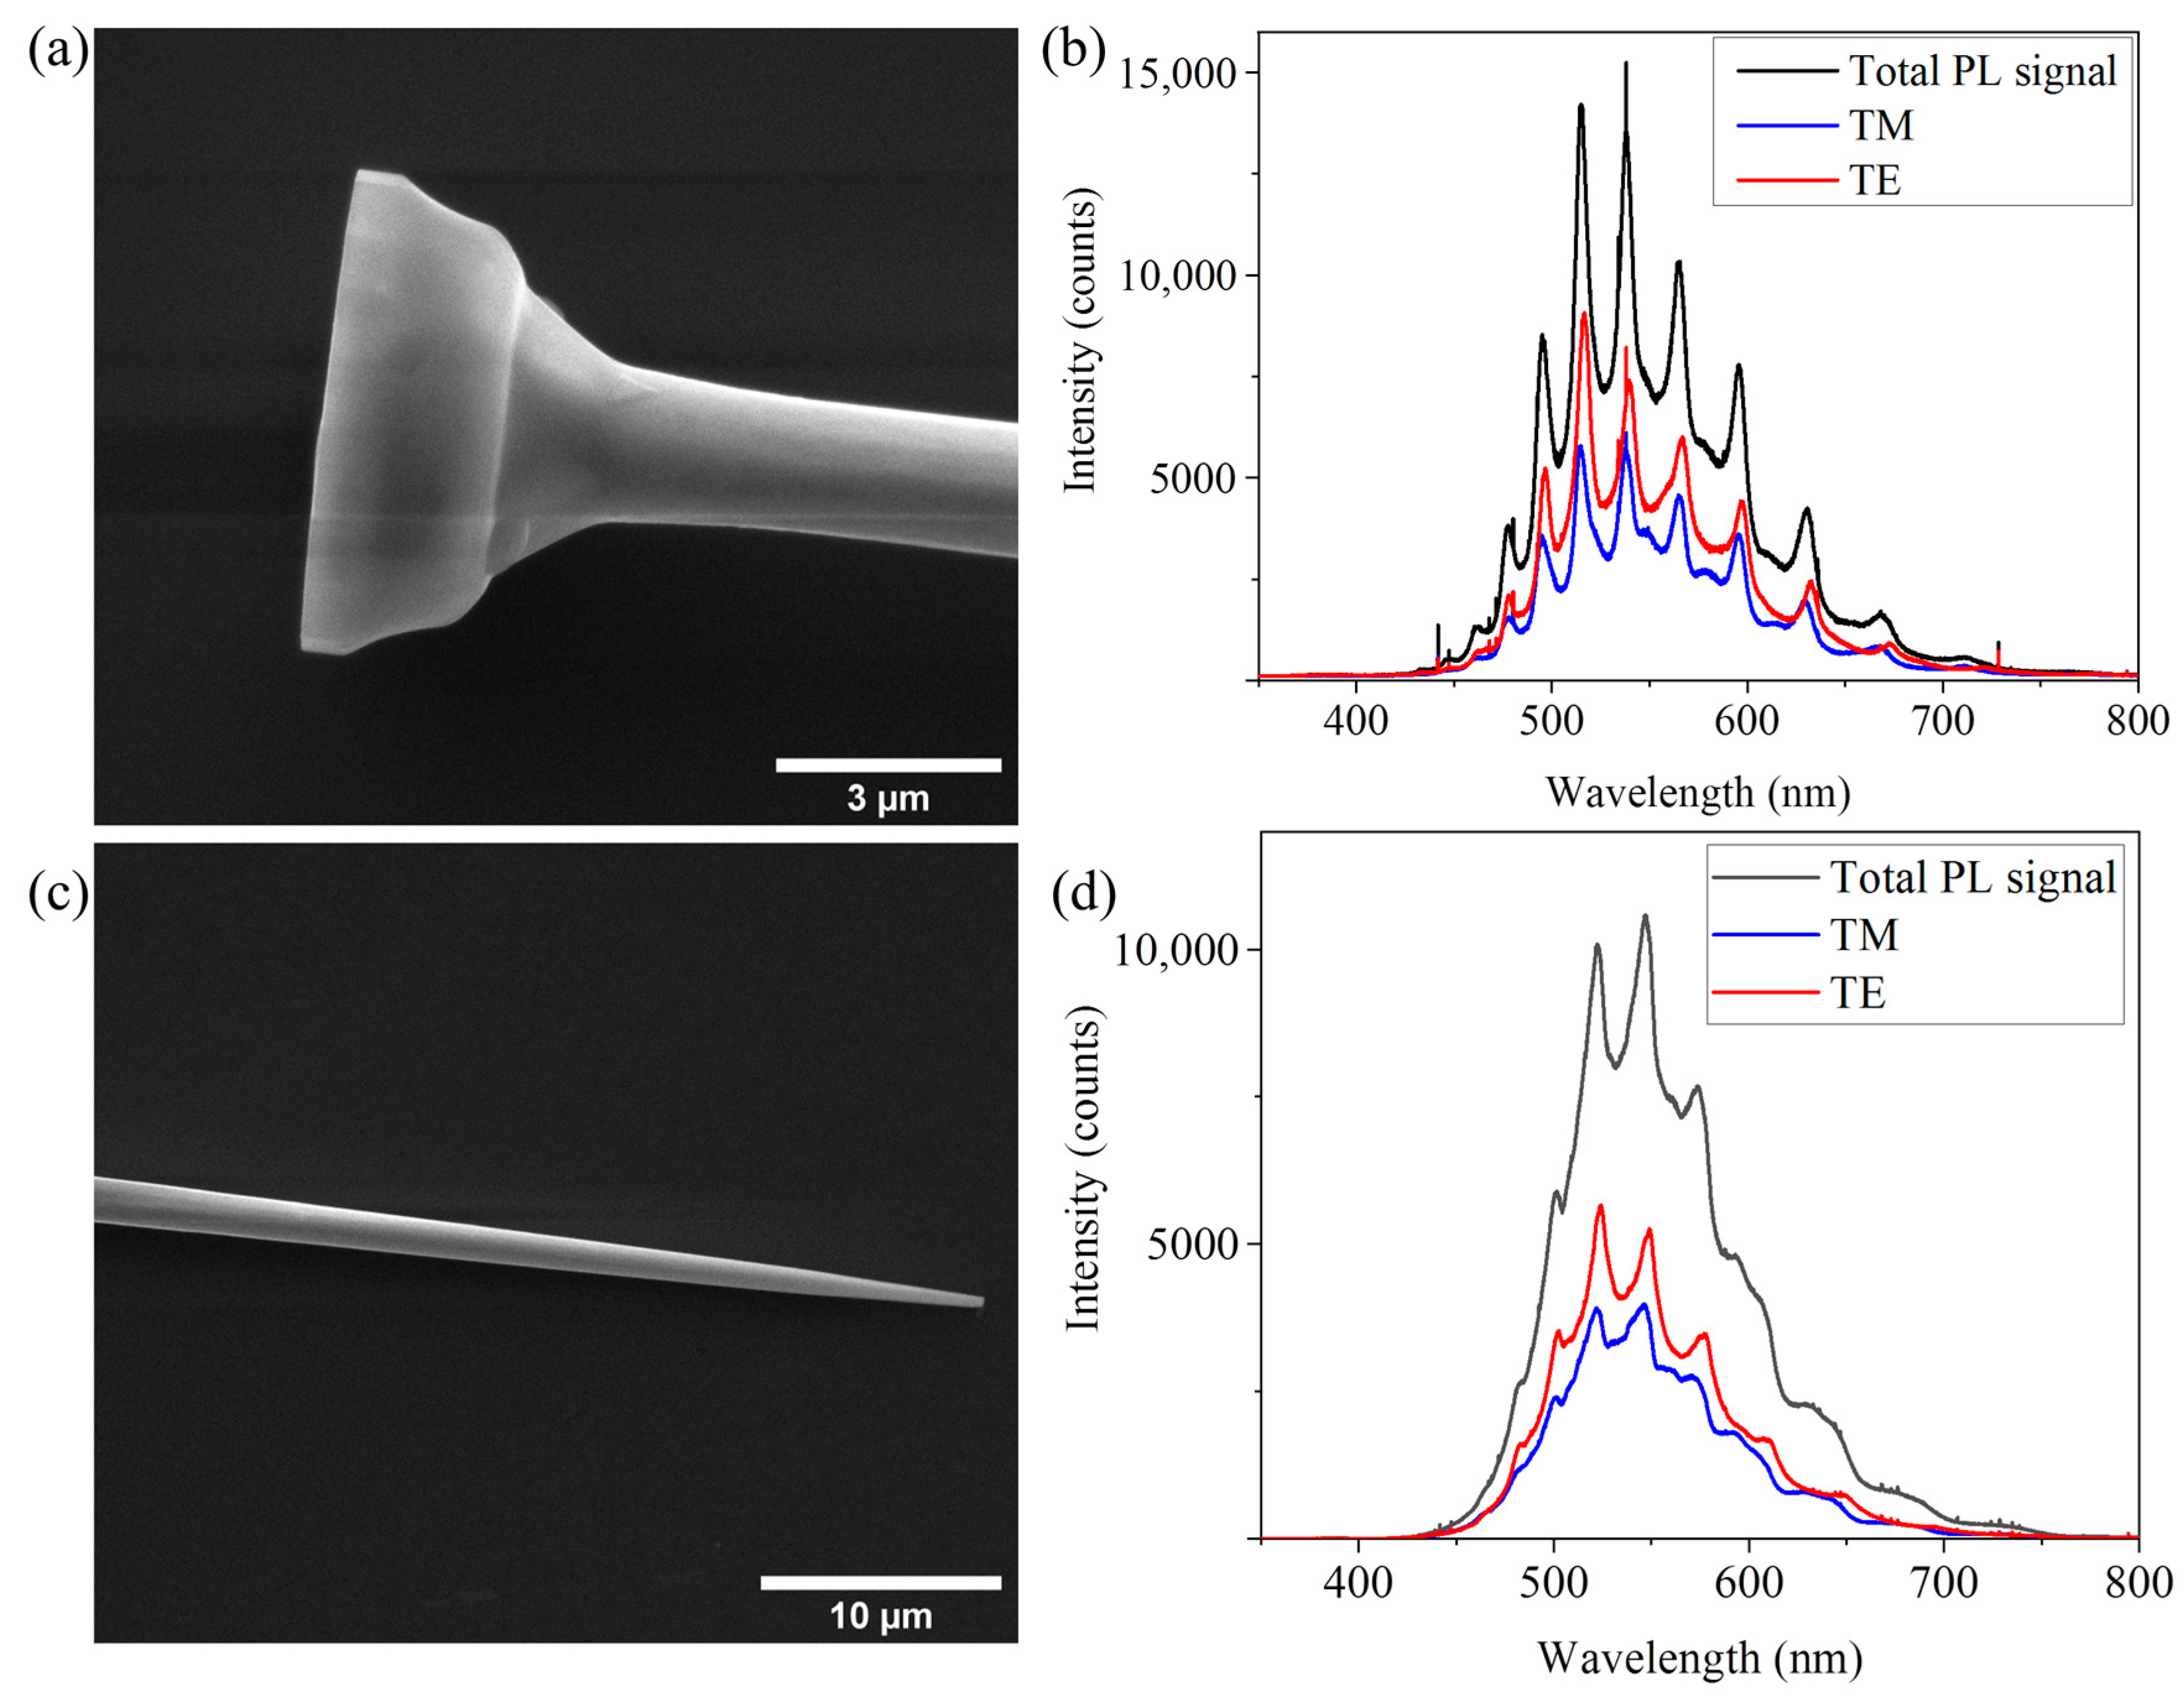
Let us now provide a deeper description of the optical resonances observed in the regions marked in Figure 7. Region (i) corresponds to the hexagonal head. The cross-section was quite uneven, both in shape and size, as observed in the close-up image shown in Figure 8a. At the beginning of this head, the optical resonances were hardly defined, although the spectra recorded at this initial point showed some modulation of the signal that could be related to the Fabry-Pérot modes established along the length of the structure. The blurred resonance map was the result of the superposition of the different resonant modes established in this cavity. It was only when the spectra were recorded at the end part of the head when the whispering gallery modes associated with a hexagonal section could be observed (Figure 8b). However, the resonant peaks were broader than at other regions of the nail (see the map in Figure 7b). A similar situation was seen in the last region considered, corresponding to the tip of the nail (Figure 8c,d). In region (iv), the size of the cross-section decreased rapidly toward the tip; therefore, the resonance peaks were less sharp and defined.
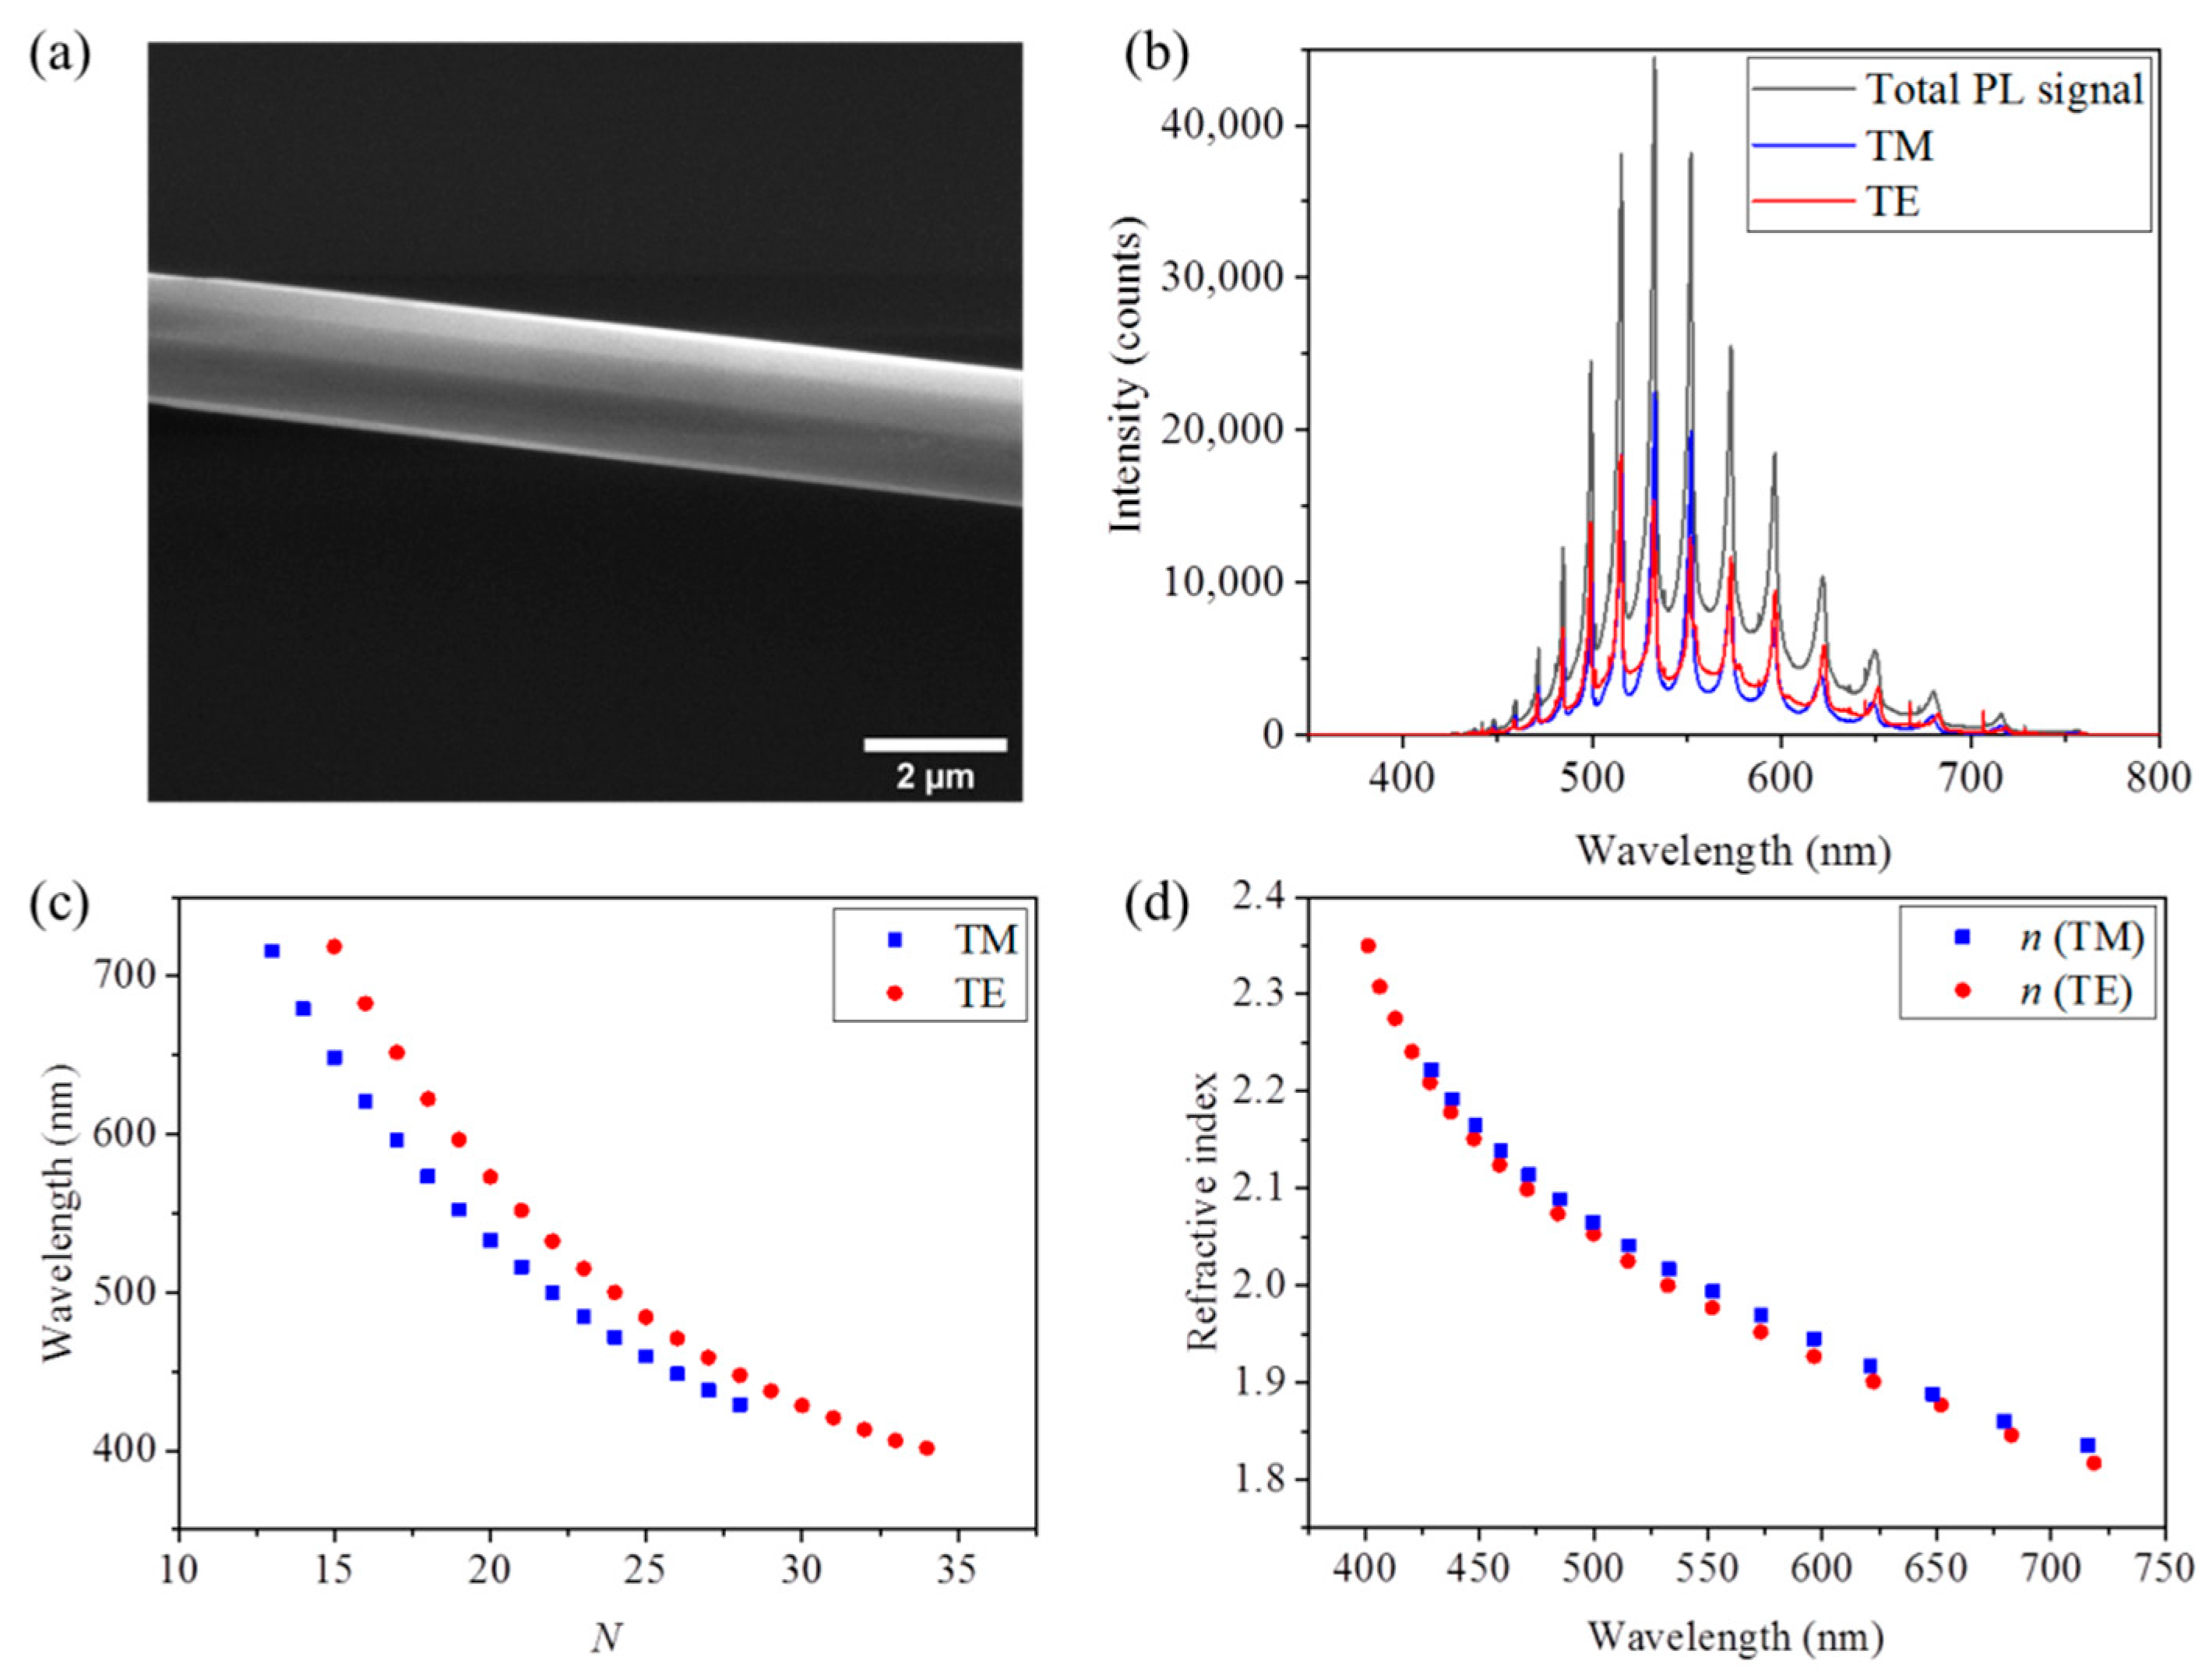
Region (ii) had an almost constant hexagonal cross-section, although the initial part had a slight increase in the size of the cross-section, as can be seen in the map of Figure 7b. Figure 9a shows the detail of this region, where the hexagonal faceting is visible. Correspondingly, the resonances were extremely well defined, as shown in the spectra in Figure 9b, especially at the last part of this region where the section was almost constant and at the point that is located at Y = −20 µm in the map of Figure 7b. This point had the highest intensity in the map and corresponded to the nicest resonances observed all along the structure (Figure 9b). As has already been described, the order N (Figure 9c) was determined using Equations (1) and (2), while using Equation (6) to find the starting values for the refractive index. The final estimated values for the refractive index are shown in Figure 9d. The values were quite similar to those reported for the previous rod (Figure 4 and Figure 6), although the shape of the curve of the dispersion relation was a little bit different. The refractive indexes of the TE and TM modes virtually overlapped. The absent change in the section size seemed to favor the resonance conditions.
Toward the center (Figure 10a) in region (iii), the size of the cross-section was again practically constant and the resonances were very well defined (Figure 10b), but the intensity was lower than in the case shown in Figure 9b. This section of the nail was thicker, allowing us to appreciate a second set of resonant peaks, shown in Figure 10c, that would correspond to the Fabry-Pérot modes established along the length of the structure. However, we expected less accuracy than in the calculation of Figure 9d, as the peaks were slightly broader and there was the contribution of a second set of Fabry-Pérot resonances.
Then, by performing the optical resonances maps and by selecting and studying the µ-PL spectra at the good points, we were able to identify the best resonant cavities that were present for both structures. For the rod, the best cavity was the one presented in Figure 6, whereas for the nail, it was the one presented in Figure 9. These two cavities had the fact that they were found in a constant cross-section region in common. Then, their performance factors, Q and F, were calculated in order to compare both cavities.
The quality factor, Q, and the finesse, F, can be calculated using the following equations:
Q = λ m a x Γ ,
F = Δ λ Γ ,
where Γ stands for the full-width at the half maximum (FWHM) of the peak at λ.
The FWHM was calculated by means of a Lorentzian fitting of the peaks at each λ in the TM mode (the set of resonant peaks that are generally more intense [6,22]). This value allowed for estimating Q and F (Table 1).
In the case of the cavity of the cross, a clear trend could not be observed in the values of Q and F with the wavelength. However, in the case of the cavity of the nail, an increase in the Q factor and F was observed as the wavelength increased. This behavior could be associated with the increase in the refractive index with the wavelength. The Q factors obtained were in agreement with those reported in the literature for ZnO hexagonal cavities [2,23], although there is still some space for improvement [24].
A third relevant parameter to characterize a resonant cavity is the reflectivity R of the faces between which the resonant mode is established. In the case of a regular polygonal cavity, as was our case for the WGM, the reflectivity was related to the quality factor via the expression [25]:
Q = π n m D R m 4 2 λ ( 1 R m 2 ) sin 2 π m ,
where n is the refractive index, m the number of polygon facets (for our case 6), D the diameter of the circle circumscribing the polygon, and R the reflectivity. The results of these calculations using the Q factors obtained (Table 1) are shown in Table 2.
To compare the results obtained from both types of structures, we chose the values at 515 nm since both types of structures presented a resonant peak at this wavelength. The comparison showed better results in the nail structure, where the reflectivity was close to the total reflection condition (100%). In fact, in the nail, the shorter the wavelength, the larger the reflectivity, reaching values of 96%. The Q and F values were also better for the nail structure, although at the chosen wavelength, the finesse was larger for the crossed-rods structures and the finesse values increased rapidly for the shorter wavelengths in the nails. In addition, for the nail cavity, the Q factors were above 300 for wavelengths shorter than 500 nm. This condition indicated that the cavity can work as a sensor and an optical filter for those wavelengths, as described in [26].

4. Conclusions

In this study, the evolution of the optical resonant modes established in the hexagonal cross-sections of ZnO:Li structures was investigated. The incorporation of Li in the growth process improved the quality of the optical cavities and produced structure morphologies that were suitable to confine the light in the cross-section. It was shown that the optical resonant maps were useful to identify not only changes in the size of the cavity but also points where some kinds of defects inside the structures (not visible in the SEM images) can reduce the performance of the optical cavity. Thanks to this map, the best optical cavities were identified, which were typically located in regions of the structure with a constant cross-section size. The calculation of the Q factor and F showed that the quality of the optical cavity found in the good region of the nail-type structure was suitable for applications such as sensors and optical filters.

Author Contributions

Conceptualization, B.S., A.U., and P.F.; methodology, B.S., R.A., and F.P.; formal analysis, R.A. and B.S.; investigation, B.S., R.A., and F.P.; resources, A.U. and P.F.; data curation, R.A. and B.S.; writing—original draft preparation, B.S. and P.F.; writing—review and editing, R.A., B.S., A.U., and P.F.; project administration, A.U. and P.F.; funding acquisition, P.F. All authors have read and agreed to the published version of the manuscript.

Funding

The authors are grateful to the Complutense University of Madrid and Banco Santander for support via the project UCM-Santander 2019 (PR87/19-22613) and to the Spanish Ministry of Science, Innovation and Universities for support via the project MINECO/FEDER-MAT2015-65274-R. B.S. acknowledges financial support from Comunidad de Madrid and Complutense University of Madrid (Ayudas del Programa de Atracción de Talento 2017-T2/IND-5465). R.A. acknowledges the European Social Fund (ESF) and the Youth Employment Initiative (YEI) of the Madrid region through the PEJD-2019-PRE/IND-16755 grant.

Conflicts of Interest

The authors declare no conflict of interest.

References

  1. Özgür, Ü.; Alivov, Y.I.; Liu, C.; Teke, A.; Reshchikov, M.A.; Doǧan, S.; Avrutin, V.; Cho, S.J.; Morko, H. A comprehensive review of ZnO materials and devices. J. Appl. Phys. 2005, 98, 1–103. [Google Scholar] [CrossRef] [Green Version]
  2. Gargas, D.J.; Moore, M.C.; Ni, A.; Chang, S.W.; Zhang, Z.; Chuang, S.L.; Yang, P. Whispering gallery mode lasing from zinc oxide hexagonal nanodisks. ACS Nano 2010, 4, 3270–3276. [Google Scholar] [CrossRef]
  3. Wang, D.; Seo, H.W.; Tin, C.C.; Bozack, M.J.; Williams, J.R.; Park, M.; Tzeng, Y. Lasing in whispering gallery mode in ZnO nanonails. J. Appl. Phys. 2006, 99. [Google Scholar] [CrossRef]
  4. Nobis, T.; Kaidashev, E.M.; Rahm, A.; Lorenz, M.; Grundmann, M. Whispering gallery modes in nanosized dielectric resonators with hexagonal cross section. Phys. Rev. Lett. 2004, 93, 1–4. [Google Scholar] [CrossRef]
  5. Liu, J.; Lee, S.; Ahn, Y.H.; Park, J.Y.; Koh, K.H.; Park, K.H. Identification of dispersion-dependent hexagonal cavity modes of an individual ZnO nanonail. Appl. Phys. Lett. 2008, 92. [Google Scholar] [CrossRef] [Green Version]
  6. Dai, G.; Zhang, Y.; Liu, R.; Wan, Q.; Zhang, Q.; Pan, A.; Zou, B. Visible whispering-gallery modes in ZnO microwires with varied cross sections. J. Appl. Phys. 2011, 110, 033101. [Google Scholar] [CrossRef]
  7. Czekalla, C.; Sturm, C.; Schmidt-Grund, R.; Cao, B.; Lorenz, M.; Grundmann, M. Whispering gallery mode lasing in zinc oxide microwires. Appl. Phys. Lett. 2008, 92, 2006–2009. [Google Scholar] [CrossRef]
  8. Chen, Y.; Chen, Y. Enhanced random lasing in ZnO nanocombs assisted by Fabry–Perot resonance. Opt. Express 2011, 19, 8728. [Google Scholar] [CrossRef]
  9. Bartolomé, J.; Cremades, A.; Piqueras, J. Thermal growth, luminescence and whispering gallery resonance modes of indium oxide microrods and microcrystals. J. Mater. Chem. C 2013, 1, 6790–6799. [Google Scholar] [CrossRef]
  10. Sotillo, B.; Fernández, P.; Piqueras, J. Light guiding and optical resonances in ZnS microstructures doped with Ga or In. J. Mater. Chem. C 2015, 3, 10981–10989. [Google Scholar] [CrossRef]
  11. Pavón, F.; Urbieta, A.; Fernández, P. Luminescence and light guiding properties of Er and Li codoped ZnO nanostructures. J. Lumin. 2018. [Google Scholar] [CrossRef]
  12. Khanum, R.; Das, N.M.; Moirangthem, R.S. Defect engineered ZnO whispering gallery modes via doping with alkali metal ions for label-free optical sensors. J. Appl. Phys. 2019, 125. [Google Scholar] [CrossRef]
  13. Dong, H.; Zhou, B.; Li, J.; Zhan, J.; Zhang, L. Ultraviolet lasing behavior in ZnO optical microcavities. J Mater. 2017, 3, 255–266. [Google Scholar] [CrossRef]
  14. Wang, Q.; Yan, Y.; Qin, F.; Xu, C.; Liu, X.; Tan, P.; Shi, N.; Hu, S.; Li, L.; Zeng, Y.; et al. A novel ultra-thin-walled ZnO microtube cavity supporting multiple optical modes for bluish-violet photoluminescence, low-threshold ultraviolet lasing and microfluidic photodegradation. NPG Asia Mater. 2017. [Google Scholar] [CrossRef] [Green Version]
  15. Tereshchenko, A.; Yazdi, G.R.; Konup, I.; Smyntyna, V.; Khranovskyy, V.; Yakimova, R.; Ramanavicius, A. Application of ZnO Nanorods Based Whispering Gallery Mode Resonator in Optical Immunosensors. Colloids Surf. B Biointerfaces 2020, 191. [Google Scholar] [CrossRef] [PubMed]
  16. Absalan, H. A Four-Channel Optical Demultiplexer Using Photonic Crystal-Based Resonant Cavities. J. Opt. Commun. 2018, 39, 369–373. [Google Scholar] [CrossRef]
  17. Burhanuddin, H.M.; Zuikafly, S.N.F.; Ibrahim, A.A.; Ambran, S.; Mikami, O.; Fujikawa, C.; Ahmad, F. Optical comb filter generation in micro cavity employing Zinc Oxide based film. J. Phys. Conf. Ser. 2019, 1371. [Google Scholar] [CrossRef]
  18. Rokhsari, H.; Vahala, K.J. Ultralow loss, high Q, four port resonant couplers for quantum optics and photonics. Phys. Rev. Lett. 2004, 92, 1–4. [Google Scholar] [CrossRef] [Green Version]
  19. Ariza, R.; Pavón, F.; Urbieta, A.; Fernández, P. Study of the influence of dopant precursor on the growth and properties of Li-doped ZnO. J. Phys. Chem. Solids 2020, 139. [Google Scholar] [CrossRef]
  20. Bond, W.L. Measurement of the refractive indices of several crystals. J. Appl. Phys. 1965, 36, 1674–1677. [Google Scholar] [CrossRef]
  21. Wang, N.; Chen, X.; Yang, Y.; Dong, J.; Wang, C.; Yang, G. Diffuse reflection inside a hexagonalnanocavity. Sci. Rep. 2013, 1–4. [Google Scholar]
  22. Grudinin, I.S.; Ilchenko, V.S.; Maleki, L. Ultrahigh optical Q factors of crystalline resonators in the linear regime. Phys. Rev. A At. Mol. Opt. Phys. 2006, 74. [Google Scholar] [CrossRef]
  23. Ursaki, V.V.; Burlacu, A.; Rusu, E.V.; Postolake, V.; Tiginyanu, I.M. Whispering gallery modes and random lasing in ZnO microstructures. J. Opt. A Pure Appl. Opt. 2009, 11. [Google Scholar] [CrossRef]
  24. Chen, R.; Ling, B.; Sun, X.W.; Sun, H.D. Room temperature excitonic whispering gallery mode lasing from high-quality hexagonal ZnO microdisks. Adv. Mater. 2011, 23, 2199–2204. [Google Scholar] [CrossRef] [PubMed]
  25. Bhowmik, A.K. Polygonal Optical Cavities. Appl. Opt. 2000, 39, 3071–3075. [Google Scholar] [CrossRef] [PubMed]
  26. Zhang, C.; Zou, C.L.; Yan, Y.; Wei, C.; Cui, J.M.; Sun, F.W.; Yao, J.; Zhao, Y.S. Self-Assembled Organic Crystalline Microrings as Active Whispering-Gallery-Mode Optical Resonators. Adv. Opt. Mater. 2013, 1, 357–361. [Google Scholar] [CrossRef]
Figure 1. Scheme of the different resonant optical modes that can be supported in a hexagonal cavity.
Applsci 10 08602 g001
Figure 2. SEM images of the structures with different morphologies: (a) long tapered rods growing from a central ball and (b) a long tapered nail.
Applsci 10 08602 g002
Figure 3. (a) SEM image of the selected rod, where the Y-axis scale used to perform the maps in (b,c) is shown. The directions of the transverse electric (TE) and transverse magnetic (TM) polarizations with respect to the c-axis of the structure are also indicated. (b,c) The maps of the evolution of the µ-PL emission along the Y-direction marked in (a): (b) total photoluminescence (PL) signal, (c) TE polarization, and (d) TM polarization.
Applsci 10 08602 g003
Figure 4. Analysis of the whispering gallery modes observed in region (i) of the structure in Figure 3a. The length side “a” of the cavity was 1.34 µm at the selected point. (a) µ-PL spectra for all the polarization conditions. (b) Interference order N of the peaks observed in the spectra of part (a). (c) Refractive index estimated from the wavelength position of the resonant peaks. (d) Variation of the order N wavelength position as a function of the position along the structure, i.e., as a function of the size of the cavity).
Applsci 10 08602 g004
Figure 5. (a) SEM image and (b) µ-PL spectra for all the polarization conditions of the transition region. The polarized spectra show how the modes associated with the quasi-WG were more prominent.
Applsci 10 08602 g005
Figure 6. Analysis of the whispering gallery modes in region (iii). The measured length side “a” measured in the (a) SEM images was 0.72 µm. (b) µ-PL spectra for all the polarization conditions, (c) interference order N of the peaks observed in the spectra, and (d) estimation of the refractive index from the wavelength that virtually overlapped for both polarizations.
Applsci 10 08602 g006
Figure 7. (a) SEM image of a long nail ending in a hexagonal head with the Y-axis scale used to record the µ-PL map in (b). The µ-PL map shows the variation along the stem of the nail in terms of the intensity and wavelength shifts.
Applsci 10 08602 g007
Figure 8. SEM micrograph and µ-PL spectra for all polarization modes for the hexagonal head in region (i) (a,b) and the tip of the nail in region (iv) (c,d). The resonance modes were broader than other regions due to the rapid changes in the cross-section length, blurring the peaks.
Applsci 10 08602 g008
Figure 9. Analysis of the whispering gallery modes in region (ii) of the nail. The side length “a” measured in the (a) SEM images was 1.04 µm. (b) µ-PL spectra for all the polarization conditions, (c) interference order N of the peaks observed in the spectra, and (d) estimation of refractive index from the wavelength, which virtually overlapped for both polarizations.
Applsci 10 08602 g009
Figure 10. Analysis of the whispering gallery modes in region (iii). The measured length side “a” measured in the (a) SEM images was 1.39 µm. (b) µ-PL spectra for all the polarization conditions and spectra (c) shows a detailed second set of resonant peaks from the Fabry-Pérot modes. (d) Interference order N of the peaks observed in the spectra. (e) Estimation of the refractive index from the wavelength. Due to the thicker section in this structure, the calculated refractive indexes were less accurate, showing a higher difference for both polarizations.
Applsci 10 08602 g010
Table 1. Calculated quality (Q) factor and finesse (F) for each wavelength in the cross and the nail structures. In order to compare the results from the different types of structures, data were centered at 515 nm, which was a common peak.
Cross—Cavity of Figure 6Nail—Cavity of Figure 9
Wavelength (nm)Q FactorFWavelength (nm)Q FactorF
648.35398.914.17
620.99897.233.88
673.26182.3713.59596.248133.405.15
623.08230.0215.39573.21177.346.51
581.4198.9512.07552.167227.877.96
546.12212.2911.75532.888229.217.49
515.9224.2811.17515.485283.908.75
490.21214.949.73499.593494.9414.45
468.02159.806.49485.004589.0016.20
471.665624.5416.14
459.472671.1416.44
Table 2. Calculated reflectivities for both types of cavities.
Cross—Cavity of Figure 6Nail—Cavity of Figure 9
Wavelength (nm)RWavelength (nm)R
648.3530.85
620.9980.84
673.260.84596.2480.87
623.080.86573.210.90
581.40.83552.1670.92
546.120.83532.8880.91
515.90.83515.4850.93
490.210.81499.5930.96
468.020.75485.0040.96
471.6650.96
459.4720.96
Publisher’s Note: MDPI stays neutral with regard to jurisdictional claims in published maps and institutional affiliations.

