Article

Energy Absorption of Aluminium Extrusions Filled with Cellular Materials Under Axial Crushing: Study of the Interaction Effect

1
Structural Mechanics Group, School of Civil Engineering, Universidade da Coruña, Campus de Elviña, 15071 A Coruña, Spain
2
Structural Impact Laboratory (SIMLab) and Centre for Advanced Structural Analysis (CASA), Department of Structural Engineering, Norwegian University of Science and Technology (NTNU), 7491 Trondheim, Norway
3
School of Civil Engineering, Universidade da Coruña, Campus de Elviña, 15071 A Coruña, Spain
*
Author to whom correspondence should be addressed.
Appl. Sci. 2020, 10(23), 8510; https://doi.org/10.3390/app10238510
Submission received: 8 November 2020 / Revised: 24 November 2020 / Accepted: 25 November 2020 / Published: 28 November 2020
(This article belongs to the Special Issue Armour and Protection Systems)

Abstract

:
This investigation focuses on the interaction effect during the quasi-static axial crushing of circular and square thin-walled aluminium extrusions filled with polymeric foam or cork. The increment in the absorbed energy due to interactions between materials was assessed using a validated numerical model calibrated with experimental material data. Simulations were run with variable cross-section dimensions, thickness, and foam density. The results were used to adjust the parameters of design formulas to predict the average crush forces of foam- and cork-filled thin-walled tubes. The analysis of the energy dissipation per unit volume revealed that the highest increments due to the interaction between materials appeared in the foam-filled square extrusions. Energy dissipation increased with higher density foams for both cross-sections due to a stronger constraint of the aluminium walls, and thus a reduction of the folding length. Thinner tube walls also delivered a higher improvement in the energy dissipation per unit volume than those with thicker walls. The contribution of friction was also quantified and investigated.

1. Introduction

Energy-absorbing components have become ever more important within the transport industries, as they can provide increased passenger protection while complying with lightweight and reduced emission requirements. These structures should dissipate as much energy as possible during impact scenarios by plastic deformation, while the loads transferred to passengers and close structures must be kept as low as possible.
Thin-walled tubular structures have been studied since the 1960s [1] and are the epitome of such devices, as their axial loading may yield progressive collapse modes with high specific energy absorption despite their light weight [2]. Furthermore, their shape and thickness-to-weight ratios are similar independently of the scale difference between aircraft, automobile, and train structures, which increases the versatility of the components [3]. As a result, steel and aluminium crash boxes are found in automobile assemblies [4], trains [5], aircraft [6], and even helicopter sub-floor structures [7].
After the initial studies seeking a deeper knowledge on the tubes’ crush behaviour with diverse cross-sections and loading conditions [8,9,10], a number of investigations were carried out on filled tubes. Earlier designs for these inner reinforcements were light and soft cellular materials such as foams, although the current state of the art features cores ranging from metals [11] to fiber-reinforced polymers [12], cork [13,14], wood [15], or combinations of two or more materials [16]. The use of cores allows for higher energy dissipation by the tubular components with little increase in weight and maintaining the space taken up by the tube.
Adhering to cores made of cellular materials, foams have been by far the most studied, as they enable homogeneous and stable forces during axial crushing [17]. The mechanical properties of foams are highly dependent of two factors: the inner cellular structure and the base material conforming the cell walls [18,19]. The choice of different base materials has been thoroughly examined, with aluminium and polymeric foams being used the most [20]. In the particular case of specimens filled with aluminium foams, Hanssen et al. [21,22] studied how and why the behaviour of square cross-sections is altered by the presence of a core, both under static and dynamic loads. It was found that foam filling resulted in a higher number of tube folds, rooted in the stiffness effect of the aluminium foam on the tube walls which reduced their buckling length. They also proposed an equation to predict the average crushing force of foam-filled extrusions, considering the contributions from the tube, foam, and the interaction effect between both.
The aforementioned equation has since been used by other authors to determine the strengthening effect of different fillings. Santosa and Wierzbicki [23] found that the contribution from the foam-tube wall interaction accounts for around 80% of the foam strength in square sections filled with aluminium foams, which can be doubled if using adhesive in the interface between both materials. Toksoy and Güden [24] studied the effect of polystyrene foams filling circular tubes, finding an increased interaction effect with smaller tube cross-sections. Another investigation relying on the equation from Hanssen et al. [21] is the study from Toksoy and Güden [25] on the effect of tube thickness and foam density on the component’s energy absorption, showing that filled tubes were energetically more efficient than empty tubes only after reaching a certain foam relative density.
Much attention has been drawn towards polymeric foams given their low weight, high specific energy absorption, and production ease [26]. However, little has been published studying the effect of polymeric foams on the collapse of thin-walled tubes following a similar approach as that from [21,22]. Some research can be found studying the interaction between polystyrene foams and circular tubes as that from Kavi et al. [27]. They showed that an efficient foam filling can be obtained with the appropriate foam-tube combination selected by taking into account the magnitude of the strengthening coefficient of the filling and the foam plateau load.
The analysis of thin-walled structures began in a time when computer resources did not allow to substitute their experiment by numerical simulations, as shown by the theoretical expressions and experimental campaign data bequeathed from this time. However, current finite element codes enable an accurate prediction of axial crushing problems while saving cost, time, and providing additional valuable information.
Within this context, the current investigation seeks to characterise the magnitude and origin of the interaction between thin-walled extrusions and cellular materials. To that end, this work relies on finite element simulations to understand the effect of cross-section geometry, dimensions, and the nature of the filling material on the interaction between the reinforcing materials and their confining structures. Moreover, the simulation data is used to adjust design formulas that can predict the average crush forces of foam- and cork-filled thin-walled tubes.

2. Interaction Effect and Component Design

It is a well known fact that during axial crushing of foam-filled tubes the crushing force is higher than the sum of the individual crushing forces of the empty tube and the foam crushed separately. This is mainly due to two mechanical phenomena, namely: (i) the friction between both materials generates additional resistance to crushing, and (ii) the foam works as a constraint for the tube walls and reduces their buckling length, thus increasing the number of folds generated during axial crushing, and therefore the energy absorbed by plastic deformation of the tube. This constraint can also change the global folding mode developed in the tube quite radically, as shown by Hanssen et al. [28]. The interaction effect in filled tubes is illustrated in Figure 1 using conceptual force-displacement curves.
In order to shed some more light on the origin on this interaction, validated numerical models of two components consisting of an aluminium extrusion in alloy AA6063-T5 with circular and square cross-sections filled with two different cellular materials were run and analysed. The filling cellular materials were an agglomerate of natural cork (Amorim Corecork NL25) and a polyethylene terephthalate (PET) polymeric foam (Armacell ArmaFORM PET/W AC 135). The cross-sectional dimensions of the aluminium walls and the density of the PET foam were variable in order to investigate their influence on the interaction effects. A schematic representation of the studied components is shown in Figure 2, and the bounds of the variable properties are given in Table 1. Notice that the diameter of the circular extrusion and the side of the square extrusion were bounded in a way such that both tubes had the same perimeter.
The use of validated numerical models helps in understanding the source and magnitude of the interaction effect in the current problem, because the energies dissipated by each material in a filled component can be immediately quantified and compared. Moreover, the energy dissipated by friction is also readily available from the simulations.
Alternatively, the assessment of the interaction between the aluminium tubes and the inner cores can also be done applying the model proposed by Hanssen et al. [22], where the average crushing force of a component is given by
F avg = F avg 0 + A r σ r + C avg σ r α σ y ( 1 α ) b m β t ( 2 β ) ,
where F avg is the average crushing force of the filled component, F avg 0 is the average force of the aluminium tube, σ y is the yield stress of the aluminium alloy, b m = b t where b represents the outer diameter (circular tube) or side (square tube) of the aluminium extrusion, A r is the area of the reinforcing material, and σ r refers to its plateau stress. The parameters C avg ,   α , and β account for and quantify the additional crushing force stemming from the interaction effect, and are to be fitted to the results of an experimental campaign or a set of numerical simulations.

3. Material Tests and Constitutive Modelling

This section elaborates on the constitutive modelling of the three different materials used in the current investigation. Because the analysis of the interaction effects relies solely on validated numerical models, these constitutive laws had to account for the key mechanical properties and responses of the materials. All models were calibrated against dedicated material tests with the single exception of the foam, whose model was borrowed from a previous publication by some of the authors where the constitutive law was calibrated and validated.

3.1. Aluminium Alloy 6063-T5

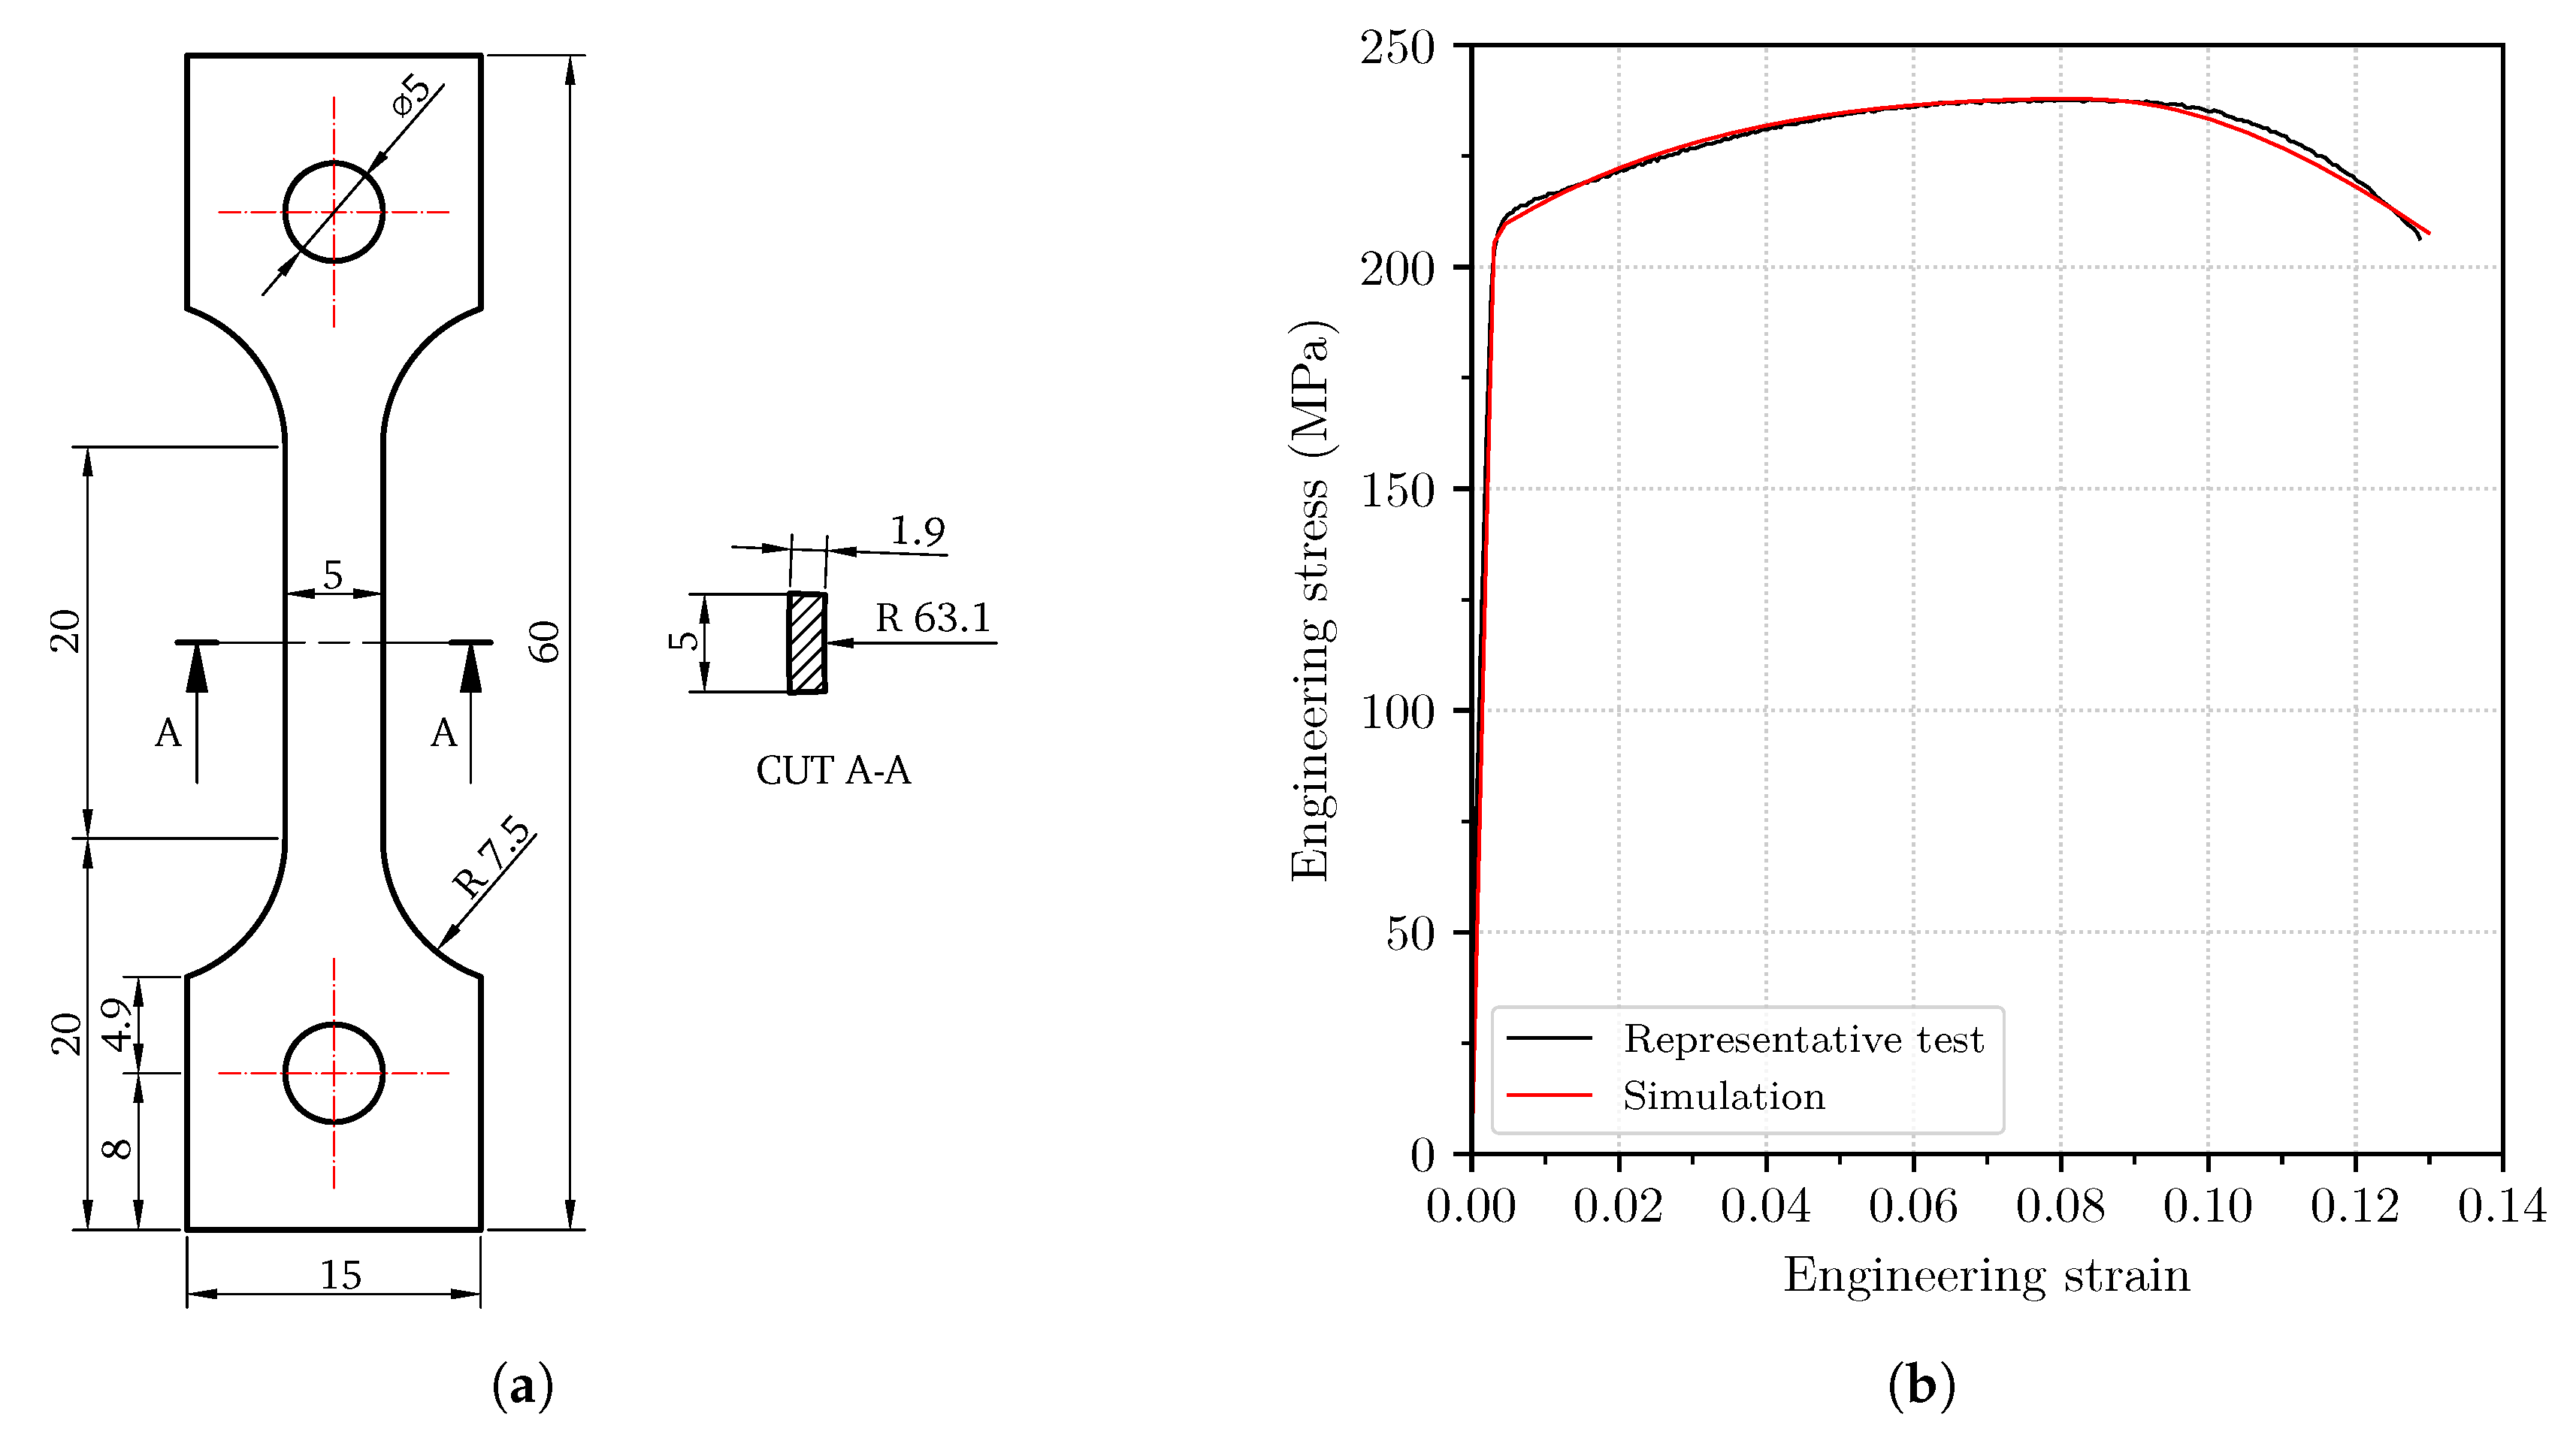
The circular extrusions were made of AA6063 in temper T5. We extracted tensile specimens with the dimensions provided in Figure 3a using electrical discharge machining (EDM) in a pool of de-ionized water to prevent the material from altering its microstructure due to heating. Three specimens were tested at a constant cross-head velocity of 1 mm/min, as described in [29]. Strains were measured with digital image correlation (DIC) using a Prosilica GC2450 camera to take pictures of the gauge’s surface every second. This surface was previously painted with a speckle pattern to enable the DIC software eCorr [30] to compute the strain fields.
The mechanical behaviour of this alloy was modelled with an hypoelastic-plastic constitutive law, adopting an elastic modulus of 70 GPa and a Poisson’s ratio of 0.33 for the elastic part.
The yield function f can be written as
f = σ eq σ 0 + R 0 ,
where σ eq is the equivalent stress, σ 0 is the initial yield stress, and R represents the isotropic hardening. We adopted von Mises’ yield criterion with an associated flow rule, so the equivalent stress in Equation (2) is given in terms of the deviatoric stress tensor σ i j as σ eq = 3 2 σ i j σ i j , and the direction of the plastic flow is determined by adopting f as the flow potential. Therefore, the components of the plastic strain rate tensor ε ˙ i j p are computed as
ε ˙ i j p = λ ˙ f σ i j ,
where λ ˙ is the plastic multiplier computed from the consistency condition λ ˙ f ˙ = 0 .
A Voce work-hardening rule with three terms was fitted to the experimental data. Thus, the strain–hardening R is represented by
R = i = 1 3 Q i 1 exp θ i Q i p ,
where Q i represent the saturation stresses, θ i are the initial hardening moduli, and p is the equivalent plastic strain, defined through its rate p ˙ by
p ˙ = σ i j ε ˙ i j p σ eq = λ ˙ = 2 3 ε ˙ i j p ε ˙ i j p ,
since the equivalent plastic strain rate is work-conjugate to the equivalent stress. Notice that the last part of Equation (5) is valid for Mises plasticity only.
While a set of parameters for the work-hardening rule was already provided in [31], we refined the calibration using inverse modelling of the tensile tests. The tensile specimens were modelled with 10 solid elements through the thickness in Abaqus/Standard 2019 [32], and we used LS-OPT version 5.2 [33] to find the best-fitting set of strain-hardening parameters. Table 2 provides the values obtained from this calibration. The representative experimental engineering stress-strain curve is compared to the results of the calibrated inverse model in Figure 3b, where an adequate fit is observed. A virtual extensometer with a length of 15 mm was used for both the DIC experimental data and the numerical simulation.
Because some cracks were reported in the walls of the aluminium extrusions in the experimental campaign [29], we have included a damage model based on the Cockcroft-Latham (C-L) criterion [34], which was calibrated from the tensile tests data. Moreover, since the thickness of the profiles and the strength of the filling materials was varied in the current investigation, accounting for failure seemed reasonable. According to the C-L criterion, the damage variable D is computed at each integration point as
D = 1 W c σ 1 d p ,
where W c is an experimental parameter, σ 1 is the first –major– principal stress, and represents the Macaulay brackets defined as x = max 0 , x . Thus, damage is only accumulated when the first principal stress is positive. The parameter W c was obtained from the inverse model of the tensile tests with a refined mesh of solid elements. Despite its simplicity, this damage model successfully predicted damage in a variety of different loading scenarios and aluminium manufacturing routes such as extruded profiles [35], die-cast alloys [36], or additive manufactured aluminium parts [37].
During axial crushing, the walls of the extrusion are subjected to a combination of membrane and bending loads. Membrane loading of ductile materials implies that strains localise at a certain point before failure, while localisation does not take place under bending deformation [38]. Therefore, it is reasonable to modulate the macroscopic ductility according to the ratio between bending and membrane loads in each element. To that end, we incorporated the damage regularisation strategy for shell elements proposed by Costas et al. [35]. This implies that elements under membrane loading—susceptible to strain localisation—get their macroscopic ductility W c reduced, while the fracture parameter determined from inverse modelling of tensile tests with a fine solid element mesh is assigned to those elements under pure bending. Furthermore, the adopted damage regularisation model alleviates the mesh dependency of the failure parameter by scaling it according to the element size. This means that smaller elements will have a higher W c than larger elements.
The regularisation scheme evaluates the bending-to-membrane loading ratio in each element by means of a local indicator Ω , defined as
Ω = 1 2 ε p , 33 T ε p , 33 B max ε p , 33 T , ε p , 33 B ,
where ε p , 33 T and ε p , 33 B are the through-thickness plastic strains at the top and bottom integration points of the element, respectively. Notice that the x 3 -axis is aligned with the thickness direction of the shell element in the adopted co-rotational system. Equation (7) bounds the indicator Ω between 1 for pure bending and 0 for pure membrane loads, thus the local W c parameter for each element can be obtained from the weighted sum of the parameters under pure bending W c b and pure membrane W c m ,
W c = Ω W c b + 1 Ω W c m .
In turn, the element ductility under membrane loads depends on the element length-to-thickness ratio l e / t e ,
W c m = W c l + W c s W c l exp c l e t e 1 .
It was shown in Costas et al. [35] that using this kind of bending regularisation helps to capture the correct crushing modes of thin-walled aluminium extrusions. Since the current investigation relies solely on numerical results, using this regularisation improves the quality and robustness of the results and conclusions.
The parameters W c l , W c s , c and W c b were calibrated from the tensile test data following the procedure outlined in Costas et al. [35]. Their values are provided in Table 2.

3.2. Cork Agglomerate

The mechanical behaviour of cork agglomerate Corecork NL25 was modelled with the hyperelastic compressible constitutive law proposed by Hill [39] and Storåkers [40], where the strain energy density function U is in the form
U = i = 1 N 2 μ i α i 2 λ 1 α i + λ 2 α i + λ 3 α i 3 + 1 β i J α i β i 1 ,
where N determines the number of terms, μ i , α i and β i are material parameters to be calibrated, λ i are the principal stretches, and J is the volume ratio computed as the determinant of the deformation gradient. The volume ratio is used in the second part of the strain energy density function equation because cork is a collapsible material and hyperelastic incompressibility cannot be assumed. This model was successfully applied to impact in a similar cork agglomerate by Fernandes et al. [41], the difference being they coupled a Mullins dissipation model for cyclic loading. Since the current investigation deals with proportional loading only, such dissipative extension is not necessary.
The β i parameters are related to the material’s Poisson’s ratio, and therefore govern the compressibility of each term. It can be shown that this relation reads
β i = ν i 1 2 ν i .
A Poisson’s ratio of 0.1 was experimentally determined from uniaxial compression tests, therefore we set β i to 0.125 for all terms.
The parameters μ i and α i were identified from uniaxial compression tests on cylindrical samples of cork agglomerate with a nominal diameter of 50.5 mm and a nominal thickness of 12 mm. The tests were conducted using an HBM-C2 50 kN load cell with a gain of 2 mV/V and two Vishay HS50 linear variable differential transformers (LVDT). The actuator moved at a constant velocity of 1.48 mm/min. Thin sheets of polytetrafluoreten were placed between the specimens and the machine to minimise friction. The test set-up is displayed in Figure 4a.
Engineering stress-strain curves were computed from the tests and used for the identification of the parameters μ i and α i . To that end, the first Piola-Kirchhoff stress –or engineering stress– was derived from the strain potential in Equation (10). In principal axes, the first Piola-Kirchhoff stress in direction j, P j , is obtained as
P j = U λ j = 2 λ j i = 1 N μ i α i λ j α i J α i β i .
The volume ratio under uniaxial compression is J = λ 3 1 2 ν , where λ 3 is the stretch in the compression direction. By inserting this expression in Equation (12), applying Equation (11) for a constant Poisson’s ratio ν and simplifying the expression, the first Piola-Kirchhoff stress in the compression direction P 3 reads
P 3 = 2 λ 3 i = 1 N μ i α i λ 3 α i λ 3 α i ν .
If we transform the stretch into engineering strain e by doing λ 3 = 1 + e 3 , we can fit Equation (13) to the experimental data from the uniaxial compression tests and thus identify μ i and α i . This fit was done for N = 1 , 2 , 3 , and the comparison with the representative experimental engineering stress-strain curve is shown in Figure 4b, where compressive stress and strain are plotted with positive sign for clarity. As it can be seen, the curves are quite similar in the three cases. However, a Drucker stability check was run for each case showing that only the parameters fitted with N = 2 produced a Drucker-stable material for all strain levels and states. Therefore, we opted for including two terms in the strain energy density function. The parameters identified with N = 2 are given in Table 3.
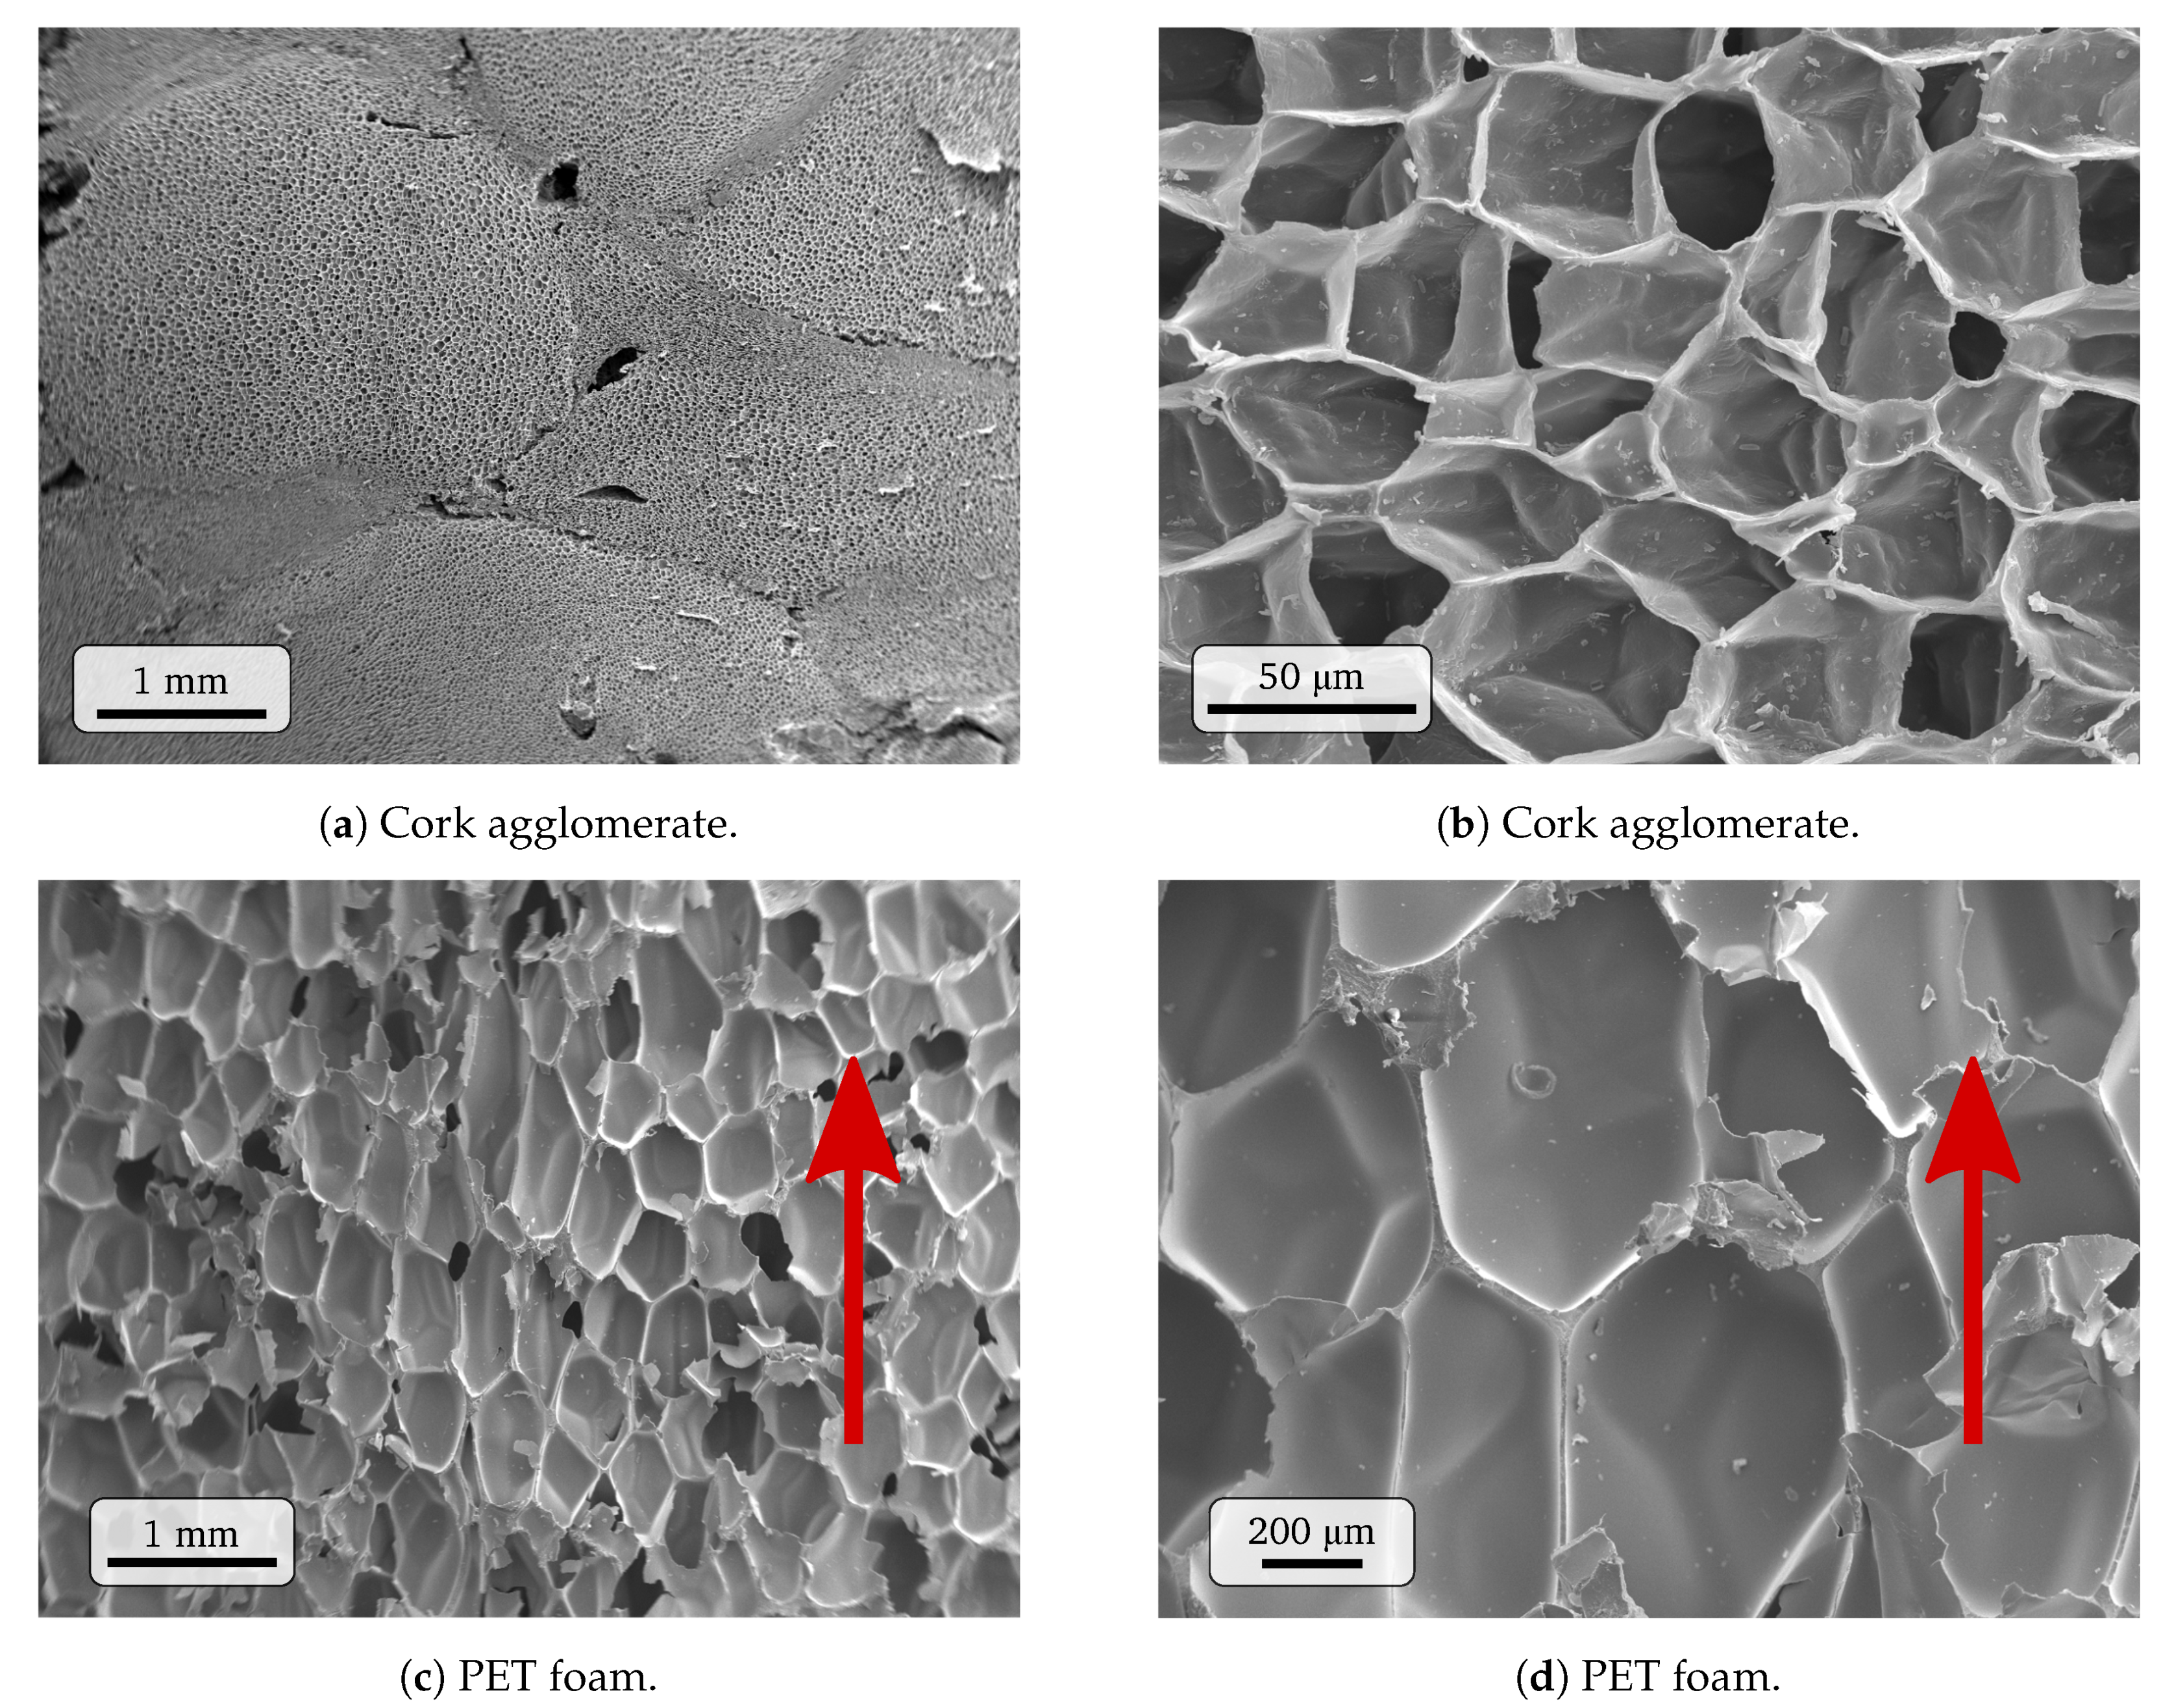
The microstructure of the cork agglomerate was observed under scanning electron microscopy (SEM). Images of the critical point-dried cork agglomerate at two different magnification levels are provided in Figure 5a,b, where the material’s inner structure is clearly depicted. The grains or particles the agglomerate is made of are visible in Figure 5a, and a higher magnification level enables to see the closed-cell microstructure of the natural cork, with cell sizes around 50 μ m, see Figure 5b.

3.3. Pet Foam

The foam ArmaFORM PET/W AC 135 is a PET-based foam with anisotropic plastic behaviour. The constitutive model and parameters for this material have been borrowed from [31], where the isotropic yield surface proposed by Deshpande and Fleck [42] with non-associated plastic flow was calibrated for both the extrusion and transverse directions. Since the foam is primarily loaded in uniaxial compression during axial crushing, we have considered only the calibration in the extrusion direction. Deshpande’s yield surface reads
f = 3 J 2 + α I 1 3 2 B = 0 ,
where J 2 is the second invariant of the stress deviator, α is a dimensionless parameter governing the shape of the yield surface, I 1 is first invariant of the stress tensor, and B is a parameter controlling the size of the yield locus. Therefore, the yield surface is deviatoric- and pressure-dependent through von Mises’ equivalent stress and the hydrostatic stress, respectively.
Work-hardening was modelled through a direct input of the material stress-strain data under uniaxial compression provided in [31]. Plastic flow is governed by the flow potential g, defined as
g = 3 J 2 + β I 1 3 2 = 0 .
Notice that the flow potential is similar to the yield function in Equation (14) except for the parameter β instead of α and the absence of the scalar B. Therefore, β = α would give associated plastic flow. If we introduce a parameter ν p defined as the ratio between the plastic strain rate in axial and lateral directions during uniaxial compression, it is quite straightforward to show that β can be expressed as a function of ν p as
β = 3 2 1 2 ν p 1 + ν p .
The parameter ν p was obtained from Costas et al. [31], where low strain-rate, uniaxial compression tests were run until densification of the foam. The value of ν p was computed by measuring the permanent lateral deformation of the post-mortem specimens and dividing it by their permanent axial deformation.
All parameters required for the constitutive model of the PET foam were borrowed from [31], and are summarised in Table 4.
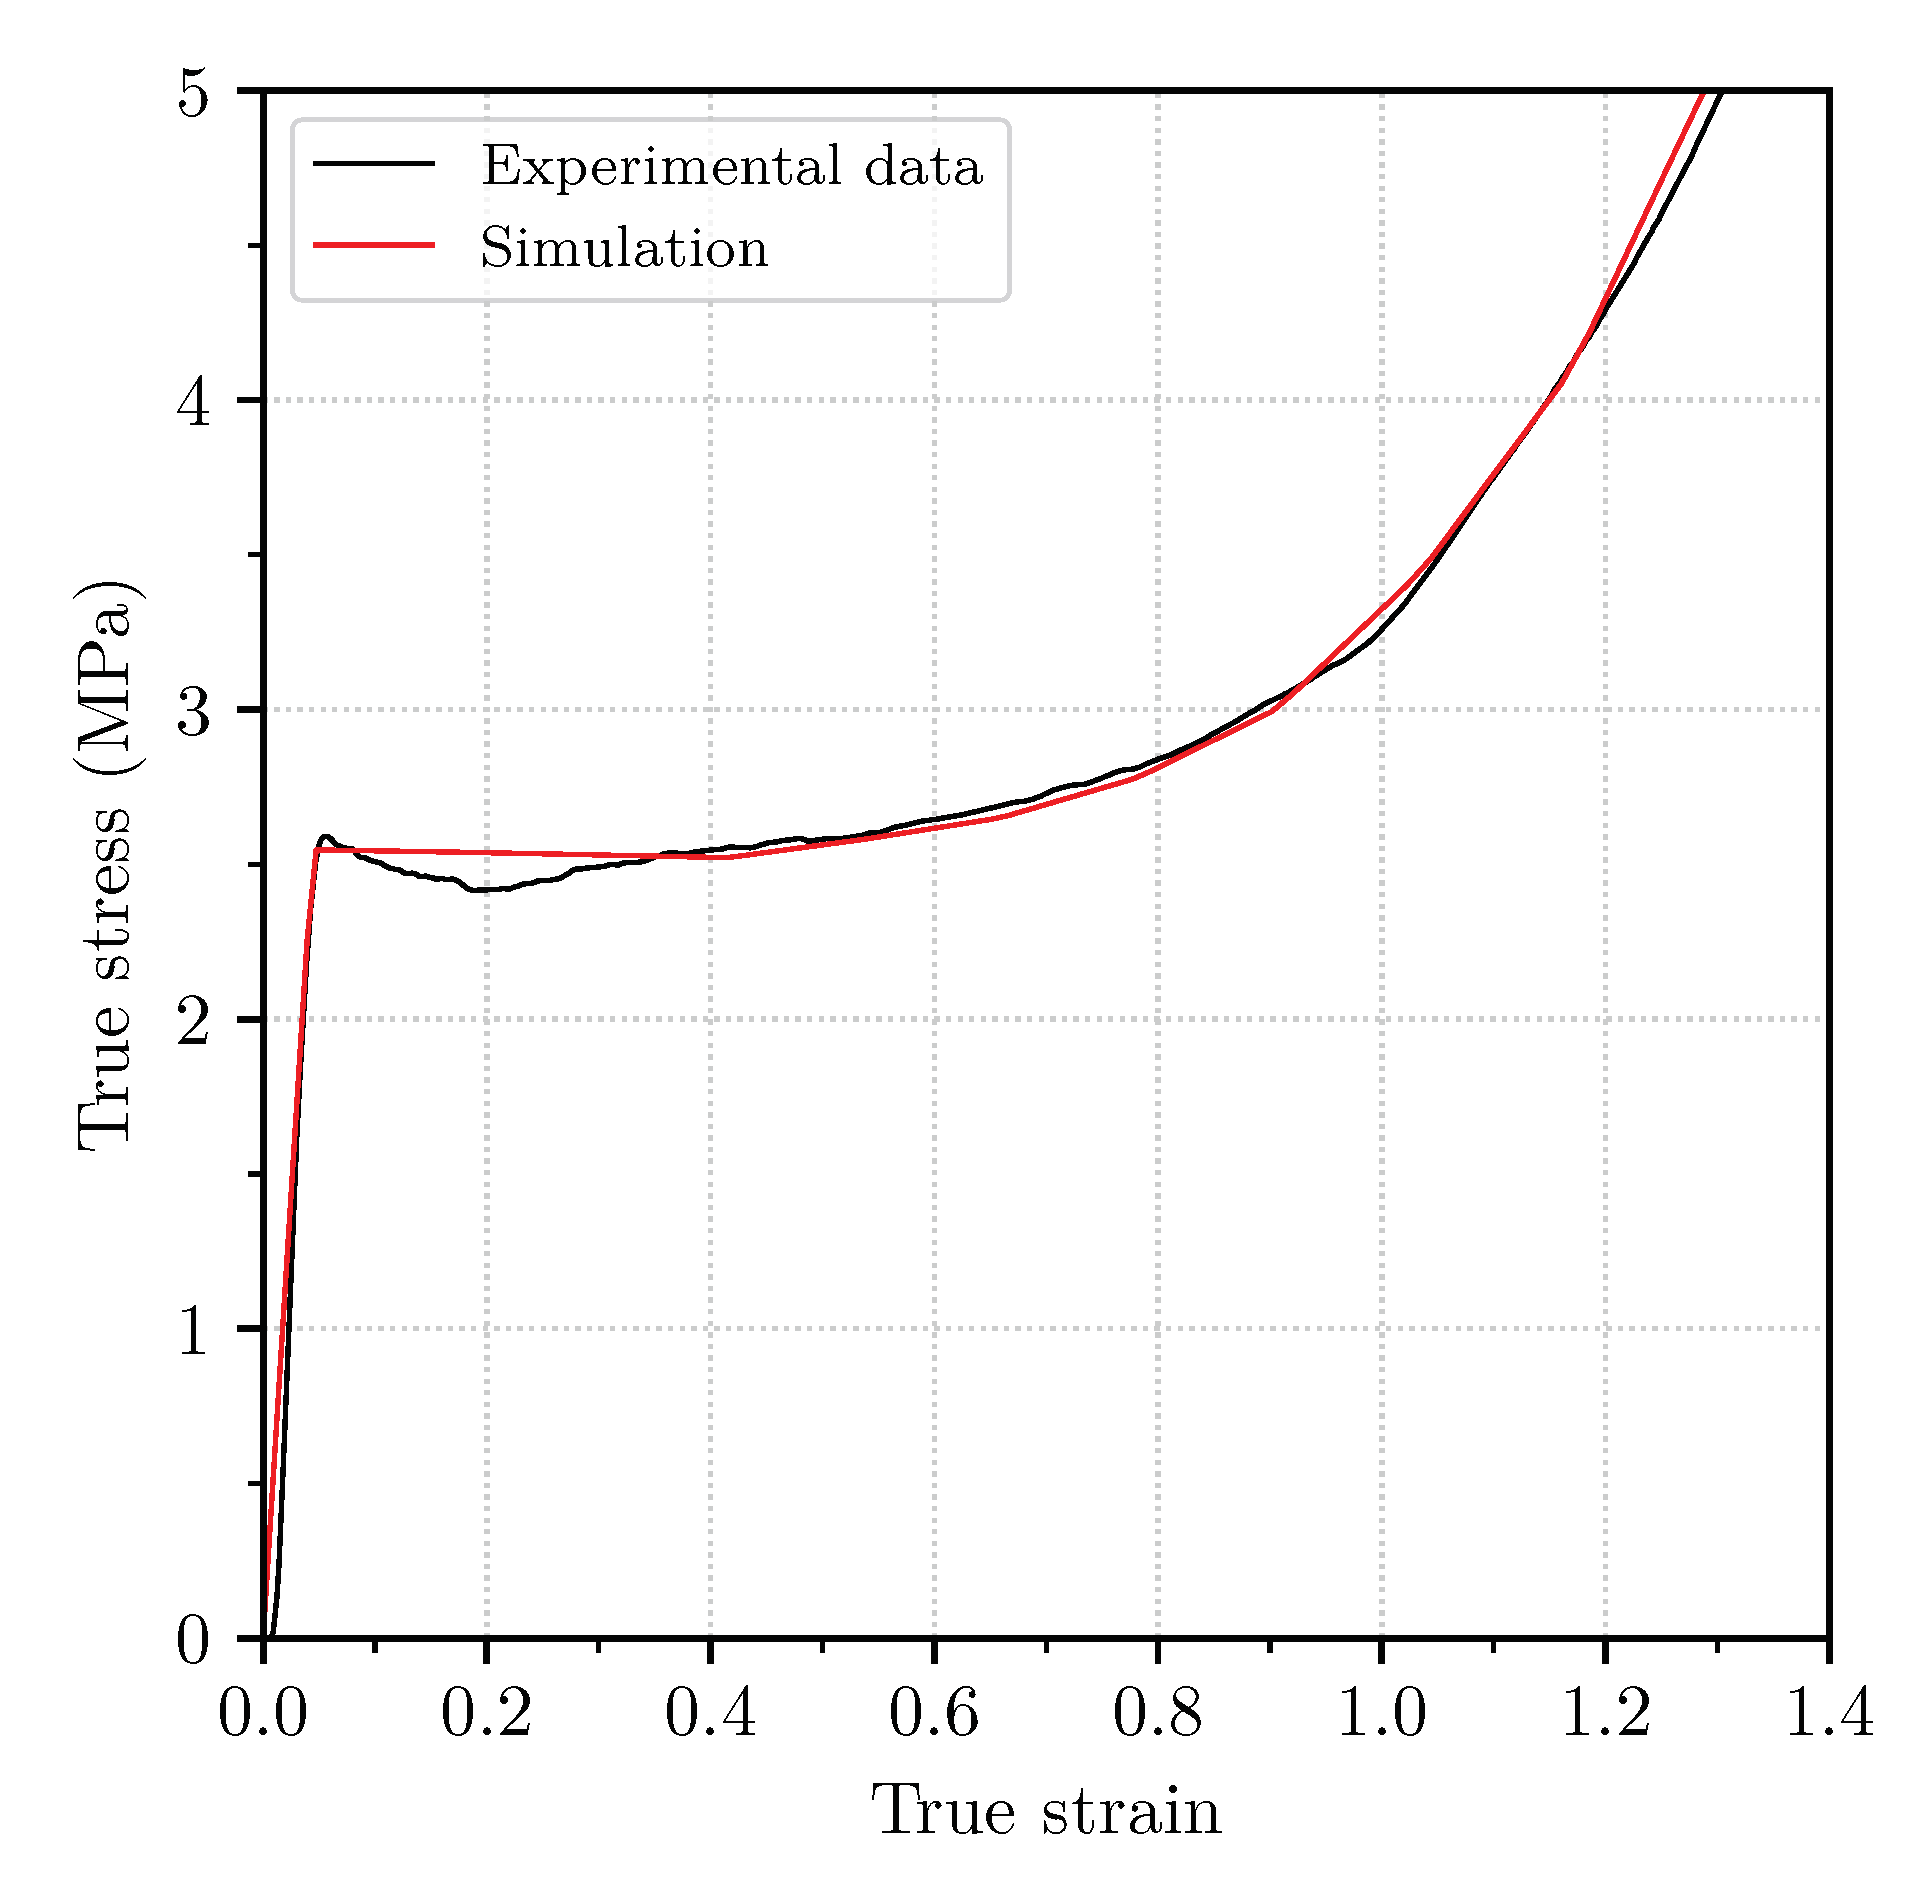
A representative experimental true stress-strain curve is compared with the numerical model in Figure 6 for the extrusion direction, with positive sign. The minor softening exhibited by the material at low strain levels was neglected in exchange for a smoother computation of the plastic flow.
The density of an extruded PET foam can be set during its fabrication. Higher densities imply lower void ratios and thus higher crushing strength, in exchange for a heavier material. Although Costas et al. [31] only reported material tests on the 135 kg/m 3 version of this foam, the supplier offers this material in five other densities between 80 kg/m 3 and 200 kg/m 3 . The relationship between density and strength for this material can be approximated by
σ 0 y [ MPa ] = 0.0221899 ρ [ kg / m 3 ] 0.7219274 ,
where σ 0 y is the initial yield stress and ρ is the density expressed in kg/m 3 [31]. The work-hardening was assumed to be multiplied by the same ratio as the initial yield stress in the current investigation.
Foam samples extracted from the 135 kg/m 3 foam were also analysed under SEM (Figure 5c,d) where the extrusion direction is indicated with an arrow. The closed cells visible in the images seem to be elongated in the extrusion direction, which is probably the reason why this material exhibits strongly anisotropic mechanical properties [31]. The average cell size of this PET foam is around 400 μ m, i.e., eight times larger than that of the cork. Thus, in general terms, both PET foam and cork agglomerate exhibit a similar microstructure with closed cells of different sizes.

4. Component Modelling and Interaction Analysis

4.1. Component Design and Simulation

Axial crushing simulations were run in Abaqus/Explicit 2017 [43]. Two cross-section geometries are considered, circular and square, both studied in their empty configuration or filled with either foam or cork. To further understand the relation between geometry and interaction, the cross-section dimensions and thickness were varied within the bounds in Table 1. All components were 350 millimetres long.
The aluminium extrusions were meshed with linear shell elements with reduced integration and hourglass control. The foam and cork fillings were modelled with linear solid elements with an element size of five millimetres, also with reduced integration and hourglass control. The tangential contact between the materials was modelled with a static friction coefficient of μ a = 0.3 for contact between aluminium and aluminium, μ a f = 0.4834 for aluminium and foam, and μ a c = 0.3284 for interactions between aluminium and cork. The coefficients μ a f and μ a c were obtained experimentally from tilt tests. Foam and cork samples with an additional mass on top were placed on an aluminium surface, which was tilted until the samples slid.
The finite element analyses simulated the axial crushing of the thin-walled tubes between two rigid plates. The lower plate was perfectly fixed and the upper plate was accelerated smoothly in the initial 10% of the simulation to ensure quasi-static conditions. Simulations were run to a crushing length of 70% of the component’s length to prevent densification.
In order to validate the numerical model, the axial crushing of a hollow circular extrusion with a diameter of 130 mm and a thickness of 1.9 mm was modelled and compared to the experimental results in [29]. The agreement between experiments and simulations is seen in the force-displacement and average force-displacement curves, Figure 7a,b.

4.2. Analytical Study Using Hanssen’S Interaction Formula

For the study of the interaction effect and the fitting of Equation (1), four samplings were run using a Latin hypercube sampling strategy [44] to characterise the behaviour of both cross-sections with foam and cork cores. The number of simulations was set to 80 for cork-filled specimens and 120 for those filled with foam, as its density was variable. Once the results from the sampling were obtained, the parameters from Equation (1) were fitted to the data. The values of the parameters were bounded as 0 α 1 and 0 β 2 so that no negative exponents appeared in the interaction term from 1.
Two additional 13-simulation samplings covering the design space in Table 1 were used to estimate the mean crushing force of the empty extrusions F avg 0 included in Equation (1). The empirical expression for the average crushing force of empty circular tubes proposed by Guillow et al. [45] was fitted to the simulation results by identifying the best-fitting parameters, giving
F avg 0 = 63.39 ( D / t ) 0.35 M 0 ,
where M 0 is the fully plastic bending moment per unit length, defined as M 0 = σ y t 2 / 4 . The yield stress of the aluminium alloy σ y is taken as the average of the initial yield stress and the ultimate tensile strength, thus σ y = 221.55 MPa.
A similar procedure was followed for the square tube, using the empirical formula from Abramowicz and Jones [46] as a baseline and adjusting its parameters to match the results from the simulations. The resulting expression reads
F avg 0 = 56.15 ( C / t ) 0.33 M 0 .
The plateau stress σ r of the reinforcing materials was also required for Equation (1), which was estimated for this case as the average engineering stress up to a compressive engineering strain of 70%. This gave σ r = 2.13 MPa for the cork and σ r = 2.38 MPa for the foam.
The values of the parameters after fitting Equation (1) to the simulation results were presented in Table 5. The fitness of the adjustments was assessed by calculating the root-mean-squared error (RMSE) and the R 2 between the sampling values and the proposed formulas, delivering an acceptable agreement with R 2 0.975 for all scenarios. The results showed that C avg took lower values for the circular cross-sections than for the square cross-sections, while the parameters α are β were higher in the circular cross-sections. Higher values of α indicate that the strength of the filler is more relevant for the interaction than that of the extrusion, while a higher β implies that the perimeter of the cross-section is more relevant than the wall thickness.
For the foam-filled circular component and the cork-filled square, illustrations of the sampling data points were presented in Figure 8 and Figure 9, respectively. The figures also show the fit of Equation (1), and the interaction term from the equation. A comparison between both graphs reveals the higher energy absorption potential of the circular component, although the contribution from the interaction term in the case of the square specimen was noticeably larger, as shown in Table 5. Moreover, the sampling data in Figure 9 has a higher dispersion than in the case of the cork. This was caused by the use of sampling data with variable foam density, while the plotted surfaces could not take all three variables into account. To assess whether the fit of Equation (1) complied with the data, the surfaces presented in Figure 9 correspond with foam densities of 80 kg/m 3 and 200 kg/m 3 , which encompassed the sampling points.

4.3. Energy Assessment

The energy dissipation per unit volume for each material was also retrieved from the simulations. For that, the energy dissipation per unit volume was calculated for both materials for each of the samples by obtaining the energy dissipated by each material and its volume. The sum of these values was divided by the number of samples, obtaining the average value for the sampling. This was compared to the values that would have been obtained if the tubes and the reinforcements were crushed separately. In the case of foam-filled extrusions, the difference in plateau stress depending on the foam density was taken into account for the calculations. The results are presented in Table 6. Both the tubes and cores showed higher values of energy dissipation per unit volume as a consequence of being crushed together, although this increase varied depending on the component. The highest gains were found for the foam-filled square extrusion, with over 55% more energy dissipation per unit volume for both parts.
The effect of the thickness and outer dimensions of the tubes on the increase in energy dissipation per unit volume for the extrusions was also studied. The surfaces in Figure 10 were adjusted to the data from the foam-filled circular tube, showing that a higher percentage of energy dissipation per unit volume is gained with thinner tube walls. Moreover, Figure 10 illustrates how the main contribution to this increase stemmed from the aluminium extrusion, although friction also provided a small increase in energy dissipation by the component. The contribution from friction to the energy dissipation was found to increase slightly with higher-density foams.
The interaction in circular tubes with cork cores was affected by thickness as with foam cores, although the overall gain in energy dissipation was smaller. Moreover, Figure 11 shows that thinner walls also led to a larger increase in energy dissipation per unit volume when the diameter was reduced. The contribution from friction to the energy dissipation was found to increase as wall thickness was reduced.
A similar study on energy dissipation and its relation with side length, wall thickness, and foam density was performed for the square tube. Figure 12 showed that the thickness had the strongest effect on the increase in energy dissipation of the full component. It can also be hinted that the use of higher-density foams provided a slight improvement in energy dissipation in specimens with thick tube walls due to a higher contribution from friction. Moreover, Figure 13 shows that energy dissipation of the components also increased as side length was reduced, rooted in the higher contribution from friction and the aluminium extrusion.

4.4. Failure and Folding Modes

Changes in the filling materials lead to different deformation modes. In some cases, the combination of a strong core and thin walls may lead to fracture in the aluminium tubes. To further assess how the different reinforcements could generate cracks in the aluminium extrusions, the percentage of integration points that failed during the simulations was also computed. Results were obtained from the inner, middle, and outer section points of each shell element in the aluminium walls. The results summarised in Table 7 showed a higher percentage of fracture for the square components, which can be explained by the characteristics of its collapse mechanism as corners are more prone to higher membrane deformations and, consequently, fracture. The percentage of failed integration points is around 3% higher than that of the circular tubes.
The bending-to-membrane indicator Ω from Equation (7) was also studied, with circular tubes taking a slightly higher fraction of the bending component than the square extrusions, which can be attributed again to the difference in the collapse mechanism of the tube. A small increase in Ω was also found when using foam instead of cork.

5. Discussion

The results presented in Table 5 are related to the differences in the crushing modes observed for different cross-section geometries. In order to shed some light upon this, a closer look was taken at the different values obtained for α and β . The α parameter reached values close to its upper bound for the circular tube showing that the increment in energy dissipation was favoured by higher foam densities and, consequently, a higher plateau stress of the foam. Stronger foams exerted a stiffer constraint on the tube’s fold formation, which in turn led to more and shorter folds giving a higher energy dissipation per unit volume. This effect is illustrated in Figure 14, where the empty tube developed four folds in concertina mode and then transitioned to a diamond mode. However, with a reinforced specimen as that from Figure 14b, the core made the tube collapse solely in concertina mode, developing ten full concertina folds in the same crushing distance, thus dissipating more energy per unit volume.
A different behaviour was found in the square extrusions, with α and β being closer to their lower bounds. This suggested a stronger contribution from the extrusion material properties and wall thickness to the increase of the energy dissipation increase from the interaction term. Table 6 showed how the main energy gains within the Hanssen interaction term arose from the folding of the aluminium extrusions, responsible for over 29% of this improvement. This was caused by a significant decrease in fold length during the collapse process due to the constraining core, as shown in Figure 15a–c. Since a higher number of folds were produced, more energy was dissipated through bending of the aluminium walls as shown by the values of Ω 0.8 in Table 7. As with the circular tube, wall thickness directly influenced the energy dissipation from the full component, although the effect was noticeably larger as shown in Figure 12. This behaviour might stem from the difference in constraining force required to shorten the length of the folds, a key contributor to higher energy dissipation. Fold formation in tubes with thinner walls was more constrained by the existence of a core than with thicker walls, as less force was required from the reinforcement to reduce the fold length.
Regarding the difference in the interaction effect from using either reinforcing material, it was seen that foam-filled components obtained higher energy dissipation gains for the full component than those filled with cork. Moreover, Figure 16a,b shows a cut view of the deformed square components filled with foam and cork, with a clear difference in the collapse mechanism between both configurations. This discrepancy was attributed to the hyperelastic behaviour of the cork, which makes the material much more prone to buckling than the plastic behaviour of the foam. Global buckling of the cork core was found in some components with large cross-sections and thin tube walls as that from Figure 16b, which led to lower values of energy dissipation per unit volume of the cork than in uniaxial compression. This finding could also explain the higher values of Ω for the aluminium extrusions when filled with foam found in Table 7, as the use of foam led to the formation of more folds and, consequently, more energy dissipated through bending. The foam cores did not experience buckling within the tube regardless of foam density or cross-section, as elastic deformation for the foam was significantly lower than plastic deformation during its crushing.
In summary, it was found that when seeking an improved exploitation of the energy dissipation capacity of filled tubes, low thickness values and foams with high densities yielded higher energy dissipation gains regardless of the tube’s geometry. In the case of circular specimens, reducing the diameter of the extrusion also led to increased energy dissipation, while varying cross-section dimensions was of little effect in square sections. Although empty circular cross-sections yielded higher specific energy absorption values than square tubes with equal perimeter, it was found that square extrusions delivered higher values of energy dissipation per unit volume than circular tubes when both were filled with foam. Moreover, the PET foam constituted a more compliant filler than cork when pursuing improved energy dissipation from the full components, since foam yielded similar or higher energy dissipation gains and was not affected by buckling as within the square tube.

6. Conclusions

This work investigated the magnitude and origin of the increased energy dissipation exhibited by thin-walled extrusions reinforced with cellular materials. The following conclusions were drawn:
  • The axial quasi-static crushing of filled circular and square thin-walled extrusions with different cross-section dimensions and thicknesses was successfully simulated using a validated numerical model. The results from the simulations were used to adjust an empirical formula to accurately predict the average crushing force of the components within the studied design space, accounting for the interaction effect.
  • The values of the parameters from the adjusted Hanssen formula showed that a strong interaction effect exists in the axial crushing of foam- and cork-filled specimens. Higher energy dissipation gains were obtained with the square foam-filled cross-sections, whose constrained collapse yielded an average increase of 55% in the energy dissipation of the full component.
  • The values for α and β for circular tubes indicated a high contribution from the strength of the core material and the cross-section perimeter to the increase in energy dissipation per unit volume. Foams with higher densities exerted a stronger constraint on the tube fold length thus dissipating more energy through bending.
  • Square components showed the highest increase in energy dissipation from the interaction between both materials. The side length had no clear effect on the increase in energy dissipation by the full component, although the interaction effect was increased with thinner tube walls as shown by the low values of β . As with circular tubes, higher density foams favoured a stronger interaction effect. Cork cores experienced buckling in square components with low thickness and long sides, which led to smaller gains in the energy dissipation by the component.

Author Contributions

J.P., M.C., L.R., and J.D. (Jacobo Díaz), Conceptualization; J.P., M.C., and J.D. (Jordi Delgado), Investigation; J.P. and M.C., Methodology; J.P. and M.C., Writing—original draft; J.P., M.C., L.R., and J.D. (Jacobo Díaz), Writing—review & editing. All authors have read and agreed to the published version of the manuscript.

Funding

This research was funded by the Spanish Goverment (Ministerio de Economía y Competitividad) grant number PID2019-108307RB-I00; and from the Research Council of Norway grant number 237885, SFI-CASA, and NTNU.

Acknowledgments

The research leading to these results has received funding from the Spanish Goverment (Ministerio de Economía y Competitividad) under grant agreement PID2019-108307RB-I00, and from the Centre for Advanced Structural Analysis, SFI-CASA (Project No. 237885), funded by the Research Council of Norway and NTNU. The help of B. Gómez and E. Grande with the laboratory work is also acknowledged.

Conflicts of Interest

The authors declare no conflict of interest.

References

  1. Alexander, J.M. An approximate analysis of the collapse of thin cylindrical shells under axial loading. Q. J. Mech. Appl. Math. 1960, 13, 10–15. [Google Scholar] [CrossRef]
  2. Sadeghi, M.M. Design of heavy duty energy absorbers. Struct. Impact Crashworthiness 1984, 2, 588–604. [Google Scholar]
  3. Alghamdi, A.A.A. Collapsible impact energy absorbers: An overview. Thin Walled Struct. 2001, 39, 189–213. [Google Scholar] [CrossRef]
  4. White, M.D.; Jones, N. Experimental quasi-static axial crushing of top-hat and double-hat thin-walled sections. Int. J. Mech. Sci. 1999, 41, 179–208. [Google Scholar] [CrossRef]
  5. Marsolek, J.; Reimerdes, H.G. Energy absorption of metallic cylindrical shells with induced non-axisymmetric folding patterns. Int. J. Impact Eng. 2004, 30, 1209–1223. [Google Scholar] [CrossRef]
  6. Paz, J.; Díaz, J.; Romera, L.; Teixeira-Dias, F. Crashworthiness study on hybrid energy absorbers as vertical struts in civil aircraft fuselage designs. Int. J. Crashworthiness 2020, 25, 430–446. [Google Scholar]
  7. Bisagni, C. Crashworthiness of helicopter subfloor structures. Int. J. Impact Eng. 2002, 27, 1067–1082. [Google Scholar] [CrossRef]
  8. Wierzbicki, T.; Abramowicz, W. On the crushing mechanics of thin-walled structures. J. Appl. Mech. 1983, 50, 727–734. [Google Scholar] [CrossRef]
  9. Abramowicz, W.; Wierzbicki, T. Axial crushing of multicorner sheet metal columns. J. Appl. Mech. 1989, 56, 113–120. [Google Scholar] [CrossRef]
  10. Abramowicz, W.; Jones, N. Dynamic progressive buckling of circular and square tubes. Int. J. Impact Eng. 1986, 4, 243–270. [Google Scholar] [CrossRef]
  11. Sun, G.; Li, G.; Stone, M.; Li, Q. A two-stage multi-fidelity optimization procedure for honeycomb-type cellular materials. Comput. Mater. Sci. 2010, 49, 500–511. [Google Scholar] [CrossRef]
  12. Saito, H.; Kimpara, I. Evaluation of impact damage mechanism of multi-axial stitched CFRP laminate. Compos. Part A Appl. Sci. Manuf. 2006, 37, 2226–2235. [Google Scholar] [CrossRef]
  13. Coelho, R.; de Sousa, R.A.; Fernandes, F.; Teixeira-Dias, F. New composite liners for energy absorption purposes. Mater. Des. 2013, 43, 384–392. [Google Scholar] [CrossRef]
  14. Paulino, M.; Teixeira-Dias, F.; Gameiro, C.P.; Cirne, J. Hyperelastic and dynamical behaviour of cork and its performance in energy absorption devices and crashworthiness applications. Int. J. Mater. Eng. Innov. 2009, 1, 197–234. [Google Scholar] [CrossRef]
  15. Reddy, T.Y.; Al-Hassani, S.T.S. Axial crushing of wood-filled square metal tubes. Int. J. Mech. Sci. 1993, 35, 231–246. [Google Scholar] [CrossRef]
  16. Paz, J.; Romera, L.; Díaz, J. Crashworthiness optimization of aircraft hybrid energy absorbers enclosing honeycomb and foam structures. AIAA J. 2017, 55, 652–661. [Google Scholar] [CrossRef] [Green Version]
  17. Cui, L.; Kiernan, S.; Gilchrist, M.D. Designing the energy absorption capacity of functionally graded foam materials. Mater. Sci. Eng. A 2009, 507, 215–225. [Google Scholar] [CrossRef]
  18. Vestrum, O.; Dæhli, L.E.B.; Hopperstad, O.S.; Børvik, T. Constitutive modeling of a graded porous polymer based on X-ray computed tomography. Mater. Des. 2020, 188, 108449. [Google Scholar] [CrossRef]
  19. Vestrum, O.; Langseth, M.; Børvik, T. Finite element modeling of porous polymer pipeline coating using X-ray micro computed tomography. Compos. Part B Eng. 2019, 172, 406–415. [Google Scholar] [CrossRef]
  20. Mamalis, A.G.; Manolakos, D.E.; Ioannidis, M.B.; Chronopoulos, D.G.; Kostazos, P.K. On the crashworthiness of composite rectangular thin-walled tubes internally reinforced with aluminium or polymeric foams: Experimental and numerical simulation. Compos. Struct. 2009, 89, 416–423. [Google Scholar] [CrossRef]
  21. Hanssen, A.G.; Langseth, M.; Hopperstad, O.S. Static crushing of square aluminium extrusions with aluminium foam filler. Int. J. Mech. Sci. 1999, 41, 967–993. [Google Scholar] [CrossRef]
  22. Hanssen, A.G.; Langseth, M.; Hopperstad, O.S. Static and dynamic crushing of square aluminium extrusions with aluminium foam filler. Int. J. Impact Eng. 2000, 24, 347–383. [Google Scholar] [CrossRef]
  23. Santosa, S.; Wierzbicki, T. Crash behavior of box columns filled with aluminum honeycomb or foam. Comput. Struct. 1998, 68, 343–367. [Google Scholar] [CrossRef] [Green Version]
  24. Toksoy, A.K.; Güden, M. The strengthening effect of polystyrene foam filling in aluminum thin-walled cylindrical tubes. Thin-Walled Struct. 2005, 43, 333–350. [Google Scholar] [CrossRef] [Green Version]
  25. Toksoy, A.K.; Güden, M. Partial Al foam filling of commercial 1050H14 Al crash boxes: The effect of box column thickness and foam relative density on energy absorption. Thin-Walled Struct. 2010, 48, 482–494. [Google Scholar] [CrossRef] [Green Version]
  26. Reyes, A.; Børvik, T. Quasi-static behaviour of crash components with steel skins and polymer foam cores. Mater. Today Commun. 2018, 17, 541–553. [Google Scholar] [CrossRef]
  27. Kavi, H.; Toksoy, A.K.; Guden, M. Predicting energy absorption in a foam-filled thin-walled aluminum tube based on experimentally determined strengthening coefficient. Mater. Des. 2006, 27, 263–269. [Google Scholar] [CrossRef] [Green Version]
  28. Hanssen, A.G.; Langseth, M.; Hopperstad, O.S. Static and dynamic crushing of circular aluminium extrusions with aluminium foam filler. Int. J. Impact Eng. 2000, 24, 475–507. [Google Scholar] [CrossRef]
  29. Costas, M.; Morin, D.; Langseth, M.; Romera, L.; Díaz, J. Axial crushing of aluminum extrusions filled with PET foam and GFRP. An experimental investigation. Thin-Walled Struct. 2016, 99, 45–57. [Google Scholar] [CrossRef] [Green Version]
  30. Fagerholt, E.; Børvik, T.; Hopperstad, O.S. Measuring discontinuous displacement fields in cracked specimens using digital image correlation with mesh adaptation and crack-path optimization. Opt. Lasers Eng. 2013, 51, 299–310. [Google Scholar] [CrossRef]
  31. Costas, M.; Morin, D.; Langseth, M.; Díaz, J.; Romera, L. Static crushing of aluminium tubes filled with PET foam and a GFRP skeleton. Numerical modelling and multiobjective optimization. Int. J. Mech. Sci. 2017, 131–132, 205–217. [Google Scholar] [CrossRef] [Green Version]
  32. ABAQUS 2019 Documentation; Simulia: Providence Road, RI, USA, 2018.
  33. LS-OPT User’s Manual, Version 5.2; Livermore Software Technology Corporation: Livermore, CA, USA, 2015.
  34. Cockcroft, M.G.; Latham, D.J. Ductility and the Workability of Metals. J. Inst. Met. 1968, 96, 33–39. [Google Scholar]
  35. Costas, M.; Morin, D.; Hopperstad, O.S.; Børvik, T.; Langseth, M. A through-thickness damage regularisation scheme for shell elements subjected to severe bending and membrane deformations. J. Mech. Phys. Solids 2019, 123, 190–206. [Google Scholar] [CrossRef]
  36. Kristoffersen, M.; Costas, M.; Koenis, T.; Brøtan, V.; Paulsen, C.O.; Børvik, T. On the ballistic perforation resistance of additive manufactured AlSi10Mg aluminium plates. Int. J. Impact Eng. 2020, 137, 103476. [Google Scholar] [CrossRef]
  37. Costas, M.; Morin, D.; de Lucio, M.; Langseth, M. Testing and simulation of additively manufactured AlSi10Mg components under quasi-static loading. Eur. J. Mech. A/Solids 2020, 81, 103966. [Google Scholar] [CrossRef]
  38. Andersen, R.G.; Londono, J.G.; Woelke, P.B.; Nielsen, K.L. Fundamental differences between plane strain bending and far-field plane strain tension in ductile plate failure. J. Mech. Phys. Solids 2020, 141, 103960. [Google Scholar] [CrossRef]
  39. Hill, R. Aspects of Invariance in Solid Mechanics. In Advances in Applied Mechanics; Elsevier: Amsterdam, The Netherlands, 1979; Volume 18, pp. 1–75. [Google Scholar]
  40. Storåkers, B. On material representation and constitutive branching in finite compressible elasticity. J. Mech. Phys. Solids 1986, 34, 125–145. [Google Scholar] [CrossRef]
  41. Fernandes, F.A.O.; Pascoal, R.J.S.; Alves de Sousa, R.J. Modelling impact response of agglomerated cork. Mater. Des. 2014, 58, 499–507. [Google Scholar] [CrossRef]
  42. Deshpande, V.S.; Fleck, N.A. Isotropic constitutive models for metallic foams. J. Mech. Phys. Solids 2000, 48, 1253–1283. [Google Scholar] [CrossRef] [Green Version]
  43. ABAQUS 2017 Documentation; Simulia: Providence Road, RI, USA, 2016.
  44. McKay, M.; Beckman, R.; Conover, W. A comparison of three methods for selecting values of input variables in the analysis of output from a computer code. Technometrics 1979, 21, 239–245. [Google Scholar]
  45. Guillow, S.R.; Lu, G.; Grzebieta, R.H. Quasi-static axial compression of thin-walled circular aluminium tubes. Int. J. Mech. Sci. 2001, 43, 2103–2123. [Google Scholar] [CrossRef]
  46. Abramowicz, W.; Jones, N. Dynamic axial crushing of square tubes. Int. J. Impact Eng. 1984, 2, 179–208. [Google Scholar] [CrossRef]
Figure 1. Conceptual illustration of the interaction effect in the force-displacement curves of axially crushed tubes with foam filler.
Applsci 10 08510 g001
Figure 2. Dimensions of the studied components, given in millimetres.
Applsci 10 08510 g002
Figure 3. Dimensions of the aluminium tensile specimens machined from the tubes, in millimetres, adapted from [29] (a), and engineering stress-strain curves of the representative experiment and the inverse model (b).
Applsci 10 08510 g003
Figure 4. Experimental set-up used in the compression tests of cork (a) and different fits of Equation (13) to a representative experimental test for different number of terms N (b).
Applsci 10 08510 g004
Figure 5. Scanning electron microscopy images of the cork agglomerate and the PET with density 135 kg/m 3 foam at different magnification levels. The arrows in subfigures (c,d) indicate the extrusion direction of the foam.
Applsci 10 08510 g005
Figure 6. True stress-strain curves from a uniaxial compression test and simulation for Armaform PET/W AC 135 foam in the extrusion direction. Adapted from [31].
Applsci 10 08510 g006
Figure 7. Force-displacement curves for an empty circular tube with D = 130 mm and t = 1.9 mm. Experimental and numerical results.
Applsci 10 08510 g007
Figure 8. Sampling data points, fitted Hanssen interaction formula, and Hanssen interaction term for the cork-filled square tube tube.
Applsci 10 08510 g008
Figure 9. Sampling data points, fitted Hanssen interaction formula, and Hanssen interaction term for the foam-filled circular tube with a foam density of 80 kg/m 3 and 200 kg/m 3 .
Applsci 10 08510 g009
Figure 10. Increase of energy dissipation of the full component versus thickness and diameter, and contribution from the aluminium extrusion and friction for the foam-filled circular tube. Sampling data and interpolated surfaces.
Applsci 10 08510 g010
Figure 11. Increase of energy dissipation of the full component versus thickness and diameter, and contribution from the aluminium extrusion and friction for the cork-filled circular tube. Sampling data and interpolated surfaces.
Applsci 10 08510 g011
Figure 12. Increase of energy dissipation of the full component versus thickness and foam density, and contribution from the aluminium extrusion and friction for the foam-filled square tube. Sampling data and interpolated surfaces.
Applsci 10 08510 g012
Figure 13. Increase of energy dissipation of the full component versus thickness and side length, and contribution from the aluminium extrusion and friction for the cork-filled square tube. Sampling data and interpolated surfaces.
Applsci 10 08510 g013
Figure 14. Deformation comparison between empty and foam-filled circular tubes ( D = 130 mm, t = 1.9 mm, foam density = 135 kg/m 3 ).
Applsci 10 08510 g014
Figure 15. Deformation comparison between empty and foam-filled square tubes ( C = 102 mm, t = 2 mm, foam density = 135 kg/m 3 ).
Applsci 10 08510 g015
Figure 16. Deformation comparison between foam-filled and cork filled square tubes ( C = 115 mm, t = 1.5 mm, foam density = 200 kg/m 3 ).
Applsci 10 08510 g016
Table 1. Lower and upper bounds for the design parameters of the circular and square tubes.
Cross-SectionDimensionLower BoundUpper Bound
CircularDiameter (D)110 mm150 mm
Wall thickness (t)1.0 mm3.0 mm
SquareSide (C)86.5 mm118 mm
Wall thickness (t)1.0 mm3.0 mm
Table 2. Initial yield stress, work-hardening and failure parameters of the calibrated constitutive model for the AA6063-T5 aluminium extrusion. All quantities are given in megapascals except c, which is dimensionless.
σ 0 Q 1 θ 1 Q 2 θ 2 Q 3 θ 3 W c b W c s W c l c
205.13.421206057.9912152.7892.27146.4374.4432.810.93
Table 3. Hyperelastic parameters for Corecork NL25 identified from uniaxial compression tests.
N μ 1 [MPa] α 1 β 1 μ 2 [MPa] α 2 β 2
23.0679.2760.1250.001−6.0920.125
Table 4. Material properties and model parameters of ArmaFORM PET/W AC 135 PET-based foam in the extrusion and transverse directions. An asterisk indicates that the value was obtained assuming the same α coefficient obtained for the transverse direction of the foam. Only the extrusion direction is considered in the present work. Adapted from [31].
Property or ParameterTransverse DirectionExtrusion Direction
Density, ρ [ t / m 3 ]0.1350.135
Young’s modulus, E [MPa]20.4159.01
Elastic Poisson ratio, ν 0.10.1
  σ 0.3 C [kPa]982.982529.97
σ 0.3 H [kPa]1383.30* 3465.71
α 0.73* 0.73
Plastic Poisson’s ratio ν p 0.090.07
β 1.841.72
Table 5. Parameters and fitness of Equation (1) for the reinforced tubes.
Cross-SectionCore C avg α β RMSE (kN) R 2
CircularCork0.4440.9682.0002.1690.997
Foam1.1550.9991.8695.1630.993
SquareCork5.0200.2330.8334.1900.975
Foam2.1880.2721.0984.9190.991
Table 6. Average energy dissipation per unit volume for the aluminium extrusions and filling materials. All values in J/cm 3 .
Tube Filling
Cross-SectionCoreOriginalSimulationOriginalSimulation
CircularCork50.13455.971 (+11.62%)1.6331.844 (+12.92%)
Foam50.74754.986 (+8.35%)1.7492.331 (+33.28%)
SquareCork39.34750.957 (+29.51%)1.4911.703 (+14.22%)
Foam38.77460.230 (+55.33%)1.7932.788 (+55.49%)
Table 7. Percentage of failed integration points and average element bending-to-membrane loading ratio. Average value and standard deviation.
Cross-SectionCoreIntegration Point Failure (%)Bending-to-Membrane Loading Ratio, Ω
CircularCork5.270 ± 1.8400.794 ± 0.035
Foam4.214 ± 2.0200.885 ± 0.023
SquareCork8.215 ± 2.3380.777 ± 0.027
Foam5.161 ± 1.9670.812 ± 0.011
Publisher’s Note: MDPI stays neutral with regard to jurisdictional claims in published maps and institutional affiliations.

